affective development from late childhood to late
TRANSCRIPT
AFFECTIVE DEVELOPMENT FROM LATE CHILDHOOD TO LATE ADOLESCENCE: TRAJECTORIES OF MEAN-LEVEL CHANGE IN NEGATIVE AND POSITIVE AFFECT
BY
JULIANNE MARIE GRIFFITH
THESIS
Submitted in partial fulfillment of the requirements for the degree of Master of Science in Psychology
in the Graduate College of the University of Illinois at Urbana-Champaign, 2018
Urbana, Illinois Adviser: Professor Benjamin L. Hankin
ii
ABSTRACT
Negative and positive emotions comprise basic elements of human experience and are
associated with outcomes across a range of domains, spanning physical and emotional health,
behavioral functioning, and psychological wellbeing. The present study used latent growth curve
modeling (LGCM) to map trajectories of subjective mean-level negative (NA) and positive affect
(PA) from late childhood to late adolescence in a sample of 652 community youth age 10 to 18
years (56.4% female) recruited in 3rd, 6th, and 9th grade cohorts. Youth affect was assessed
repeatedly via self-report over three years in an accelerated longitudinal cohort design (6 total
assessment points). Results of LGCM analyses indicate that adolescence is characterized by
declines in PA and increases in NA, with girls experiencing greater mean-level NA than boys
beginning in grade 6. Findings contribute foundational descriptive information, illustrating
normative trajectories of mean-level affect across a critical period of human development.

iii
TABLE OF CONTENTS
CHAPTER 1: INTRODUCTION .................................................................................... 1
CHAPTER 2: METHOD ................................................................................................ 5
CHAPTER 3: RESULTS ................................................................................................ 7
CHAPTER 4: DISCUSSION ........................................................................................ 12
CHAPTER 5: TABLES ................................................................................................ 16
CHAPTER 6: FIGURES ............................................................................................... 20
REFERENCES ............................................................................................................. 23
APPENDIX A: SUPPLEMENTARY TABLES ............................................................ 29

1
CHAPTER 1: INTRODUCTION
Emotions comprise a fundamental aspect of human experience, with implications for
such diverse aspects of functioning as cognition, motivation, and achievement (see Ekman &
Davidson, 1994). Despite emotion’s integral role in shaping psychological outcomes across the
lifespan, limited research has explored developmental trajectories of emotional experience,
particularly as they unfold across earlier periods in the life course. The transition from late
childhood through adolescence has sometimes been characterized as a period of emotional
tumult (i.e., “storm and stress”), although the extent to which most youth experience such
negativity has been contested (e.g., Hollenstein & Lougheed, 2013). Moreover, this
developmental period features opportunities for youth to establish enduring patterns of
behavioral and emotional functioning. Adolescence may represent an important foundational
period for the development of long-term health and wellbeing (Sawyer et al., 2012), as well as a
period of heightened susceptibility to aberrant affective functioning (Kann et al., 2014;
Merikangas et al., 2010). Given the recognized importance of emotional experience, it is
surprising that the field lacks basic knowledge regarding the descriptive patterning of youths’
trait affective experience. Research is needed to examine developmental trajectories of mean-
level change in positive affect (PA) and negative affect (NA) from late childhood to late
adolescence. Elucidating normative patterns of mean-level change in adolescent affective
experience is essential to clarifying core mood processes typifying emotional development.
Trait affect reflects relatively enduring tendencies toward the experience of
certain emotion states (e.g., fearfulness, joy, exuberance). Structural models of emotion organize
these discrete experiences into two higher order factors: negative affect (NA) and positive affect
2
(PA; Watson, 2000). NA, reflecting the experience of such emotions as fear, guilt, and sadness,
demonstrates relationships with outcomes including health complaints (Pressman, Gallagher, &
Lopez, 2013), substance abuse (Baker, Piper, McCarthy, Majeskie, & Fiore, 2004), and eating
pathology (Stice, 2001). PA, reflecting the experience of such emotions as cheerfulness, interest,
and self-assuredness, has been found to facilitate effective coping and recovery from stress
(Tugade & Fredrickson, 2004), as well as potentiate processes of wellbeing, including resilience
(Cohn, Fredrickson, Brown, Mikels, & Conway, 2009), interpersonal closeness (Ramsey &
Gentzler, 2015) and physical health (Dockray & Steptoe, 2010; see Lyubomirsky, King, &
Diener, 2005 for review).
Some limited research has illustrated how NA and PA may develop over the
childhood years. Specifically, research indicates linear change in PA and NA from late infancy to
middle childhood; in a longitudinal design, Olino et al. (2011) observed increases in PA and
decreases in NA among children followed from late infancy to age nine. Research is needed,
however, to extend knowledge of developmental trajectories beyond age nine and into
adolescence. Such research may facilitate identification of key leverage points in development to
promote affective health and positive adaptation.
Some limited inferences regarding normative patterns of trait affect in adolescence can be
drawn from studies examining related constructs. Trajectories of personality development during
this developmental stage show patterns of mean-level change in neuroticism and extraversion,
which are related to the experience of NA and PA, respectively (Watson, 2000). In a large, cross-
sectional study of mean-level personality trait development across the lifespan, Soto, John,
Gosling, and Potter (2011) found positive trends in neuroticism (suggesting increasing NA) and
negative trends in extraversion (suggesting decreasing PA) between ages 10 and 17. In a

3
longitudinal study of personality development from age 12 to 22, Borghuis et al. (2017) observed
quadratic growth in extraversion and neuroticism, such that these traits demonstrated “U” (in the
case of extraversion) and inverted “U” (in the case of neuroticism) shaped trajectories. While
there were no gender differences in extraversion, curvilinear growth in neuroticism was observed
among girls only; among boys, neuroticism remained stable (Borghuis et al., 2017). It is
important to note, however, that personality traits are not isomorphic with youths’ affective
experiences; personality traits comprise cognitive and behavioral tendencies in addition to trait
emotion (Caspi, 1998).
These personality trait development findings are consistent with experience sampling
method (ESM) research assessing trends in state affect across adolescence. Relative to trait
affect, which reflects relatively enduring individual differences in emotionality, state affect
captures more transient emotional experience, reflecting fluctuating “streams of affect” (Watson,
2000). ESM research indicates declines in global mood (Larson & Lampman-Petraitis, 1989;
Larson, Moneta, Richards, & Wilson, 2002), and reductions in PA, specifically (Weinstein,
Mermelstein, Hankin, Hedeker, & Flay, 2007) during adolescence. Further, both the ESM and
personality literatures find gender differences in development across adolescence. Specifically,
boys demonstrate steeper declines in PA/extraversion, and girls report more marked increases in
NA/neuroticism (Soto et al, 2011; Weinstein et al, 2007).
This extant literature informs hypotheses regarding potential NA and PA trajectories
spanning late childhood to late adolescence; however, constructs assessed in personality and
ESM research are conceptually distinct from trait affect, and developmental trends in trait affect
across adolescence remain unknown. Longitudinal research is needed to build upon these

4
findings by examining developmental trends in trait NA and PA from late childhood through
adolescence, and to assess moderation by gender.
The Present Study
The present study investigated developmental trajectories of PA and NA using
longitudinal, repeated measures of trait affect among 652 community youth recruited through the
Gene, Environment, and Mood (GEM) Study (see Hankin et al., 2015). Youth were recruited in
grades three, six, and nine, and prospectively followed for three years using an accelerated
longitudinal cohort design. NA and PA were assessed every 18 months using the Positive and
Negative Affect Scale for Children (PANAS-C), a well-validated self-report measure of trait
affect (Laurent et al., 1999). As children’s self-report of PANAS-C affect is not optimally
reliable until approximately grade 4 (Laurent et al., 1999; Veronese & Pepe, 2017), the present
study mapped affective trajectories spanning ages 10 to 18. Further, the present study examined
gender differences in affective trajectories across adolescent development.
Given the dearth of research exploring longitudinal trends in mean-level affective change
across adolescence, we did not make a priori hypotheses regarding expected shapes of
developmental growth; however, based on ESM and personality findings, we expected to
observe overall increases in mean-level NA and overall decreases in mean-level PA from late
childhood to late adolescence. We additionally expected a gender difference to emerge around
mid-adolescence, whereby we expected to observe steeper increases in NA among girls and
steeper decreases in PA among boys.
5
CHAPTER 2: METHOD
Participants and Procedures
Participants comprised 652 youth recruited in third (N = 181), sixth (N = 248), and ninth
(N = 223) grade cohorts (age 8-16 at baseline, Mage = 11.95, SDage = 2.36, 56.4% female).
Inclusion criteria included English language fluency, absence of autism or psychotic disorder
diagnosis, and IQ > 70 as assessed via parent report. Sample demographics were approximately
representative of the ethnic and racial characteristics of the United States population (69.0%
White, 11.0% African American, 8.7% Asian/Pacific Islander, 6.0% multi-racial, 5.2% other
racial identity, with 12.3% of the total sample identifying as having a Latinx ethnic identity).
Further details regarding sampling procedures and participant characteristics are described in
Hankin et al. (2015).
Youth were invited to the laboratory to complete a battery of measures every 18 months
for 3 years. Participants completed the PANAS-C at each time point, yielding 3 assessment
points per participant (e.g., baseline [T1], 18 months [T2], and 36 months [T3]). As we articulate
in the measures section, the PANAS-C demonstrates suboptimal psychometric properties among
children prior to the 4th grade; the measure has a relatively advanced reading level, and research
indicates that some affect adjectives may not be well understood by children until grade 4
(Veronese & Pepe, 2017; Laurent et al., 1999). For these reasons, we did not include the first
assessment point for the 3rd grade cohort in the analysis. Thus, six total assessment points of the
PANAS were included in the present analyses, spanning grades 4 through 12 using an
accelerated longitudinal cohort design, thereby facilitating analyses of developmental trajectories
from age 10 to age 18 (see Figure 1). Of the total sample, 85.4% (N = 557) participants

6
completed measures at T2, and 80.4% (N = 524) completed measures at T3; 75.3% (N = 491) of
participants completed measures at all three time points. Participants who completed all time
points were not significantly different from participants that did not complete all time points on
measures of NA or PA at any time point (all ps > .05).
Measures
Demographics. At baseline, participants completed a brief questionnaire assessing basic
demographic information, including child age, gender, racial/ethnic identity, and socioeconomic
status.
Trait Affect: PA and NA. Trait affect was assessed every 18 months using the Positive
and Negative Affect Scale for Children (PANAS-C; Laurent et al., 1999). The PANAS-C is a
reliable and commonly used questionnaire measure assessing youths’ experience of 27 discrete
emotion states (e.g., “interested,” “sad,” “excited”) on a 5-point Likert scale from (1) very
slightly or not at all to (5) extremely. The PA subscale comprises 12 items assessing youths’
experience of such positive emotion states as “cheerful,” “delighted,” and “calm.” The NA
subscale comprises an analogous 15 items assessing youths’ feelings of such emotion states as
“frightened,” “ashamed,” and “upset.” PA and NA subscales of the PANAS-C demonstrate
strong psychometric properties among adolescent samples and evidence good convergent and
discriminant validity in both clinical (Hughes & Kendall, 2009) and community samples
(Laurent et al., 1999). Scale authors suggest that affect adjectives may not be well understood by
children prior to achieving a grade 4 reading level (Laurent et al., 1999). Thus, PANAS-C data
was not included in analyses for participants prior to grade 4.
Overall, PA and NA subscales demonstrated good reliability at all assessment points in
the present sample (a = .86-.89 and .89-.91 for PA and NA, respectively).
7
CHAPTER 3: RESULTS
Preliminary Analyses
Study hypotheses and analytic plan were pre-registered on the Open Science Framework
before data were released for analysis (project link: osf.io/hj96u). Descriptive statistics are
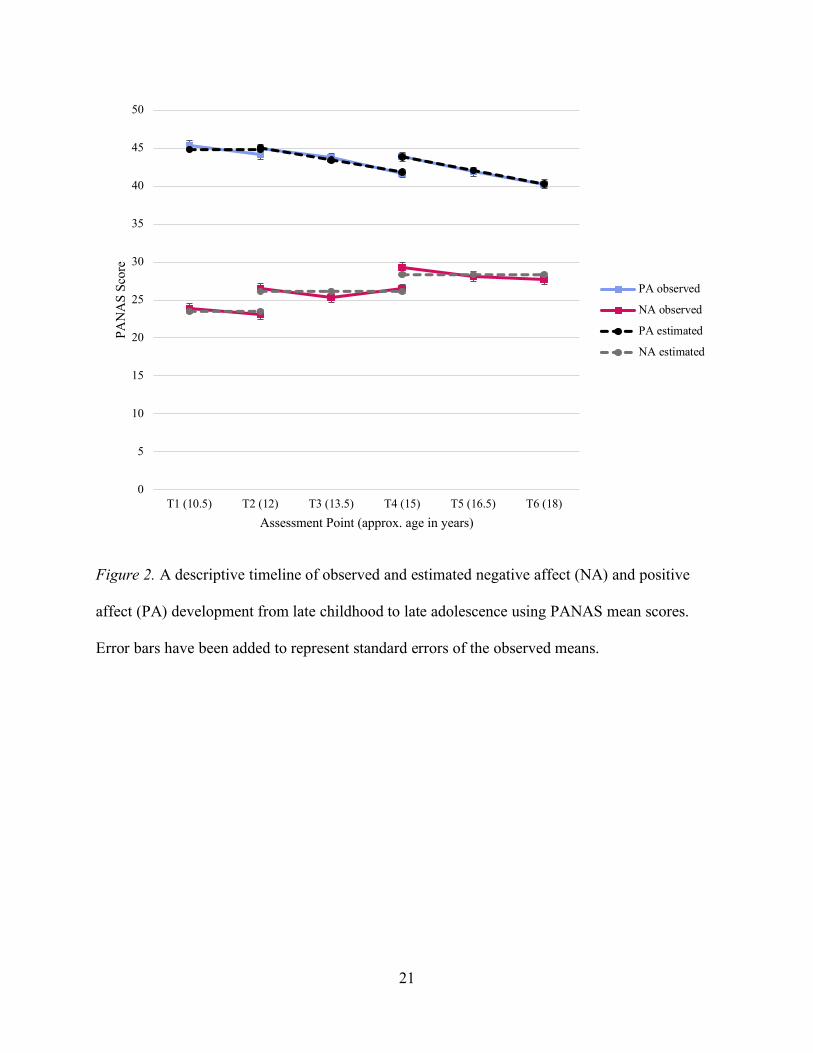
reported in Table 1. In addition, we descriptively plotted the means of PA and NA for each grade
cohort, and across each assessment time point, to illustrate affective developmental trends from
age 10 to 18 for the sample as a whole (Figure 2), as well as separately by gender (Figure 3).
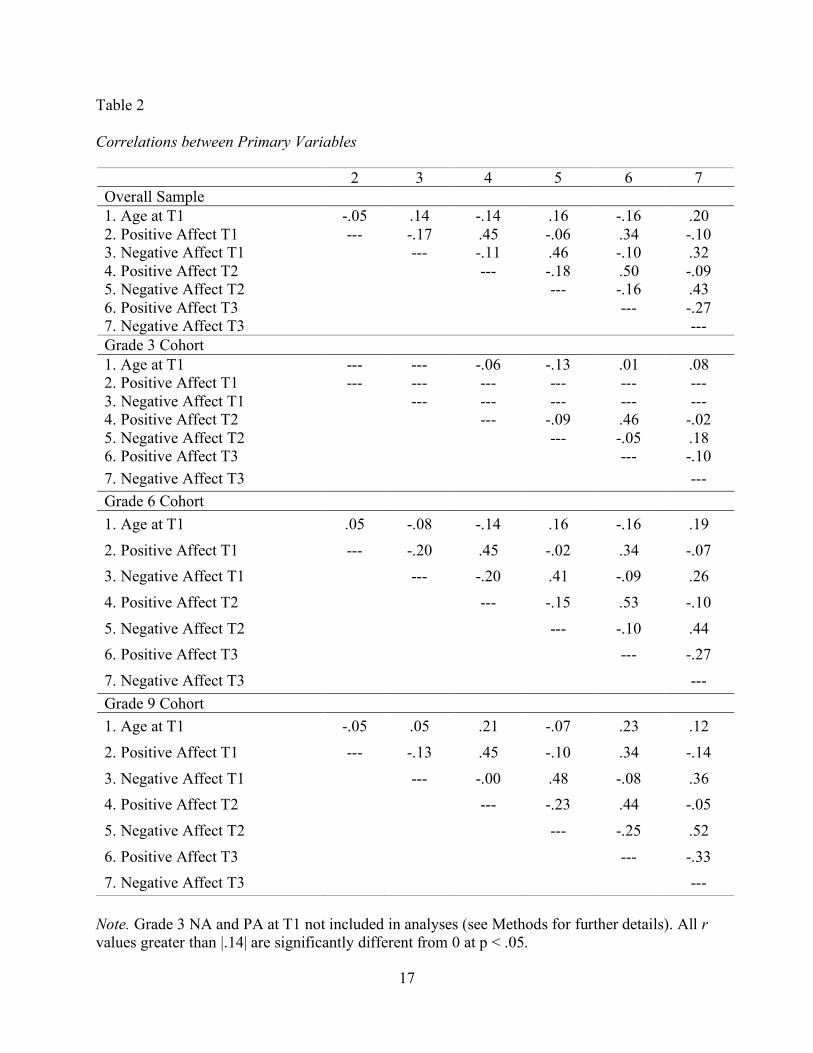
Correlations among primary variables in the overall sample, as well as in each cohort
independently, are described in Table 2. Consistent with prior theory and research (Watson,
2000), in the sample overall, NA and PA were only moderately correlated with one another at
each time point (r = -.17 to -.27). Measures of affect were moderately correlated with themselves
across time (r = .25 to .50). Age at baseline generally correlated negatively with PA and
positively with NA across time points (see Table 1). These preliminary age trends provide initial
evidence for patterns of affective change from late childhood through adolescence.
Prior to primary analyses, Little’s MCAR test was conducted to assess for patterns of
systematic missingness in the data. Results of Little’s test were nonsignificant for all cohorts
(c2(7) = 2.61, p = .919 for grade 3, c2(19) = 22.25, p = .272 for grade 6, c2(16) = 22.58, p = .125
for grade 9), indicating that data were missing completely at random. As described next, the
following analyses more formally evaluated latent growth models for PA and NA.
Latent Growth Curve Modeling (LGCM) Data Analytic Plan
Accelerated longitudinal cohort designs assume that data sampled from adjacent,
overlapping age cohorts over time-limited longitudinal intervals can be linked to approximate a

8
single, continuous growth curve (Duncan, Duncan, & Hops, 1996). Thus, such a design assumes
equivalence of data collected from disparate cohorts at any singular stage of development. To
determine if the accelerated longitudinal cohort design could be validly used to examine
trajectories of mean-level NA and PA from age 10 to 18, analyses were first conducted to
evaluate whether PANAS affect scores differed significantly between cohorts at overlapping
assessment points (see Figure 1). T-tests were conducted to compare 3rd graders’ scores at 36
months and 6th graders’ scores at baseline, as well as 6th graders’ scores at 36 months and 9th
graders scores at baseline. Assumptions of the accelerated longitudinal cohort design were not
met in the present study; NA subscale scores at overlapping time points differed significantly
between 3rd graders and 6th graders (d = .43, t(403) = -4.14, p < .001) and 6th graders and 9th
graders (d = .28, t(423) = -2.86, p = .004). PA subscale scores did not differ at the point of
overlap between 3rd vs 6th graders (d = .08, t(403) = -.81, p = .420) but did significantly differ at
the point of overlap between 6th graders and 9th graders (d = .26, t(424) = -2.71, p = .007). Thus,
data were analyzed separately for each cohort.
Developmental trajectories were analyzed with LGCM using the lavaan package for
Structural Equation Modeling (SEM) in R (Rosseell, 2012; R Core Team, 2017) using full
information maximum likelihood (FIML) estimation for missing data. We first fit an
unconditional means (no-growth) model to the data, followed by a linear growth model.
Goodness of fit for each model was assessed using convergence across multiple fit indices,
including Root Mean Square Error of Approximation (RMSEA), Standardized Root Mean
Square Residual (SRMR), and Comparative Fit Index (CFI), consistent with recommendations
proposed by Hu and Bentler (1999). Specifically, good fit was indicated by RMSEA < .06,
SRMR < .08, and CFI > .95, and acceptable fit was indicated by RMSEA < .08 and CFI > .90

9
(Hu & Bentler, 1999). As the introduction of additional slope terms result in models that are no
longer nested, chi-squared tests of difference were not appropriate to compare models. Thus,
models demonstrating good fit according to convergence across RMSEA, SRMR, and CFI fit
indices were subsequently compared on Akaike Information Criteria (AIC) and Bayesian
Information Criteria (BIC) in order to determine the best fitting model, with lower values
indicating better fit. To assess whether initial levels (i.e., intercepts) or rates of change (i.e.,
slopes) of NA and PA are different among boys and girls, gender was included as a predictor of
the intercept and slop factors in the best fitting models for each cohort.
PA Trajectories
Grade 3 cohort. As shown in Table 3, the no-growth model with the two time-points of
PANAS data assessed at 18- and 36-months (approximately 4th and 6th grades) demonstrated
acceptable fit to the grade 3 data across most indices (CFI = .95, RMSEA = .10, SRMR = .04).
Parameter estimates are reported in Table 4. Gender did not predict model intercept (ß = -.02, p =
.876), indicating no gender differences in mean-level PA in the grade 3 cohort.
Grade 6 cohort. Among the grade 6 cohort, a linear model demonstrated good fit to the
three time points of data across fit indices (CFI = 1.00, RMSEA = .00, SRMR = .01; see Table
3). As reported in Table 4, the linear slope was negative (b = -1.58, p < .001), indicating
decreasing trajectories of PA from grade 6 to grade 9. Gender predicted model intercept (ß = .21,
p = .018) such that girls demonstrated higher initial levels of PA relative to boys in the grade 6
cohort. Gender did not predict model slope (ß = -.13, p = .253), indicating that rates of change in
PA do not significantly differ between boys and girls across this developmental period.
Grade 9 cohort. As in the 6th grade cohort, a linear model demonstrated good fit to the
grade 9 data covering three time points from 9th to 12th grades across fit indices (CFI = 1.00,

10
RMSEA = .00, SRMR = .01; see Table 3). The linear slope term was again negative (b = -1.78, p
< .001), indicating persisting declines in PA from grade 9 to grade 12. Gender did not
significantly predict model intercept (ß = -.03, p = .732) or slope (ß = -.16, p = .153), indicating
no gender differences in initial levels or rates of change in PA between grades 9 and 12.
NA Trajectories
Grade 3 cohort. A no-growth model demonstrated acceptable fit to the two time-points
of PANAS data assessed at 18- and 36-months (approximately 4th and 6th grades) across most
indices (CFI = .98, RMSEA = .10, SRMR = .03; see Table 3). Parameter estimates are reported
in Table 4. Gender did not significantly predict model intercept (ß = .13, p = .347), indicating no
gender differences in grade 3 NA.
Grade 6 cohort. As shown in Table 3, both no-growth (CFI = .94, RMSEA = .07, SRMR
= .06) and linear models (CFI = .97, RMSEA = .10, SRMR = .03) demonstrated acceptable fit to
the three time points across fit indices. AIC values were comparable across models, and BIC
values indicated an advantage for the no-growth model (∆AIC = -.64, ∆BIC = -11.18). As the
linear slope term was not significantly different from zero (b = -.06, p = .870), the no-growth
model was retained as the best-fitting model for parsimony. Gender significantly predicted the
intercept (ß = .34, p < .001), such that girls demonstrated higher levels of mean NA than boys
within the grade 6 cohort.
Grade 9 cohort. Among the grade 9 cohort, both no-growth (CFI = .99, RMSEA = .04,
SRMR = .05) and linear models (CFI = 1.00, RMSEA = .02, SRMR - .02) demonstrated good fit
to the three time points spanning 9th to 12th grades across fit indices (see Table 3). AIC values
were comparable across models, and BIC values indicated an advantage for the no-growth model
(∆AIC = -1.71, ∆BIC = -11.92). As the linear slope term was not significantly different from

11
zero (b = -.75, p = .071), the no-growth model was again retained as the best-fitting model for
parsimony. As in the grade 6 cohort, gender predicted the intercept (ß = .26, p = .001), such that
girls reported higher levels of mean NA than boys across late adolescence.
Cohort Age-Related Effects on PA and NA Trajectories
Age associations with NA and PA (Table 1) as well as the descriptive mean trajectories
depicted in Figure 2 suggest that levels of NA decrease and PA increases from middle childhood
to late adolescence. To more formally examine developmental changes in levels of NA and PA
over time, additional analyses were conducted to probe effects of grade cohort on trajectories of
growth and construct a more complete representation of mean-level change in trait affect from
late childhood to late adolescence. Using the overall sample (i.e., data collapsed across cohorts),
grade cohort was entered as a predictor of latent growth factors (i.e., intercept and slope) in PA
and NA, respectively.
Positive affect. A linear model including grade cohort as a predictor of intercept and
slope demonstrated good fit to the data (CFI = 1.00, RMSEA = .00, SRMR = .01). Grade cohort
predicted the intercept (ß = .07, p = .013) but not the slope (ß = -.03, p = .372), indicating that
initial levels of PA mildly increased across development cohorts; however, all cohorts
demonstrated consistent declines in mean-level PA across development.
Negative affect. A no-growth model including grade cohort as a predictor of intercept
and slope demonstrated good fit to the collapsed data (CFI = .98, RMSEA = .04, SRMR = .03).
Grade cohort predicted model intercept (ß = .14, p < .001) such that mean-levels of NA increased
across successive cohorts.
12
CHAPTER 4: DISCUSSION
Despite the importance of affect to a wealth of developmental outcomes, mean-level
trajectories of PA and NA had not yet been mapped across the transition from childhood to late
adolescence, a time of purported emotional upheaval (i.e., “storm and stress”). Present findings
illuminate developmental trends in these affective trajectories and show that adolescence is
characterized by steady declines in PA and mean-level increases in NA from childhood to late
adolescence. Additionally, youths’ gender influences average affective development such that
girls experience higher mean levels of NA relative to boys beginning in adolescence. Taken
together, results add new descriptive trajectory information to the literature by showing marked
affective changes from childhood to late adolescence.
As illustrated in Figure 2, as youth transition through adolescence, they experience
decreasing trajectories of mean-level PA and increasing trajectories of mean-level NA.
Specifically, results of LGCM analyses indicate a negative linear trajectory of PA across this
developmental period. Further, latent growth curve models indicated mean-level increases in NA
across successive development cohorts, such that mean-level NA increased from late childhood
to late adolescence. Overall, descriptive mean-level data, correlational analyses, and latent
growth curve models converge to suggest that adolescent development is characterized by
decreasing PA and increasing NA.
The present study builds on prior longitudinal work investigating developmental
trajectories in affect, extending this work from late childhood to late adolescence. The present
findings indicate that affective trajectories undergo a normative reversal in early adolescence.
Whereas Olino et al. (2011) found linear trends of increasing PA and decreasing NA in their
13
early childhood sample, present results indicate declining PA and increasing NA beginning
around early adolescence. Trajectories of mean-level trait affect detected in the current study are
generally consistent with trends observed in literature on related constructs among adolescent
youth. ESM studies probing developmental patterns in state affect have indicated declines in
subjective global mood state, broadly (Larson & Lampman-Petraitis, 1989, Larson et al., 2002),
and state PA, specifically (Weinstein et al., 2007), across adolescence. Similarly, studies of
personality trait development have indicated increasing neuroticism (associated with NA) and
decreasing extraversion (associated with PA) across this period (Soto et al., 2011; Borghuis et
al., 2017).
Of note, increases in NA were observed between successive cohorts, but significant linear
slopes in NA were not detected in the present study. Indeed, no-growth models most
parsimoniously captured NA trajectories within each cohort independently, although
correlational findings indicate positive associations between age and NA in the sample overall.
Variance in intercept and linear slope estimates within NA models suggest that some youth may
be experiencing increasing NA while others are experiencing stable or declining NA. Future
work should evaluate predictors of individual differences in NA trajectories and further clarify
developmental patterns of NA growth.
The present study additionally probed gender differences in affective change. Gender
effects were observed in NA such that girls experienced consistently higher levels of NA than
boys beginning in grade 6, or approximately age 12. Gender differences in PA development were
less consistent; gender differences were observed among the grade 6 cohort only, such that girls
reported higher initial levels of PA than boys in grade 6 before trajectories again converged
among youth in the grade 9 cohort. Results are consistent with literature indicating gender

14
differences in rates of internalizing among adolescents, with girls demonstrating higher rates of
psychological disorders associated with elevated NA, such as social anxiety, generalized anxiety
disorder, and depression in adolescence (Van Oort, Greaves-Lord, Verhulst, Ormel, Huizink,
2009; Burnstein et al., 2011; Hankin et al., 1998).
The present findings should be interpreted in the context of several limitations.
Assumptions of the accelerated longitudinal cohort design were not met in the present sample,
preventing modeling of continuous affective trajectories spanning age 10 to age 18. While
cohort-based analyses elucidated developmental trajectories of mean-level NA and PA from late
childhood to late adolescence in the present study, future research should aim to map such
trajectories continuously across a sample of youth followed longitudinally across this period of
development. Additionally, researchers should aim to assess trait affect with sufficient frequency
to test patterns of curvilinear growth, as personality research suggests quadratic trends in related
constructs across adolescence (Borghuis et al., 2017). Moreover, by analyzing each cohort
separately, present analyses could not directly estimate gender-specific trajectories; future work
should aim to map trajectories of affect separately for boys and girls, in addition to assessing for
gender differences in parameter estimates.
Despite these limitations, the present study demonstrates a number of notable strengths
and represents an important addition to the extant literature on emotional development. LGCM
analyses permitted sophisticated modeling of affective trajectories among a large sample of
community youth. Further, the present longitudinal, repeated measures design spanning late
childhood to late adolescence provides rich insight into patterns of change in mean-level PA and
NA across a critical period of human development, elucidating trends in normative emotional
experience. Importantly, by empirically mapping mean-level trajectories of NA and PA across

15
ages 10 to 18, the present study addresses a critical gap in our knowledge of emotional
development across a vulnerable period of the lifespan.
Despite historical interest in adolescence as a period of “storm and stress,” developmental
trajectories of mean-level trait NA and PA across adolescence have not been studied. The present
study mapped such trajectories; findings indicate that the period spanning late childhood to late
adolescence is characterized by declining PA and increasing NA, with girls experiencing higher
levels of mean NA than boys beginning in early adolescence. By mapping affective trajectories
from late childhood to late adolescence, the present study illustrates normative trends
adolescents’ emotional experience, contributing fundamental descriptive information to our
knowledge of human emotional development.

16
CHAPTER 5: TABLES
Table 1 Means (and SDs) by Grade Cohort and Gender
Overall M(SD) Girls M(SD) Boys M(SD) t(df) p
Grade 3 Cohort Age 10.63 (.52) 10.58 (.55) 10.70 (.46) 1.63 (170.60) .106 PA T1 - - - - - PA T2 45.33 (9.02) 45.23 (9.17) 45.43 (8.91) .14 (169) .891 PA T3 44.17 (8.75) 44.28 (8.91) 44.06 (8.63) -.16 (156) .875 NA T1 - - - - - NA T2 23.91 (8.15) 24.72 (8.83) 23.02 (7.28) -1.36 (168) .175 NA T3 22.96 (7.54) 23.08 (7.04) 22.83 (8.10) -.21 (156) .833 Grade 6 Cohort Age 11.75 (.71) 11.77 (.69) 11.73 (.73) -.40 (246) .693 PA T1 44.90 (8.25) 45.79 (8.34) 43.62 (8.00) -2.04 (243) .043 PA T2 43.69 (8.16) 44.60 (7.98) 42.36 (8.28) -1.96 (206) .052 PA T3 41.63 (8.77) 41.75 (9.08) 41.46 (8.35) -.23 (200) .818 NA T1 26.54 (8.53) 27.73 (9.10) 24.86 (7.37) -2.63 (243) .009 NA T2 25.31 (8.53) 26.73 (9.18) 23.22 (7.04) -3.11 (202.18) .002 NA T3 26.48 (9.29) 28.42 (10.09) 23.71 (7.19) -3.88 (199.81) .000 Grade 9 Cohort Age 14.66 (.62) 14.62 (.63) 14.71 (.60) 1.14 (221) .095 PA T1 43.88 (8.08) 43.78 (7.77) 44.00 (8.51) .20 (221) .696 PA T2 41.90 (8.61) 41.11 (8.63) 42.94 (8.52) 1.41 (176) .161 PA T3 40.25 (7.71) 39.45 (7.51) 41.33 (7.90) 1.55 (162) .124 NA T1 29.29 (10.38) 31.20 (10.92) 26.78 (9.08) -3.29 (218.28) .001 NA T2 28.11 (8.61) 29.59 (9.14) 26.14 (7.46) -2.77 (175.90) .006 NA T3 27.68 (9.67) 28.60 (9.84) 26.41 (9.34) -1.44 (162) .153 Note. Grade 3 NA and PA at T1 not included in analyses (see Methods for further details); Grade 3 Age refers to child age at T2; NA = negative affect; PA = positive affect
17
Table 2 Correlations between Primary Variables
Note. Grade 3 NA and PA at T1 not included in analyses (see Methods for further details). All r values greater than |.14| are significantly different from 0 at p < .05.
2 3 4 5 6 7 Overall Sample 1. Age at T1 -.05 .14 -.14 .16 -.16 .20 2. Positive Affect T1 --- -.17 .45 -.06 .34 -.10 3. Negative Affect T1 --- -.11 .46 -.10 .32 4. Positive Affect T2 --- -.18 .50 -.09 5. Negative Affect T2 --- -.16 .43 6. Positive Affect T3 --- -.27 7. Negative Affect T3 --- Grade 3 Cohort 1. Age at T1 --- --- -.06 -.13 .01 .08 2. Positive Affect T1 --- --- --- --- --- --- 3. Negative Affect T1 --- --- --- --- --- 4. Positive Affect T2 --- -.09 .46 -.02 5. Negative Affect T2 --- -.05 .18 6. Positive Affect T3 --- -.10 7. Negative Affect T3 --- Grade 6 Cohort 1. Age at T1 .05 -.08 -.14 .16 -.16 .19 2. Positive Affect T1 --- -.20 .45 -.02 .34 -.07 3. Negative Affect T1 --- -.20 .41 -.09 .26 4. Positive Affect T2 --- -.15 .53 -.10 5. Negative Affect T2 --- -.10 .44 6. Positive Affect T3 --- -.27 7. Negative Affect T3 --- Grade 9 Cohort 1. Age at T1 -.05 .05 .21 -.07 .23 .12 2. Positive Affect T1 --- -.13 .45 -.10 .34 -.14 3. Negative Affect T1 --- -.00 .48 -.08 .36 4. Positive Affect T2 --- -.23 .44 -.05 5. Negative Affect T2 --- -.25 .52 6. Positive Affect T3 --- -.33 7. Negative Affect T3 ---
18
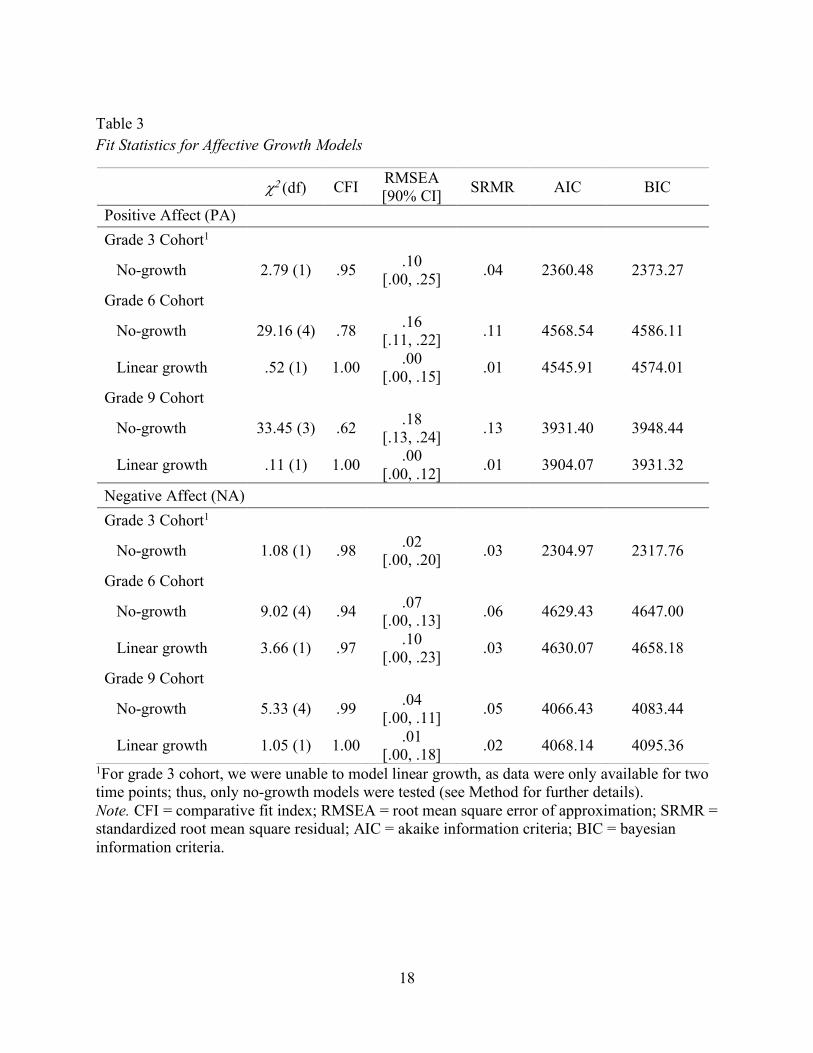
Table 3 Fit Statistics for Affective Growth Models
1For grade 3 cohort, we were unable to model linear growth, as data were only available for two time points; thus, only no-growth models were tested (see Method for further details). Note. CFI = comparative fit index; RMSEA = root mean square error of approximation; SRMR = standardized root mean square residual; AIC = akaike information criteria; BIC = bayesian information criteria.
c2 (df) CFI RMSEA [90% CI] SRMR AIC BIC
Positive Affect (PA) Grade 3 Cohort1
No-growth 2.79 (1) .95 .10 [.00, .25] .04 2360.48 2373.27
Grade 6 Cohort
No-growth 29.16 (4) .78 .16 [.11, .22] .11 4568.54 4586.11
Linear growth .52 (1) 1.00 .00 [.00, .15] .01 4545.91 4574.01
Grade 9 Cohort
No-growth 33.45 (3) .62 .18 [.13, .24] .13 3931.40 3948.44
Linear growth .11 (1) 1.00 .00 [.00, .12] .01 3904.07 3931.32
Negative Affect (NA) Grade 3 Cohort1
No-growth 1.08 (1) .98 .02 [.00, .20] .03 2304.97 2317.76
Grade 6 Cohort
No-growth 9.02 (4) .94 .07 [.00, .13] .06 4629.43 4647.00
Linear growth 3.66 (1) .97 .10 [.00, .23] .03 4630.07 4658.18
Grade 9 Cohort
No-growth 5.33 (4) .99 .04 [.00, .11] .05 4066.43 4083.44
Linear growth 1.05 (1) 1.00 .01 [.00, .18] .02 4068.14 4095.36

19
Table 4 Parameter Estimates for Best-Fitting Models
Note. PA = positive affect; NA = negative affect
Intercept Linear Slope
b (SE) ß z p b (SE) ß z p
Means
Models of PA
Grade 3 Cohort 44.79(.58) 7.48 76.95 .000 - - - -
Grade 6 Cohort 45.01(.51) 7.60 88.80 .000 -1.58(.34) -.52 -4.71 .000
Grade 9 Cohort 43.85(.53) 6.87 82.52 .000 -1.80(.33) -.61 -5.41 .000
Models of NA
Grade 3 Cohort 23.50(.47) 7.02 49.97 .000 - - - -
Grade 6 Cohort 26.14(.44) 4.81 58.93 .000 - - - -
Grade 9 Cohort 28.33(.54) 4.29 52.57 .000 - - - -
Variances
Models of PA
Grade 3 Cohort 35.85(6.95) 1.00 5.16 .000 - - - -
Grade 6 Cohort 35.10(8.44) 1.00 4.16 .000 9.18(4.29) 1.00 2.14 .033
Grade 9 Cohort 40.73(9.80) 1.00 4.16 .000 8.62(4.45) 1.00 1.94 .053
Models of NA
Grade 3 Cohort 11.21(5.40) 1.00 2.07 .038 - - - -
Grade 6 Cohort 29.52(4.62) 1.00 6.39 .000 - - - -
Grade 9 Cohort 43.53(6.30) 1.00 6.91 .000 - - - -

20
CHAPTER 6: FIGURES
Figure 1. An illustration of PANAS-C assessment points using the accelerated longitudinal
cohort design, with triangles indicating cohort-specific assessment points and stars indicating
overlapping assessment points between cohorts.
21
Figure 2. A descriptive timeline of observed and estimated negative affect (NA) and positive
affect (PA) development from late childhood to late adolescence using PANAS mean scores.
Error bars have been added to represent standard errors of the observed means.
0
5
10
15
20
25
30
35
40
45
50
T1 (10.5) T2 (12) T3 (13.5) T4 (15) T5 (16.5) T6 (18)
PAN
AS
Scor
e
Assessment Point (approx. age in years)
PA observed
NA observed
PA estimated
NA estimated

22
Figure 3. A descriptive timeline of negative affect (NA) and positive affect (PA) development
from late childhood to late adolescence using PANAS mean scores, plotted by gender. Error bars
have been added to represent standard errors of the mean.
0
5
10
15
20
25
30
35
40
45
50
T1 (10.5) T2 (12) T3 (13.5) T4 (15) T5 (16.5) T6 (18)
PAN
AS
Scor
e
Assessment Point (approx. age in years)
Girls NA
Boys NA
Girls PA
Boys PA

23
REFERENCES
Baker, T. B., Piper, M. E., McCarthy, D. E., Majeskie, M. R., & Fiore, M. C. (2004). Addiction
motivation reformulated: An affective processing model of negative
reinforcement. Psychological Review, 111(1), 33-51.
http://dx.doi.org.proxy2.library.illinois.edu/10.1037/0033-295X.111.1.33
Burstein, M., He, J., Kattan, G., Albano, A. M., Avenevoli, S., & Merikangas, K. R. (2011).
Social phobia and subtypes in the national comorbidity Survey–Adolescent supplement:
Prevalence, correlates, and comorbidity. Journal of the American Academy of Child &
Adolescent Psychiatry, 50(9), 870-880.
doi:http://dx.doi.org.proxy2.library.illinois.edu/10.1016/j.jaac.2011.06.005
Borghuis, J., Denissen, J. J. A., Oberski, D., Sijtsma, K., Meeus, W. H. J., Branje, S., . . .
Bleidorn, W. (2017). Big five personality stability, change, and codevelopment across
adolescence and early adulthood. Journal of Personality and Social Psychology, 113(4),
641-657. http://dx.doi.org.proxy2.library.illinois.edu/10.1037/pspp0000138
Caspi, A. (1998). Personality development across the life course. In N. Eisenberg (Ed.), 5th ed.;
handbook of child psychology: Social, emotional, and personality development (vol. 3,
5th ed.) (5th ed. ed., pp. 311-388, Chapter xxiv, 1208 Pages) John Wiley & Sons Inc,
Hoboken, NJ.
Cohn, M. A., Fredrickson, B. L., Brown, S. L., Mikels, J. A., & Conway, A. M. (2009).
Happiness unpacked: Positive emotions increase life satisfaction by building
resilience. Emotion, 9(3), 361-368.
http://dx.doi.org.proxy2.library.illinois.edu/10.1037/a0015952
24
Dockray, S., & Steptoe, A. (2010). Positive affect and psychobiological processes. Neuroscience
and Biobehavioral Reviews, 35(1), 69-75.
http://dx.doi.org.proxy2.library.illinois.edu/10.1016/j.neubiorev.2010.01.006
Duncan, S. C., Duncan, T. E., & Hops, H. (1996). Analysis of longitudinal data within
accelerated longitudinal designs. Psychological Methods, 1(3), 236-248.
http://dx.doi.org.proxy2.library.illinois.edu/10.1037/1082-989X.1.3.236
Ebesutani, C., Okamura, K., Higa-McMillan, C., & Chorpita, B. F. (2011). A psychometric
analysis of the positive and negative affect schedule for Children–Parent version in a
school sample. Psychological Assessment, 23(2), 406-416.
http://dx.doi.org.proxy2.library.illinois.edu/10.1037/a0022057
Ekman, P. & Davidson, R.J. (1994). The nature of emotion: Fundamental questions. Oxford
University Press, New York, NY.
Hankin, B. L., Abramson, L. Y., Moffitt, T. E., Silva, P. A., McGee, R., & Angell, K. E. (1998).
Development of depression from preadolescence to young adulthood: emerging gender
differences in a 10-year longitudinal study. Journal of abnormal psychology, 107(1), 128.
Hankin, B. L., Young, J. F., Abela, J. R. Z., Smolen, A., Jenness, J. L., Gulley, L. D., . . .
Oppenheimer, C. W. (2015). Depression from childhood into late adolescence: Influence
of gender, development, genetic susceptibility, and peer stress. Journal of Abnormal
Psychology, 124(4), 803-816.
http://dx.doi.org.proxy2.library.illinois.edu/10.1037/abn0000089
Hollenstein, T., & Lougheed, J. P. (2013). Beyond storm and stress: Typicality, transactions,
timing, and temperament to account for adolescent change. American
Psychologist, 68(6), 444-454.
25
http://dx.doi.org.proxy2.library.illinois.edu/10.1037/a0033586
Hu, L., & Bentler, P. M. (1999). Cutoff criteria for fit indexes in covariance structure analysis:
Conventional criteria versus new alternatives. Structural Equation Modeling, 6(1), 1-55.
http://dx.doi.org.proxy2.library.illinois.edu/10.1080/10705519909540118
Hughes, A. A., & Kendall, P. C. (2009). Psychometric properties of the positive and negative
affect scale for children (PANAS-C) in children with anxiety disorders. Child Psychiatry
and Human Development, 40(3), 343-352.
http://dx.doi.org.proxy2.library.illinois.edu/10.1007/s10578-009-0130-4
Kann, L., Kinchen, S., Shanklin, S., Flint, K.H., Hawkins, J., Harris, W.A., Lowry, R., Olsen,
E.O., McManus, T., Chyen, D., Whittle, L., Taylor, E., Demissie, Z., Brener, N.D.,
Thornton, J., Moore, J., Zaza, S. (2014). Youth risk behavior surveillance: United States,
2013. MMMR Surveillance Summaries, 23(4), 1-168.
Larson, R., & Lampman-Petraitis, C. (1989). Daily emotional states as reported by children and
adolescents. Child Development, 60(5), 1250-1260.
http://dx.doi.org.proxy2.library.illinois.edu/10.2307/1130798
Larson, R. W., Moneta, G., Richards, M. H., & Wilson, S. (2002). Continuity, stability, and
change in daily emotional experience across adolescence.Child Development, 73(4),
1151-1165. http://dx.doi.org.proxy2.library.illinois.edu/10.1111/1467-8624.00464
Laurent, J., Catanzaro, S. J., Joiner, T. E., Jr., Rudolph, K. D., Potter, K. I., Lambert, S., . . .
Gathright, T. (1999). A measure of positive and negative affect for children: Scale
development and preliminary validation.Psychological Assessment, 11(3), 326-338.
http://dx.doi.org.proxy2.library.illinois.edu/10.1037/1040-3590.11.3.326
Lyubomirsky, S., King, L., & Diener, E. (2005). The benefits of frequent positive affect: Does
26
happiness lead to success? Psychological Bulletin, 131(6), 803-855.
http://dx.doi.org.proxy2.library.illinois.edu/10.1037/0033-2909.131.6.803
Maydeu-Olivares, A., & Coffman, D. L. (2006). Random intercept item factor
analysis. Psychological Methods, 11(4), 344-362.
http://dx.doi.org.proxy2.library.illinois.edu/10.1037/1082-989X.11.4.344
Merikangas, K. R., He, J., Burstein, M., Swanson, S. A., Avenevoli, S., Cui, L., . . . Swendsen, J.
(2010). Lifetime prevalence of mental disorders in U.S. adolescents: Results from the
national comorbidity survey replication-adolescent supplement (NCS-A). Journal of the
American Academy of Child & Adolescent Psychiatry, 49(10), 980-989.
http://dx.doi.org.proxy2.library.illinois.edu/10.1016/j.jaac.2010.05.017
Newsom, J. T. (2015). Longitudinal Structural Equation Modeling: A Comprehensive
Introduction. Taylor & Francis: New York, NY.
Olino, T. M., Lopez-Duran, N. L., Kovacs, M., George, C. J., Gentzler, A. L., & Shaw, D. S.
(2011). Developmental trajectories of positive and negative affect in children at high and
low familial risk for depressive disorder. Journal of Child Psychology and
Psychiatry, 52(7), 792-799.
http://dx.doi.org.proxy2.library.illinois.edu/10.1111/j.1469-7610.2010.02331.x
Pressman, S. D., Gallagher, M. W., & Lopez, S. J. (2013). Is the emotion-health connection a
"first-world problem"? Psychological Science, 24(4), 544-549.
http://dx.doi.org.proxy2.library.illinois.edu/10.1177/0956797612457382
Ramsey, M. A., & Gentzler, A. L. (2015). An upward spiral: Bidirectional associations between
positive affect and positive aspects of close relationships across the life
span. Developmental Review, 36, 58-104.
27
http://dx.doi.org.proxy2.library.illinois.edu/10.1016/j.dr.2015.01.003
Rosseel, Y. (2012). lavaan: An R Package for Structural Equation Modeling. Journal of
Statistical Software, 48(2), 1 - 36. doi:http://dx.doi.org/10.18637/jss.v048.i02
Sawyer, S. M., Afifi, R. A., Bearinger, L. H., Blakemore, S., Dick, B., Ezeh, A. C., & Patton, G.
C. (2012). Adolescence: A foundation for future health.The Lancet, 379(9826), 1630-
1640. http://dx.doi.org.proxy2.library.illinois.edu/10.1016/S0140-6736(12)60072-5
Soto, C. J., John, O. P., Gosling, S. D., & Potter, J. (2011). Age differences in personality traits
from 10 to 65: Big five domains and facets in a large cross-sectional sample. Journal of
Personality and Social Psychology, 100(2), 330-348.
http://dx.doi.org.proxy2.library.illinois.edu/10.1037/a0021717
Stice, E. (2001). A prospective test of the dual-pathway model of bulimic pathology: Mediating
effects of dieting and negative affect. Journal of Abnormal Psychology, 110(1), 124-135.
http://dx.doi.org.proxy2.library.illinois.edu/10.1037/0021-843X.110.1.124
Tugade, M. M., & Fredrickson, B. L. (2004). Resilient individuals use positive emotions to
bounce back from negative emotional experiences. Journal of Personality and Social
Psychology, 86(2), 320-333. http://dx.doi.org.proxy2.library.illinois.edu/10.1037/0022-
3514.86.2.320
Van Oort, F. V. A., Greaves-Lord, K., Verhulst, F. C., Ormel, J., & Huizink, A. C. (2009). The
developmental course of anxiety symptoms during adolescence: The TRIALS
study. Journal of Child Psychology and Psychiatry, 50(10), 1209-1217.
doi:http://dx.doi.org.proxy2.library.illinois.edu/10.1111/j.1469-7610.2009.02092.x
Veronese, G., & Pepe, A. (2017). Positive and negative affect in children living in refugee
camps: Assessing the psychometric proprieties and factorial invariance of the PANAS-C
28
in the Gaza Strip. Evaluation & the Health Professions, 40(1), 3-32.
http://dx.doi.org.proxy2.library.illinois.edu/10.1177/0163278715625741
Watson, D. (2000). Mood and temperament Guilford Press, New York, NY.
Weinstein, S. M., Mermelstein, R. J., Hankin, B. L., Hedeker, D., & Flay, B. R. (2007).
Longitudinal patterns of daily affect and global mood during adolescence. Journal of
Research on Adolescence, 17(3), 587-600.
http://dx.doi.org.proxy2.library.illinois.edu/10.1111/j.1532-7795.2007.00536.x
29
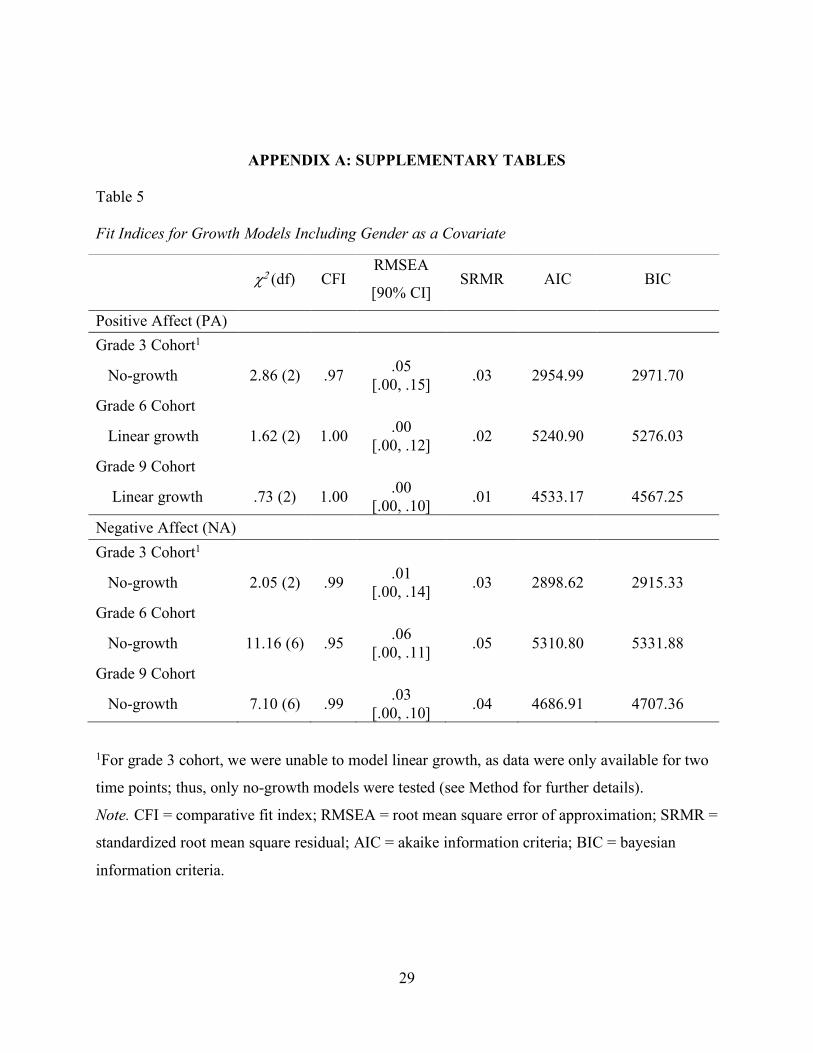
APPENDIX A: SUPPLEMENTARY TABLES
Table 5 Fit Indices for Growth Models Including Gender as a Covariate
1For grade 3 cohort, we were unable to model linear growth, as data were only available for two
time points; thus, only no-growth models were tested (see Method for further details).
Note. CFI = comparative fit index; RMSEA = root mean square error of approximation; SRMR =
standardized root mean square residual; AIC = akaike information criteria; BIC = bayesian
information criteria.
c2 (df) CFI RMSEA
[90% CI] SRMR AIC BIC
Positive Affect (PA) Grade 3 Cohort1
No-growth 2.86 (2) .97 .05 [.00, .15] .03 2954.99 2971.70
Grade 6 Cohort
Linear growth 1.62 (2) 1.00 .00 [.00, .12] .02 5240.90 5276.03
Grade 9 Cohort
Linear growth .73 (2) 1.00 .00 [.00, .10] .01 4533.17 4567.25
Negative Affect (NA) Grade 3 Cohort1
No-growth 2.05 (2) .99 .01 [.00, .14] .03 2898.62 2915.33
Grade 6 Cohort
No-growth 11.16 (6) .95 .06 [.00, .11] .05 5310.80 5331.88
Grade 9 Cohort
No-growth 7.10 (6) .99 .03 [.00, .10] .04 4686.91 4707.36
30
Table 6 Parameter Estimates for All Cohort Models Intercept Linear Slope
b (SE) ß z p b (SE) ß z p
Means
No-growth Models of PA
Grade 3 Cohort 44.79(.58) 7.48 76.95 .000 - - - -
Grade 6 Cohort 43.67(.44) 7.93 98.74 .000 - - - -
Grade 9 Cohort 42.45(.46) 8.20 91.44 .000 - - - -
Linear Models of PA
Grade 3 Cohort - - - - - - - -
Grade 6 Cohort 45.01(.51) 7.60 88.80 .000 -1.58(.34) -.52 -4.71 .000
Grade 9 Cohort 43.85(.53) 6.87 82.52 .000 -1.80(.33) -.61 -5.41 .000
No-growth Models of NA
Grade 3 Cohort 23.50(.47) 7.02 49.97 .000 - - - -
Grade 6 Cohort 26.14(.44) 4.81 58.93 .000 - - - -
Grade 9 Cohort 28.33(.54) 4.29 52.57 .000 - - - -
Linear Models of NA
Grade 3 Cohort - - - - - - - -
Grade 6 Cohort 26.29(.54) 4.09 49.16 .000 -.06(.37) -.02 -.16 .870
Grade 9 Cohort 29.05(.66) 4.20 44.36 .000 -.75(.41) -.32 -1.80 .071
Variances
No-growth Models of PA
Grade 3 Cohort 35.85(6.95) 1.00 5.16 .000 - - - -
Grade 6 Cohort 30.36(4.33) 1.00 7.02 .000 - - - -
Grade 9 Cohort 26.54(4.40) 1.00 6.03 .000 - - - -
31
Table 6 (continued) Linear Models of PA
Grade 3 Cohort - - - - - - - -
Grade 6 Cohort 35.10(8.44) 1.00 4.16 .000 9.18(4.29) 1.00 2.14 .033
Grade 9 Cohort 40.73(9.80) 1.00 4.16 .000 8.62(4.45) 1.00 1.94 .053
No-growth Models of NA
Grade 3 Cohort 11.21(5.40) 1.00 2.07 .038 - - - -
Grade 6 Cohort 29.52(4.62) 1.00 6.39 .000 - - - -
Grade 9 Cohort 43.53(6.30) 1.00 6.91 .000 - - - -
Linear Models of NA
Grade 3 Cohort - - - - - - - -
Grade 6 Cohort 41.31(10.08) 1.00 4.10 .000 11.90(5.11) 1.00 2.33 .020
Grade 9 Cohort 47.92(11.90) 1.00 4.03 .000 5.33(6.23) 1.00 .86 .392 Note. PA = positive affect; NA = negative affect

32
Table 7 Fit Indices for Growth Models for the Overall Sample Including Grade Cohort as a Covariate
Note. CFI = comparative fit index; RMSEA = root mean square error of approximation; SRMR =
standardized root mean square residual; AIC = akaike information criteria; BIC = bayesian
information criteria.
c2 (df) CFI RMSEA
[90% CI] SRMR AIC BIC
Positive Affect (PA)
No-growth 63.98 (6) .77 .12
[.10, .15] .08 13802.42 13829.30
Linear growth .35 (2) 1.00 .00
[.00, .04] .01 13746.79 13791.59
Negative Affect (NA)
No-growth 11.71 (6) .98 .04
[.00, .07] .03 13959.76 13986.64
Linear growth 3.05 (2) 1.00 .03
[.00, .09] .02 13959.10 14003.90