physical activity among childhood cancer survivors - … · physical activity among childhood...
TRANSCRIPT

Physical activity among childhood cancer survivors
Kirsten K. Ness, PT, PhD AICR October 30, 2014
Outline
• Childhood cancer and survival • Chronic health conditions • Associations between exercise/lifestyle and
chronic health conditions • Declining physical activity • Frail health • Physical activity guidelines • Prevention and remediation examples

Outline
• Childhood cancer and survival • Chronic health conditions • Associations between exercise/lifestyle and
chronic health conditions • Declining physical activity • Frail health • Physical activity guidelines • Prevention and remediation examples
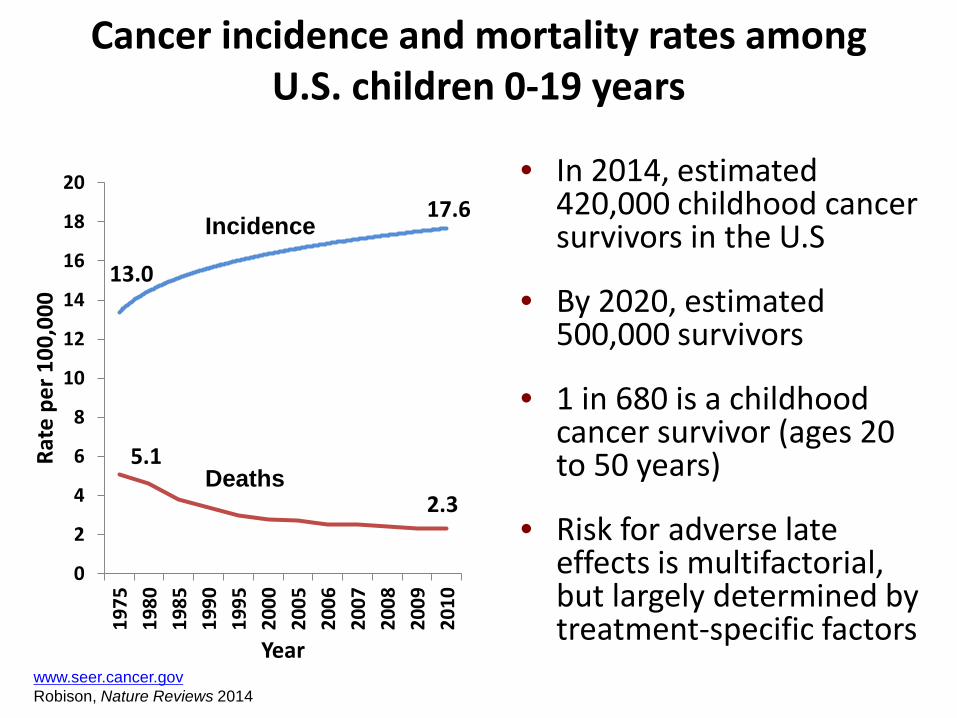
Cancer incidence and mortality rates among U.S. children 0-19 years
13.0
17.6
5.1
2.3
0
2
4
6
8
10
12
14
16
18
20
1975
1980
1985
1990
1995
2000
2005
2006
2007
2008
2009
2010
Rate
per
100
,000
Year
• In 2014, estimated 420,000 childhood cancer survivors in the U.S
• By 2020, estimated 500,000 survivors
• 1 in 680 is a childhood cancer survivor (ages 20 to 50 years)
• Risk for adverse late effects is multifactorial, but largely determined by treatment-specific factors www.seer.cancer.gov
Robison, Nature Reviews 2014 2010Biomarkers Prev 2009
Incidence
Deaths
Outline
• Childhood cancer and survival • Chronic health conditions • Associations between exercise/lifestyle and
chronic health conditions • Declining physical activity • Frail health • Physical activity guidelines • Prevention and remediation examples

• Funded in 1994
• Retrospective Cohort, diagnosed 1970-1986
• 26 Contributing Centers
• 5-Year Survival
• Leukemia, Lymphoma, CNS, Bone, Wilms, NBL, Soft-tissue sarcoma
• Detailed Treatment Data, Wide Range of Outcomes
• 230+ Publications since 2001
20,720 Eligible Lost (n=3017) 17,703 Contacted Refusal (n=3189) 14,372 Participants
Cohort Expansion: 1987-1999 n=15,351
Childhood Cancer Survivor Study (CCSS) (U24 CA55727)
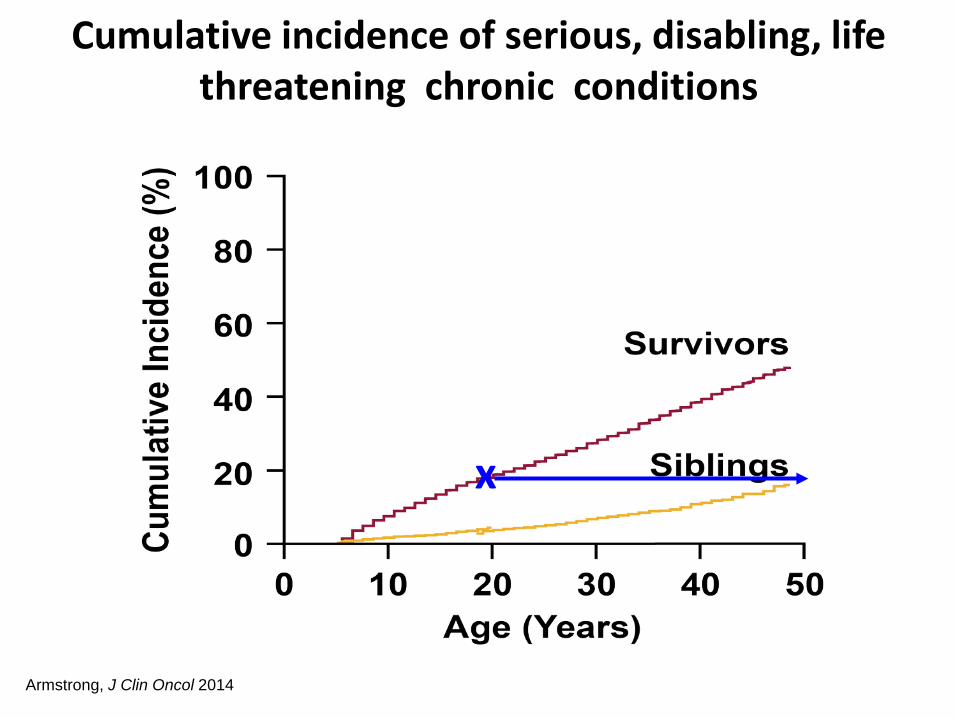
Cumulative incidence of serious, disabling, life threatening chronic conditions
x
Armstrong, J Clin Oncol 2014
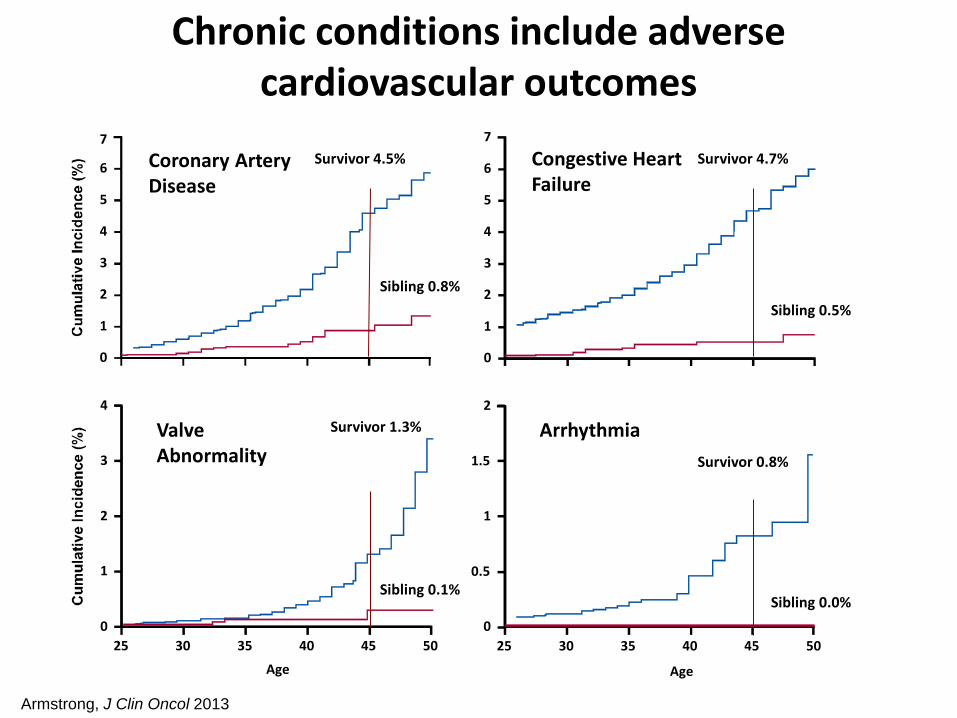
Cumulative Incidence at 45 years: Cardiovascular Events (grade 3–5)
Age
7
0
1
2
3
4
5
6 Survivor 4.5%
Sibling 0.8%
Coronary Artery Disease
0
1
2
3
4
5
6
7 Survivor 4.7%
Sibling 0.5%
Congestive Heart Failure
0 45 40 35 30 25 50
0.5
1
1.5
2
Survivor 0.8%
Sibling 0.0%
Arrhythmia
0 45 40 35
Age
30 25 50
1
2
3
4 Survivor 1.3%
Sibling 0.1%
Valve Abnormality
Chronic conditions include adverse cardiovascular outcomes
Armstrong, J Clin Oncol 2013

p<0.001 p<0.001
Chest RT + CVRFC
OR=28.2
CVRFC alone
OR=6.8
Chest RT alone
OR=6.3
CVRFC alone
OR=4.7
Chest RT alone
OR=4.3
Chest RT + CVRFC
OR=16.2
Coronary Artery Disease
0
2 0
4 0
6 0
Congestive Heart Failure
0
2 0
4 0
6 0
Risk of a cardiac event is magnified by the presence of known cardiovascular risk factors
CVRFC include diabetes, dyslipidemia, hypertension, obesity Armstrong, J Clin Oncol 2013

Vigorous physical activity associated with lower risk of adverse cardiovascular event
Any Major CV Event Coronary Artery Disease
MET hours/week RR 95% CI RR 95% CI
None Referent Referent
3 to 6 0.87 0.56 to 1.34 0.71 0.42 to 1.21
9 to 12 0.45 0.26 to 0.80 0.52 0.28 to 0.96
15 to 21 0.47 0.23 to 0.95 0.36 0.14 to 0.91
Jones, J Clin Oncol 2014
N= 1.187 Hodgkin Lymphoma Survivors from CCSS (median age 31.2 years, median follow-up 11.9 years) who did not have an adverse cardiovascular event at the baseline questionnaire Cumulative incidence of cardiovascular event at 10 years was 12.2% for those with no MET hours/week and 5.2% for those with 9+ Met hours/week

St. Jude Lifetime Cohort (SJLIFE) • Objective:
– To establish a lifetime cohort of childhood cancer survivors
– To facilitate longitudinal evaluation of health outcomes in aging adults surviving pediatric cancer
• Eligibility:
– Diagnosis of cancer treated at St. Jude – At least 18 years of age – At least 10 years from diagnosis

Externally funded ancillary research studies
Priority pilot studies
Laboratory core battery
Risk-based screening per COG Guidelines
Functional assessment
Collection of biological specimens
Medical records: treatment and medical events Questionnaires: self-report of socio-demographics, health status, and medical events
Follow-up and validation of outcomes Use of bio-repository for biomarkers, genome wide and candidate gene studies
SJLIFE Database
Pre-visit Clinical Assessment Post-visit
SJLIFE assessment

1713 Adult Survivors Median Age 32 years (range 18-60) Median time from Diagnosis 25 years (range 10-47) 51% Female 87% Caucasian
Hudson, JAMA 2013
Cohort Characteristics

Chronic conditions in SJLife
By age 45 years it is estimated that…… – 80% (95% CI 73.0 – 86.6%) will have a serious/disabling or life-
threatening chronic health condition [CTCAE v.4 Grade 3-4]
– 95.2% (95% CI 94.8 – 98.6%) will have at least one chronic health condition
Presence of chronic health condition graded by CTCAE v4
Grade 1
Grade 2
Grade 3
Grade 4
Totals At least one condition 92.8% 68.8% 60.8% 17.8% Multiple conditions 72.6% 36.4% 23.2% 1.9% At least one grade 1 or 2 condition 96.7% Multiple grade 1 or 2 conditions 86.2% At least one grade 3 or 4 condition 67.6% Multiple grade 3 or 4 conditions 30.3%
Hudson JAMA 2013

Metabolic syndrome in SJLife
• N=1598 (49.2% male) • Mean age at diagnosis 7.9 ± 5.5 years • Mean time since diagnosis 25.6 ± 7.6 years • Cohort members with campus visit & diet data
Male (%) Female (%) Metabolic syndrome 32.5 31.0 Increased waist circumference 29.9 41.6 Increased Triglycerides 33.8 21.0 Decreased HDL 38.2 42.6 Increased blood pressure 53.0 40.6 Increased fasting glucose 38.2 24.9
Smith, Cancer 2014
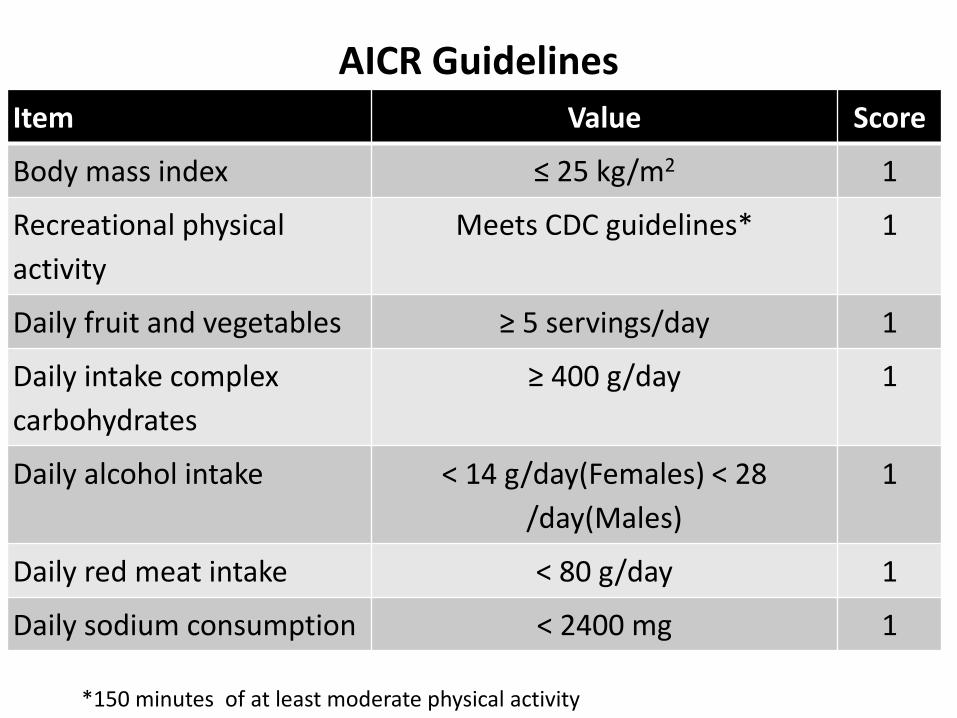
AICR Guidelines Item Value Score
Body mass index ≤ 25 kg/m2 1
Recreational physical activity
Meets CDC guidelines* 1
Daily fruit and vegetables ≥ 5 servings/day 1
Daily intake complex carbohydrates
≥ 400 g/day 1
Daily alcohol intake < 14 g/day(Females) < 28 /day(Males)
1
Daily red meat intake < 80 g/day 1
Daily sodium consumption < 2400 mg 1
*150 minutes of at least moderate physical activity

Association between meeting AICR guidelines & metabolic syndrome
4.0% 4.0%
38.5%
27.0%
0%
10%
20%
30%
40%
50%
60%
Males Females
Did not meet AICR Guidelines
Met AICR Guidelines
• RR among females 2.4 (95% CI 1.7-3.3) & among males 2.2 (95% CI 1.6-3.0) for those who met 4+ compared to those who did not meet at least 4 of the AICR guidelines
• Adjusted for race, age, educational attainment and CRT exposure
Smith, Cancer 2014

Outline
• Childhood cancer and survival • Chronic health conditions • Associations between exercise/lifestyle and
chronic health conditions • Declining physical activity • Frail health • Physical activity guidelines • Prevention and remediation examples
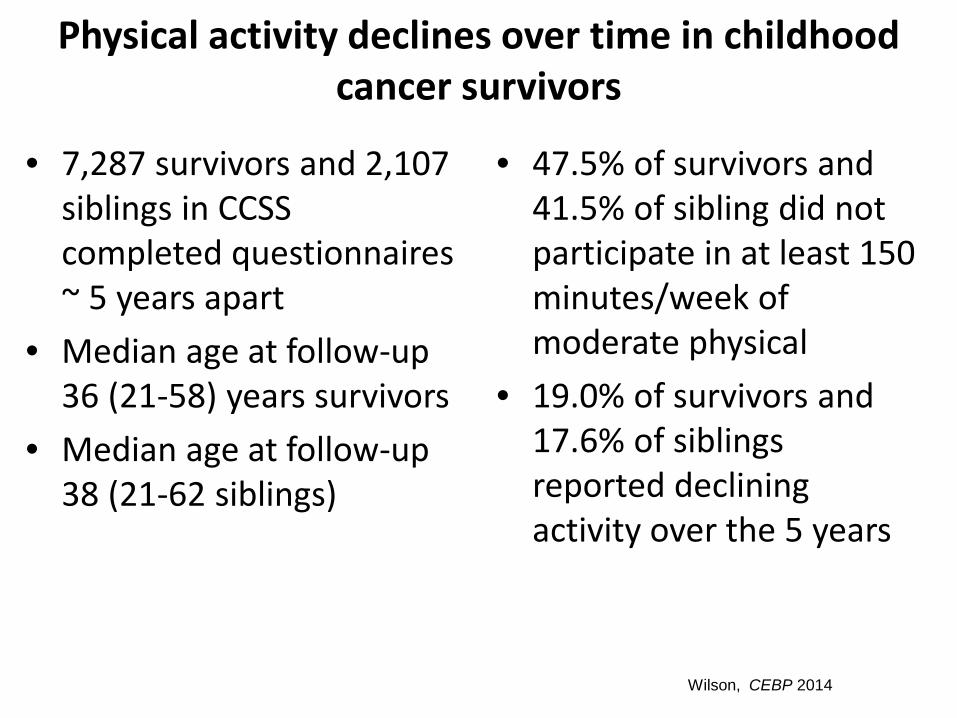
Physical activity declines over time in childhood cancer survivors
• 7,287 survivors and 2,107 siblings in CCSS completed questionnaires ~ 5 years apart
• Median age at follow-up 36 (21-58) years survivors
• Median age at follow-up 38 (21-62 siblings)
• 47.5% of survivors and 41.5% of sibling did not participate in at least 150 minutes/week of moderate physical
• 19.0% of survivors and 17.6% of siblings reported declining activity over the 5 years
Wilson, CEBP 2014

Declining physical activity is associated with chronic conditions
0.4
0.8
1.6
Cardiac condition Neurologic condition Musculoskeletal condition
Wilson, CEBP 2014

Outline
• Childhood cancer and survival • Chronic health conditions • Associations between exercise/lifestyle and
chronic health conditions • Declining physical activity • Frail health • Physical activity guidelines • Prevention and remediation examples
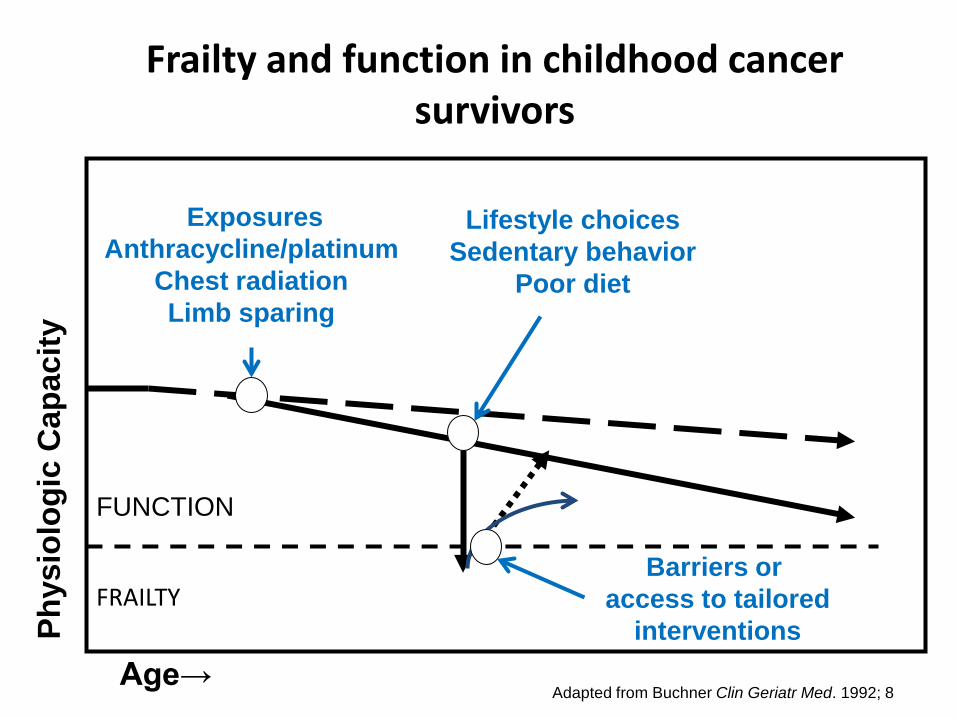
FUNCTION
Phys
iolo
gic
Cap
acity
Age→
FRAILTY
Exposures Anthracycline/platinum
Chest radiation Limb sparing
Lifestyle choices Sedentary behavior
Poor diet
Barriers or access to tailored
interventions
Frailty and function in childhood cancer survivors
Adapted from Buchner Clin Geriatr Med. 1992; 8
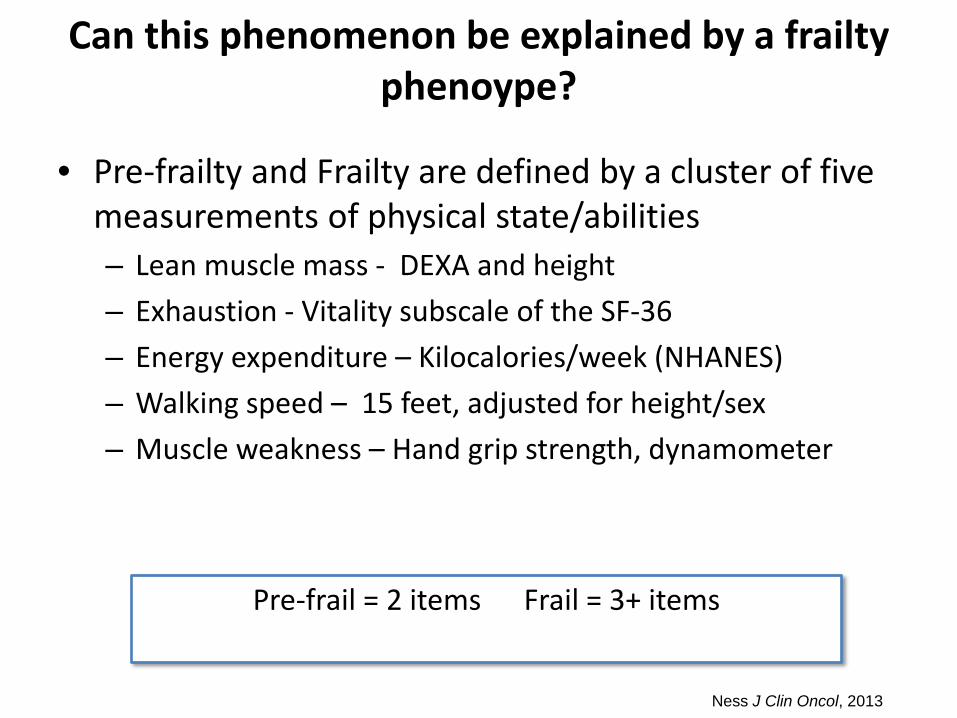
Can this phenomenon be explained by a frailty phenoype?
• Pre-frailty and Frailty are defined by a cluster of five measurements of physical state/abilities – Lean muscle mass - DEXA and height – Exhaustion - Vitality subscale of the SF-36 – Energy expenditure – Kilocalories/week (NHANES) – Walking speed – 15 feet, adjusted for height/sex – Muscle weakness – Hand grip strength, dynamometer
Pre-frail = 2 items Frail = 3+ items
Ness J Clin Oncol, 2013
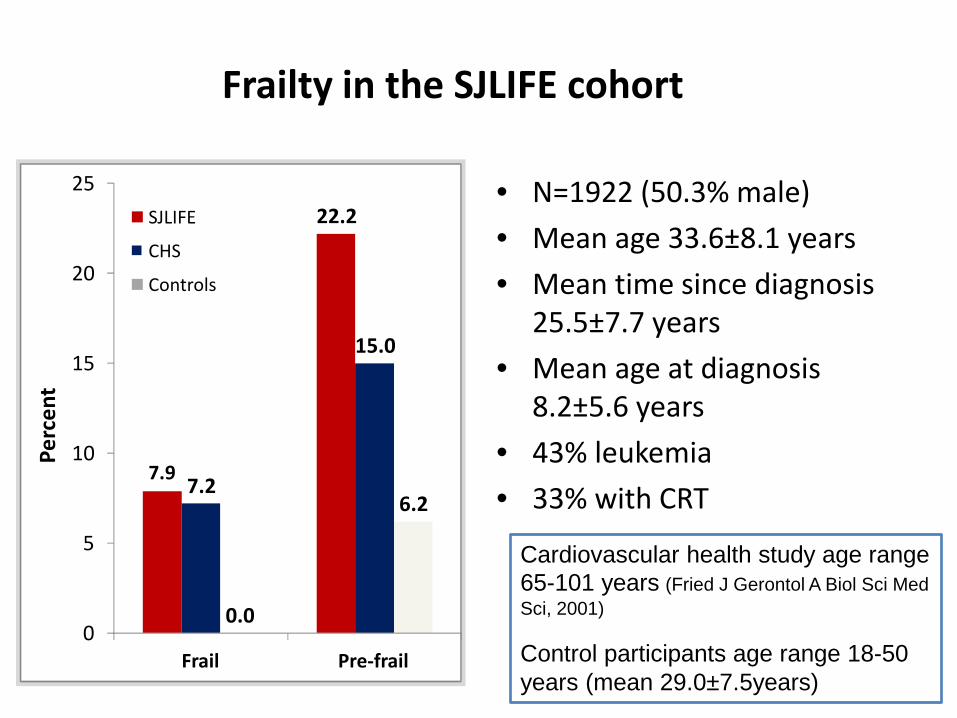
Frailty in the SJLIFE cohort
• N=1922 (50.3% male) • Mean age 33.6±8.1 years • Mean time since diagnosis
25.5±7.7 years • Mean age at diagnosis
8.2±5.6 years • 43% leukemia • 33% with CRT
Cardiovascular health study age range 65-101 years (Fried J Gerontol A Biol Sci Med Sci, 2001)
Control participants age range 18-50 years (mean 29.0±7.5years)
7.9
22.2
7.2
15.0
0.0
6.2
0
5
10
15
20
25
Frail Pre-frail
Perc
ent
SJLIFE
CHS
Controls
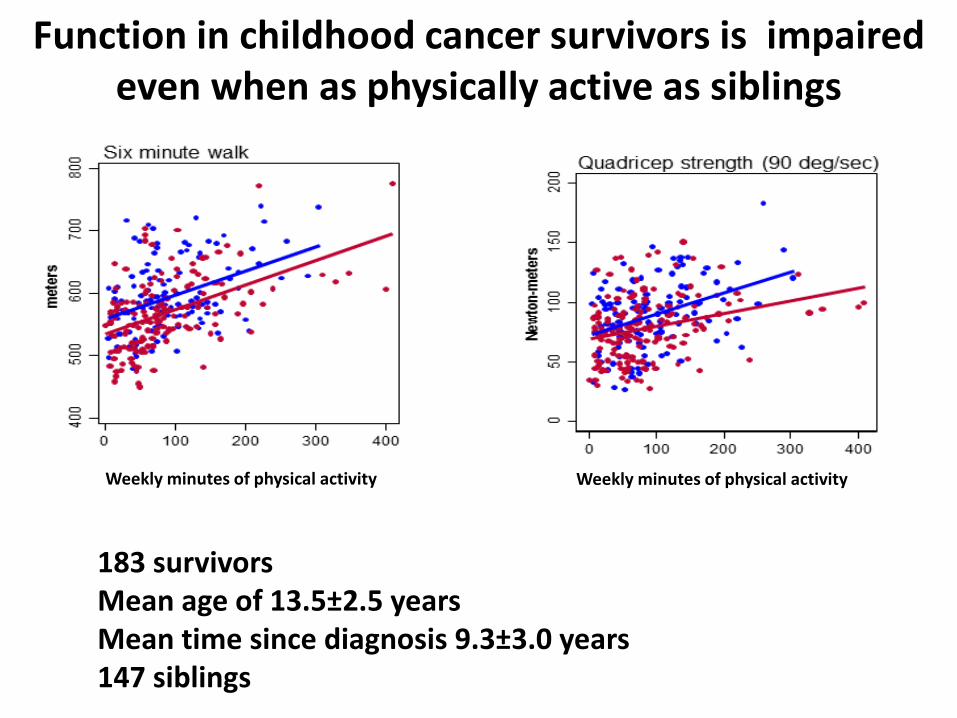
Function in childhood cancer survivors is impaired even when as physically active as siblings
Weekly minutes of physical activity
183 survivors Mean age of 13.5±2.5 years Mean time since diagnosis 9.3±3.0 years 147 siblings
Weekly minutes of physical activity

Outline
• Childhood cancer and survival • Chronic health conditions • Associations between exercise/lifestyle and
chronic health conditions • Declining physical activity • Frail health • Physical activity guidelines • Prevention and remediation examples

Source Age Aerobic Resistance Training
American College of Sports Medicine
None specified
15-40 minutes of moderate to vigorous intensity
1-2 sets of 8-10 exercises at 8 repetition maximum 1- 2 times per week
White et al (2005)
Children Light levels – individualized dose during induction and consolidation Light to moderate levels – individualized with progressive dose – include weight bearing – during maintenance chemotherapy & after treatment some days of the week
Strengthening games
Consensus based recommendations for exercise among children during treatment for or following
a cancer diagnosis

Source Age Aerobic Resistance Training
American Cancer Society
Children and adolescents
60 minutes of moderate to vigorous physical activity 5 days per week
None specified
Braith (2005)
None specified
30-40 minutes at 65-85% of heart rate reserve 3 days per week if no cardiomyopathy HR 10 beats below any symptoms detected during exercise testing. Start with 2-6 minutes activity alternating with 1-2 minutes rest if cardiomyopathy
1 set 8-12 reps all major muscle groups 2 times per week 1 set 8-12 reps at 40-60% one rep max 8-10 machines 2-3 times per week
Consensus based recommendations for exercise among children during treatment for or following
a cancer diagnosis
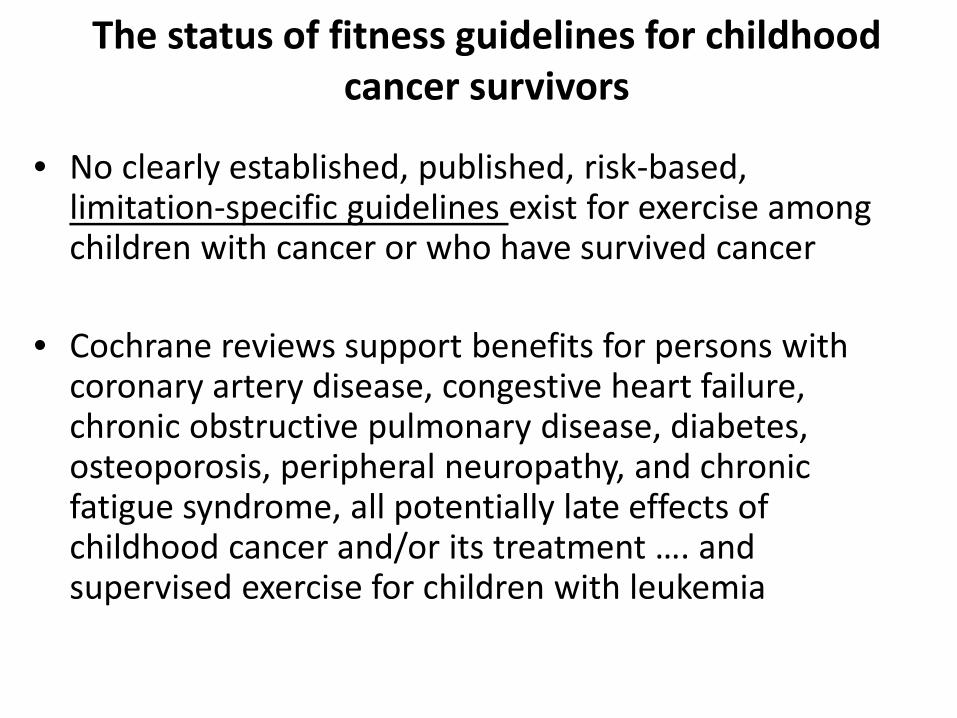
The status of fitness guidelines for childhood cancer survivors
• No clearly established, published, risk-based, limitation-specific guidelines exist for exercise among children with cancer or who have survived cancer
• Cochrane reviews support benefits for persons with coronary artery disease, congestive heart failure, chronic obstructive pulmonary disease, diabetes, osteoporosis, peripheral neuropathy, and chronic fatigue syndrome, all potentially late effects of childhood cancer and/or its treatment …. and supervised exercise for children with leukemia

Examples - approaches
• Among adult survivors – Safety – Efficacy
• Among children on therapy – Prevention
• Among children/adolescents off therapy – Lifestyle modification (habits)

Resistance and aerobic exercise for
subclinical anthracycline cardiomyopathy
• 12 week exercise intervention in survivors of childhood cancer with anthracycline induced cardiomyopathy
• Aerobic exercise (20-45 min sessions, 3-5 times/wk.) • Resistance training (8-10 exercises, 12-15 reps each
exercise, 2-3 times/wk.) • Compliance monitored with logs and weekly phone calls
from exercise specialist
Smith, Pediatr Blood Cancer. 2013; epub

Mean values for outcomes Pre Post
Weight (Kg)
65.7 64.5
Body Fat (%)
28.1 27.0
Maximal Oxygen Consumption (ml/kg/min)
21.6 26.0
Leg Extension at 60 degree per second (Nm)
172.3 198.7
Ejection Fraction (%) 43.8 49.4 N=5, 3 males, median age 38 (range 33-41) years Diagnoses 4 osteosarcoma, 1 Ewing’s sarcoma

Future – Resistance Training & Dietary Supplementation for Survivors
To evaluate the effects of 24-week supervised resistance training with protein supplementation compared to resistance training alone or usual care on muscle mass and strength, physical performance and biomarkers of metabolic health among young adult survivors of childhood cancer.
Intervention 1 Resistance exercise &
supplement
Control
T1 - Baseline
assessment
T2 - End of intervention assessment
24 weeks
Randomization
18 -39 years Lean muscle mass < -1.5
SD for age, sex, race
Intervention 2 Resistance exercise
T2 - End of intervention assessment
T2 - End of intervention assessment
Offered intervention

Aerobic and strength training during maintenance therapy for childhood ALL
Body Mass Index
Knee extension strength
Grip strength
Sit and reach test
Ankle Dorsiflexion
Six minute walk distance
% change -3.0 11.1 16.9 42.2 81.4 16.0
12 children with ALL, age 5-10 years, receiving maintenance therapy, in first remission. Six month home-based intervention, with written and video instruction, was supervised with weekly calls from an exercise coach. Results: Seventeen patients enrolled (participation 63%).

Future – Aerobic Training for Children with Medulloblastoma
To evaluate the impact of aerobic training intervention on fitness, neurocognitive function, physical performance, fatigue and quality of life in children with medulloblastoma
Intervention Aerobic training intervention &
physical therapy
Control Physical therapy
(standard of care)
T1 - Baseline
assessment
T2 - End of intervention assessment
T3 First follow-up
assessment
T4 Second follow-up
assessment
Radiation (6 weeks)
Home (4-6 weeks)
Chemotherapy (4 -7 months) 3 months
Randomization
T2 - End of intervention assessment
T3 First follow-up
assessment
T4 Second follow-up
assessment
Surgery

Baseline assessment
Accelerometer & educational
materials
End of intervention assessment
Six months post
intervention assessment
One year post intervention assessment
Website access,
accelerometer & educational
materials
End of intervention assessment
Six months post
intervention assessment
One year post intervention assessment
Future - web-based intervention to promote physical activity among children and adolescents with ALL
First 3 months after completion of therapy
Randomization Reminder to connect at 2 and at 6 weeks
To evaluate the effects of a six month rewards-based physical activity intervention delivered via an interactive website in children following treatment for ALL

Thank You!