aerospace sciences meeting & exhibit january 15-18, 1996 ... · measuring the electrical...
TRANSCRIPT

AIAA 96-0486
Electrostatic Charging of the PathfinderRover
Mark W. Siebert
University of ToledoToledo, OH
Joseph C. KoleckiNASA Lewis Research Center
Cleveland, OH
34th Aerospace SciencesMeeting & Exhibit
January 15-18, 1996 / Reno, NV
For permission to copy or republish, contact the American Institute of Aeronautics and Astronautics370 L'Enfant Promenade, S.W., Washington, D.C. 20024
https://ntrs.nasa.gov/search.jsp?R=19990014049 2020-03-22T22:24:42+00:00Z

AIAA 96-0486
ELECTROSTATIC CHARGING OF THE PATHFINDER ROVER
Mark W. Siebert
University of Toledo
Toledo, OH
Joseph C. Kolecki
NASA Lewis Research Center
Cleveland, OH
ABSTRACT
The Mars Pathfinder mission will send a
lander and a rover to the martian
surface. Because of the extremely dry
conditions on Mars, electrostatic
charging of the rover is expected to
occur as it moves about. Charge
accumulation may result in high
electrical potentials and discharge
through the martian atmosphere. Such
discharge could interfere with the
operation of electrical elements on therover.
A strategy was sought to mitigate this
charge accumulation as a precautionary
measure. Ground tests were performed
to demonstrate charging in laboratory
Copyright © 1995 by the American Institute of
Aeronautics and Astronautics, Inc. No
copyright is asserted in the United Statesunder Title 17, U.S. Code. The U.S. "
Government has a royalty-free license to
exercise all rights under the copyright claimed
herein for Government purposes. All other
rights are reserved by the copyright owner.
conditions simulating the surface
conditions expected at Mars. Tests
showed that a rover wheel, driven at
typical rover speeds, will accumulate
electrical charge and develop significant
electrical potentials (average observed,
110 volts). Measurements were made
of wheel electrical potential, and wheel
capacitance. From these quantities, the
amount of absolute charge was
estimated. An engineering solution was
developed and recommended to
mitigate charge accumulation. That
solution has been implemented on theactual rover.
INTRODUCTION
A free ranging, solar powered surface
rover will be delivered to Mars as partof the Pathfinder mission. Pathfinder
will be launched in December, 1996,
and will land on Mars on July 4, 1997.The rover will travel about on the
martian surface, conducting technology
experiments and serving as an
instrument deployment mechanism
(Ref. 1). Because of the extremely dry

conditions on Mars, electrostaticcharging of the rover is expected tooccur as it moves about. Experimentsconducted in a simulated martianenvironment at the NASA LewisResearch Center have shown that arover wheel, driven at typical roverspeeds, will accumulate electricalcharge on the order of 8 X 10 _ C, and
develop electrical potentials averaging110 V with transients 2- to 3-times that
value.
Voltages of 100 V and greater are
believed sufficient to produce electrical
discharge in the Martian atmosphere.
Also, with an accumulated net charge of 8X 10 _ C, and average arc time interval of
1 _s, arcs can occur with estimated arc
currents reaching almost 10 mA.
Discharges of this magnitude could
interfere with the operation of sensitive
electrical elements on the rover (Ref. 2,
3,4).
In laboratory tests, a typical wheel was
driven in Arizona Lunar Simulant (ALS).
This material was chosen because of its
availability (from NASA/JSC), and its
relatively low outgasing rate, enablingchamber pumpdown to be
accomplished within a single day.About a pound of the material wasused.
When the wheel was driven at typical
rover speeds (.76 - 1.5 cm/s) in theALS, electrical charging occurred. The
charge accumulated was determined by
measuring the electrical potential of the
wheel using a capacitively coupled
electrostatic probe, and multiplying the
result by the wheel capacitance
(approximately 74 pico-farads). The
charge is believed to arise during
compaction of the ALS by the movingwheel.
To dissipate accumulated electrical
charge, a metal point was attached to
the wheel. On the average, the wheel
without any point developed an
average steady-state electrostatic
voltage of 110 V. Adding a discharge
point resulted in electrical potential
reductions of up to 15 - 20% of the
steady state value. The reduction in
potential is believed due to the
dissipation of image charge from
conducting surfaces of the wheel.
Charge connected with adherent dust
grains bleeds off very slowly due to the
low conductivity of the dust.
As a result of the tests conducted at
Lewis, and recommendations made to
JPL, the Pathfinder rover will
incorporate small wire discharge points
on the rover at the base of the rover
antenna. This component is electrically
continuous with the other parts of therover.
EXPERIMENT DESCRIPTION
In December, 1993, a memo was sentto the Pathfinder Office at the Jet
Propulsion Laboratory (JPL) which
stated the result of a preliminary
calculation made of rover potential and
charging rate. While the calculation was
only an estimate, it pointed to

possibilities that were of interest to thePathfinder team. As a result of thiscommunication, NASA Lewis wasrequested to perform laboratory tests todetermine whether charging was a realissue, and whether it could be mitigatedby addition of a discharge point.
A Mars simulator facility had alreadybeen set up to conduct tests for theWheel Abrasion Experiment (WAE, Ref.5). This facility was adapted to examinethe problem of electrostatic charging. Acapacitively coupled electrostatic probewas installed, and tests were run with asimulated Mars surface atmosphereandArizona Lunar Simulant (ALS).Experiments were conducted with twodifferent wheels, hereafter referred toas the test wheel and the SystemIntegration Model (SIM) wheel. The testwheel was a crude mock-up of therover wheel, made to approximatedimensions. The SIM wheel was a moredetailed model of the flight wheel. Bothwere driven at typical rover speeds.Charging was found to occur.
The rover wheel, driven at typical rover
speeds, accumulated an electrical
charge of about 8 X 10 _ C, and
developed electrical potentials on the
order of 110 V with transients 2- to 3-
times that value.
Facility Description
The Mars simulator facility is a 62 cm
diameter by 62 cm long vacuum
chamber. For charging tests, the
chamber was initially pumped to a
background pressure of 8x10 6 torr,
then filled with Martian atmospheric
simulant (approximate composition:0.03% water, 0.153% carbon
monoxide, 0.336% oxygen, 1.36%
argon, 2.52% nitrogen, and balance
carbon dioxide) to a pressure of 7
mbar. The wheel was mounted in a
rotary tray filled to a depth of 15 mmwith ALS, and driven with a variable-
speed motor, external to the chamber.
A xenon arc lamp provided a collimated
light source to the wheel through a
quartz window. A computer connected
to an analog-to-digital converter
continuously recorded data during the
tests. (Fig. 1 ).
Procedure
The test wheels were run at speeds of
0.6 to 5.4 rpm. (The speed of the flightunit rover wheel on Mars will be 0.6 to
1.2 rpm). All outputs from wheel
diagnostics were recorded. Test
duration was typically > 1000 s. The
electrostatic probe was initially zeroed
to chamber ground prior to each test,
then repositioned and held
perpendicularly to the wheel at 2 mm
during the test. All tests were
conducted at room temperature, 23 °C.
Two different wheels were used: the
test wheel and the SIM wheel. Two
types of discharge points wereattached to each of the wheels: a 12.7
pm radius stainless steel wire cut at the
end, and a tungsten wire
electromachined at its end to a point of
radius 1 pm (Fig. 2).
3

For the test wheel, the 12.7 gm
stainless steel point and the tungsten
point were soldered to a braided copper
wire. The braided copper wire was
wrapped around the wheel and held
down with Kapton tape. The braided
copper wire with the discharge point
was brought to the wheel axle, and
extended outward 5 cm. (Fig. 3).
For the SIM wheel, the tungsten and
12.7 ]_m steel points were soldered to a
copper wire. The copper wire was held
in contact with the wheel by one of the
cap screws on the rim. The copper was
brought to the wheel axle, andextended 5 cm as before.
RESULTS AND DISCUSSION
Mechanisms assumed responsible for
wheel charging included dust
compaction, and friction of the wheel in
the ALS. These assumptions were
tested in simple experiments.
1. The wheel axle was deliberately
jarred while the wheel was charged.
Large quantities of dust were observed
to fall from the wheel, and the potential
immediately dropped from 70 V to <12V.
2. A braking force was applied to the
tray increasing slippage of the wheel
from a nominal 10% to close to 100%
in the ALS. No substantial changes in
potential were noted.
3. The weight of the wheel was
changed. Electrostatic charging was
measured with and without a
counterbalance. (In its usual
configuration, the wheel was
counterbalanced to a net load of 500
gm, the weight on one wheel of the
rover in Mars gravity. When the
counterbalance was removed, the load
on the wheel increased to 1588 gm.) A20% increase in wheel electrical
potential was observed with the higherload.
These simple experiments implied that
the dominant mechanism of charge
generation was associated with dust
compaction. Small grains assumed a
positive charge, larger grains, a
negative charge. The smaller grains
were light enough to adhere to the
wheel surface, and carried their net
positive charge with them. The
electrostatic probe registered the
corresponding electrical potential. Theentire metal surface of the wheel
became charged through image charge
generation. The addition of a point
removed some of the image charge,
allowing the wheel potential to drop
proportionally. The track behind the
moving wheel became charged with an
equal charge of opposite sign. This
charge was also observed with the
electrostatic probe.
Test Wheel
A plot of electric potential vs. time for
the test wheel is shown in Fig. 4. The
initial transients and the steady state
4

region are labeled. These data were
taken with no discharge point on the
wheel. The potential settles to its
steady-state value within sixrevolutions.
Comparison of the steady-state
potentials with no discharge point, a
12.7 _zm stainless steel discharge point,
and the tungsten point are shown in
figs. 5. Each of the two types of points
produced about the same reduction in
voltage. Increasing the number of 12.7
_m radius stainless steel points from 1
to 7 gave no further reduction in
potential.
The effects of wheel loading and of
adding a discharge point to the wheel
are shown in Fig. 6. A wheel with a
load of 500 gm and seven 12.7 _zm
radius stainless steel discharge points
shows a reduction in steady-state
potential by 14% 1 over a wheel with no
point at comparable speeds. Retaining
the seven points on the wheel, and
increasing the wheel load from 500 gm
to 1588 gm produced an increase in
steady state potential by 16%. With
no discharge point, increasing the
wheel load from 500 gm to 1588 gm
increased the steady state voltage by25% at similar speeds.
A very slight dependence of voltage on
wheel speed is also seen in Fig. 6.
'o
z Percentages quoted are obtained byaveraging over all data points.
SlM Wheel
The steady-state potentials of the test
wheel, with 500 gm load, no discharge
point, a 12.7 ]_m stainless steel point,
and a tungsten point are shown in Fig.
7. The initial voltage transient of the
wheel may be as large as three times
the steady-state voltage. The reason forthis transient is not clear. A chamber
related effect might be the most
reasonable first assumption. But since
demonstrating rover charging and
possible mitigation schemes were the
primary objectives of these tests, and
since time was short, a good deal ofadditional science was left undone.
Discharge Curves
The SIM wheel was initially charged by
running it in the ALS. The wheel was
then stopped and allowed to dischargeinto the test environment. Wheel
potential was recorded during
discharge. The resulting data were
fitted to a decaying exponential andtime constants were inferred. These
time constants are:
3555+430 s, no discharge point
2898+386 s, 12.7 ]_m point
2553+340 s, 1 ]_m point
Data are averaged over the range of
speeds, 0.6 to 5.4 rpm. Comparison
with the case of no point shows that
the time constant is lower by ==20%
when either the 1 i_m or the 12.7 ]_m
discharge point is present. The

discharge points have a significanteffect on dischargerate of wheel.
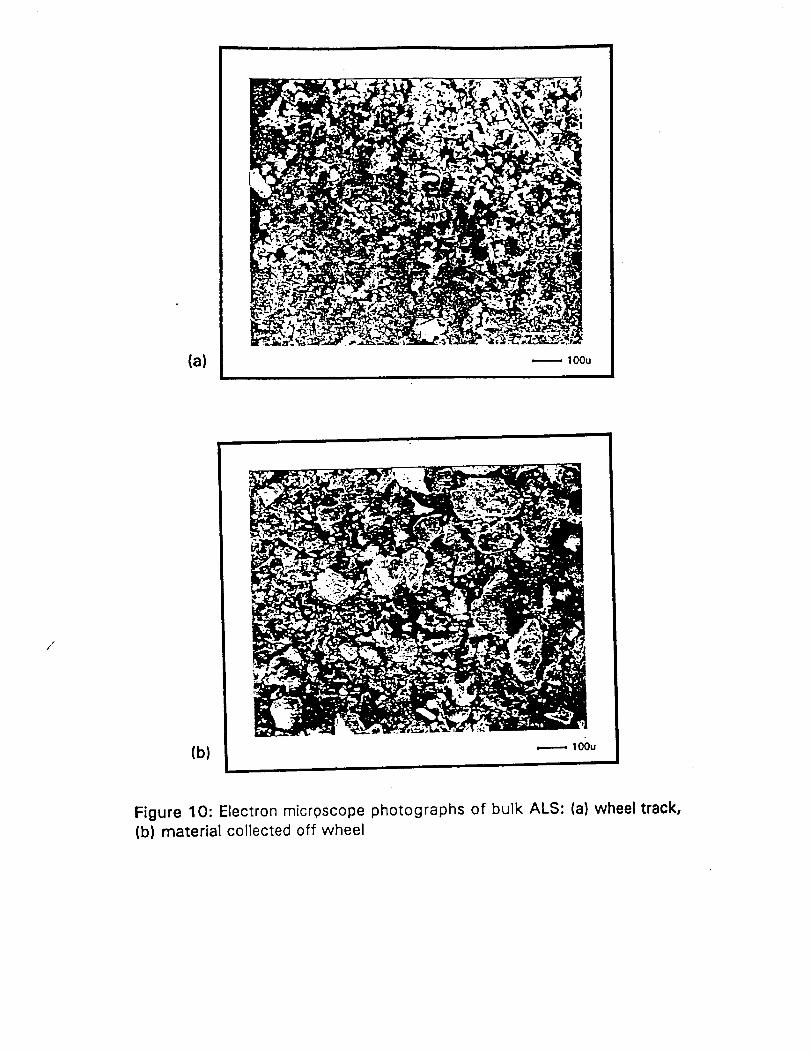
20 _m (Fig. 10 a), compared to the100 ]_mof the bulk sample(Fig. 10 b).
Dust Charging Capacitanceof SIM wheel
The negative charge left behind by the
SIM wheel after its passage over the
ALS was measured with the
electrostatic probe appropriately
repositioned. This charge was recorded
for all three point configurations of
points (above), and different wheel
speeds. Results are shown in Fig. 8.
The dust charged negatively to
approximately the same absolute value
of potential as the wheel. Grain size
measurements (see below) showed that
small grains adhered to the wheel, large
grains did not. The negative values of
the ALS potential reveal the charge
separation between these differently
sized grains.
Electron Microscopy of Arizona LunarSimulant
The scanning electron microscope wasused to determine the size and the
shape distributions of the Arizona Lunar
Simulant. Energy Dispersive X-ray
Analysis (EDX) spectra were also taken
to confirm its chemical composition. A
typical EDX spectrum, with elemental
peaks labeled, is shown in Fig. 9. (The
Au peak is due to a 200 A thick sputter
coating to discharge the ALS particle
surfaces). Electron microscop.e
photographs were taken of the material
that adhered to the wheel. The average
grain diameter of the simulant thatadhered to the wheel is on the order of
The capacitance of the SIM wheel
(without the discharge point attached}
was measured with the chamber
backfilled with 7 mbar Martian
atmosphere simulant and Arizona Lunar
Simulant. A capacitance meter, with a
range of 1 pF to 200,000 mF, was
connected through an electrical
feedthrough between the wheel and
the chamber (ground). The capacitance
of the wheel relative to the chamber,
averaged over three sets of
measurements, was found to be 74 pF.
Thus at a mean potential of 110 V, the
absolute charge of the wheel may becalculated as 8.1 X 10 .9 C.
CONCLUSIONS
The tests reported indicate that the
Pathfinder rover, in its traverses over
the martian surface, may become
sufficiently charged to raise its electrical
potential to within the neighborhood of
1 10 V. Voltages of 100 V and greater are
believed sufficient to produce electrical
discharge in the Martian atmosphere.
Also, with an accumulated net charge of 8X 10⁴ C, and average arc 5t of 1 ps, arcs
can occur with estimated arc currents
reaching almost 10 rnA Discharges of
this magnitude could interfere with the
operation of sensitive electricalelements on the rover.

In the nominal mission on Mars, the
rover will travel approximately two
meters per day. During that time, the
wheel will make at least five complete
revolutions in the martian regolith.
Experience with fine, dry clays interrestrial laboratories demonstrates
that charging is commonplace. It is not
unreasonable to expect that the rover
on Mars may charge more strongly
than the wheel did in the laboratory.
Discharges between active
components, or between the rover and
its surroundings may become very
likely. Since actual martian conditions
are unknown, discharge points will beadded to the Pathfinder rover antenna
base as a precaution against
electrostatic charging. Future missions
should seriously consider including
components to measure vehicle
charging. Possibilities might include an
electroscope, or an optical means for
detecting luminosity from electrical
discharges taking place in and aroundthe rover.
FINAL REMARK
During our investigation, the questionarose whether a circuit model exists for
charging/discharging the Pathfinder
rover on Mars. Speculation is all that is
possible at the moment. The rover will
accumulate its charge from surface
dust, then deliver some of that charge
into the atmosphere through a point
with a high electric field. Dust blowing.by the rover in the martian surface
wind will accumulate this charge and
eventually fall back to the martian
surface completing a circuit loop. The
closest analogy is a Van de Graft
generator in which the moving rover is
the source of static charge, the point is
the brush, the wind blown dust is the
belt, and the martian surface to which
the dust eventually, returns is the
accumulator. Perhaps an analog circuit
model of this mechanism may bedeveloped once more is known of the
electrical characteristics of the actual
martian surface material that will be
encountered.
REFERENCES
1. "Mars Pathfinder Fact Sheet, Mission
Summary", October 20, 1994, JPL400-538.
2. Haberle, R. M. and Greeley, R.
"Sand and Dust on Mars", NASA CP
10074, February, 1991, pg. 39.
3. Hillard, G. B. and Kolecki, J. C.,
'q'he Interaction of High Voltage
Systems with the Environments of the
Moon and Mars", NASA TM 106107,
AIAA-93-0704, January, 1993.
4. Kolecki, J. C. and Hillard, G. B.,
"Electrical and Chemical Interactions at
Mars Workshop, Final Report, Parts 1
and 2", NASA CP 10093, November,1991.
5. Layman, W. E, Matijevic, T. R.,Mishkin A. M. and Sorota A. R.,
"Microrover and LMRE Technical
Baseline", Feb. 6, 1995, JPL MPF
ROVER DFM 93- 006S.
7

_JBCUUm Tank ---.... Ground plane
E_ectrostattc Probe
Photoce_,\
Arc
-X
LinearFeedthroughs
4-
• ,_bl=_ Rover Whee Arizona LunarSimu\ant
!
Figure 1: Schematic (al and photograph {b} of test facility

Figure 2: Electron microscope photograph of tungsten discharge point (scale
on photo)

(a)
(b)
Figure 3: Test Wheel (a); SIM Wheel (b)

250"
2OO
A
> 1 50
(Y,0
o 100:>
50
-- Initial Transients --
_Steody-Stote Region --
0 5 10 15 20
Revolutions
Figure 4: Typical plot of test wheel potential as a function of number of
revolutions (0.7 rpm, 500 gm load, ALS, 7 mbar martian atmosphere)
14O
---- 120>
v
u_ 100o
o
> 80
o
_ 60I
o 40
U'l
20
.... 0''"
,----.11-.----
no discharge point| -1 micron discharge point! -1 2.7 micron dischorge points7-1 2.7 micrun discharge point
0-.--0.--0 ............................................................. 0
0 , I , I , I , I _ I _ !
0 1 2 .3 4 5 6
Wheel Speed (rpm)
Figure 5: Dependence of test wheel steady state potential on type.of
discharge point (500 gm load)

_>
03
oRo
_>03
o
GOI>_
"1oo03
,.t..m
(/1
140
120
100
80
60
40
20
0 , I
0 1
D ...............
_e...d
.°. ..............................
.............................................................. 0
.... 0..o
.... E]o.°
7-1 2.7 micron pts., 500 gm load7-1 2.7 micron pts.. 1.588 gm loadno d{scharge point, 500 gm loadno discharge point, 1588 gm load
t , I , l _ I , J
2 ,3 4, 5 6
Wheel Speed (rpm)
Figure 6: Dependence of test wheel
of discharge point
steady State potential on load and type
_>
03
o_c)
o
03
O.,_.,
GOI>.,
noo03
,.=._,
GO
140
120
100
80
60
40
2O
0
.... 0 "'" no discharge point
.... ,k "o" I micron discharge point1 2.7 m_cron discharge point
<3".0. "'0.- -0 .............................................................. 0
_...i
0 1 2 3 4 5. 6
Wheel Speed (rpm)
Figure 7: Dependence of SIM wheel steady state potential on type of
discharge point (500 gm load)

0
>v
o
0>
o
(/)I
>,
o0_
O3
-20
-40
-60
-80
-1 O0
-1 2O
-1 40
-1 60
-1 8O
-20O
.... 0""
.... I1,,.
A
_:ToIN ".A--.A
'..0. • .......
- ..... °...
,.
0
no dlschorge point1 micron dischor(:Jepo;nt12.7 micron discharge point
"''--......
.-° ...... .."'"n
, I , I , ! , I , I , I
0 1 2 3 4 5 6
Wheel Speed (r'pm)
Figure 8: ALS potential with SIM wheel and different discharge conditions
(/)
0
Beam Current: 0.6 nanoa_o Count Time: 200 sec Acce]enat_ng Potential: 20.0 kV
o |OOx survey Arizona t,unar Sand
'lL) i
ej
o _ i ..i....................................
° ! ! ! i ! ! ....... " ! ! ! !! 2 3 4 5 7 8 lO |! I;_ 13 14
Figure 9: Energy Dispersive X-Ray Analysis of .&LS
KeV
(a) ,..._--,100u
/
Figure 10: Electron microscope photographs of bulk ALS: (a) wheel track,
(b) material collected off wheel

VOLUME 40(1997), 2, 321_-329;11:[o]I(eIe_'A'u;f:.11K_.To_dToLl.'_r
A New Antiwear Additive/Surface Pretreatment for
PFPE Liquid Lubricants ©
WILFREDO MORALES (blember, STLE) and ROBERT L. FUSARO (Fellow, STLE)
National Aeronautics and Space Administration
Lewis Research Center
Cleveland, Ohio 44135
MARK SIEBERT and THEO KEITH (Member, STLE)
University of Toledo
Toledo, Ohio 43606
and
RALPH JANSEN (Member, STLE) and PILAR HERRERA-FIERRO (Member, STLE)
Ohio Aerospace Institute
Cleveland, Ohio 44135
t_'n-on-disk tribology experiments were conducted on a perfluoro-
polyalkylether (PFPE) liquid lubricant with and without a new PFPE
lub_cant antiwear additive material." a silane. It was found that the
silane provided moderate improvement in the antiwear performance
of the PFPF lubricant when applied to the metallic surface as a
surface coating or when added to the PFPF as a dispersion (emul-
sion). Slightly better results were obtained _, using the combination
of a surface coating and an emulsion of the silane. The silane emul-
sions or coatings did not affect the friction properties of the lubncant.
Micro-Fourier transformation infrared (_:'I'IR) spectroscopy analysis
was performed to study silane transfer films and the degradation of
the PFPE. The silane was found to mitigate degradation of the PFPE
which may have been the major reason for the improved antiwear
performance observed.
KEY WORDS
Lubricants, Antiwear Additives, Polyethers. Surface Analyt-
ical Techniques
INTRODUCTION
A class of high molecular weight liquid perfluoroethers,
which were designated perfluoropolyalky[ethers (PFPEs), was
synthesized in the 1960s (1), (2). These liquids possessed
excellent high temperature stability and low vaporization
pressures and, thus, were immediately recognized to have po-
tential for use in aerospace applications. While PFPEs have
been used successfully as diffusion pump oils (3), dielectric
fluids (4), and as lubricants (5), their potential as outstand-
Presented at the 50th Annual MeetingIn Chicago, Illinois
May 14-19, 1995Final manuscript approved December 21, 1995
ing aerospace lubricants has not been realized. The main
reason has been that they tend to decompose under bound-
ary lubrication conditions, generating extremely reactive
fluorinated products that can attack metal surfaces leading
to increased wear and corrosion.
One method for mitigating PFPE decomposition is the use
of soluble additives in the liquid lubricant, but the difficulty
is that known additives for hydrocarbon-based liquid lubri-
cants are not soluble in the PFPEs. This has led to studies
(6), (7) investigating the use of highly fluorinated com-
pounds as potential soluble additives for PFPEs. One possible
drawback for the use of fluorinated additives is that many of
these compounds have much lower vapor pressures than the
PFPEs. Another drawback is that these additives may decom-
pose, generating reactive fluorinated products.
Static thermal tests have shown that PFPEs decompose at
elevated temperatures in the presence of certain metal oxides
or metal fluorides, and it has been suggested that active Lewis
acid sites on metal oxides or fluorides are responsible for
PFPE catalytic decomposition (8)-(10). Recent studies, how-
ever, have indicated that Lewis acid sites may not be respon-
sible for decomposition (11)-(13). For example, Ng et al.
(12) observed that perfluorodiethylether decomposed on
both untreated and pyridine-treated dehydroxylated alumi-
num oxide surfaces. Since pyridine is a compound widely
• used to block the action of Lewis acids, the results suggested
that Lewis acid sites were not the reason for decomposition.
Ng et al. also observed that perfluorodiethylether did not
decompose on dehydroxylated alumina surfaces treated with
a (CHs)3-SiCI vapor. They suggested that the following re-
action took place which passivated (silylated) the alumina
surfaces:
AI-OH + CISi-(CH3) a _ AI-O-Si(CHs) 3 + HCI
Morales (13) decomposed a commercial PFPE on both
alpha and gamma alumina surfaces at and above 200°C. He
321

322 W. MORAI.ES, R. L. FUSARO, M. SIEBERT, T. KEITH, R. JANSEN, AND P. HERI_ERA-FIERRO
found that a pyridine treatment of the alumina surfaces did
not prevent PFPE decomposition. He did observe, however,
that by treating the surfaces of the alumina with various liq-
uid silanes the decomposition of the PFPEs was mitigated.
Surface treatment with one particular silane, 3-aminopropyl-
triethoxysilane, prevented decomposition up to 350"C.
The static decomposition studies by Ng et al. and Morales led
to the idea of using a silane to minimize PFPE decomposition
and the wear of the sliding surfaces under boundary lubrication
conditions. To evaluate this concept, an experimental program
_-as developed using a pin-on-disk tribometer to investigate the
friction, wear and degradation of a PFPE oil under boundary
lubrication conditions over short- and long-term sliding condi-
tions. The silane was applied as a coating to the sliding speci-
mens or as h dispersion (emulsion) to the PIPE liquid. Optical
microscopy and micro-Fourier transformation infrared (IxFTIR)
microscopy examinations of the oil and surfaces were conducted
to evaluate decomposition products.
EXPERIMENTAL
Test Variables
To studv the effect of a silane coating and/or emulsion on
the friction, wear, and degradation properties of a PFPE oil,
the follo,_ing conditions were evaluated: silane emulsion, st-
lane disk coating, silane disk and pin coatings, silane emul-
sion and silane disk coating, silane emulsion and pin and disk
coatings, and no treatment.
Materials
The disks used were made of 440C stainless steel with a
Rockwell hardness of C.-57 to C-59. The disks were lapped
and polished to a surface finish of 0.040 ___0.015 p.m cen-
terline average (CLA). Instead of using pins, the pin holder
was modified to hold 0.476 cm radius (three-eighths inch
diameter) commercial grade 10, 440C balls which had the
same surface roughness as the disks. The hardness of the
balls was Rockwell C-60.
Properties of the PFPE and silane (3-aminopropyhriethoxy-
silane) liquids used in this study are given in Table 1 and the
following are the structures:
The Perfluoropolyalkylether
C3F70 (-CF-CFo-O-) n C,2F_,
CF3
The Silane
TABLE i--PRoPERTIF..S OF PFPE AND $1L._',;ELIQUIDS
PROPERTY ORC_'<OSlI..ANE
Average Molecular Weight
Density, (g/cm _)
Refractive Index
Viscosity (cST)
Vapor Pressure (Torr)
Pour Point (°C)
Boiling Point (°C)
Flash Point (°C)
PFPE
I 1,000
1.92 (20"C)
< !,3 (20°C)
27 i 7 (20°C)
63 (IO0°C)3 310 -t4 (20°C)
1 3 -9 (IO0°C)
-15
None 217
None 104
221.$7
0.941 (200C)
1.421 (20°C)
Friction and Wear Apparatus
The pin-on-disk tribometer used in this study, shown in Fig.
1, has been described in detail in Ref. (14). The specimens
consisted of a flat rotating disk (6.3 cm diameter) in sliding
contact with a stationa D' pin (ball) (0.476 cm radius) which
was securely fastened in a holder. The ball slid on disk tracks
that ranged from 4.8 cm to 3.7 cm in diameter. The rota-
tional speed of the disk was controlled at 200 rpm giving
linear sliding speeds of 0.50 to 0.39 m/s. The test specimens
were encased in a plastic box to control the atmospheric hu-
midity, A load of 2 kg was applied to the ball, which gave an
initial maximum contact stress of 1.3 GPa (190,000 psi). A
polyethylene ring was fastened around the diameter and ex-
tended approximately 0.4 cm above the surface of the disk
to restrain the oil from being thrown from the disk by cen-
trifugal forces. The amount of oil used for each test was 2 g.
Surface Cleaning
The ball and disk cleaning procedure was as follows:
1. Wash surfaces with ethyl alcohol.
2. Rub surfaces with a water paste of polishing alumina
(particle size 0.3 p.m). Clean until water readily wetted
the surfaces.
3. Scrub surfaces under running tap water with a brush to
remove alumina.
O--CH,2--CH_
IC H 3-CH,r-.O-Si-O-C H _,--CH:_
ICH2
ICH2
ICH_
INH2
Strain gauge /-/Applied
load
_ Environmentalhamber
Ball holder
Gismba/ly .., Translationplate
Fig. l_Pin-on-disk tester.

1_ ._ew __nt_wear ACC:t:ve/Su._.ace-l_retreatment_or !'4:!'L Liquid Lubricant_ ................. 323
4. Rinse in deionized water.
5. Dry, surfaces by blowing on with clean compressed air.
Emulsion Preparation
A one percent (by weight) emulsion of the silane was pre-
pared by first adding the appropriate amount of the silane
to the PFPE in a test tube. Since the silane was insoluble in
the PFPE, the test tube was placed in an ultrasonic cleaner
for I0 minutes to mix the two liquids. The ultrasonic agita-
tion caused the formation of a milky white emulsion.
Coating Application
A one percent (by weight) of the silane in a methanol so-
lution was prepared by adding the appropriate amount of the
silane to 100 ml of methanol in a 500 ml beaker. A polished
440C disk was then immersed into this solution for 15 minutes.
The disk was carefully withdrawn, placed inside a petri dish
and then covered. The covered petri dish was then placed
inside a furnace (maintained at 200°C) for 30 minutes. This
method produced a coating approximately 3 I-tin thick.
Emulsion Stability Testing
A small quantity of the emulsion was poured into a sample
bottle, sealed, and left to stand for two months. Periodic
visual inspection was conducted to check for separation. In
addition, a small quantity of the emulsion was placed in a
centrifuge and spun at 2500 rpm at a radius of 10 cm for
10 minutes. In an additional test, some of the emulsion was
heated in glassware at 250°C for 30 minutes under a partial
vacuum (<5 Torr).
Thermal Gravimetric Analysis Testing
Thermal gravimetric analysis (TGA) tests were conducted
on the pure PFPE, the silane and the mixture. A small quan-
tity of each liquid was injected onto an aluminum pan, and
the pan was then loaded and sealed (under a flowing N,,
atmosphere at 60 ml/min) inside the TGA system. The TGA
temperature was ramped at a rate of 10oc per minute from
room temperature to 360°C.
Friction and Wear Testing
Two grams of oil (with or without the emulsion) were ap-
plied to the disk (with attached polyethylene ring). The ball
(securely fastened in its holder) and disk were inserted into
the friction and wear apparatus and properly aligned. The
test chamber was then sealed and purged with dr)' air (100
ppm moisture content) for 15 minutes before commencing
the tests. This purge was continued throughout the tests. Af-
ter the 15-minute purge, the disk was set into rotation at 200
rpm and a two-kilogram load was gradually applied to the
ball. The test temperature was 25"C.
Each test was stopped after one kilocycle (kc) of sliding.
At 200 rpm this is five minutes. The ball holder was removed
from the apparatus and the wear area on the ball was ex-
amined by optical microscopy and a wear measurement was
made. The holder was then placed back into the apparatus
and the previous test procedure was repeated. The ball was
not removed from its holder, and locating marks insured that
the holder was returned to its original position..
Each test was stopped and the above procedure was re-
peated after sliding intervals of 3, 7, 15, 30 and 50 kc of sliding.
Some tests were terminated at this point and some tests were
continued for long-duration sliding effects. The long-duration
tests were run continuously for up to two weeks (4300 kc or
500 km), being stopped once a day (or after the weekend) to
examine the ball wear scars and measure wear. Disk wear
tracks were examined by optical microscopy after the tests were
terminated (either 50 kc or the long-duration tests).
To determine the friction and wear protection of the silane
coating in a stand-alone condition, some tests were con-
ducted on the silane coating without using any PFPE lubri-
cant. Similar tiesting conditions were applied.
Data Analysis
The data analysis was performed by first entering the dis-
tance and wear volume for every sliding inten-al for each test
into a computer spreadsheet. Short-term data analysis consid-
ered data taken from the start of the test up to 5000 m of
sliding. Five data points were typically recorded in this pe-
riod. A least-squares regression fit, which was forced to inter-
sect the origin, was used to determine the short-term wear
rate for each test. Tests were grouped by treatment type and
the mean, maximum, minimum and standard deviation _l-
ues were calculated.
Long-term data analysis was conducted using a similar pro-
cedure except that only data collected between 25 km of slid-
ing and the end of the test were considered. The least-squares
regression fit in this case was not forced to intersect the or-
igin for the determination of the long-term wear rates. The
same statistics were calculated for each group of long-term
tests.
Sliding Surfaces Analysis
Optical microscopy techniques were used to study the lu-
brication films, the transfer films, and wear debris. The sur-
faces were viewed at magnifications to 1000.
A IzFTIR microscope was also used to obsen'e selected wear
surfaces after either 50 kc of sliding or after the long-duration
tests (_4300 kc). For information about the operation and
use of this spectrometer, see Refs. (15)-(17). The obsen-a-
tions were done in the reflectance mode. A gold-coated glass
slide was used as a background and the area of analysis was
a 100 gm-diameter circle. The ball and disk wear areas were
at least 300 l.tm wide; therefore, several spots vfithin the track
were analyzed in order to obtain a better perspective of the
surface composition. For comparison, off wear scar areas
were also analyzed. Before commencing the i.tFYIR analysis,
the specimens were rinsed with Freon TM and then cleaned in
an ultrasonic cleaner to remove excess lubricant in order to
obtain access to the deposits on the surface interface. A sur-
face profilometer was also used to examine the cleaned disk
wear surfaces.
RESULTS AND DISCUSSION
Emulsion Stability Tests
Visual inspection of the silane/PFPE emulsion that was left
to stand for two months on a shelf revealed the persistence

324 W. MORALES, R. L. FUSARO, M. SIEBERT, T. KEITH, R. JANSEN, AND P. HEP, RERA-FIERRO
of a milky white color, indicating that the two constituents
did not separate. In addition, no separation of the two ma-
terials was found to occur in centrifuge testing at 2500 rpm
for 10 minutes. Because of these tests, the emulsion was
judged to be exceptionally stable.
TGA testing of the emulsion and each constituent was also
conducted. Figure 2 shows the results. The TGA thermogram
for the pure silane, see Fig. 2(a), showed that nearly all the
silane had evaporated by 140"C, whereas the TGA thermo-
gram for the pure PFPE, see Fig. 2(b), showed that the PFPE
started to evaporate at about 2700C. The TGA thermogram
for the emulsion was the same as that of the pure PFPE in
Fig. 2(b). There was no evidence of silane evaporation from
the emulsion in the TGA tests; however, the amount of silane
present may have been too small to detect.
Because of the TGA results, it was decided to subject the
emulsion to a temperature that was higher than the boiling
point of the silane but lower than that of the PFPE. Thus,
the emulsion was heated under a partial vacuum to 250"C,
held at temperature for 30 minutes and then cooled to room
temperature. The emulsion still maintained its milky white
color and no separation could be observed, indicating no
evaporation of the silane had occurred. Vapor pressure mea-
surements of the pure liquids and the emulsion will be con-
ducted in the future to supplement the current work.
Ball Wear
Ball wear was evaluated for sliding distances of up to 4300
kc of sliding (500 kin). To determine if there were differ-
ences between short-term and long-term effects, wear rates
were calculated and compared for two sliding intervals: 0 to
30 kc (0 to 4.5 km) and 50 to 4300 kc (7.5 to 500 km). The
100
• 75
. 50r,
"_ 25
00
t L I
50 100 150 200 250 300 350
Temperature, *C
I400
100 -----
.. 95e-
9o
e-.._ 85
8O
75!cbl
0
I, I50 1O0
I I150 200 250
Temperature, *C
Fig. 2--Thermogravometrlc thermogrsms.
(a) liquid sllane
(b) PFPE
I I I !300 350 400
12x10-13
O
e_ 10--
e0
> 6 --_ o
o _ "--No treatment
¢ -- o j_'o/r- Oil emulsion/= 4m °o o J--'_coating(disk) n
2 _oO n
0 I0 1 000 2000 3000 4000 5000
Sliding distance, m
Fig. 3---BaU wear volume as a function of sliding distance for all the relic
conducted on a PFPE oil with no sllane treatment and for IIII t_tl
conducted on the same PFPE oil treated with a sllane emulsion
and a disk coating. The lines shown represent least--squsrls re-
gression fits of the data which was forced to Intersect the origin.
wear as a function of sliding distance for anv one particular
test was nearly linear during these two sliding intervals and,
thus, wear rates were calculated for each test using a least-
squares dat_ fit.
Figure 3 shows the experimental data and a least-squares
fit for the first 4500 meters of sliding for the lubricant con-
ditions of silane emulsion and silane disk coating and no
treatment. Besides having a lower wear rate, much less data
scatter was obtained for the oil emulsion/disk coating con-
dition as compared to the no treatment condition. The me-
dian ball wear rate results for all the test conditions are
shown in Table 2. The table also lists the number of tests
conducted under each condition, and the maximum, mini-
mum, and standard deviation of the ball wear rates. Figure 4
gives a comparison of the median pin wear rates and the data
scatter for the short-term tests and long-term tests.
For the short-term tests, it was found that the silane de-
creased the pin wear rate by an average of approximately 50
percent. There did not seem to be any clear advantage of
coatings over emulsions or of combining coatings with emul-
sions. However, it should be emphasized that neither the
coatings nor the emulsions were optimized in this study.
In general, ball wear rates were lower for the long-term
tests than for the short-term tests, which could be due to run-
in effects. In addition, the silane did not decrease the ball
wear as much for the long-term tests as it did for the short-
term tests. A possible reason for this is that some form of
mixed lubrication may be taking place. The authors have ob-
served in unpublished data on accelerated testing devices
(such as pin-on-disk and rub-shoe devices where there is 100
percent sliding) that, as the wear scar gets larger, the wear
rate decreases. Also, at some point, enough pressure is gen-
erated by the liquid to cause complete separation of the sur-
faces. When this happens, no further wear of the surfaces
occurs. Mixed lubrication may be happening in these tests.
The silane would not be expected to have as much beneficial
effect in mixed lubrication as in pure boundary lubrication.

TABIF 2----COMPARISON OF BALL WEAR RATES FOR SHORT- AND LONG-DuRA'HON TF..STSi
SHORT-TERM TESTS (0 to B0 kc) LONG-TERM TES_ (50 to 4500 kc)
OIL, DISK OR
BALL
i TRE.ATMENT
None
Oil Emulsion
Coadng (Disk)
Coadng (Disk
and Ball)
Oil Emulsion/
Coadng (Disk)
Oil Emulsion/
Coadng (Disk
and Ball)
NUMBER
OF TESTS
6
6
8
3
, PIN WEAR RATE (mS/m)
STANDARD
MAXIMUM MINIMUM MEDIAN DEVIATION
455x 10 =18
129
139
134
4 79
2 120
131 x 10-t8
21
34
62
5l
93
240x 10 -I8
81
84
91
65
107
120x 10 -as
36
34
38
12
19
PIN WEAR R.*,IX (mS/m)
NUMBER
oF TESTS MAXIMUM
7
4
6
2
4
MINIMUM
90Xl0 -ta 23X10 -t8
45 21
49 15
18 9
29 10
16 9
I STANDARD
.Mrd)L_.'_ [DLWIATION
48X 10-IS 31xl0 -18
31 13
27 12
14 6
21 8
12 5
Experimental Conditions: Temperature. 25"C; dry air atmosphere (100 ppm moisture content); load. 2 kg; speed. '200 rpm; 440C stainlc_ steel specimens.
5x10 -16
None4 m
E
E 3 --
_2--O
1
0 (a) [
• Mean wear rate o_e-
T Standard deviationo
a_
•
i i[ I I ITreatment
EO3Ee"
(9
10xl 0-17
None
8--
6 --
4
2 --
I0
___
o o 8 8 8g
Treatment
Rg. 4---ComlNtrleon of mean ball
(e) short-term tlmts
(b) long-term tests
wear rate= and standard deviations.
Coefficient of Friction
The friction results are presented in Table 3. In general,
no distinguishable effect on friction coefficient was found
which was dependent On either the silane emulsion or _e
silane coating. The maximum, minimum and median fricdon
coefficients obtained were essentially the same for all exper-
imental conditions. Variation from test to test tinder any one
particular experimental condition was fottnd to differ as
much as the variation from adding a silane emulsion or a
silane coating. Table 3 also presents the friction coefficient
of a silane coadng (run dry under the same conditions) for
comparison purposes. In the dry conclition, the silane coating
lasted less than 0.75 km (5 kc) of sliding.
Optical Microscopy
A comparison of the ball wear surfaces after 2 km of sliding
is shown in Fig. 5 for the following tests: a silane emulsion,
a silane disk coating, and no treatment. For both the silane
emulsion and silane coating tests, a much smoother wear scar
was obtained and FTIR analysis indicated a deposit of silane
was adhering to the wear scar. The ball scar from the test
with no silane treatment showed a very, rough surface, much
more black powdery wear debris and some plastic deforma-
tion of the scar in the exit region.
Figure 6 compares the wear tracks on 440C stainless steel
disks after very long durations of sliding under three differ-
ent PFPE lubricant conditions. Shown in the figure are a disk
track with a silane emulsion and coating after 250 km of slid-
ing, a disk track with a silane coadng after 237 km of sliding,
and a disk track with no silane treatment after 930 km of
sliding. Tlie disk track lubricated with PI-'PE with no treat-
ment shows a large amount of black powdery wear debris
(especially in the center of the track). The silane-coated diskshows a dark material on the wear track that appears to be
plate!el-like. The silane emulsion shows a disk wear track that
has nearly no visible deposits.
Photomicrog ,r',aphs of the ball wear surfaces were also taken
after long durations of sliding. Figure 7 shows a low and high
magnification photomicrograph of a ball wear scar after BS0
kin of sliding where the counterface was a silane-coated 440C
stainless steel disk. The ball wear scar is seen to be very
smooth and the transfer is thin and "platelet-like." p.FTIR
analysis of this scar showed that the transfer contained silane.
Figure 8 shows a photomicrograph of a ball wear scar after
'266 km of sliding where no silane emulsions or coadngs to

326 W. MORALES, R. L. FUSARO, M. SIEBERT, T. KEtTH, R..JANSEN, AND P. HERRERA-FIERRO
TABLE B---COMPARISON OF FRICTION COEFFICIENTS FOR SHORT- AND LONC_DURATIONTESTS
SHORT-TERMTESTS (0 to 30 kc) LONG-TE_M TESTS (50 to 4500 kc)
OIL, DISK OR
BALL TREATMENT
None
Oil Emulsion
Coating (Disk)
Coating (Disk andBall)
Oil Emulsion/
Coating (Disk)Oil Emulsion/
Coating (Diskand Ball)
Dn' Silane Coating
(No Oil)
NUMBER
OF TESTS
6 •
6
8
3
FRICTION COEFFICIENT
MAXIMUM
0.16
0.16
0.16
0.17
0.16
0.17
MINIMUM
1' 0.09
0.09
0.09
0.II
0.10
0.11
0.18
MEDIAN
0.13± .02
0.134..02
0.14 _ .02
0.144-.01
0.134-.02
0.144-.01
0.25 _+.05
NUMBER
OF TESTS
FRICTION COEFFICIENT
MAXIMUM
0.17
0.17
0.16
0.16
0.16
0.35
MINIMUM
0.10
0.11
0.10
0.12
0.11
0.130.16
MEDIAN
0.14 4..02
0.14 4..01
0.13 _ .02
0.14 4. .01
0.14_.01
0.144-.01
Experimental Conditions: Temperature. 25"C; dry, air atmosphere (100 ppm moisture content); load, '2 kg; speed. 200 rpm; 440C stainless steel specimens.
the disk were employed. Dark powdery transfer is observed
as well as an area where the oil is not wetting the surface. It
is not certain why this phenomena occurred, but this de-
wetting phenomena has been observed using the PFPE lu-
bricants on other occasions by the authors. The dewetting
phenomena was not observed for any test in which silane was
used as an additive or as an emulsion.
Disk Surface Profilometry
Figure 9 compares the disk wear track areas after 50 kc of
sliding for PFPE oil with a silane emulsion and for a PFPE
oil with no treatment. The wear track area for the test with
the silane emulsion has a cross-sectional area of 59 X 10 ":t2
m 2, while the test without the silane had a wear track with a
cross-sectional area of 214 x 10 -12 m 2.
Micro-Fourier Transformation infrared Spectroscopy
A comparison of the I_FTIR spectrum of the PFPE film on
a 440C disk wear track before testing (dotted line) to the
p.F'FIR spectrum of the PFPE fluid on the same wear track
after it had been treated for 50 kc (solid line) is shown in
Fig. 10. The multiple-featured C-F peak between 1100 and
1400 cm- I and the sharp CF s peak at 980 cm- I, which cor-
responds to the CF 3 rotation-vibration, are characteristic of
this particular PFPE lubricant. The peak in the 3000 to 3500
cm-l region is due to H-bonded -OH. The broad peak at
1670 cm-l and the small peak at 1425 cm-l, which overlaps
the water vibrations, could be due to two types of structures.
Liang and Roselius (18) suggested that the degradation
products on the surface have a structure of perfluoroacyl-
fluoride bounded to the surface through a hydroxyl. Thus,
the peak at 1670 cm -t could correspond to a C=O vibra-
tion, and the 1425 cm -I peak would then correspond to the
end G-F vibration. The second possibility is the formation of
a surface carboxylate, CO0 _-, formed by the reaction of a
perfluoroacylfluoride with a surface or ambient water. At the
present time, there is not enough spectroscopic evidence to
discern which is the correct structure. However, there is
enough evidence to definitely state that the observed I.tF"FIR
spectra corresponded to the signature of the degraded
lubricant.
To ascertain if silane were transferred from the emulsion
or coating to the mating surfaces, a gF'I'IR spectrum of the
silane coating was taken before testing and then compared
to deposits on the ball wear surfaces. Figure 11 shows the
I.tFTIR spectrum of the silane coating applied to a 440C steel
surface. The two sharp bands at 3367 and 3298 cm-I are
typical N-H asymmetric and symmetric stretching vibrations
which occur in NH 2 groups. The band at 1600 cm -l is the
corresponding deformation vibration. Hydrogen bonding is
typical in the solid or liquid state for compounds containing
NH 2 groups. Thus, hydrogen bonding accounts for the broad
peak between 3000 and 3500 cm -1. Since this film has been
baked after its application to the 440C surface, it is unlikely
that this broad vibration would be due to H-bonding of hy-
droxyl groups. Other peaks present are the C-H stretching
vibrations due to the C,2H 5 and the C_H6 groups which ap-
pear at 2840 and 2932 cm-1, respectively. The band at 1470
cm-l is the corresponding deformation _bration. The Si-O-
C2H 5 vibrations appear at 1100 and 930 cm -1 and the
Si-CsH 6 appear at 792 cm-t.
Figure 12 compares the p.FTIR spectra in the 5000 to 1500
cm-l wavenumber region from spectra taken from wear scars
which were slid against silane-coated disks. Spectra are shown
for a short-duration test (50 kc) and for a long-duration test
(4300 kc). The spectrum for the short-duration test shows the
presence of silane peaks (C-H and N-H ,ibrations) but d'oes
not show any PFPE decomposition peaks (-OH and C=O
vibrations). The long-duration spectrum shows no silane
peaks b.ut does show the presence of PFPE decomposition
peaks. The -OH vibration (3500 to 3000 cm- l) is very shallow
and is somewhat hidden in the broad peak shown on Fig. 12;
however, the other degradation signature peak (C = O vibra-
tion) is very visible on the figure at 1625 cm-I. The presence
of silane peaks on the surface and the absence of decompo-
sition peaks (after the short sliding inters:al) strongly infer

Silane transfer
/
_deformation
"' 100 ttm
Fig. 5---Comparison of ball wear scars after 2 km of sliding.(a) silane emulsion
(b) silane disk coating
(c) no sllane treatment
that the silane has helped mitigate the degradation of the
PFPE. The absence of silane peaks (after the long sliding du-
ration) indicates that the silane coadng eventually wears away•
All the tests using silane showed a reduction in degradation
of the PFPE lubricant for the short sliding durations. How-
ever, no silane peaks could be found on the wear surfaces
for the tests using the silane emulsion• It may be that the
Pin sliding
direction
f
!(b) ""
!1,
;r :.'_ "Platelike"
_ii.: transfer!
100 .m
Black powdery _t
wear debns j[:
Fig. 6---Comparison of wear tracks on 440C stainless steel disks after
very long durations of sliding.
(a) silane emulsion and coating (250 kin)
(b) silane disk coating (237 kin)
(c) no silane treatment (230 kin)
interaction of the silane in this case took place between the
PFPE and the silane and that transfer of the silane to the
wear surfaces was not necessa_" to prevent degradation•
CONCLUDING REMARKS
The purpose of this study was to determine if a silaneadded to a PFPE as an emulsion or applied as a coating to
the counterfaces would reduce wear and/or the degradation
of a PFPE lubricant. It was found that both wear and degra-
dation were reduced. The authors believe that reduced deg-
radation of the lubricant leads to reduced wear. although
there is no experimental proof of this.
In addition, it is important to bear in mind that no attempt
has been made in this stud,v to optimize the method of ap-

328 W.MOI._M..ES,R. k. FUSARO, M. SIEBERT, T. KEiTH, R.J.M'qSEN, ,MN[.) P. |[ERRERA-FIERRO
Thin "plate-hke" {:
Disk sliding direction
qw
20 ,,m !
Fig. 7--Low and high magnification photomicrographs of ball wear scar
areas after 350 km of sliding from a test where the counter/acewas a silane-coated 440C stainless steel disk.
plying the coatings, the thickness of the coatings, the curing
of the coatings, or the a,nount of the silane in the emulsion.
Thus, it may be possible to obtain even better results once
an optimization stud,v is done. h also should be noted that
the silane emulsions and coatings are not necessarily the
same. The emulsions were not heat treated while the coatings
were heat treated at 200°C for 30 minutes. Heat treating of
the silane may have changed its structure.
Also, one must be aware that accelerated test data such as
wear rates, friction coefficients, etc. do not necessarily di-
rectly' correlate to resuh._ achieved in an actual bearing. A
Dusk shdlng
dwectnon
f
Non-wetted
area
200 _[m
Fig. 8---Photomicrograph of a ball wear scar after 266 km of sliding from
a test where no silane emulsions or coatings to the disk were
employed. Dewetting of the oil from the surface can be observed.
E 5
.=" 3 i
" I i-1 _./'-'_ i -- --
_-3 i® (a) - I _ I-5 L : t
0 100 200 300 400 500 600 700 800 900 1000
Wear track width, .urn
E 5 _
.E 3 ! ;
o_ 1 +, l
I-5 (b)- i i I -
0 100 200 300 400 500 600 700 800 900 1000
Wear track width, #m
Fig. 9_Comparison of disk wear track cross-sectional areas after 50 k:
of sliding for tests conducted in various conditions.
(a) a PFPE oll with a silane dispersion
(b) a PFPE oll with no silane dispersion or coating
very small improvement in an accelerated test data may lead
to a yen" large improvement in a bearing or tbere may be
very little improvement. A test using bearings must be made
to ascertain the real improvement. Screening tests, such as
pin-on-disk tests, are done to show the potential of variot_"
concepts for use in a bearing.
S
O!
ui
cr

a ,_ .... ,Amtiwcar Additive/Surface Pretreatment for -PFPE-Liquid Lubricants ............... 329 ..........
C-F
@o
Before
testing
IAfter _ /_._t.
l I I I I I4000 3000 2000
Wavenurnber, crn-1
CF3
I
I
1000
Rg. 10--Comperlson of FT1R spectra of PFPE oll on a 440C stainless
steel ball before testing to that obtained on the 440C steel ball
wear scar after 50 kilocycles of sliding (no treatment of the o11).
0.8oo
o.6t-O
0.4
0.2
0.0
1.0 m
(DO0
-- j_
cq03 o
0
DCM
b-
I I I
4000 3000 2000 1000
Wavenumber, cm-1
Fig. 11_FTIR spectra of a sllane coating applied to a 440C stainless steeldisk.
SUMMARY OF RESULTS
Pin-on-disk tribology tesdng coupled with surface profil-
ometry, optical microscopy and p.FTIR studies on a PFPE liq-
uid lubricant with and without silane additives and/or
emulsions provides the following indications:
1. Silane coatings and/or emulsions used in conjunction
with PF'PE oils eliminated PFPE degradation products
which were found on ball wear surfaces on tests with
the untreated oil, giving strong evidence that the silane
can mitigate the degradation of this particular PFPE oil.
2. Accompanying the reduced degradation of the PFPE oil
was reduced wear of 440C balls and disks when com-
pared to similar tests on an untreated PIPE oil.
3. Equal improvements in decreased wear rates were ob-
tained for disk coatings and oil emulsions, although no
attempt was made to optimize either application method.
4. Optical and p.FTIR microscopy observations indicated
(13)
(14)
(15)
(16)
(17)
. (18)
o¢ C-H CO2
I I I I I I I I
5000 4000 3000 2000
Wavenumber, cm-1
i
1000
Fig. 12--Comparison of FTiR spectra obtained from bali deposits on the
wear scar after vsdous durations of sliding on s sllane-coatad
disk (-OH and C=O are PFPE decomposition peaks, N-H and
C-H are silane peaks).
(e) 50 kilocycles
(b) 4300 kilocycles
that the silane disk coatings could form thin layerlike
transfer films on ball wear surfaces.
5. Friction coefficients obtained from PIPE oil tests using
silane emulsions or silane coatings were the same'as
those obtained from tests using the untreated PFPE oil.
REFERENCES
( 1 ) Gumprecht, W. H., "PR-143---A New Clam of High Temperature Fluids,"ASLE Tram.. 9, pp 24-30, (1966).
(2) Sianesi, D., "'Perfluoropolyaikylethers Synthesis and Characterization of
a New Class of Inert Fluids," C.kim Ind. (Milan), 50, p 206, (1968).
(5) Holland, L.. Laurenson, L and Baker, P. N., "The Use of Perfluoropo-
lyether Fluids in Vapour Stream Pumps," Vatuu_ 2?, p 315, (1972).
(4) Luches, A. and Provenzano. I., "On the Use of Pedluoropolyether Fluids
in HV Spark-Gaps," Jour. Phys. D: A_ Phys., 10, pp 339-342. (1977).
(5) Sianesi, D., Zamboni, V., Fontanelli, R. and Binaghi, M., "Perfluoropoly-
ethers: Their Physical Properties and Behaviour at High and Low Tern-
peratures,'" Wear, 18, pp 85-100, (1971).
(6) Sharma, S. K., Gschwender, L.J. and Snyder, C. E.Jr., "'Development of
a Soluble Lubricity Additive for Perfluoropolyalk[yether Fluids," Jour. of
symh. Lubr., 7, I, pp 15--23, (1990).
(7) Gschwender, L J., Snyder, C. E. jr. and Fuhz. G. W., "Soluble Additives
for Perfluoropolyaikylether Liquid Lubricant*," Lubr. Eng., 49, 9, pp702-708, (1993).
(8) CarrY, D.J. and Markowitz, J. A., "'The Reaction of PFPE Oil with FeF s,
AIF_, and AIC[ s at Elewated Temperatures," ASLE Tram., 28, l, pp 40-46, (1985).
(9) Zehe, M.J. and Faut, O. D., "Acidic Attack of PFPE Lubricant Molecules
by Metal Oxide Surfaces," NASA TM--101_2, (1993).
(10) _, P. H., Tang, W. T. and Wheeler, P. O., "Degradation of Pf'PE_
Catalyzed by Aluminum Oxide," AI@L Surf. $¢'i., 51, pp 201-211, (1991).
(11) Basu, P., Ballinger, T. H. and Yates, J. T. jr., "'Nuoroalkyl Ether Chem-
istry on Alumina: A Transmi_ion IR Study of the Adsorption and Ther-
mal Decomposition of (CF2H)20 on Al2Os, "" Lang'mu.;r, 5, 2, pp 502-510(1989).
(12) Ng, L M., Lyth, E., Zeller, M. V. and Boyd, D. L, "Surface Chemistry of
Perfluoro Ethers: An Infrared Study of the Thermal Decomposition of
(C-_F_)20 on Al20_," Langmuir, pp 127-135, (1995).
Morales, W., "PerfluoropolFalkylether Decomposition on Catalytic Alu-
mina,'" NASA TM 106547, (1994).
Fusaro, R. L.o "'How to Evaluate Solid-Lubricant Film.* Using a Pin-on-
Disk Tribometer,'" Lubr. Eng., 43, 5, pp 330-338, (1987).
Hollis, P., "'Surface Infrared Spectroscopy," Vacuum, 4,5, pp 705-714,(1994).
Porter, M. D.. "IR External Reflection Spectroscopy: A Probe for Chem-
ically Modified Surfaces." Analytical Chem., 60, pp 1143A- l 155#., (1988).
Refiner, J. A., "Infrared Microanalysis of Contaminant* at Grazing Inci-
dence," AppL Spectroscopy in MatZ Sci., 1437, pp 89-94, (1991).
Dang, J. and Roselius, M., "'FTIR Study of Perfluoroacyl Fluoride Chem-
isorption onto AJumina," Jour. ofFtuo_ne C./u'm., 67, pp 113-117, (1994).