aermod modeling morrow 103012 -...
TRANSCRIPT

AERMOD Modeling of Air Quality Impacts of the Proposed Morrow Pacific Project
Final Report
October 2012
Prepared for
Ms. Jessica Loarie SIERRA CLUB
San Francisco, California
Prepared by Mr. Khanh T. Tran
Principal
AMI Environmental 206 Black Eagle Ave Henderson, NV 89002
Tel. (714)679-7363
2
Table of Contents
Page I. Introduction 4 II. Modeling Methodologies 4
A. Model Version 4 B. Source Emissions 4 C. Stack Parameters 6 D. Receptors 6 E. Meteorological and Ozone Data 7 F. Background Concentrations 7
III. Modeling Results 11
A. 1-hour NO2 Impacts 11 B. 1-hour SO2 Impacts 18 C. 24-hour PM2.5 Impacts 19 D. Annual NO2 Impacts 22 E. Nitrogen Deposition Impacts 24
IV. Conclusions 27 V. References 28 Appendix A - Summary of AERMOD-Predicted 1-hour NO2 Impacts (Full Conversion) of Port of Morrow Operations Appendix B - Summary of AERMOD-Predicted 1-hour NO2 Impacts (Tier 3-OLM) of Port of Morrow Operations Appendix C - Summary of AERMOD-Predicted 1-hour NO2 Impacts (Tier 3-PVMRM) of Port of Morrow Operations Appendix D - Summary of AERMOD-Predicted 1-hour NO2 Impacts (Full Conversion) of Port Westward Operations with Transloader using Emergency Power Appendix E - Summary of AERMOD-Predicted 1-hour NO2 Impacts (Full Conversion) of Port Westward Operations with Transloader using Shore Power Appendix F - Summary of AERMOD-Predicted 1-hour SO2 Impacts of Port of Morrow Operations with Ultra Low Sulfur Fuel

3
Table of Contents (continued) Appendix G - Summary of AERMOD-Predicted 1-hour SO2 Impacts of Port Westward Operations with Ultra Low Sulfur Fuel Appendix H - Summary of AERMOD-Predicted 24-hour PM2.5 Impacts of Port of Morrow Operations with Enclosed Barges and Trains
Appendix I - Summary of AERMOD-Predicted 24-hour PM2.5 Impacts of Port of Morrow Operations with Open Barges and Closed Trains Appendix J - Summary of AERMOD-Predicted 24-hour PM2.5 Impacts of Port of Morrow Operations with Closed Barges and Open Trains Appendix K - Summary of AERMOD-Predicted Annual NO2 Impacts of Port of Morrow Operations Appendix M - Summary of AERMOD-Predicted NO2 Deposition Impacts of Port of Morrow Operations

4
I. INTRODUCTION This document presents the methodologies and results of a modeling analysis of air quality impacts of the proposed Morrow Pacific Project (MPP) in Oregon. The MPP includes three operating stages. In the first stage, coal will be offloaded from trains at the Port of Morrow via enclosed facilities into enclosed storage buildings and transferred into enclosed barges by enclosed conveyors. In the second stage, coal will be shipped down the Columbia River by enclosed barges to Port Westward in Columbia County. The MPP third stage involves the coal transloading from barges into ocean-going vessels (OGV). An Environmental Review (ER) and an air pollution permit application have been prepared for the MPP. However, no dispersion modeling has been performed in these documents to quantify the project impacts. Hence, AMI Environmental has been asked by Sierra Club to conduct an air quality modeling analysis using the regulatory dispersion model AERMOD to predict project impacts of criteria pollutants, such as nitrogen dioxide (NO2), sulfur dioxide (SO2) and fine particulates (PM2.5). Project impacts are compared against applicable national ambient air quality standards (NAAQS). II. MODELING METHODOLOGIES This section documents the methodologies and assumptions used in the generation of modeling inputs such as source emissions, stack parameters, receptors, meteorological data and background concentrations. A. Model Version Version 12060 of the AERMOD model has been used in the modeling study. It is currently the latest version of the model that has been approved by the U.S. Environmental Protection Agency (USEPA, 2012). The most recent modeling guidance by US EPA has been implemented in the AERMOD model and it is fully capable of predicting project impacts for comparison against recent short-term NAAQS, e.g. the 1-hour NO2 NAAQS of 100 ppb (188 ug/m3), the 1-hour SO2 NAAQS of 75 ppb (196 ug/m3 and the 24-hour PM2.5 NAAQS of 35 ug/m3 as well as the annual NO2 NAAQS of 53ppb (100 ug/m3). B. Source Emissions Two basic scenarios are considered for modeling by the AERMOD model. In the first scenario, coal is unloading from trains while barges are loading at the dock in Port of Morrow. The second scenario involves coal loading at Port Westward onto a Panamax while the transloader is testing the emergency generator and a tug boat assisting the barge unloading operation. For both scenarios, AERMOD modeling has been performed for 1-hour and annual NO2 and SO2. PM2.5 impacts are only modeled for the first scenario.
5
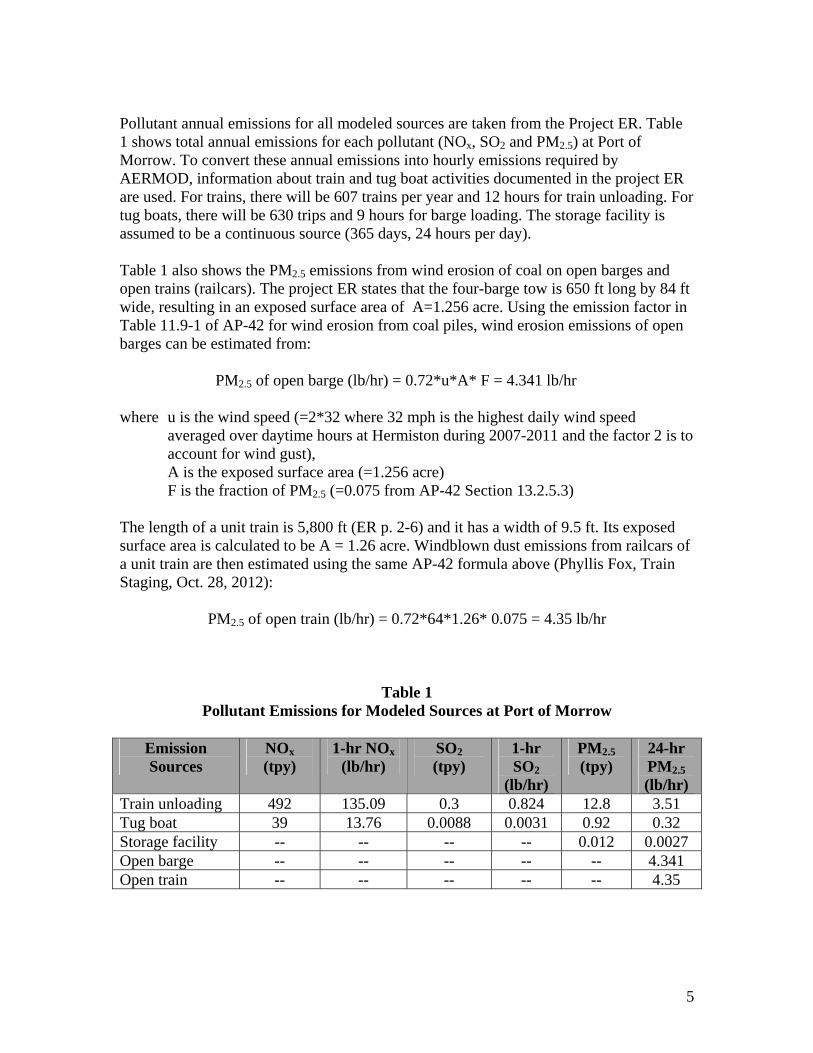
Pollutant annual emissions for all modeled sources are taken from the Project ER. Table 1 shows total annual emissions for each pollutant (NOx, SO2 and PM2.5) at Port of Morrow. To convert these annual emissions into hourly emissions required by AERMOD, information about train and tug boat activities documented in the project ER are used. For trains, there will be 607 trains per year and 12 hours for train unloading. For tug boats, there will be 630 trips and 9 hours for barge loading. The storage facility is assumed to be a continuous source (365 days, 24 hours per day). Table 1 also shows the PM2.5 emissions from wind erosion of coal on open barges and open trains (railcars). The project ER states that the four-barge tow is 650 ft long by 84 ft wide, resulting in an exposed surface area of A=1.256 acre. Using the emission factor in Table 11.9-1 of AP-42 for wind erosion from coal piles, wind erosion emissions of open barges can be estimated from:
PM2.5 of open barge (lb/hr) = 0.72*u*A* F = 4.341 lb/hr where u is the wind speed (=2*32 where 32 mph is the highest daily wind speed
averaged over daytime hours at Hermiston during 2007-2011 and the factor 2 is to account for wind gust),
A is the exposed surface area (=1.256 acre) F is the fraction of PM2.5 (=0.075 from AP-42 Section 13.2.5.3) The length of a unit train is 5,800 ft (ER p. 2-6) and it has a width of 9.5 ft. Its exposed surface area is calculated to be A = 1.26 acre. Windblown dust emissions from railcars of a unit train are then estimated using the same AP-42 formula above (Phyllis Fox, Train Staging, Oct. 28, 2012):
PM2.5 of open train (lb/hr) = 0.72*64*1.26* 0.075 = 4.35 lb/hr
Table 1 Pollutant Emissions for Modeled Sources at Port of Morrow
Emission Sources
NOx (tpy)
1-hr NOx (lb/hr)
SO2 (tpy)
1-hr SO2
(lb/hr)
PM2.5 (tpy)
24-hr PM2.5 (lb/hr)
Train unloading 492 135.09 0.3 0.824 12.8 3.51 Tug boat 39 13.76 0.0088 0.0031 0.92 0.32 Storage facility -- -- -- -- 0.012 0.0027 Open barge -- -- -- -- -- 4.341 Open train -- -- -- -- -- 4.35

6
Table 2 shows the modeled sources and emissions at Port Westward. Total annual emissions have been taken from the project ER. For converting these annual emissions into hourly emission rates, all modeled sources are assumed to operate continuously (365 days, 24 hours per day) as stated in the project ER.
Table 2
Pollutant Emissions for Modeled Sources at Port Westward
Emission Sources NOx (tpy)
1-hr NOx
(lb/hr)
SO2 (tpy)
1-hr SO2
(lb/hr) Panamax 81.5 18.61 14.7 3.36 Transloader (emergency power) 281 64.16 0.048 0.011 Transloader (shore power) 0.33 0.0753 7.9e-5 1.80e-5 Tug boat 32 7.31 0.0042 0.00096
B. Stack Parameters Project emissions are modeled as point sources. Stack parameters (stack height, diameter, temperature and exit velocity) for the modeled sources are shown in Table 3. They are taken from the modeling studies of port operations conducted by the California Air Resources Board (CARB, 2006) and New Jersey Department of Environmental Protection (NJDEP, 2009). Emissions from tug boats and barges are released from a height of 20 ft. Windblown dust emissions from railcars are modeled as area source with a release height of 16 ft (CARB, 2006).
Table 3. Stack Parameters for Modeled Emission Sources
Source Height
(m) Diameter
(m) Temperature
(K) Velocity
(m/s) Train engine 4.572 0.61 372.0 3.47 Tug Boat 6.0 0.5 300.0 0.0 Barge 6.0 0.5 300.0 0.0 Open train 5.0 -- -- - Panamax 43.0 0.50 618.0 16.0 Generator 35.97 0.47 699.82 30.0
Note: Emissions from open trains are modeled as area source

7
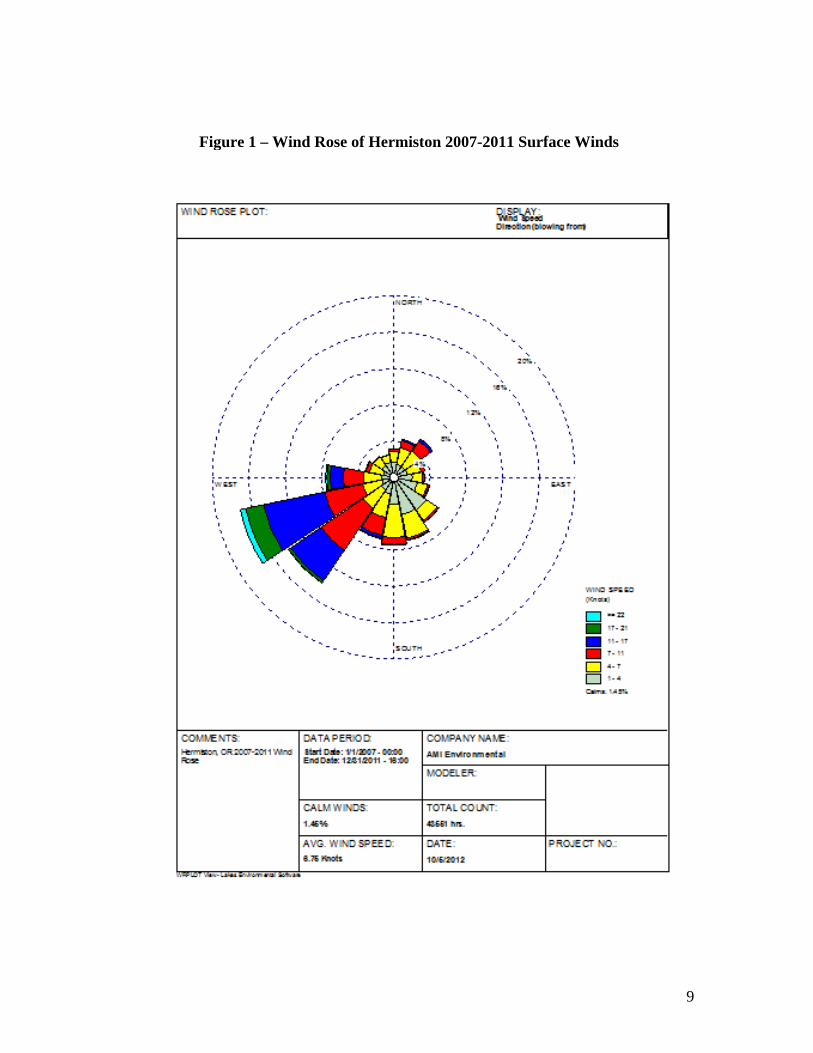
C. Receptors The AERMOD modeling uses a Cartesian grid of discrete receptors that are located within a radius of 5 km around the ports of Morrow and Westward. The receptor grid has varying resolutions: 50 m within the first 2 km and 100 m between 2 km and 5 km. Receptors located on the leased property at Port of Morrow have been removed from consideration. A total of 16,739 receptors have been used in the AERMOD modeling for Port of Morrow. The modeling at Port Westward has 16,762 receptors. A flagpole height of 1.5 m was also assigned to the modeled receptors. The preprocessor AERMAP has been employed to obtain terrain elevations at these receptors using the National Elevation Data (NED). D. Meteorological and Ozone Data For Port of Morrow, the AERMOD modeling uses the 2007-2011 surface meteorological data (including 1-min ASOS wind data to minimize calm hours) from Hermiston and upper-air data from Salem. The dataset has 589 calm hours and 1,662 hours with missing data (3.79% of possible 43,824 hours). The wind rose from Hermiston in Figure 1 shows predominant winds from the southwest. The modeling for Port Westward uses the 2006-2010 surface data (including 1-min ASOS wind data) from Astoria and upper-air data from Salem. This dataset has 523 calm hours and 1,554 hours with missing data (3.55% of possible 43,824 hours). The wind rose of Astoria surface winds is shown in Figure 2. Wind directions at this station are highly variable, from east to northwest. For 1-hour NO2 modeling at Port of Morrow, the AERMOD model uses the Ozone Limiting Method (OLM) and the Plume Volume Molar Ratio Method (PVMRM). Both techniques are considered as Tier 3 by the US EPA and require hourly ozone data as input. Hourly ozone measurements at Hermiston during the same years (2007-2011) as the meteorological data are used as input to the AERMOD model. E. Background Concentrations For comparison with the NAAQS, background concentrations at a monitoring station are added to the concentrations predicted by the AERMOD model. Monitoring data during 2007-2008 tabulated in the Oregon DEQ 2011 Air Quality Annual Report (ODEQ, 2012) indicate that a 98th percentile of daily maximum NO2 of 37 ppb (69.6 ug/m3) and a 99th percentile of daily maximum SO2 of 9 ppb (23.5 ug/m3) were measured at the Hermiston municipal airport. Monitoring data in 2007 at the Hermiston pump station show a 98th percentile of daily maximum PM2.5 of 24 ug/m3. An annual-averaged NO2 concentration of 8 ppb (15.0 ug/m3) was also measured at the Hermiston airport. These pollutant

8
measurements are used as background concentrations for modeling impacts at Port of Morrow. For modeling at Port Westward, the background concentrations are: 35.3 ppb (66.4 ug/m3) recorded in Portland as the 2009-2011 average of the 98th percentile of daily maximum 1-hour NO2 and 8.7 ppb (22.8 ug/m3) recorded in Portland as the 2009-2011 average of the 99th percentile of daily maximum 1-hour SO2. For 24-hour PM2.5, the 2009-2011 design value of 20 ug/m3 for the Dalles monitoring station is used as background. Background concentrations used in the modeling are shown Table 4 below. While we included background concentrations to be consistent with applicable guidance, even if the background concentrations were all assumed to be zero, it would not affect any of the NAAQS violations discussed in this report.
Table 4. Pollutant Background Concentrations (ug/m3)
Modeled Port
1-hour NO2
1-hour SO2
24-hour PM2.5
Annual NO2
Morrow 69.6 23.5 24.0 15.0 Westward 66.4 22.8 20.0 --
9
Figure 1 – Wind Rose of Hermiston 2007-2011 Surface Winds

10
Figure 2 – Wind Rose of Astoria 2006-2010 Surface Winds

11
III. MODELING RESULTS A. 1-Hour NO2 Impacts
In January 2010, US EPA announced a new 1-hour NAAQS which is attained when the 3-year average of the 98th percentile of the daily maximum 1-hour NO2 concentrations does not exceed 100 ppb (or 188 ug/m3). Subsequently, US EPA issued in June 2010 a modeling guidance for using the AERMOD model with one year of onsite meteorological data or five years of offsite meteorological data (USEPA, 2010). According to the US EPA, the 8th highest maximum daily 1-hour concentration obtained with one year of onsite data or averaged over five years of offsite data should be used in the NAAQS comparison. For 1-hour NO2 modeling, US EPA has recommended several techniques that can be divided into three tiers:
1. Tier 1: Full conversion where the NOx emissions are assumed to be 100% converted into NO2,
2. Tier 2: The Tier 2 technique is known as the Ambient Ratio Method (ARM). In this technique, a default conversion rate of 0.80 recommended in the US EPA March 2011 guidance is applied to the predicted NOx concentrations, and
3. Tier 3: Two Tier 3 techniques known as Ozone Limiting Method (OLM) and Plume Volume Molar Ratio Method (PVMRM) are currently available in the AERMOD model.
The Tier 1 and Tier 2 methods are fully approved by the US EPA. The OLM and PVMRM techniques in Tier 3 are considered to be non-regulatory defaults and their use requires the approval of US EPA and state agencies on a case by case basis (US EPA, 2011). AMI Environmental contacted ODEQ regarding the appropriate Tier 3 methodology to use in this setting. ODEQ recommended the use of both techniques (OLM and PVMRM) and, hence, they have been employed in this modeling analysis. A.1 Impacts of Port of Morrow Operations 1-hour NO2 impacts from NOx emissions from train unloading and a tug boat assisting barge loading at Port of Morrow have been modeled by all the above modeling techniques recommended by the US EPA: Tier 1 with full conversion; Tier 2 with 80% conversion; OLM and PVMRM in Tier 3. The Tier 3 techniques use in-stack NO2/NOx ratios of 0.15 for locomotive and 0.10 for tug boat. The in-stack ratio for locomotive is obtained from source tests conducted by Southwest Research Institute (Fritz, 2007). The ratio for tug boat is taken from source tests included in the in-stack NO2/NOx ratio

12
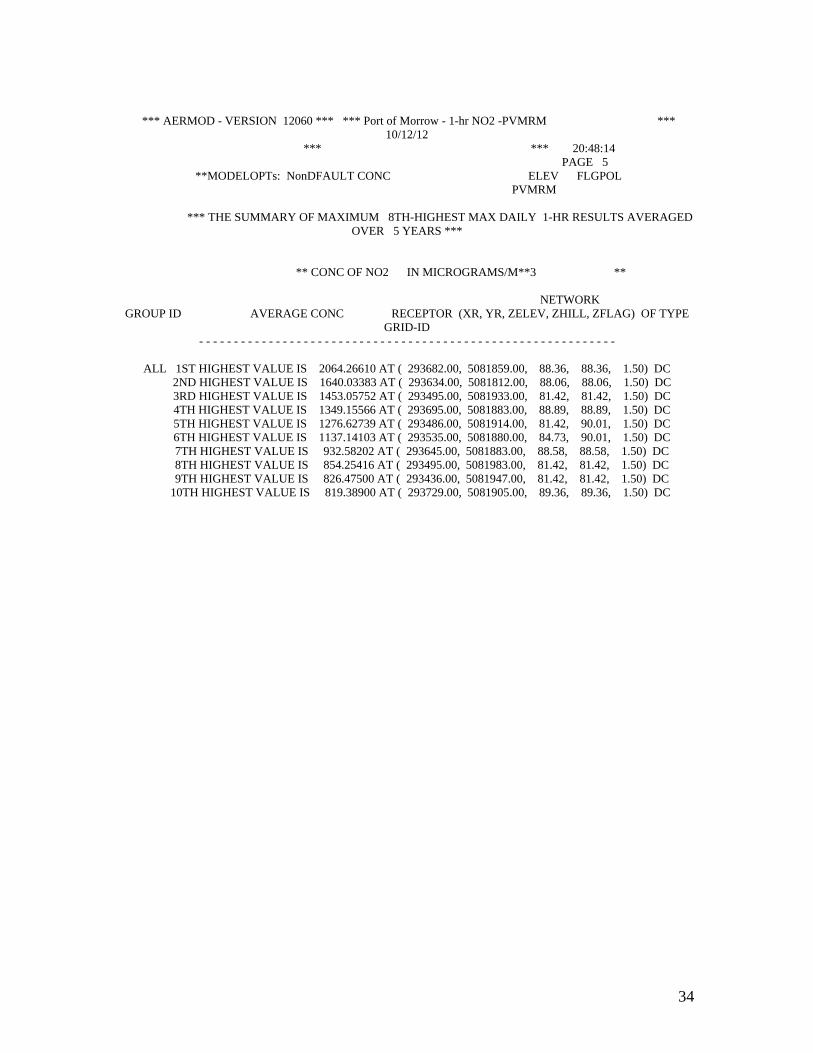
database that has recently been setup by the US EPA OAQPS. Hourly ozone measurements at the Hermiston airport from 2007-2011 have also been used as inputs. Three AERMOD modeling runs (Tier 1, OLM and PVMRM) have been performed with the 2007-2011 meteorological data. Both the train and the tug boat are assumed to operate only during daytime hours (0600-1800). This is a conservative assumption that may understate the impacts since daytime hours typically have stronger wind and more unstable conditions than nighttime hours. NO2 modeling results for the 8th highest concentrations are summarized in Appendices A-C and presented in Table 5. As shown in this table, the AERMOD model has predicted, with all modeling techniques, large exceedances of the 1-hour NAAQS of 188 ug/m3 by project emissions alone. The highest 8th highest concentrations obtained with Tier 1 (12,000.4 ug/m3) and Tier 2 (9,600.3 ug/m3) are much higher than those predicted by Tier 3 techniques. The highest concentration predicted by PVMRM (2,064.3 ug/m3) is slightly higher than that of the OLM technique (1,872.6 ug/m3). For Tier 1, a plot of the contour of 188 ug/m3 is shown in Figure 3. The area with concentrations exceeding 188 ug/m3, i.e., violating the 1-hr NAAQS due to project emissions alone, has a radius of about 5 km north and west of the project site. These exceedances are also predicted within 3 km east and south of the project. Figure 4 shows that the area of NAAQS exceedances predicted with OLM is much smaller. PVMRM has predicted a much larger area of exceedances than OLM, albeit smaller than that of Tier 1.
Table 5. Predicted 1-Hour NO2 Impacts of Port of Morrow Operations
Modeling Method
Project Conc.
(ug/m3)
Backgr. Conc.
(ug/m3)
Total Conc.
(ug/m3)
NAAQS (ug/m3)
Percent Over
NAAQS
Tier 1 -100% 12,000.4 69.6 12,070.0 188 6,320% Tier 2 - 80% 9,600.3 69.6 9,669.9 188 5,044% Tier 3-OLM 1,872.6 69.6 1,942.2 188 933%
Tier 3-PVMRM 2,064.3 69.6 2,133.9 188 1,035%

13
Figure 3. Area with Highest 8th Highest 1-hour NO2 Concentrations (Tier 1-Full Conversion) Exceeding the 1-Hour NAAQS of 188 ug/m3 by
Port of Morrow Operations Alone

14
Figure 4. Area with Highest 8th Highest 1-hour NO2 Concentrations (Tier 3-OLM)
Exceeding the 1-Hour NAAQS of 188 ug/m3 by Port of Morrow Operations Alone

15
Figure 5. Area with Highest 8th Highest 1-hour NO2 Concentrations (Tier 3-PVMRM) Exceeding the 1-Hour NAAQS of 188 ug/m3 by
Port of Morrow Operations Alone A.2 Impacts of Port Westward Operations 1-hour NO2 impacts from NOx emissions from the OGV Panamax loading, the transloader operating on emergency power and a tug boat assisting the barge unloading at Port Westward have been modeled by Tier 1 with full conversion and Tier 2 with 80% conversion. No Tier 3 technique, OLM or PVMRM, has been performed since Astoria does not have hourly ozone measurements publicly available. Modeling results are summarized in Appendix D. As shown in this Appendix and Table 6, the highest 8th

16
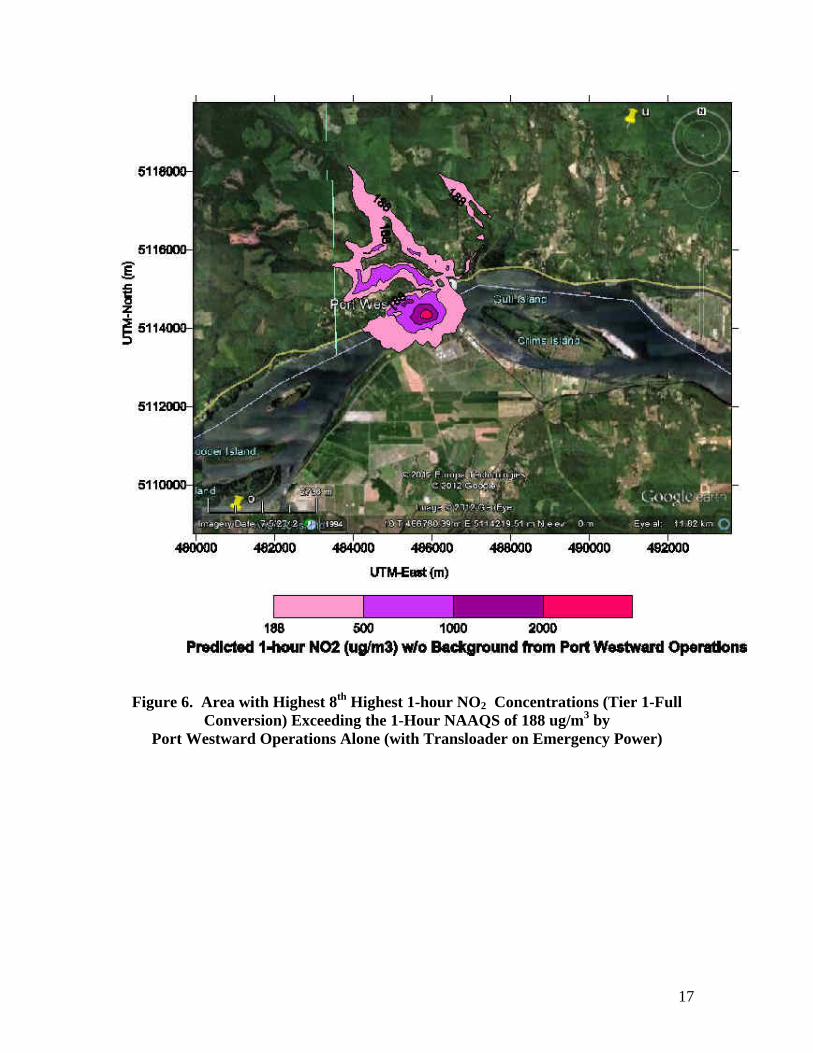
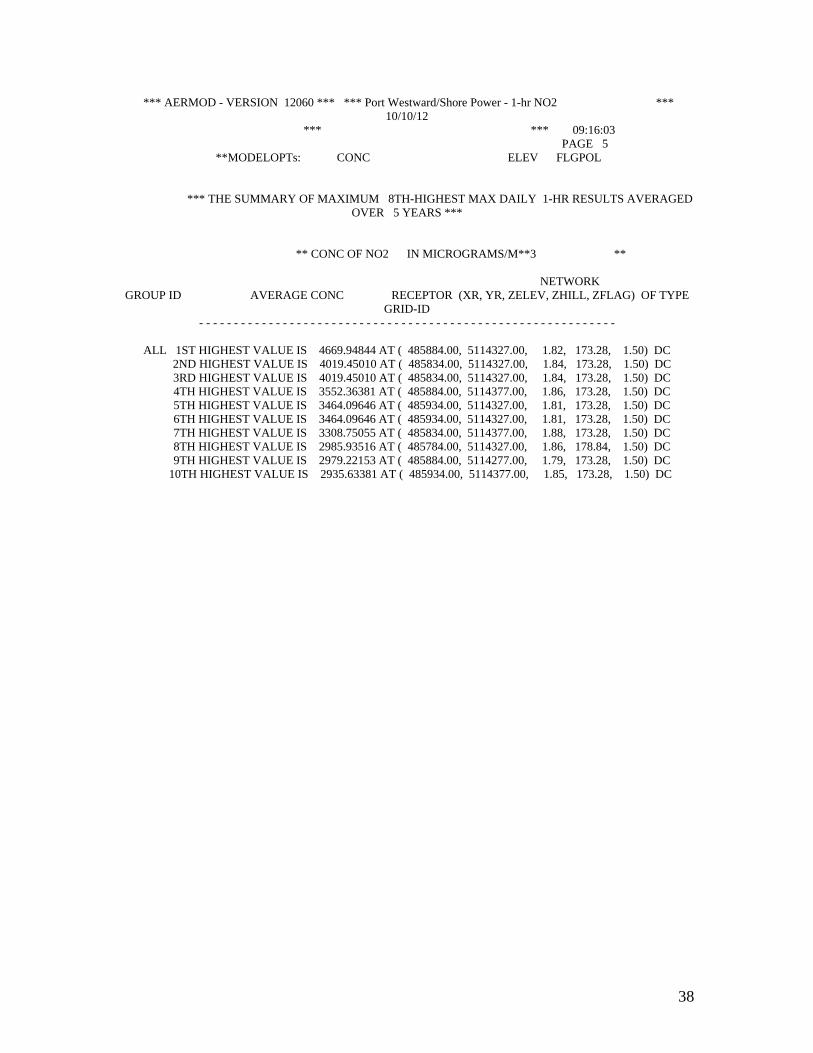
highest concentrations of from project emissions alone (4,670 ug/m3 for Tier 1 and 3,736 ug/m3 for Tier 2) largely exceed the NAAQS of 188 ug/m3. With the added background of 66.4 ug/m3, the NAAQS is predicted to be exceeded by 2,419% (Tier 1) and 1,923% (Tier 2). Another AERMOD run has been performed where the transloader is operating on shore power. As shown in Appendix E and Table 7 below, the highest 8th highest NO2 of 4,670 ug/m3 is the same as in the previous modeling scenario with the transloader operating on emergency power. Thus, the NAAQS is predicted to be largely exceeded by 2,419% (Tier 1) and 1,923% (Tier 2) for both modeling scenarios. The areas of NAAQS exceedances are shown in Figure 6 for the scenario with emergency power and Figure 7 for the scenario with shore power. Comparing these two figures shows that the area of exceedances of the former scenario is larger than that of the latter. Due to the emissions of the emergency generator, the area of exceedances extends about 3 km northwest of the project site.
Table 6. Predicted 1-Hour NO2 Impacts of Port Westward Operations With Transloader on Emergency Power
Modeling Method
Project Conc.
(ug/m3)
Backgr. Conc.
(ug/m3)
Total Conc.
(ug/m3)
NAAQS (ug/m3)
Percent Over
NAAQS
Tier 1 -100% 4,670.0 66.4 4,736.4 188 2,419% Tier 2 - 80% 3,736.0 66.4 3,802.4 188 1,923%
Table 7. Predicted 1-Hour NO2 Impacts of Port Westward Operations With Transloader on Shore Power
Modeling Method
Project Conc.
(ug/m3)
Backgr. Conc.
(ug/m3)
Total Conc.
(ug/m3)
NAAQS (ug/m3)
Percent Over
NAAQS
Tier 1 -100% 4,670.0 66.4 4,736.4 188 2,419% Tier 2 - 80% 3,736.0 66.4 3,802.4 188 1,923%
17
Figure 6. Area with Highest 8th Highest 1-hour NO2 Concentrations (Tier 1-Full Conversion) Exceeding the 1-Hour NAAQS of 188 ug/m3 by
Port Westward Operations Alone (with Transloader on Emergency Power)

18
Figure 7. Area with Highest 8th Highest 1-hour NO2 Concentrations (Tier 1-Full Conversion) Exceeding the 1-Hour NAAQS of 188 ug/m3 by
Port Westward Operations Alone (with Transloader on Shore Power) B. 1-Hour SO2 Impacts In June 2010, US EPA announced a new 1-hour NAAQS which is attained when the 3-year average of the 99th percentile of the daily maximum 1-hour SO2 concentrations does not exceed 75 ppb (or 196 ug/m3). Subsequently, US EPA issued in August 2010 a modeling guidance for using the AERMOD model with one year or five years of meteorological data (USEPA, 2010b). According to the US EPA, the 4th highest

19
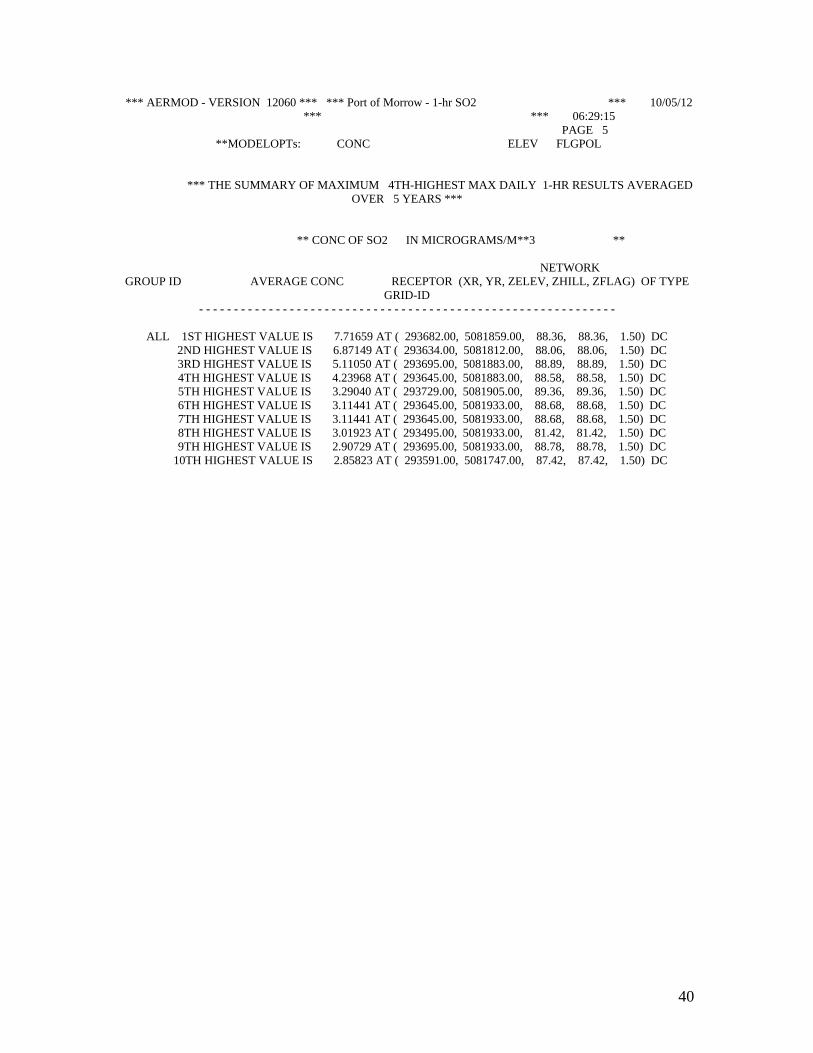
maximum daily 1-hour concentrations obtained with one year of onsite data or averaged over the modeled five years of offsite data should be used in the NAAQS comparison. Impacts from SO2 emissions from operations from both ports have been modeled. Modeling results are summarized in Appendix F (for Port of Morrow) and Appendix G (for Port Westward). As shown in Table 8 below, the AERMOD model has predicted the highest 4th highest SO2 concentrations of 7.7 ug/m3 for the Port of Morrow and 87.1 ug/m3 for Port Westward. With the added background concentrations, the NAAQS is predicted not to be exceeded at both ports. The low SO2 concentrations are due to the use of SO2 emissions that are shown in the project ER. These emissions have been calculated based on the use of ultra low sulfur diesel for both locomotive and boats. We note that the locomotive and boats are currently legally allowed to use much higher sulfur content diesel fuel that what was assumed in the ER. See 77 Fed. Reg. 61281 (Oct. 9, 2012).
Table 8. Predicted 1-hour SO2 (ug/m3) of Port Operations
Modeling Scenario
Project Conc.
Backgr. Conc.
Total Conc.
NAAQS NAAQS Exceeded?
Port of Morrow 7.7 23.5 31.2 196.0 NO Port Westward 87.1 22.8 109.9 196.0 NO
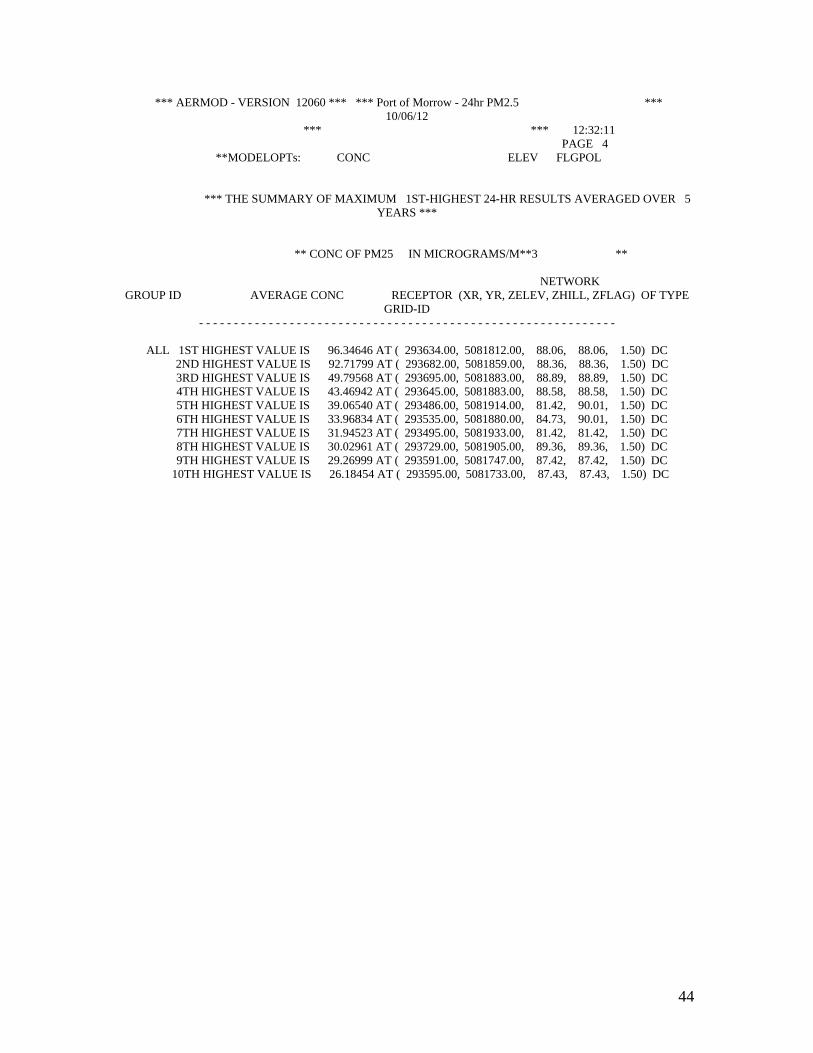
C. 24-Hour PM2.5 Impacts In September 2006, US EPA revised the 24-hour PM2.5 NAAQS which is attained when the 3-year average of the 98th percentile 24-hour concentrations must not exceed 35 ug/m3. Subsequently, US EPA issued in August 2010 a modeling guidance for using the AERMOD model with one year of onsite data or five years of offsite meteorological data (USEPA, 2010d). According to the US EPA, the highest 24-hour average concentration obtained with one year of onsite data or the highest average of the maximum 24-hour averages across five years of offsite data should be used in the NAAQS comparison. Impacts from PM2.5 emissions from operations at Port of Morrow with enclosed and open barges and trains have been modeled. Modeling results are summarized in Appendix H (for enclosed barges and trains) and Appendix I (for open barges and closed trains). As shown in Table 9 below, the AERMOD model has predicted exceedances of the 24-hour NAAQS of 35 ug/m3 by the highest 24-hour PM2.5 concentrations of 96.3 ug/m3 for the enclosed barges and 219.0 ug/m3 for the open barges. With the added background concentration of 24 ug/m3, the 24-hour NAAQS is predicted to be exceeded by both types of barges, by 2.4 times with the enclosed barges and by 5.9 times with the open barges.

20
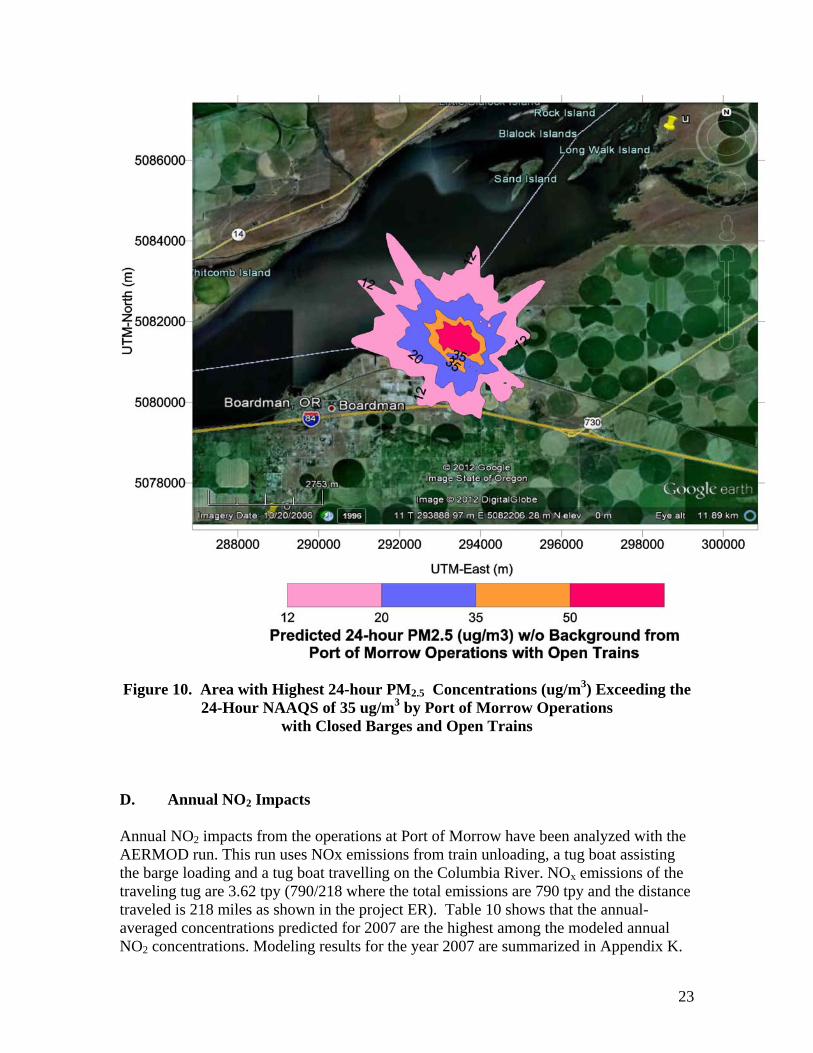
Due to high emissions from wind erosion, impacts from open barges are much higher than those from enclosed barges. NAAQS exceedances are plotted in Figure 8 for the closed barge/closed train scenario and Figure 9 for the open barge/closed train scenario. In both figures, the NAAQS exceedances are denoted by the contour of 12 ug/m3 (plus the background of 24 ug/m3). Figure 8 shows these exceedances for the closed barge/train scenario are predicted to only occur close to the project site in Oregon, i.e. south of the state line on the Columbia River. For the open barge/closed train scenario, they will extend north of the state line, i.e. in Washington. Another AERMOD modeling run has been performed to assess the impacts of the closed barge/open train scenario. The project ER indicates that up to two unit trains can be present onsite in any given hour (ER, p. 2-6). Their emissions (8.7 lb/hr=2*4.35 lb/hr) are modeled as area source with a length of 1500 ft (the length of rail lines within the MPP property) and a width of 19 ft (9.5 ft x 2). Modeling results are summarized in Appendix J. Table 9 shows that the highest 24-hour PM2.5 concentration of 388.6 ug/m3 is the largest among the modeled scenarios. The 24-hr NAAQS is also predicted to be exceeded by 10.8 times with the open trains. Figure 10 shows that the closed barge/open train scenario has the largest zone of exceedances among the modeled scenarios. The NAAQS exceedances are also predicted to occur in the Washington portion of the Columbia River.
Table 9. Predicted 24-hour PM2.5 (ug/m3) of Port of Morrow Operations
Modeling Scenario
Project Conc.
Backgr. Conc.
Total Conc.
NAAQS Percent Over NAAQS
Operation with closed barges &
closed trains
96.3 24.0 120.3 35.0 244%
Operation with open barges & closed trains
219.0 24.0 243.0 35.0 594%
Operation with closed barges &
open trains
388.6 24.0 412.6 35.0 1,079%

21
Figure 8. Area with Highest 24-hour PM2.5 Concentrations (ug/m3) Exceeding the
24-Hour NAAQS of 35 ug/m3 by Port of Morrow Operations with Closed Barges and Trains

22
Figure 9. Area with Highest 24-hour PM2.5 Concentrations (ug/m3) Exceeding the
24-Hour NAAQS of 35 ug/m3 by Port of Morrow Operations with Open Barges and Closed Trains
23
Figure 10. Area with Highest 24-hour PM2.5 Concentrations (ug/m3) Exceeding the
24-Hour NAAQS of 35 ug/m3 by Port of Morrow Operations with Closed Barges and Open Trains
D. Annual NO2 Impacts Annual NO2 impacts from the operations at Port of Morrow have been analyzed with the AERMOD run. This run uses NOx emissions from train unloading, a tug boat assisting the barge loading and a tug boat travelling on the Columbia River. NOx emissions of the traveling tug are 3.62 tpy (790/218 where the total emissions are 790 tpy and the distance traveled is 218 miles as shown in the project ER). Table 10 shows that the annual-averaged concentrations predicted for 2007 are the highest among the modeled annual NO2 concentrations. Modeling results for the year 2007 are summarized in Appendix K.

24
With the added background of 15 ug/m3, the annual NAAQS of 100 ug/m3 is predicted to be largely exceeded, by 16 times with Tier 1 and 12 times with Tier 2 as shown in Table 11. Figure 11 shows these exceedances occurring near the project site. No Tier 3 technique (OLM or PVMRM) has been performed. However, based on the large magnitude of the exceedances predicted by Tier 1 and Tier 2 and the results of applying Tier 3 techniques in 1-hour NO2 modeling described in Section III. A.1 above, exceedances of the annual NAAQS are also expected with Tier 3 techniques (OLM or PVMRM).
Table 10. Predicted Annual NO2 (ug/m3) of Port of Morrow Operations
Modeling Method
2007 2008
2009 2010 2011
Tier 1 -100% 1,750.9 1,660.5 1,366.5 1,430.8 1,572.8 Tier 2 - 75% 1,313.2 1,245.4 1,024.9 1,073.1 1,179.6
Table 11. Predicted Maximum Annual NO2 Impacts (ug/m3) of Port of Morrow
Operations
Modeling Method
Project Conc.
Backgr. Conc.
Total Conc.
NAAQS Percent Over NAAQS
Tier 1 -100% 1,750.9 15.0 1,765.9 100.0 1,666% Tier 2 - 75% 1,313.2 15.0 1,327.2 100.0 1,227%

25
Figure 11. Area with Annual NO2 (ug/m3) Exceeding the NAAQS of 100 ug/m3 by Port of Morrow Operations Alone
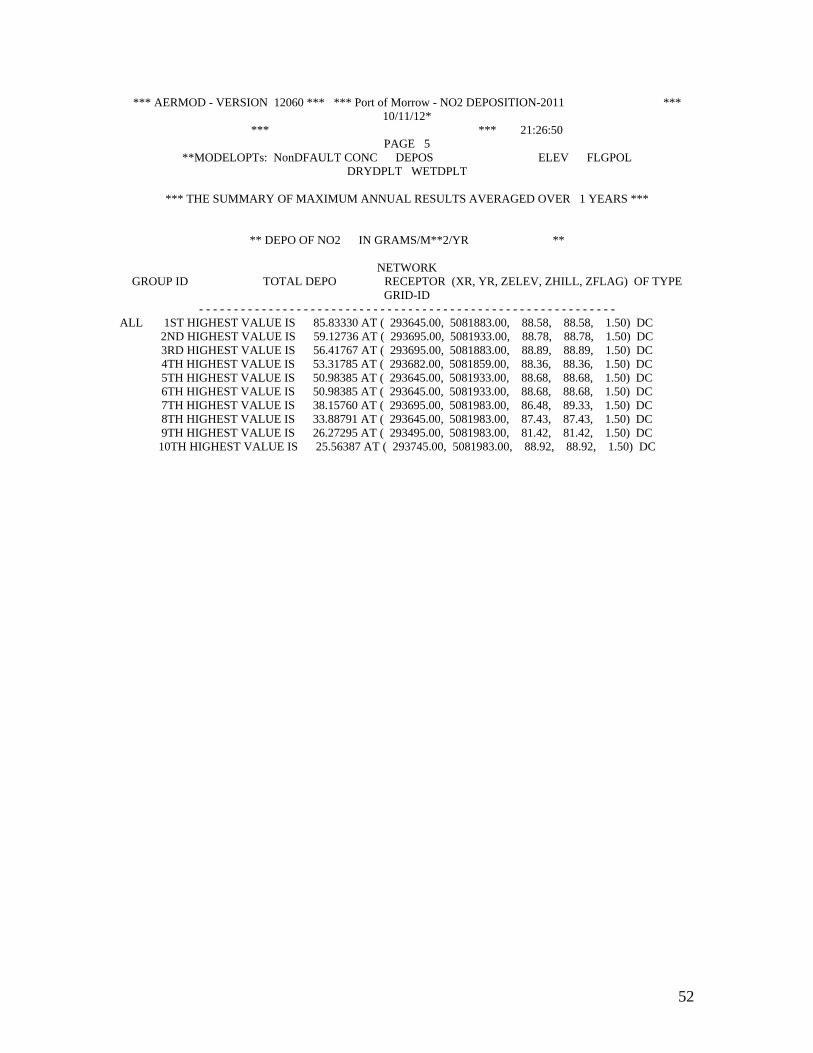
E. Nitrogen Deposition Impacts Nitrogen deposition impacts due to dry and wet deposition from the operations at Port of Morrow have been analyzed with the AERMOD run. This run uses NOx emissions from trains unloading and tug boats assisting the barge loading. A tug boat travelling on the Columbia River with NOx emissions of 3.62 tpy is also included. Modeling results for the year 2011 with the highest NO2 deposition fluxes are summarized in Appendix M. The maximum NO2 deposition fluxes (in g/m2/yr) predicted by AERMOD are converted into kg N/ha/yr by multiplying them by 3.043 = 10*(14/46) where 10 is the conversion factor from g/m2 to kg/ha and (14/46) is the mass ratio of nitrogen (N) over NO2. The converted maximum impacts are presented in Table 12 and a plot of the predicted deposition in

26
Figure 12 below. The predicted deposition fluxes largely exceed the ecological screening level (ESL) of 0.5 g/m2/yr or 5 kg/ha/yr recommended by US EPA (US EPA, 2008).
Table 12. Predicted Nitrogen Deposition (kg N/ha/yr) of Port of Morrow Operations
Modeling Method
2007 2008
2009 2010 2011 ESL
Tier 1 -100% 164.4 155.1 185.7 128.9 261.2 5 Tier 2 - 75% 123.3 116.3 139.3 96.7 195.9 5
Figure 12. Area with Annual NO2 Deposition (g/m2/yr) by Port of Morrow Operations Alone

27
IV. CONCLUSIONS Air quality impacts of NOx, PM2.5 and SO2 emissions from the proposed operations at Port of Morrow and Port Westward of the Morrow Pacific Project have been analyzed with the AERMOD model. For NO2, modeling techniques known as Tier 1 (full conversion) and Tier 2 recommended by the US EPA have been used for modeling at both ports. Tier 3 techniques (OLM and PVMRM) have also been used for modeling impacts at Port of Morrow. Using primarily project emissions documented in the project ER and the latest US EPA modeling guidance, the AERMOD model has predicted large exceedances of the NO2 1-hour NAAQS of 196 ug/m3 (by 9-63 times the NAAQS at Port of Morrow and by 19-24 times the NAAQS at Port Westward), the 24-hour PM2.5 at Port of Morrow (by 2.4-10.8 times the NAAQS of 35 ug/m3) and the annual NO2
NAAQS at Port of Morrow (by 12-17 times the NAAQS of 100 ug/m3). These large exceedances have been predicted to occur due to project emissions alone, i.e., without the addition of background concentrations and also in large areas around the project sites. NAAQS exceedances will occur in both Oregon and Washington. SO2 impacts are insignificant due to low emissions from the use of ultra low sulfur fuel for both locomotive and boat engines. The AERMOD model has also predicted large nitrogen deposition around the Port of Morrow. Thus, the proposed Morrow Pacific Project will cause very adverse air quality impacts in both Oregon and Washington. The AERMOD modeling files, including input/output files, meteorological data, ozone data and model executable, have been uploaded to box.com and are available from the folder: https://www.box.com/s/tseqhg95g7fe1jdw57lk . V. REFERENCES California Air Resources Board, 2006. Diesel Particulate Matter Exposure Assessment Study for the Ports of Los Angeles and Long Beach. Available at http://www.arb.ca.gov/ports/marinevess/documents/portstudy0406.pdf Fritz, S, 2007. US Locomotive After-treatment Retrofit Progress Report: SwRI Test Programs. Southwest Research Institute. Available at http://www.arb.ca.gov/railyard/ryagreement/112807fritz.pdf New Jersey DEP, 2009. Estimated Air Quality Impacts on Surrounding Communities of PM2.5 and SO2 Emissions Resulting from Marine Operations at Elizabeth Port Authority Marine Terminal and Port Newark. Available at http://www.state.nj.us/dep/stopthesoot/Port%20risk%20Summary-final%2010-9-09.pdf Oregon DEQ, 2012. 2011 Oregon Air Quality Data Summaries. Available at: http://www.deq.state.or.us/aq/forms/2011AirQualityAnnualReport.pdf

28
U.S. EPA, 2012. Addendum to User’s Guide of the AMS/EPA Regulatory Model AERMOD version 12060, February 2012. Available at: http://www.epa.gov/ttn/scram/models/aermod/aermod_userguide.zip U.S. EPA, 2011. Additional Clarification Regarding Application of Appendix W Modeling Guidance for the 1-hour NO2 NAAQS. Memorandum issued on March 1st, 2011 from Tyler Fox, Leader of Air Quality Modeling Group, OAQPS. Available at http://www.epa.gov/region7/air/nsr/nsrmemos/appwNO2_2.pdf U.S. EPA, 2010a. Applicability of Appendix W Modeling Guidance for the 1-hour NO2 NAAQS. Memorandum issued on June 28, 2010 from Tyler Fox, Leader of Air Quality Modeling Group, OAQPS. Available at http://www.epa.gov/ttn/scram/guidance/clarification/ClarificationMemo_AppendixW_Hourly-NO2-NAAQS_FINAL_06-28-2010.pdf U.S. EPA, 2010b. Guidance Concerning the Implementation of the 1-hour SO2 NAAQS for the Prevention of Significant Deterioration Program. Memorandum issued on August 23, 2010 from Stephen D. Page, Director of OAQPS. Available at http://www.epa.gov/region07/air/nsr/nsrmemos/appwso2.pdf U.S. EPA, 2010c. Applicability of Appendix W Modeling Guidance for the 1-hour SO2
NAAQS. Memorandum issued on August 23, 2010 from Tyler Fox, Leader of Air Quality Modeling Group, OAQPS. Available at http://www.epa.gov/region07/air/nsr/nsrmemos/appwso2.pdf U.S. EPA, 2010d. Modeling Procedures for Demonstrating Compliance with PM2.5 NAAQS. Memorandum issued on March 23, 2010 by Stephen D. Page, Director of OAQPS. Available at: http://www.epa.gov/region07/air/nsr/nsrmemos/pm25memo.pdf U.S. EPA, 2008. Biological Assessment for Gateway Energy and Coke Company, Granite City, Illinois. Available at: http://yosemite.epa.gov/r5/r5ard.nsf/c408a2009710018f8625716f004d9038/bab8e1b0ab50bdfc86257412006c2f20/$FILE/GatewayBioAssessment.pdf

29
Appendix A
Summary of AERMOD-Predicted 1-hour NO2 Impacts (Full Conversion) of Port of Morrow Operations

30
*** AERMOD - VERSION 12060 *** *** Port of Morrow - 1-hr NO2 *** 10/01/12 *** *** 19:50:07 PAGE 616
**MODELOPTs: CONC ELEV FLGPOL
*** THE SUMMARY OF MAXIMUM 8TH-HIGHEST MAX DAILY 1-HR RESULTS AVERAGED OVER 5 YEARS ***
** CONC OF NO2 IN MICROGRAMS/M**3 **
NETWORK GROUP ID AVERAGE CONC RECEPTOR (XR, YR, ZELEV, ZHILL, ZFLAG) OF TYPE
GRID-ID - - - - - - - - - - - - - - - - - - - - - - - - - - - - - - - - - - - - - - - - - - - - - - - - - - - - - - - - - - - -
ALL 1ST HIGHEST VALUE IS 12000.43671 AT ( 293682.00, 5081859.00, 88.36, 88.36, 1.50) DC 2ND HIGHEST VALUE IS 11011.15662 AT ( 293495.00, 5081933.00, 81.42, 81.42, 1.50) DC 3RD HIGHEST VALUE IS 9546.46567 AT ( 293634.00, 5081812.00, 88.06, 88.06, 1.50) DC 4TH HIGHEST VALUE IS 8619.08562 AT ( 293535.00, 5081880.00, 84.73, 90.01, 1.50) DC 5TH HIGHEST VALUE IS 8446.96889 AT ( 293486.00, 5081914.00, 81.42, 90.01, 1.50) DC 6TH HIGHEST VALUE IS 7982.12692 AT ( 293695.00, 5081883.00, 88.89, 88.89, 1.50) DC 7TH HIGHEST VALUE IS 6129.74109 AT ( 293495.00, 5081983.00, 81.42, 81.42, 1.50) DC 8TH HIGHEST VALUE IS 5478.30847 AT ( 293645.00, 5081883.00, 88.58, 88.58, 1.50) DC 9TH HIGHEST VALUE IS 5425.12949 AT ( 293436.00, 5081947.00, 81.42, 81.42, 1.50) DC 10TH HIGHEST VALUE IS 5407.11800 AT ( 293545.00, 5081933.00, 81.42, 88.09, 1.50) DC
31
Appendix B
Summary of AERMOD-Predicted 1-hour NO2 Impacts (Tier 3-OLM) of Port of Morrow Operations

32
*** AERMOD - VERSION 12060 *** *** Port of Morrow - 1-hr NO2 -OLM *** 10/12/12
*** *** 18:19:34 PAGE 5
**MODELOPTs: NonDFAULT CONC ELEV FLGPOL OLM
*** THE SUMMARY OF MAXIMUM 8TH-HIGHEST MAX DAILY 1-HR RESULTS AVERAGED
OVER 5 YEARS ***
** CONC OF NO2 IN MICROGRAMS/M**3 **
NETWORK GROUP ID AVERAGE CONC RECEPTOR (XR, YR, ZELEV, ZHILL, ZFLAG) OF TYPE
GRID-ID - - - - - - - - - - - - - - - - - - - - - - - - - - - - - - - - - - - - - - - - - - - - - - - - - - - - - - - - - - - -
ALL 1ST HIGHEST VALUE IS 1872.57842 AT ( 293682.00, 5081859.00, 88.36, 88.36, 1.50) DC 2ND HIGHEST VALUE IS 1506.09918 AT ( 293634.00, 5081812.00, 88.06, 88.06, 1.50) DC 3RD HIGHEST VALUE IS 1269.56877 AT ( 293695.00, 5081883.00, 88.89, 88.89, 1.50) DC 4TH HIGHEST VALUE IS 1157.13116 AT ( 293495.00, 5081933.00, 81.42, 81.42, 1.50) DC 5TH HIGHEST VALUE IS 930.96011 AT ( 293535.00, 5081880.00, 84.73, 90.01, 1.50) DC 6TH HIGHEST VALUE IS 898.70613 AT ( 293486.00, 5081914.00, 81.42, 90.01, 1.50) DC 7TH HIGHEST VALUE IS 888.67937 AT ( 293645.00, 5081883.00, 88.58, 88.58, 1.50) DC 8TH HIGHEST VALUE IS 804.59597 AT ( 293729.00, 5081905.00, 89.36, 89.36, 1.50) DC 9TH HIGHEST VALUE IS 708.92971 AT ( 293645.00, 5081933.00, 88.68, 88.68, 1.50) DC 10TH HIGHEST VALUE IS 708.92971 AT ( 293645.00, 5081933.00, 88.68, 88.68, 1.50) DC

33
Appendix C
Summary of AERMOD-Predicted 1-hour NO2 Impacts (Tier 3-PVMRM) of Port of Morrow Operations
34
*** AERMOD - VERSION 12060 *** *** Port of Morrow - 1-hr NO2 -PVMRM ***
10/12/12 *** *** 20:48:14
PAGE 5 **MODELOPTs: NonDFAULT CONC ELEV FLGPOL
PVMRM
*** THE SUMMARY OF MAXIMUM 8TH-HIGHEST MAX DAILY 1-HR RESULTS AVERAGED OVER 5 YEARS ***
** CONC OF NO2 IN MICROGRAMS/M**3 **
NETWORK GROUP ID AVERAGE CONC RECEPTOR (XR, YR, ZELEV, ZHILL, ZFLAG) OF TYPE
GRID-ID - - - - - - - - - - - - - - - - - - - - - - - - - - - - - - - - - - - - - - - - - - - - - - - - - - - - - - - - - - - -
ALL 1ST HIGHEST VALUE IS 2064.26610 AT ( 293682.00, 5081859.00, 88.36, 88.36, 1.50) DC 2ND HIGHEST VALUE IS 1640.03383 AT ( 293634.00, 5081812.00, 88.06, 88.06, 1.50) DC 3RD HIGHEST VALUE IS 1453.05752 AT ( 293495.00, 5081933.00, 81.42, 81.42, 1.50) DC 4TH HIGHEST VALUE IS 1349.15566 AT ( 293695.00, 5081883.00, 88.89, 88.89, 1.50) DC 5TH HIGHEST VALUE IS 1276.62739 AT ( 293486.00, 5081914.00, 81.42, 90.01, 1.50) DC 6TH HIGHEST VALUE IS 1137.14103 AT ( 293535.00, 5081880.00, 84.73, 90.01, 1.50) DC 7TH HIGHEST VALUE IS 932.58202 AT ( 293645.00, 5081883.00, 88.58, 88.58, 1.50) DC 8TH HIGHEST VALUE IS 854.25416 AT ( 293495.00, 5081983.00, 81.42, 81.42, 1.50) DC 9TH HIGHEST VALUE IS 826.47500 AT ( 293436.00, 5081947.00, 81.42, 81.42, 1.50) DC 10TH HIGHEST VALUE IS 819.38900 AT ( 293729.00, 5081905.00, 89.36, 89.36, 1.50) DC

35
Appendix D
Summary of AERMOD-Predicted 1-hour NO2 Impacts (Full Conversion) of Port Westward Operations with Transloader using Emergency Power

36
*** AERMOD - VERSION 12060 *** *** Port Westward - 1-hr NO2 *** 09/24/12 *** *** 16:37:47
PAGE 5 **MODELOPTs: CONC ELEV FLGPOL
*** THE SUMMARY OF MAXIMUM 8TH-HIGHEST MAX DAILY 1-HR RESULTS AVERAGED OVER 5 YEARS ***
** CONC OF NO2 IN MICROGRAMS/M**3 **
NETWORK GROUP ID AVERAGE CONC RECEPTOR (XR, YR, ZELEV, ZHILL, ZFLAG) OF TYPE
GRID-ID - - - - - - - - - - - - - - - - - - - - - - - - - - - - - - - - - - - - - - - - - - - - - - - - - - - - - - - - - - - -
ALL 1ST HIGHEST VALUE IS 4669.95119 AT ( 485884.00, 5114327.00, 1.82, 173.28, 1.50) DC 2ND HIGHEST VALUE IS 4019.45010 AT ( 485834.00, 5114327.00, 1.84, 173.28, 1.50) DC 3RD HIGHEST VALUE IS 4019.45010 AT ( 485834.00, 5114327.00, 1.84, 173.28, 1.50) DC 4TH HIGHEST VALUE IS 3552.36381 AT ( 485884.00, 5114377.00, 1.86, 173.28, 1.50) DC 5TH HIGHEST VALUE IS 3464.09646 AT ( 485934.00, 5114327.00, 1.81, 173.28, 1.50) DC 6TH HIGHEST VALUE IS 3464.09646 AT ( 485934.00, 5114327.00, 1.81, 173.28, 1.50) DC 7TH HIGHEST VALUE IS 3308.75055 AT ( 485834.00, 5114377.00, 1.88, 173.28, 1.50) DC 8TH HIGHEST VALUE IS 2985.93516 AT ( 485784.00, 5114327.00, 1.86, 178.84, 1.50) DC 9TH HIGHEST VALUE IS 2979.22153 AT ( 485884.00, 5114277.00, 1.79, 173.28, 1.50) DC 10TH HIGHEST VALUE IS 2935.63381 AT ( 485934.00, 5114377.00, 1.85, 173.28, 1.50) DC

37
Appendix E
Summary of AERMOD-Predicted 1-hour NO2 Impacts (Full Conversion) of Port Westward Operations with Transloader using Shore Power
38
*** AERMOD - VERSION 12060 *** *** Port Westward/Shore Power - 1-hr NO2 *** 10/10/12
*** *** 09:16:03 PAGE 5
**MODELOPTs: CONC ELEV FLGPOL
*** THE SUMMARY OF MAXIMUM 8TH-HIGHEST MAX DAILY 1-HR RESULTS AVERAGED OVER 5 YEARS ***
** CONC OF NO2 IN MICROGRAMS/M**3 **
NETWORK GROUP ID AVERAGE CONC RECEPTOR (XR, YR, ZELEV, ZHILL, ZFLAG) OF TYPE
GRID-ID - - - - - - - - - - - - - - - - - - - - - - - - - - - - - - - - - - - - - - - - - - - - - - - - - - - - - - - - - - - -
ALL 1ST HIGHEST VALUE IS 4669.94844 AT ( 485884.00, 5114327.00, 1.82, 173.28, 1.50) DC 2ND HIGHEST VALUE IS 4019.45010 AT ( 485834.00, 5114327.00, 1.84, 173.28, 1.50) DC 3RD HIGHEST VALUE IS 4019.45010 AT ( 485834.00, 5114327.00, 1.84, 173.28, 1.50) DC 4TH HIGHEST VALUE IS 3552.36381 AT ( 485884.00, 5114377.00, 1.86, 173.28, 1.50) DC 5TH HIGHEST VALUE IS 3464.09646 AT ( 485934.00, 5114327.00, 1.81, 173.28, 1.50) DC 6TH HIGHEST VALUE IS 3464.09646 AT ( 485934.00, 5114327.00, 1.81, 173.28, 1.50) DC 7TH HIGHEST VALUE IS 3308.75055 AT ( 485834.00, 5114377.00, 1.88, 173.28, 1.50) DC 8TH HIGHEST VALUE IS 2985.93516 AT ( 485784.00, 5114327.00, 1.86, 178.84, 1.50) DC 9TH HIGHEST VALUE IS 2979.22153 AT ( 485884.00, 5114277.00, 1.79, 173.28, 1.50) DC 10TH HIGHEST VALUE IS 2935.63381 AT ( 485934.00, 5114377.00, 1.85, 173.28, 1.50) DC

39
Appendix F
Summary of AERMOD-Predicted 1-hour SO2 Impacts of Port of Morrow Operations with Ultra Low Sulfur Fuel
40
*** AERMOD - VERSION 12060 *** *** Port of Morrow - 1-hr SO2 *** 10/05/12 *** *** 06:29:15
PAGE 5 **MODELOPTs: CONC ELEV FLGPOL
*** THE SUMMARY OF MAXIMUM 4TH-HIGHEST MAX DAILY 1-HR RESULTS AVERAGED OVER 5 YEARS ***
** CONC OF SO2 IN MICROGRAMS/M**3 **
NETWORK GROUP ID AVERAGE CONC RECEPTOR (XR, YR, ZELEV, ZHILL, ZFLAG) OF TYPE
GRID-ID - - - - - - - - - - - - - - - - - - - - - - - - - - - - - - - - - - - - - - - - - - - - - - - - - - - - - - - - - - - -
ALL 1ST HIGHEST VALUE IS 7.71659 AT ( 293682.00, 5081859.00, 88.36, 88.36, 1.50) DC 2ND HIGHEST VALUE IS 6.87149 AT ( 293634.00, 5081812.00, 88.06, 88.06, 1.50) DC 3RD HIGHEST VALUE IS 5.11050 AT ( 293695.00, 5081883.00, 88.89, 88.89, 1.50) DC 4TH HIGHEST VALUE IS 4.23968 AT ( 293645.00, 5081883.00, 88.58, 88.58, 1.50) DC 5TH HIGHEST VALUE IS 3.29040 AT ( 293729.00, 5081905.00, 89.36, 89.36, 1.50) DC 6TH HIGHEST VALUE IS 3.11441 AT ( 293645.00, 5081933.00, 88.68, 88.68, 1.50) DC 7TH HIGHEST VALUE IS 3.11441 AT ( 293645.00, 5081933.00, 88.68, 88.68, 1.50) DC 8TH HIGHEST VALUE IS 3.01923 AT ( 293495.00, 5081933.00, 81.42, 81.42, 1.50) DC 9TH HIGHEST VALUE IS 2.90729 AT ( 293695.00, 5081933.00, 88.78, 88.78, 1.50) DC 10TH HIGHEST VALUE IS 2.85823 AT ( 293591.00, 5081747.00, 87.42, 87.42, 1.50) DC

41
Appendix G
Summary of AERMOD-Predicted 1-hour SO2 Impacts of Port Westward Operations with Ultra Low Sulfur Fuel

42
*** AERMOD - VERSION 12060 *** *** Port Westward - 1-hr SO2 *** 10/05/12 *** *** 09:08:23
PAGE 5 **MODELOPTs: CONC ELEV FLGPOL
*** THE SUMMARY OF MAXIMUM 4TH-HIGHEST MAX DAILY 1-HR RESULTS AVERAGED OVER 5 YEARS ***
** CONC OF SO2 IN MICROGRAMS/M**3 **
NETWORK GROUP ID AVERAGE CONC RECEPTOR (XR, YR, ZELEV, ZHILL, ZFLAG) OF TYPE
GRID-ID - - - - - - - - - - - - - - - - - - - - - - - - - - - - - - - - - - - - - - - - - - - - - - - - - - - - - - - - - - - -
ALL 1ST HIGHEST VALUE IS 87.08375 AT ( 485384.00, 5114627.00, 66.26, 173.28, 1.50) DC 2ND HIGHEST VALUE IS 80.86337 AT ( 485434.00, 5114677.00, 72.72, 173.28, 1.50) DC 3RD HIGHEST VALUE IS 71.77678 AT ( 485184.00, 5114527.00, 71.23, 173.28, 1.50) DC 4TH HIGHEST VALUE IS 71.62989 AT ( 485284.00, 5114577.00, 73.47, 173.28, 1.50) DC 5TH HIGHEST VALUE IS 68.69739 AT ( 485534.00, 5114727.00, 80.33, 173.28, 1.50) DC 6TH HIGHEST VALUE IS 68.69739 AT ( 485534.00, 5114727.00, 80.33, 173.28, 1.50) DC 7TH HIGHEST VALUE IS 66.50215 AT ( 485084.00, 5114477.00, 66.86, 178.84, 1.50) DC 8TH HIGHEST VALUE IS 65.75496 AT ( 485484.00, 5114727.00, 81.25, 173.28, 1.50) DC 9TH HIGHEST VALUE IS 65.43326 AT ( 485334.00, 5114627.00, 78.25, 173.28, 1.50) DC 10TH HIGHEST VALUE IS 65.43326 AT ( 485334.00, 5114627.00, 78.25, 173.28, 1.50) DC

43
Appendix H
Summary of AERMOD-Predicted 24-hour PM2.5 Impacts of Port of Morrow Operations with Enclosed Barges and Trains
44
*** AERMOD - VERSION 12060 *** *** Port of Morrow - 24hr PM2.5 *** 10/06/12
*** *** 12:32:11 PAGE 4
**MODELOPTs: CONC ELEV FLGPOL
*** THE SUMMARY OF MAXIMUM 1ST-HIGHEST 24-HR RESULTS AVERAGED OVER 5 YEARS ***
** CONC OF PM25 IN MICROGRAMS/M**3 **
NETWORK GROUP ID AVERAGE CONC RECEPTOR (XR, YR, ZELEV, ZHILL, ZFLAG) OF TYPE
GRID-ID - - - - - - - - - - - - - - - - - - - - - - - - - - - - - - - - - - - - - - - - - - - - - - - - - - - - - - - - - - - -
ALL 1ST HIGHEST VALUE IS 96.34646 AT ( 293634.00, 5081812.00, 88.06, 88.06, 1.50) DC 2ND HIGHEST VALUE IS 92.71799 AT ( 293682.00, 5081859.00, 88.36, 88.36, 1.50) DC 3RD HIGHEST VALUE IS 49.79568 AT ( 293695.00, 5081883.00, 88.89, 88.89, 1.50) DC 4TH HIGHEST VALUE IS 43.46942 AT ( 293645.00, 5081883.00, 88.58, 88.58, 1.50) DC 5TH HIGHEST VALUE IS 39.06540 AT ( 293486.00, 5081914.00, 81.42, 90.01, 1.50) DC 6TH HIGHEST VALUE IS 33.96834 AT ( 293535.00, 5081880.00, 84.73, 90.01, 1.50) DC 7TH HIGHEST VALUE IS 31.94523 AT ( 293495.00, 5081933.00, 81.42, 81.42, 1.50) DC 8TH HIGHEST VALUE IS 30.02961 AT ( 293729.00, 5081905.00, 89.36, 89.36, 1.50) DC 9TH HIGHEST VALUE IS 29.26999 AT ( 293591.00, 5081747.00, 87.42, 87.42, 1.50) DC 10TH HIGHEST VALUE IS 26.18454 AT ( 293595.00, 5081733.00, 87.43, 87.43, 1.50) DC

45
Appendix I
Summary of AERMOD-Predicted 24-hour PM2.5 Impacts of Port of Morrow Operations with Open Barges and Closed Trains

46
*** AERMOD - VERSION 12060 *** *** Port of Morrow - Open barge - 24hr PM2.5 *** 10/12/12
*** *** 03:28:27 PAGE 4
**MODELOPTs: CONC ELEV FLGPOL
*** THE SUMMARY OF MAXIMUM 1ST-HIGHEST 24-HR RESULTS AVERAGED OVER 5 YEARS ***
** CONC OF PM25 IN MICROGRAMS/M**3 **
NETWORK GROUP ID AVERAGE CONC RECEPTOR (XR, YR, ZELEV, ZHILL, ZFLAG) OF TYPE
GRID-ID - - - - - - - - - - - - - - - - - - - - - - - - - - - - - - - - - - - - - - - - - - - - - - - - - - - - - - - - - - - -
ALL 1ST HIGHEST VALUE IS 96.39479 AT ( 293634.00, 5081812.00, 88.06, 88.06, 1.50) DC 2ND HIGHEST VALUE IS 93.31912 AT ( 293682.00, 5081859.00, 88.36, 88.36, 1.50) DC 3RD HIGHEST VALUE IS 74.26387 AT ( 293385.00, 5081765.00, 81.44, 89.12, 1.50) DC 4TH HIGHEST VALUE IS 58.07956 AT ( 293486.00, 5081914.00, 81.42, 90.01, 1.50) DC 5TH HIGHEST VALUE IS 52.50092 AT ( 293535.00, 5081880.00, 84.73, 90.01, 1.50) DC 6TH HIGHEST VALUE IS 51.74925 AT ( 293495.00, 5081933.00, 81.42, 81.42, 1.50) DC 7TH HIGHEST VALUE IS 50.58559 AT ( 293436.00, 5081947.00, 81.42, 81.42, 1.50) DC 8TH HIGHEST VALUE IS 50.00263 AT ( 293695.00, 5081883.00, 88.89, 88.89, 1.50) DC 9TH HIGHEST VALUE IS 48.44197 AT ( 293436.00, 5081761.00, 86.93, 86.93, 1.50) DC 10TH HIGHEST VALUE IS 47.93824 AT ( 293303.00, 5081902.00, 81.42, 81.42, 1.50) DC

47
Appendix J
Summary of AERMOD-Predicted 24-hour PM2.5 Impacts of Port of Morrow Operations with Closed Barges and Open Trains

48
*** AERMOD - VERSION 12060 *** *** Port of Morrow - Open Train - 24hrPM2.5 *** 10/28/12
*** *** 21:07:10 PAGE 4
**MODELOPTs: CONC ELEV FLGPOL
*** THE SUMMARY OF MAXIMUM 1ST-HIGHEST 24-HR RESULTS AVERAGED OVER 5 YEARS ***
** CONC OF PM25 IN MICROGRAMS/M**3 **
NETWORK GROUP ID AVERAGE CONC RECEPTOR (XR, YR, ZELEV, ZHILL, ZFLAG) OF TYPE
GRID-ID - - - - - - - - - - - - - - - - - - - - - - - - - - - - - - - - - - - - - - - - - - - - - - - - - - - - - - - - - - - -
ALL 1ST HIGHEST VALUE IS 388.58720 AT ( 293395.00, 5081533.00, 92.82, 92.82, 1.50) DC 2ND HIGHEST VALUE IS 369.14316 AT ( 293445.00, 5081483.00, 93.82, 93.82, 1.50) DC 3RD HIGHEST VALUE IS 329.09982 AT ( 293495.00, 5081433.00, 94.48, 94.48, 1.50) DC 4TH HIGHEST VALUE IS 321.34654 AT ( 293545.00, 5081383.00, 94.61, 94.61, 1.50) DC 5TH HIGHEST VALUE IS 320.74418 AT ( 293595.00, 5081333.00, 94.54, 96.30, 1.50) DC 6TH HIGHEST VALUE IS 206.12712 AT ( 293395.00, 5081583.00, 91.05, 91.05, 1.50) DC 7TH HIGHEST VALUE IS 203.49253 AT ( 293645.00, 5081283.00, 96.25, 96.25, 1.50) DC 8TH HIGHEST VALUE IS 175.37558 AT ( 293445.00, 5081533.00, 92.35, 92.35, 1.50) DC 9TH HIGHEST VALUE IS 175.37558 AT ( 293445.00, 5081533.00, 92.35, 92.35, 1.50) DC 10TH HIGHEST VALUE IS 174.66553 AT ( 293345.00, 5081633.00, 91.60, 91.60, 1.50) DC

49
Appendix K
Summary of AERMOD-Predicted Annual NO2 Impacts of
Port of Morrow Operations

50
*** AERMOD - VERSION 12060 *** *** Port of Morrow - NO2 DEPOSITION - 2007 *** 10/11/12
*** *** 08:34:29 PAGE 4
**MODELOPTs: NonDFAULT CONC DEPOS ELEV FLGPOL DRYDPLT WETDPLT
*** THE SUMMARY OF MAXIMUM ANNUAL RESULTS AVERAGED OVER 1 YEARS
***
** CONC OF NO2 IN MICROGRAMS/M**3 **
NETWORK GROUP ID AVERAGE CONC RECEPTOR (XR, YR, ZELEV, ZHILL, ZFLAG) OF TYPE
GRID-ID - - - - - - - - - - - - - - - - - - - - - - - - - - - - - - - - - - - - - - - - - - - - - - - - - - - - - - - - - - - -
ALL 1ST HIGHEST VALUE IS 1750.88666 AT ( 293682.00, 5081859.00, 88.36, 88.36, 1.50) DC 2ND HIGHEST VALUE IS 1052.50428 AT ( 293695.00, 5081883.00, 88.89, 88.89, 1.50) DC 3RD HIGHEST VALUE IS 635.06315 AT ( 293729.00, 5081905.00, 89.36, 89.36, 1.50) DC 4TH HIGHEST VALUE IS 435.52880 AT ( 293745.00, 5081933.00, 89.41, 89.41, 1.50) DC 5TH HIGHEST VALUE IS 435.52880 AT ( 293745.00, 5081933.00, 89.41, 89.41, 1.50) DC 6TH HIGHEST VALUE IS 354.24233 AT ( 293695.00, 5081933.00, 88.78, 88.78, 1.50) DC 7TH HIGHEST VALUE IS 330.98272 AT ( 293545.00, 5081933.00, 81.42, 88.09, 1.50) DC 8TH HIGHEST VALUE IS 330.98272 AT ( 293545.00, 5081933.00, 81.42, 88.09, 1.50) DC 9TH HIGHEST VALUE IS 316.01375 AT ( 293495.00, 5081983.00, 81.42, 81.42, 1.50) DC 10TH HIGHEST VALUE IS 305.49073 AT ( 293795.00, 5081933.00, 89.75, 89.75, 1.50) DC

51
Appendix M
Summary of AERMOD-Predicted Nitrogen Deposition Impacts of
Port of Morrow Operations
52
*** AERMOD - VERSION 12060 *** *** Port of Morrow - NO2 DEPOSITION-2011 *** 10/11/12*
*** *** 21:26:50 PAGE 5
**MODELOPTs: NonDFAULT CONC DEPOS ELEV FLGPOL DRYDPLT WETDPLT
*** THE SUMMARY OF MAXIMUM ANNUAL RESULTS AVERAGED OVER 1 YEARS ***
** DEPO OF NO2 IN GRAMS/M**2/YR **
NETWORK GROUP ID TOTAL DEPO RECEPTOR (XR, YR, ZELEV, ZHILL, ZFLAG) OF TYPE
GRID-ID - - - - - - - - - - - - - - - - - - - - - - - - - - - - - - - - - - - - - - - - - - - - - - - - - - - - - - - - - - - -
ALL 1ST HIGHEST VALUE IS 85.83330 AT ( 293645.00, 5081883.00, 88.58, 88.58, 1.50) DC 2ND HIGHEST VALUE IS 59.12736 AT ( 293695.00, 5081933.00, 88.78, 88.78, 1.50) DC 3RD HIGHEST VALUE IS 56.41767 AT ( 293695.00, 5081883.00, 88.89, 88.89, 1.50) DC 4TH HIGHEST VALUE IS 53.31785 AT ( 293682.00, 5081859.00, 88.36, 88.36, 1.50) DC 5TH HIGHEST VALUE IS 50.98385 AT ( 293645.00, 5081933.00, 88.68, 88.68, 1.50) DC 6TH HIGHEST VALUE IS 50.98385 AT ( 293645.00, 5081933.00, 88.68, 88.68, 1.50) DC 7TH HIGHEST VALUE IS 38.15760 AT ( 293695.00, 5081983.00, 86.48, 89.33, 1.50) DC 8TH HIGHEST VALUE IS 33.88791 AT ( 293645.00, 5081983.00, 87.43, 87.43, 1.50) DC 9TH HIGHEST VALUE IS 26.27295 AT ( 293495.00, 5081983.00, 81.42, 81.42, 1.50) DC 10TH HIGHEST VALUE IS 25.56387 AT ( 293745.00, 5081983.00, 88.92, 88.92, 1.50) DC