aem accepts, published online ahead of print on 10 may...
TRANSCRIPT
1
Arsenic bioremediation by biogenic iron oxides and sulfides 1
2
123#*Enoma O. Omoregie, 4,5Raoul-Marie Couture, 4,5Philippe Van Cappellen, 1Claire L. 3
Corkhill, 1John M. Charnock, 1David A. Polya, 1David Vaughan, 3Karolien Vanbroekhoven, 4
1Jonathan R. Lloyd 5
6
1SEAES, The University of Manchester, Manchester, UK 7
2Department of Earth Sciences, Utrecht University, Utrecht, Netherlands 8
3Flemish Institute for Technological Research, Mol, Belgium 9
4School of Earth and Atmospheric Sciences, Georgia Institute of Technology, Atlanta, 10
Georgia, USA 11
5Earth and Environmental Sciences, University of Waterloo, Waterloo, Canada 12
13
#Address correspondences: Enoma O. Omoregie 14
Centro de Astrobiología (CSIC/INTA), Instituto Nacional de Técnica Aeroespacial 15
Ctra de Torrejón a Ajalvir, km 4 16
28850 Torrejón de Ardoz, Madrid Spain 17
([email protected]) 18
19
*Current location: Centro de Astrobiología, Madrid, Spain 20
21
Running title: Arsenic bioremediation 22
Keywords: arsenic, iron sulfide, remediation, hydrous ferric oxide, bacteria, groundwater, 23
sulfate reduction, iron oxidation, metals 24
25
26
Copyright © 2013, American Society for Microbiology. All Rights Reserved.Appl. Environ. Microbiol. doi:10.1128/AEM.00683-13 AEM Accepts, published online ahead of print on 10 May 2013
on June 14, 2018 by guesthttp://aem
.asm.org/
Dow
nloaded from
2
Abstract 27
Microcosms containing sediment from an aquifer in Cambodia with naturally elevated 28
levels of arsenic (As) in the associated groundwater were used to evaluate the effectiveness 29
of microbially-mediated production of iron minerals for in situ As remediation. The 30
microcosms were first incubated without amendments for 28 days and the release of As and 31
other geogenic chemicals from the sediments into the aqueous phase was monitored. Nitrate, 32
or a mixture of sulfate and lactate, was then added to stimulate biological Fe(II) oxidation or 33
sulfate reduction, respectively. Without treatment soluble As concentrations reached 3.9 34
(±0.9) μM at the end of the 143 day experiment. However, in the nitrate and sulfate plus 35
lactate amended microcosms, soluble As levels decreased to 0.01 and 0.41(±0.13) μM, 36
respectively, by the end of the experiment. Analyses using a range of biogeochemical and 37
mineralogical tools, indicated that sorption onto freshly formed hydrous ferric oxide (HFO) 38
and iron sulfide mineral phases are the likely mechanisms for As removal in the respective 39
treatments. Incorporation of the experimental results into a one-dimensional transport-40
reaction model suggests that, under conditions representative of the Cambodian aquifer, the 41
in situ precipitation of HFO would be effective in bringing groundwater into compliance with 42
the World Health Organization (WHO) provisional guideline value for As (10 ppb or 0.13 43
μM), although soluble Mn release accompanying microbial Fe(II) oxidation presents a 44
potential health concern. In contrast, production of biogenic iron sulfide minerals would not 45
remediate the groundwater As concentration below the recommended WHO limit. 46
47
48
on June 14, 2018 by guesthttp://aem
.asm.org/
Dow
nloaded from
3
Introduction 49
The release of arsenic from sediments into groundwaters is a global problem that has 50
been highlighted in numerous studies over the past decade (1, 2). The consumption of waters 51
containing elevated As levels has been linked to numerous types of cancers, including 52
kidney, lung and bladder cancer (3) as well as various attritional diseases (4). The World 53
Health Organization (WHO) provisional guide value for the maximum concentration of As in 54
drinking water is 10 ppb or 0.13 µM (5). However, tens of millions of people worldwide are 55
exposed to arsenic levels in excess of 10 ppb (2, 6). In Southeastern Asia alone the number 56
may be over 40 million people (7). The microbially-mediated dissolution of iron- and 57
arsenic-bearing minerals, leading to the release of As to groundwater (8), is widely believed 58
to be one of the major causes of As groundwater contamination in this region. 59
Despite the global occurrence of groundwater As concentrations exceeding safe 60
drinking water standards, and the broad range of proposed As remediation technologies based 61
on volatilization , precipitation , sorption and ion exchange , the large scale implementation 62
of in situ attenuation and remediation schemes remains elusive. Arsenic remediation through 63
co-precipitation with biogenically formed Fe(III) (oxyhydr)oxides (also termed ‘hydrous 64
ferric oxides’ or HFO) or iron sulfides represents one of the more attractive approaches, 65
because it offers simple and potentially cost effective solutions. 66
The sorption of As and other metalloids and metals by HFO has been studied 67
extensively (9, 10). A number of experimental studies have investigated the potential 68
remediation of As based on its affinity for HFO (11, 12). Biologically, HFO is produced by 69
the transfer of electrons from Fe(II) to a variety of electron acceptors, including oxygen and 70
nitrate (13, 14). A variety of organisms present in freshwater systems have been shown to be 71
able to couple Fe(II) oxidation to the reduction of nitrate (15). The activities of these 72
organisms can profoundly affect Fe and As cycling in environmental systems as they provide 73
on June 14, 2018 by guesthttp://aem
.asm.org/
Dow
nloaded from
4
a sink for both Fe(II) and As (16). Reducing groundwaters with elevated levels of As also 74
often exhibit elevated Fe(II) concentrations (17, 18) as a result of microbial Fe(III) reduction. 75
Chemically, Fe(II) is a strong reductant and can readily undergo biotic or abiotic oxidation 76
at circumneutral pH. Stimulating Fe(II) oxidation in these instances would result in the 77
production of HFO and the subsequent removal of As through adsorption and coprecipitation. 78
This concept has been demonstrated in experiments with lake sediments (16), as well as in 79
sand-filled bioreactors inoculated with denitrifying sludge (11). 80
The ability of free sulfide to form insoluble metal sulfides has been applied in the 81
remediation of industrial sites contaminated with metals such as zinc, cadmium and nickel 82
(19, 20). Typically, the remediation approach consists in supplying an electron donor and, in 83
some cases, extra sulfate to stimulate microbial sulfate reduction. The resulting sulfide 84
production then lowers the metal concentrations in solution through the formation of metal-85
bearing sulfide mineral phases. Sulfate reduction is carried out by a variety of organisms that 86
are ubiquitous in marine and freshwater systems (21). In some naturally reducing aquifers, 87
sulfate reduction is thought to control As levels through coprecipitation of As with sulfide 88
minerals (22). Studies utilizing sediments (23), as well as field trials in Bangladesh (24), 89
have shown that stimulating sulfate reduction can effectively decrease As concentrations in 90
situ through the formation of As bearing sulfide minerals. 91
Despite the potential effectiveness of biogenic HFO and sulfide minerals at 92
sequestering As, there is little information on how these processes operate in natural aquifer 93
systems. This information is important in order to develop viable remediation methods. The 94
present study was undertaken to determine whether mineral formation induced by the 95
addition of nitrate or a mixture of sulfate plus lactate could remediate As in a Southeast Asian 96
aquifer system known to have elevated As levels in the groundwater (17, 25). We amended 97
microcosms containing aquifer sediment with nitrate or sulfate plus lactate in order to 98
on June 14, 2018 by guesthttp://aem
.asm.org/
Dow
nloaded from
5
generate in situ biogenic Fe(III) (hydr)oxides and Fe(II) sulfide phases, respectively. We then 99
examined changes in the resulting aqueous and solid phase geochemistry, as well as 100
microbial community structure, using an array of biogeochemical tools. 101
102
Methods 103
104
Sediment collection 105
Sediment samples were collected in July 2008 from an aquifer system in Rotaing, 106
Cambodia (GPS coordinates 105°03'6.70 E, 11°27'17.62 N) known to have elevated 107
groundwater arsenic levels (17, 25). Previously reported As concentrations from this area 108
were 0.2 -18 μM (17, 25, 26). Samples were obtained down to 13 m depth by auguring. Once 109
retrieved, the cores were flushed with N2 gas, capped at both ends and placed in vacuum-110
sealed plastic bags. Samples were stored at 4 - 10°C until the initiation of the microcosm 111
studies. 112
113
Microcosm setup 114
Preliminary microcosm incubations were carried out to determine the potential release of 115
soluble As from the sediments. Based on this preliminary screening, the sediments from the 116
12-13 m depth interval were selected for further study. The sediments were homogenized 117
prior to their use in the microcosm experiments. Approximately 8 g of sediment was added to 118
20 ml of sterile artificial groundwater in 100 ml glass serum bottles. Microcosms were 119
assembled in an anaerobic cabinet and, following the addition of sediment and synthetic 120
groundwater, sealed with butyl rubber stoppers. The synthetic groundwater described by 121
Islam (8), which is similar to the natural groundwater composition in the area, was used for 122
all microcosms. The headspace was then replaced with a 20:80 CO2/N2 mix. All microcosms 123
on June 14, 2018 by guesthttp://aem
.asm.org/
Dow
nloaded from
6
were incubated in the dark at 20°C for the duration of the experiment. The microcosms were 124
initially run for a period of 28 days without any amendments. The purpose of this 125
“mobilization phase” was to follow the natural release of As and other geogenic chemicals. 126
Any microbial activity during this initial mobilization phase relied on endogenous substrates 127
present naturally in the sediments. 128
Following the mobilization phase, the microcosms were run for an additional 115 129
days. For this “remediation phase”, the microcosms were amended either with nitrate, or with 130
a mixture of sulfate plus lactate. The two treatments were intended to stimulate lithotrophic 131
oxidation of Fe(II) present in the sediment in one case, or heterotrophic sulfate reduction in 132
the other. At the start of the remediation phase, the microcosms were amended in triplicate to 133
approximately 10 mM sodium nitrate, or approximately 10mM sodium sulfate and 15mM 134
sodium lactate. On day 52 of the remediation phase, the nitrate-treated microcosms were 135
further amended to approximately 11 mM sodium nitrate, and the sulfate plus lactate 136
microcosms to approximately 13mM sodium sulfate and 15mM sodium lactate. A triplicate 137
set of microcosms was maintained without amendments as a control during the remediation 138
phase. Note that the microcosms were thoroughly shaken prior to sampling. Samples for 139
geochemical and microbial analysis were obtained by piercing the rubber stoppers with a 140
needle, and withdrawing 4 ml of the sediment slurry into a syringe. Details of microcosm 141
treatment and analysis are given in Table S1. 142
143
Geochemical and mineralogical analyses 144
The pH and Eh of the slurries were measured on aliquots that were first removed from 145
the microcosms in an anaerobic chamber and sealed in plastic tubes. The tubes were removed 146
from the chamber and then pH and Eh probes inserted immediately after opening the tubes. 147
The reported Eh values are expressed relative to the standard hydrogen electrode (SHE). 148
on June 14, 2018 by guesthttp://aem
.asm.org/
Dow
nloaded from
7
Reactive ferrous iron was extracted with HCl using the ferrrozine-based spectrophotometric 149
method of Lovley and Phillips (27), by adding 39 μL of slurry to 1.9 ml of 0.5 M HCl. As 150
defined by this study, HCl-Fe(II) is the Fe(II) released by the slurry in 0.5 M HCl after 90 151
minutes of reaction. For each microcosm, samples for cation and anion analyses were 152
centrifuged to separate the supernatant from the sediment. Sulfide measurements (minimum 153
detectable concentration limit = ~ 4 μM) were conducted on an aliquot of the supernatant 154
using the Hach sulfide kit (Hach, U.S.A.). The supernatant was then filtered through a 0.45 155
µm pore size filter, an aliquot was taken for As and cation (Fe, Mn and Na), anion (sulfate, 156
nitrate, lactate, propionate, acetate) and ammonium analysis. Samples for As and cation 157
analysis were acidified to pH ~ 2 with 0.5 M nitric acid, and stored at 4°C until analysis. 158
Acidification of aqueous samples containing As and sulfide can lead to the precipitation of 159
arsenic sulfides (28) and hence to an underestimation of the total dissolved As concentration. 160
However, this effect is assumed to be small, as the experimental solutions were characterized 161
by measurable dissolved Fe concentrations while aqueous sulfide concentrations were always 162
below the detection limit. Cation and As concentrations were determined by inductively-163
coupled plasma mass spectrometry (ICP-MS) on a Agilent 7500cx instrument (Agilent, U.K). 164
Anion analysis was carried out by ion chromatography on a Dionex 600 instrument (Dionex, 165
U.K.). Ammonium was measured using the Nessler’s reagent method. Methane 166
concentrations were measured by injecting 100 μL of the headspace gas into a Agilent 5890A 167
(Agilent, U.K.) gas chromatograph coupled to a 5975C mass spectrometer. 168
Residual sediment from sequential extractions was frozen at -80 °C for analysis by X-169
ray Absorption Near Edge Structure (XANES) and Extended X-ray Absorption Fine 170
Structure (EXAFS) spectroscopy, X-Ray Photoelectron Spectroscopy (XPS), X-ray 171
diffraction (XRD) and Mössbauer spectroscopy. The bulk composition of the solid starting 172
on June 14, 2018 by guesthttp://aem
.asm.org/
Dow
nloaded from
8
materials was also determined on air-dried, finely ground pressed powder briquettes by X-ray 173
fluorescence spectrometry. Details of analyses using these methods are given in S1. 174
175
Microbial Community analysis 176
After centrifugation, a portion of the sediment remaining in each microcosm was 177
frozen at -80°C until microbiological analysis could be carried out. Total DNA was extracted 178
from approximately 250 mg sediment sub-samples using the PowerSoil DNA kit (MOBIO, 179
Carlsbad, USA). The extractions were performed according to the manufacturer’s 180
recommendations. Bacterial 16S rRNA was amplified from total extracted DNA using the 181
GM3F and GM4R primers . PCR cloning and sequencing was carried out following the 182
protocol of Niemann et al. (29). Phylogenetic analysis was carried out using the ARB (30) 183
software package with the Silva 98 release database (31). Sequences generated in this study 184
have been deposited in the GenBank database, and are accessible under the following 185
accession numbers: JQ976293-JQ976602. 186
187
Geochemical Modeling 188
Calculations at equilibrium and transport-reaction modeling were performed using the 189
public domain computer code PHREEQC Version 2.17.5 . Eh-pH diagrams were generated 190
using the beta version of the public domain computer code PhreePlot . The thermodynamic 191
database WATEQ4F imbedded within PHREEQC was updated by including equilibrium 192
constants for the ionization of As(III) and As(V) oxyacids (32), the sulfidation of As species , 193
Fe mineral solubilities and As mineral solubilities . A compilation of the relevant 194
equilibrium constants is given by Couture et al. (33). To our knowledge, there is no 195
definitive ensemble of thermodynamic constants to predict As speciation in sulfidic waters. 196
We chose to include the thermodynamic dataset provided by Helz and Tossell (34), which 197
on June 14, 2018 by guesthttp://aem
.asm.org/
Dow
nloaded from
9
predicts the co-existence of As(V) and As(III) thioanions, even though more experimental 198
support is needed to confirm the accuracy of this prediction. Because of the inherent 199
uncertainties of this thermodynamic database, we refer to the predicted species collectively as 200
thioarsenicals. 201
A diffuse double-layer surface complexation model (DDLM) comprising consistent 202
sets of intrinsic adsorption constants was developed to predict As partitioning between the 203
dissolved phase and the biogenic iron solids. In this calculation, performed with the code 204
PHREEQC, we used our geochemical measurements for the microcosms as input parameters, 205
along with intrinsic constants for adsorption of As(III) and As(V) species onto hydrous ferric 206
oxide (HFO) (10). The model parameters for HFO assumed a specific surface area of 600 m2 207
g−1 for HFO, a strong-site density of 0.005 mol mol-1 Fe and a weak-site density of 0.2 mol 208
mol-1 Fe . 209
A one-dimensional transport-reaction model was built in PHREEQC to scale the As 210
removal rates observed in our microcosms up to an aquifer flow line. The physical 211
parameters imposed in the calculations are those of the sandy Cambodian aquifer described in 212
Polizzotto et al. 2008 (25). The reaction network included the reactions described above as 213
well as (i) the rate of microbially-mediated oxidation of Fe(II) by nitrate and that of sulfate 214
reduction measured in the microcosms, and (ii) equilibrium isotherms (Kd and surface 215
complexation-based) describing the partitioning of As between the dissolved and particulate 216
phases (Table S2). 217
218
Results 219
Solid phase characterization of starting materials 220
on June 14, 2018 by guesthttp://aem
.asm.org/
Dow
nloaded from
10
The aquifer sediments used in this study were characterized in detail prior to starting 221
the incubation experiments. The sediments were dark brown, finely grained sands. Powder 222
XRD (see Fig. S1 for example of a diffractogram) identified crystalline phases similar to 223
those reported for aquifer sediments from Cambodia (35). The sediment mineralogy was 224
dominated by quartz (SiO2) with lesser amounts of alkali feldspar ((K,Na)AlSi3O8), 225
muscovite (KAl2(Si3Al)O10(OH,F)2) and clinochlore ((Mg,Fe)5Al(Si3Al)O10(OH)8) or related 226
chlorite- type minerals. The XRD data were consistent with bulk chemical analyses with 227
XRF (details not shown) that indicate major silicon and aluminium and lesser amounts of K, 228
Na, Mg and Ca. The sediment also contains a relatively high total Fe concentration of ~5.5 229
wt. %. Of particular relevance are also the relatively high concentrations of Mn (~ 850 ppm) 230
and As (~15 ppm). 231
232
Biogeochemical changes during the mobilization phase 233
All microcosms were incubated without amendment for 28 days in order to mobilize 234
arsenic and other metals/metalloids. During this initial phase, concentrations of soluble As, 235
Fe and Mn increased by 70 - 270 %, to 1.91(±0.5), 768(±59), 18.4 (±2.23) µM, respectively 236
(Fig. S2). Redox conditions within the microcosms became more reducing with Eh decreasing 237
from approximately +109 to approximately +52 mV (with respect to the Standard Hydrogen 238
Electrode). Microbial community composition determined from a sample taken at the end of 239
the mobilization phase (Table 1) revealed the presence of anaerobic organisms capable of 240
As(V), Mn(IV) and Fe(III) reduction, including Geobacter (36-38) and Sulfurospirillum (39, 241
40) species. In addition, sequences related to fermentative bacteria, such as Clostridiales, 242
were also significant components of the 16S rRNA gene sequence library at the end of the 243
mobilization phase. 244
245
on June 14, 2018 by guesthttp://aem
.asm.org/
Dow
nloaded from
11
Aqueous geochemistry during the remediation phase 246
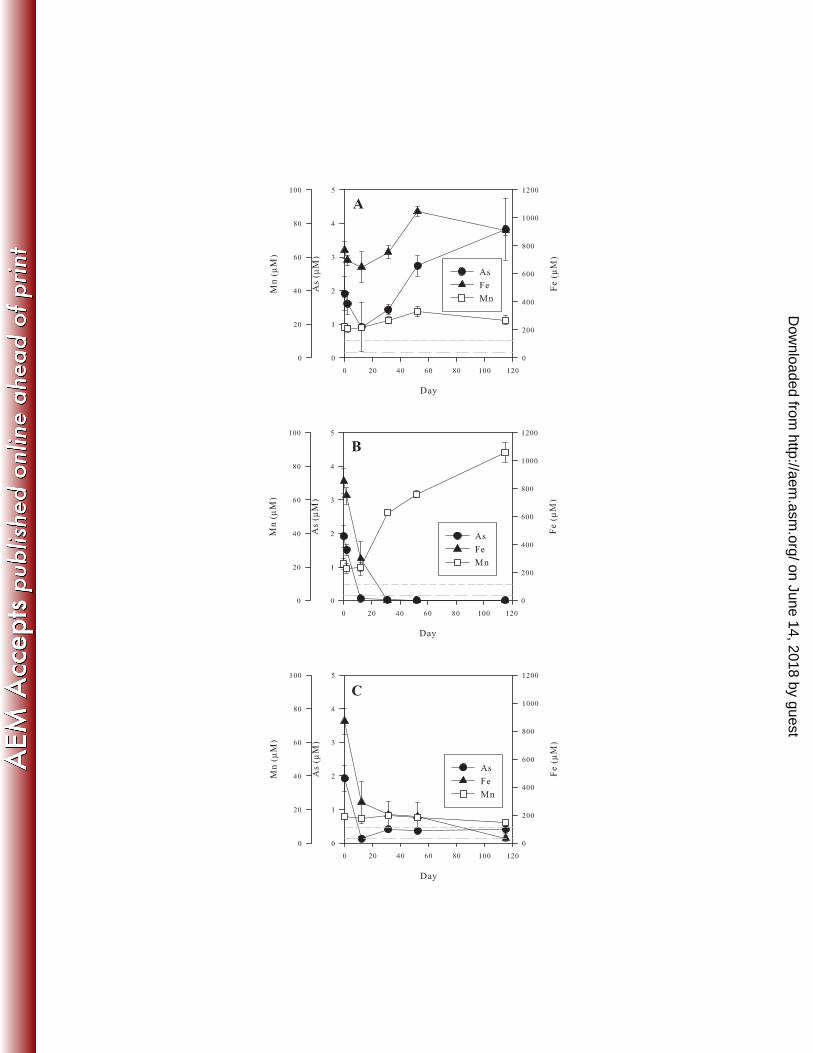
After the initial 28 day long mobilization phase, the microcosms were monitored for 247
an additional 115 days, with and without treatments. Without treatment, soluble As, Fe and 248
Mn concentrations continued to increase, ultimately reaching 3.9(±0.9), 910(±33) and 22(±3) 249
µM, respectively (Fig. 1A). The pH remained relatively stable during this period at ~6.6. 250
These concentrations and pH are comparable to measurements reported for groundwater from 251
the area where the microcosm sediment was collected (25). 252
In contrast to the unamended microcosms, those supplied with nitrate turned from 253
dark to light brown within 12 days, consistent with the formation of ferric iron (hydr)oxides. 254
At the same time, soluble As and Fe concentrations (Fig. 1B) in these microcosms dropped to 255
0.06(±0.02) and 298(±120) µM, respectively. The soluble As and Fe concentrations 256
decreased further until day 32 and remained relatively constant throughout the rest of the 257
remediation phase, despite the presence of about 9 mM nitrate. Soluble Mn concentrations in 258
the nitrate-treated microcosms increased substantially, reaching 63(±2) µM by the end of the 259
remediation phase. 260
The microcosms in which sulfate reduction was stimulated turned black within 12 261
days suggesting the precipitation of iron sulfide (most likely FeS, mackinawite) as a result of 262
the biogenic production of sulfide. Soluble As and Fe concentrations in the sulfate reducing 263
systems fell to 0.13(±0.07) and 292(±150) µM, respectively, 12 days after the first addition of 264
sulfate and lactate (Fig. 1C). However, arsenic concentrations increased to 0.41(±0.02) µM 265
by day 31, and remained at this level even when additional sulfate and lactate were added. 266
Soluble Fe concentrations continued to decrease, reaching 34(±20) µM by day 115. Soluble 267
Mn concentrations in the sulfate reducing microcosms decreased slightly. 268
Nitrate concentrations in the nitrate-treated “oxidative’ microcosms fell to about 2 269
mM by day 52 of the remediation phase (Fig. 2A). On day 52, the microcosms were again 270
on June 14, 2018 by guesthttp://aem
.asm.org/
Dow
nloaded from
12
supplemented with nitrate; however, no significant further nitrate removal was observed 271
between day 52 and the end of the experiment (day 115). No significant nitrate consumption 272
was observed in nitrate amended, but autoclaved microcosms (Fig S3). In the sulfate plus 273
lactate amended microcosms, lactate was exhausted by day 12 of the remediation phase (Fig. 274
2B). Concentrations of acetate and propionate (Fig. 2C), which are breakdown products of 275
lactate metabolism, increased during this period. By day 52, acetate, lactate and sulfate 276
concentrations had all dropped substantially. Following the second addition of sulfate and 277
lactate, sulfate concentrations dropped from 13 mM to about 5 mM, implying that a further 8 278
mM of sulfate had been consumed by day 115. Lactate, propionate and acetate were below 279
detection at this point. Methane (CH4(g)) concentrations determined from headspace 280
measurements on day 115 were 3.3 mM in the sulfate and lactate microcosms, in contrast to 281
less than 0.3 mM in all other microcosms. No significant sulfate consumption was observed 282
throughout the experiment in sulfate and lactate amended, but autoclaved microcosms (see 283
Fig S3). However, significant lactate consumption was observed between day 52 and 120 in 284
these autoclaved microcosms. 285
Acid extractable ferrous iron (HCl-Fe(II)) in the untreated microcosms fluctuated 286
between 43 and 53 mmol kg slurry-1 during the course of the remediation phase (Fig. 3). In 287
the nitrate treated microcosms, HCl-Fe(II) concentrations decreased from 43 to about 16 288
mmol kg slurry-1 by day 52. However, by day 115 it had increased again slightly to about 25 289
mmol kg slurry-1, which was still significantly below the starting concentration. HCl-Fe(II) 290
concentrations in the sulfate and lactate treated microcosms decreased to about 30 mmol kg 291
slurry-1 by day 115. 292
The redox potential, Eh, in the untreated and the sulfate plus lactate microcosms fell to 293
approximately 27 and 8 mV, respectively, by the end of the remediation phase. In contrast, Eh 294
rose to around 216 mV during this period in the nitrate treated microcosms. The pH in the 295
on June 14, 2018 by guesthttp://aem
.asm.org/
Dow
nloaded from
13
untreated and nitrate treated microcosms was relatively stable at 6.6 during the remediation 296
phase. However, pH increased from about 6.6 to 7.3 in the sulfate plus lactate treated 297
microcosms. 298
299
Remediation phase solids characterization 300
No significant changes were observed in the XRD spectra obtained following the 301
different remediation treatments. This is not surprising considering that the sediment 302
mineralogy is dominated by detrital phases (quartz, feldspar, muscovite mica and clay 303
mineral phases) that are largely unreactive at the time scale of the incubation experiments. It 304
further suggests that any secondary phases formed during the experiments were amorphous 305
or poorly crystalline and probably produced in very small amounts. 306
The spectroscopic techniques used to characterize the solid phases are powerful 307
probes of the two main elements of interest, iron and arsenic. All the Mössbauer spectra (Fig 308
S4) were fitted firstly with a sextet of peaks indicative of a magnetically ordered iron 309
mineral. The hyperfine field value (516kOe) suggest that this phase is hematite, while the 310
peak intensities (areas) show that it represents ~20% of total Fe (hence ~1% of the solid 311
material). The magnetically ordered iron phase remained unchanged in character and relative 312
concentration after all treatments suggesting that it was not available for bioreduction. The 313
other peaks were best fitted with doublets; two with larger isomer shifts (~1.02-1.25 mm sec-314
1) and quadrupole splittings (~1.9- 2.5 mmsec-1) indicative of Fe2+ in a silicate (chlorite) 315
phase, and one with a much smaller isomer shift (0.34-0.41 mm sec-1) and quadruple splitting 316
(0.37-0.54 mm sec-1) indicative of Fe3+. The main differences in Mössbauer spectra between 317
the end points of the nitrate and sulfate plus lactate treatments were in the relative intensities 318
of the peaks attributable to Fe2+ and Fe3+. The key observation was that the Mössbauer 319
spectra of the nitrate treated microcosms implied a markedly higher abundance of Fe3+ (49%) 320
on June 14, 2018 by guesthttp://aem
.asm.org/
Dow
nloaded from
14
compared to those of the sulfate plus lactate treated microcosms (39%). The latter also 321
showed increased Fe2+ (42%) compared to the nitrate treated microcosms (32%). For 322
comparison, the Mössbauer spectrum of a sample from the untreated microcosms yielded 323
intermediate abundances of Fe3+(43%) and Fe2+ (37%). 324
The XPS data (Fe2p peaks) for the same samples as those studied using Mössbauer 325
spectroscopy confirmed the above observations regarding the relative abundances of the 326
oxidation states of iron (Fig S5). According to the XPS data, the Fe3+ percentage contribution 327
determined at the end of the nitrate treatment was 54%, compared to 49% for the sulfate plus 328
lactate treatment (and 51.5% for untreated microcosms). 329
Solid-phase As speciation was determined using X-ray absorption at the arsenic K-330
edge (Table 2, Fig S6). From the fitting of XANES spectra (Table 3, Fig S7), arsenic 331
speciation was apportioned between arsenite (As(III)), arsenate (As(V)) and arsenic bonded 332
to sulfur. The arsenite:arsenate ratios for untreated and nitrate treated microcosms were 84:16 333
and 36:64 respectively. For the sulfate plus lactate treated microcosms, the fitting implied 334
that 19% of As was bound to sulfide, 65% was arsenite, and 16% arsenate. These values 335
agree with the geochemical and redox changes expected for the various treatments. Although 336
some of the R-values reflect the high level of noise in the spectra (due to the low 337
concentration of As), meaningful information on the local bonding environment of As in the 338
samples was derived from fitting of the EXAFS spectra (Fig S6). In all cases, the first shell of 339
atoms surrounding the arsenic consisted of oxygen at distances of 1.70 to 1.74Å. The 340
untreated microcosm yielded a fit with just a single shell of 3 oxygen atoms at 1.74 Å. 341
However, for the remediation treatments a better fit was achieved with two shells of atoms. In 342
the case of the sulfate plus lactate treatment, this involved sulfur atoms at 2.25 Å, supporting 343
the XANES evidence for arsenic closely associated with a newly formed sulfide phase. 344
on June 14, 2018 by guesthttp://aem
.asm.org/
Dow
nloaded from
15
Speciation of As at the end of the sulfate plus lactate treatment was also analyzed 345
using sequential chemical extractions (S2) coupled to XANES and EXAFS analyses. The 346
chosen extraction protocol successively removes non-specifically sorbed As, specifically 347
sorbed As, As bound to amorphous and poorly crystalline hydrous oxides of Fe and Al, and 348
As bound to well-crystallized hydrous oxides of Fe and Al. The extraction protocol does not 349
remove As bound to sulfides and organics. Note that XANES and EXAFS analyses were 350
performed on the residual solid materials from the sequential extractions. The XANES 351
analysis showed a decrease in the proportion of arsenite and arsenate and an increase in the 352
proportion of sulfur-bound arsenic, as compared to the non-sequentially extracted sulfate plus 353
lactate treatments. These results suggest that the arsenate and arsenite that were not removed 354
by the sequential extraction were likely associated to a sulfide phase, possibly FeS. 355
In the case of the nitrate treatment, the second shell consisted of Fe atoms at 2.96Å, as 356
reported previously for As(V) inner sphere complexation to goethite surfaces (41). The 357
EXAFS analysis also yielded a first shell As-O distance of 1.70 Å, confirming a greater 358
proportion of As(V). A sample from the nitrate treated microcosms was also analyzed after 359
performing the same sequential extraction as described above for the sulfate plus lactate 360
treatment , but without the step to remove As bound to well-crystallized hydrous oxides of Fe 361
and Al. As a result of the extraction, the ratio of arsenate to arsenite decreased to 28:72, 362
showing a loss of arsenate, which suggests that arsenate in the nitrate treatments was mainly 363
bound to the freshly formed HFO. EXAFS showed a single shell of oxygen scatterers at 1.71 364
Å; the slightly longer bond length was also consistent with an increased proportion of 365
arsenite. 366
367
Microbial community structure during the remediation phase 368
on June 14, 2018 by guesthttp://aem
.asm.org/
Dow
nloaded from
16
16S rRNA gene sequence analysis of samples from all microcosms were dominated 369
(15-71%) by sequences from organisms closely related to Azospira oryzae (Table 1). 370
Furthermore, organisms closely related to metal (Fe(III) and As(V))-reducing bacteria, such 371
as Geobacter sp. (36-38) and Sulfurospirillum sp. (39, 40), were present in all microcosms. 372
Sequences closely related to those of Fe(II)-oxidizing bacteria, such as Sideroxydans (42, 43) 373
were detected in the untreated and nitrate treated microcosms only. However, the percentage 374
of these organisms in the nitrate treated microcosms was much higher than in the untreated 375
microcosms (37 % as opposed to 9 %). Organisms closely related to the sulfate-reducing 376
bacterium Desulfovibrio putealis (21) were only detected in the sulfate plus lactate 377
microcosms. Sequences closely related to fermentative bacteria, such as Clostridiales, were 378
also significant components (9-22 %) of the 16S rRNA gene sequence library for both the 379
untreated and the sulfate plus lactated treaded microcosms. 380
381
Thermodynamic modeling 382
Based on the experimental results, reaction pathway models were used to gain insight 383
into As and Fe speciation during the experiments. We calculated the saturation indices (SI = 384
log IAP/Ksp, where IAP is the ion activity product and Ksp the solubility product) of the 385
aqueous phase with respect to various mineral phases. This modeling exercise revealed that 386
the nitrate-treated microcosms became supersaturated with respect to various Fe(III)-387
oxyhydroxides (HFO, two-line ferrihydrite, lepidocrocite, hematite, goethite) during the 388
course of the nitrate-amended experiments. Assuming As sorption onto freshly precipitated 389
hydrous ferric oxides (HFO), the equilibrium As partitioning between the dissolved and solid 390
phases using surface complexation modeling yielded a dissolved As concentration of 24 nM 391
and an amount of adsorbed As of 1.9 µmoles (per liter slurry), respectively. Figure 4A shows 392
the measured Eh and pH values superimposed on a theoretical Eh-pH diagram for As and Fe 393
on June 14, 2018 by guesthttp://aem
.asm.org/
Dow
nloaded from
17
for the nitrate-amended microcosms. For the initial system conditions, geochemical modeling 394
predicts that the dissolved species H2AsO4-(aq) dominated As speciation. With the progression 395
of the experiment, the Eh-pH trend crossed the Fe2+/Fe(OH)3(s) boundary, moving towards the 396
stability fields of Fe(OH)3(s). At the end of the experiment, the speciation calculations implied 397
that As speciation was dominated by As bound to HFO surfaces (FeO≡OHAsO43-). 398
Because aqueous sulfide remained below the detection limit of 4 µM over the course 399
of the sulfate plus lactate treatment, we assumed in the thermodynamic speciation model that 400
all sulfide generated from sulfate reduction reacted with Fe, present in excess, to form 401
disordered mackinawite (FeSm(s)). This is a reasonable assumption as FeSm(s) is widely 402
considered to be the first Fe sulfide to form in most low temperature geochemical 403
environments . The amount of FeSm(s) calculated from the sulfate consumption was 14 404
mmoles (~1200 ppm). Based on this estimate, and on a log Ksp of 3.5 for FeSm(s) (44), we 405
then calculated an equilibrium sulfide analysis in the presence of excess Fe2+ concentrations 406
of 34 μM and at pH 7.2. It is useful to estimate free sulfide concentration as sulfide can form 407
complexes with dissolved As(V) and hence potentially increase As solubility (45). The 408
calculation of the saturation indices (SI) with respect to arsenic sulfide minerals (orpiment, 409
realgar and arsenopyrite) revealed that these phases were undersaturated by several orders of 410
magnitude (SI ≤ 6) and hence were unlikely to form. In the absence of As-sulfide minerals, 411
As adsorption onto the surface of FeS(m)s represents a likely mechanism explaining the drop 412
in dissolved As (33, 46, 47). Based on the linear isotherm for As adsorption onto FeS(m)s of 413
Wolthers et al. (2005b), we then predicted an equilibrium aqueous As concentration range of 414
0.7 - 3.0 µM (isotherm: Kd = [As]/[As–FeS(m)s], where [As–FeS(m)s] is the concentration of 415
adsorbed As). 416
As described above for the nitrate system, a reaction pathway model for the sulfate 417
plus lactate amended microcosm experiments was constructed using the experimental results 418
on June 14, 2018 by guesthttp://aem
.asm.org/
Dow
nloaded from
18
as constraints (Fig. 4B). In the absence of As sulfide mineral precipitation, the Eh-pH plots 419
indicate that H3AsO30 and SO4-green rust should dominate As and Fe speciation, 420
respectively, throughout the experiment. Note that, although pyrite (FeS2) is 421
thermodynamically more stable than FeSm(s), the latter is the first to form and therefore tends 422
to control the solution chemistry. To reflect this, the stability fields of FeSm(s) and FeS2 423
(pyrite) have been merged on Fig. 4B. 424
425
Transport-reaction modeling 426
The rate of nitrate consumption in the nitrate-amended microcosms was on the order 427
of 0.14 mmoles NO3 d-1. This rate of nitrate consumption was implemented in a one-428
dimensional transport-reaction model to simulate chemical changes along a flow line in the 429
aquifer, assuming that all nitrate reduction is coupled to the oxidation of bioavailable Fe(II). 430
This is reasonable given the observed ratio of nitrate consumption (Fig.2A) to HCl-Fe(II) 431
(Fig. 3A) consumption is about 1:4.3 in the first 52 days of the remediation phase. This is 432
similar to the 1:5 ratio for microbial nitrate reduction coupled to Fe(II) oxidation reported 433
previously (13, 14). The reaction was allowed to proceed until depletion of all the available 434
solid-phase Fe(II) (Fig. 5A). The aqueous Fe(III) produced then precipitates as Fe(OH)3(s), 435
which sorbs dissolved As according to the surface complexation model described above. 436
Similarly, the rate of microbially-mediated SO4 reduction (~0.12 mmoles SO4 d-1) was 437
estimated from the initial drop in sulfate concentration with time. The reaction was 438
implemented into the transport-reaction model (Fig. 5B), further assuming that all aqueous 439
sulfide produced reacts with available Fe(II) to form FeSm(s). Removal of As from solution 440
was assumed to follow the linear isotherm reported by Wolthers et al. (2005b). 441
442
Discussion 443
on June 14, 2018 by guesthttp://aem
.asm.org/
Dow
nloaded from
19
444
The microbial communities inhabiting the Cambodian aquifer sediments studied in 445
this work respond to the supply of nitrate by producing Fe(III)-(oxyhydr)oxides, and to the 446
supply of sulfate plus lactate by producing sulfide, which in turn causes the precipitation of 447
iron sulfide mineral phases. The formation of these mineral products clearly has a significant 448
impact on soluble As concentrations; however, the observed geochemical and 449
microbiological changes, and the implications for in situ As remediation differ substantially 450
between the two treatments. 451
452
Arsenic mobilization 453
Soluble As concentrations increased in all microcosms during the pre-treatment phase 454
(i.e., prior to the amendments). In the untreated microcosms, the As concentration continued 455
to rise over the next 115 days of the experiments to a final value of 3.9(±0.9) µM. This 456
soluble As concentration is well above the WHO provisional guideline safe value of 10 ppb 457
(0.13μM). It is comparable to groundwater arsenic concentrations that have been reported 458
from this area of Cambodia (0.2 -18 μM) (17, 25, 26). Microbially mediated reductive 459
processes apparently cause the release of soluble As, together with that of soluble Fe and Mn 460
(Fig. 1A). This is supported by three independent lines of evidence: (1) the presence of close 461
relatives of bacteria known to carry out microbial As(V), Fe(III), and Mn(IV) reduction, such 462
as Geobacter uraniireducens (36-38) Geobacter sulfurreducens (37), and Sulfurospirillum 463
NP4 (39) (Table 1); (2) the measured increases in solid phase Fe(II) and As(III), and (3) the 464
drop in redox potential. Taken together, the available observations suggest that metal-465
reducing bacteria were responsible for the reductive transformations of As, Fe and Mn 466
bearing minerals, in line with previous work that has implicated these organisms in As and Fe 467
release in reduced sediments from SE Asian aquifers (8, 48). 468
on June 14, 2018 by guesthttp://aem
.asm.org/
Dow
nloaded from
20
The electron donors involved in the redox processes driving As mobilization are 469
currently not well defined. Given the presence in the non-amended microcosms of up to 1 470
mM acetate (data not shown) and fermentative bacteria, such as members of the 471
Clostridiales, it is likely that the electron donors for this process include organic compounds. 472
Previous work has shown that a wide range of organic compounds likely play a role in 473
microbial metal reduction (8, 35, 49). The increase in the relative number of sequences 474
related to those of Azospira oryzae suggests an involvement of these organisms. These 475
sequences were detected in all the microcosm samples that were examined. A. oryzae species 476
are known heterotrophic nitrogen-fixing bacteria ; however, the exact role they play in our 477
microcosms cannot be derived from our experimental results. 478
479
Arsenic removal: HFO 480
Ferric iron (hydr)oxides have been shown to be highly effective in lowering As levels 481
in groundwaters (e.g, (11, 12)). This is consistent with the results from the nitrate-amended 482
microcosms. In sharp contrast to the untreated microcosms, the addition of nitrate caused the 483
removal of soluble As and Fe (Fig. 1B). Within12 days after the addition of nitrate, As and 484
Fe concentrations in the aqueous phase dropped by 97 and 65 %, respectively. By day 52, 485
aqueous As concentrations were on the order of 0.01 µM, that is, well below the WHO 486
guideline. The simultaneous removal of aqueous As and Fe can be attributed to microbial, 487
nitrate-dependent, Fe(II) oxidation and the subsequent formation of HFO or a related ferric 488
iron mineral phase . The measured decreases in nitrate (Fig.2A) and HCl-Fe(II) (Fig. 3) of 489
about 7 and 30 mM, respectively within the first 52 days after nitrate amendment yield a ratio 490
of 1:4.3. Given the uncertainties associated with the HCl-Fe(II) measurements, this ratio is 491
consistent with the 1:5 ratio for microbial nitrate reduction coupled to Fe(II) oxidation 492
reported previously (13, 14). Furthermore, nitrate amendment caused a significant increase in 493
on June 14, 2018 by guesthttp://aem
.asm.org/
Dow
nloaded from
21
the percentage of sequences related to those of the Fe(II)-oxidizing bacterium Sideroxydans 494
lithotrophicus LD-1(42, 43) compared to the untreated microcosms (37 % as opposed to 9 495
%). Bacteria related to S. lithotrophicus have been implicated in Fe(II)-oxidation in nitrate 496
enrichment cultures (50). Taken together, these observations suggest that these organisms 497
played a direct role in nitrate-dependent Fe(II) oxidation in the studied microcosms. 498
The equilibrium speciation modeling (Fig. 4A) further supports the conclusion that 499
the addition of nitrate resulted in more oxidizing conditions, hence promoting microbial iron 500
oxidation and subsequent sequestration of As(III) by HFO. The oxidation of As(III) and 501
Fe(II) is also supported by the XANES and Mössbauer spectra, respectively, which show 502
higher As(V) and Fe(III) concentrations relative to the untreated microcosms. Finally, 503
XANES spectra obtained on the residual solids collected after the sequential extraction that 504
removes non-sorbed As, exchangeable sorbed As and As bound to HFO, showed that the 505
ratio of arsenate to arsenite dropped significantly (Table 3). Although these extractions were 506
not performed quantitatively, these results suggest that the majority of arsenic removed 507
during the chemical extraction was in the form of arsenate bound to HFO. 508
The increase in Fe(III) could involve iron in clay minerals in addition to the formation 509
of HFO. Mössbauer spectroscopy cannot be used to discriminate between these two 510
possibilities, because the amount of Fe that changed oxidation state during the nitrate 511
treatment is too low, only on the order of 1100 ppm or ~ 2 % of the total Fe. The evidence for 512
HFO formation, although strong, is thus indirect. For example, the calculated saturation 513
indices indicate that the aqueous phase became supersaturated with respect to HFO over the 514
course of the nitrate treatment. Furthermore, surfaces of fresh HFO have a strong affinity for 515
As (10). 516
Arsenic sorption onto HFO is also consistent with EXAFS spectra, which indicate that 517
a portion of As is bound to an Fe phase. Although the bond length of 2.96 Å is different from 518
on June 14, 2018 by guesthttp://aem
.asm.org/
Dow
nloaded from
22
that reported (3.25 Å) by Waychunas et al. (1993), the latter study was conducted at 519
significantly higher concentrations of As. Different As binding mechanisms, for example 520
face-sharing polyhedra (three oxygen bridges, shorter arsenic-iron distance) versus corner-521
sharing (one oxygen bridge) could explain the discrepancy in As - Fe distance. The As-O 522
bond length shows only an insignificant increase from 1.70 to 1.71 Ắ after the sequential 523
extraction (Table 2): the length implies that there is still a mixture of As(V) and As(III) oxide 524
species present, and the increase, though small, is consistent with an increased proportion of 525
As(III) as shown by the XANES fitting. The binding of arsenic onto an Fe phase is also 526
consistent with surface complexation modeling, which predicts a soluble As equilibrium 527
concentration of 24 nM, which is of the same order of magnitude as the measured values at 528
the end of the nitrate-amended experiments (around 10 nM). 529
Iron oxidation in the nitrate-amended microcosms ceases even though significant 530
levels of nitrate and HCl-extractable Fe(II) remain at the end of the experiments (Figs. 2A 531
and 3). Possibly, the HCl extraction dissolves some Fe(II)-containing minerals that are 532
unavailable to the Fe(II)-oxidizing bacteria. Alternatively, the encrustation by iron oxides of 533
the Fe(II)-oxidizing organisms may cause their inactivation, a phenomenon that has been 534
reported for enrichments of Fe(II)-oxidizing bacteria (13, 50). The exact reason for the 535
apparent cessation of nitrate-dependent Fe(II) oxidation cannot be determined from our 536
results. However the slight increase in HCl extracted Fe(II) observed after the second 537
addition of nitrate (Fig. 3) may reflect the partial reduction of newly formed HFO, which 538
provides an excellent electron acceptor for Fe(III)-reducing bacteria. Nonetheless, the partial 539
reduction of HFO does not cause a release of As, likely because sufficient HFO surface site 540
remains to bind all the As. 541
The addition of nitrate caused a 300 % increase in soluble Mn concentrations to more 542
than twelve times the WHO guideline value of 7.3 µM (Fig. 1B). Human consumption of 543
on June 14, 2018 by guesthttp://aem
.asm.org/
Dow
nloaded from
23
water with elevated Mn concentrations is hazardous and has been linked to mental deficiency 544
in children (51). This release of Mn is clearly initiated by the addition of nitrate (non-nitrate 545
amended microcosms do not show this trend), but the mechanism of release cannot be 546
determined with certainty by our data. However, there are several possibilities: (1) 547
Manganese may have been released as a result of cation exchange on the surface of clay 548
minerals, possibly between H+ and Mn2+ since protons are produced during Fe(II)-oxidation. 549
(2) Microbial dissolution of Mn oxides, such as birnessite. (3) Dissolution of carbonates, such 550
as rhodocrosite. 551
552
Arsenic removal: sulfate reduction 553
The sulfate plus lactate amendments also caused a dramatic decrease in soluble Fe 554
and As (Fig. 1C), most probably driven by the production of sulfide associated with 555
microbial sulfate reduction (21). The sulfate plus lactate amendments resulted in relative 556
increases in the number of gene sequences from organisms related to the sulfate-reducing 557
bacterium Desulfovibrio puteali (52) (Table 1). The observed increases in acetate (Fig. 2C) 558
and propionate concentrations suggest a coupling of sulfate reduction to fermentation or 559
incomplete lactate oxidation with sulfate . The production of measurable amounts of 560
methane in these microcosms also indicates that some of these products fueled 561
methanogensis. Regardless of the mechanism, sulfate was rapidly removed from solution, 562
presumably due to sulfate reduction. About 6.0 (±1.7) mM of sulfate was reduced within 52 563
days (Fig. 2B) while Eh simultaneously dropped to more reducing values. These changes 564
were not observed in samples that were supplemented with sulfate plus lactate and then 565
autoclaved (Fig S3). 566
The appearance of black color in the microcosms is characteristic for the formation of 567
iron sulfide minerals. The reducing conditions indicated by an increase in Fe(II) seen in the 568
on June 14, 2018 by guesthttp://aem
.asm.org/
Dow
nloaded from
24
Mössbauer spectra (Fig S4), the absence of free sulfide and the decrease in soluble Fe(II) 569
(Fig. 1C) are all consistent with the precipitation of FeS. However, the estimated maximum 570
FeS concentration of 14 mmoles (~1200 ppm) represents ~2 % of the total iron, too small to 571
make a significant contribution to the Mössbauer spectra. Nevertheless, there is strong 572
indirect evidence for the formation of FeS and the subsequent sorption of As. Given the 573
formation of FeS in small quantities, the initial drop in arsenic concentration detected within 574
the first 13 days (Fig. 1C) likely reflects the sorption of As onto the surfaces of freshly 575
formed FeS, for which arsenic has a high affinity (47, 53). Arsenic sorption is supported by 576
the XANES and EXAFS spectra, which indicate As-S bonds consistent with As bound to the 577
surface of FeS. The As-S bonding is preserved even after the sequential extraction. Assuming 578
that As is sorbed exclusively to mackinawite, FeSm(s), and using the quantity of FeSm(s) 579
calculated from the amount of sulfate reduced, an apparent partition coefficient, Kd, for As 580
sorption to FeSm(s) of ~ 7 L g-l is obtained. This value agrees with the range (Kd: 2-9 L g-l) 581
reported by Wolthers et al., (2005), lending further support to removal of As by sorption to 582
FeSm(s). Hence there are several lines of evidence, which support that formation of FeS and 583
the sorption of As: (1) Detection of sulfate reducing bacteria, only in samples treated with 584
sulfate and lactate. (2) Biologically dependent sulfate consumption. (3) Absence of free 585
sulfide, black color change, and a decrease in soluble Fe(II). (4) XANES and EXAFS data 586
that support As and S binding. (5) A Kd of As sorption on to FeS within the range predicted 587
by Wolthers et al., 2005. 588
The final concentrations of aqueous As in the sulfate plus lactate treatments were 589
significantly higher than in the nitrate treatments. Nonetheless, although the final soluble As 590
concentrations (0.41(±0.13) μM) were well above the WHO threshold value, they were much 591
lower than in the untreated microcosms. Similarly, studies on the in situ precipitation of As 592
with sulfide (23) have shown that a partial removal of aqueous As in sediments can be 593
on June 14, 2018 by guesthttp://aem
.asm.org/
Dow
nloaded from
25
achieved, but not to levels below the WHO guideline value, because As is less strongly 594
bound to mackinawite than to Fe oxides. This is in line with the conclusions Burton, et al. 595
(54) who showed that mackinawite formation during sulfidization of Fe-oxides is not a highly 596
effective way to sequester As. It is however possible that prolonged sulfidogenesis in the 597
microcosms could have allowed further As sequestration. Using the reaction-path model (Fig. 598
4B) to predict the outcome of further sulfate reduction in the microcosms, it is predicted that 599
extending the treatments would have resulted in more reducing conditions and higher sulfide 600
concentrations. In these conditions, the model predicts a predominance of soluble thioarsenic 601
species and FeSm(s), which could lead to the formation of realgar-like surface precipitates on 602
the surface of FeS (55), or of As-sulfides mineral formation (56), thus sequestering As more 603
efficiently. 604
605
Implications for arsenic remediation 606
The results of the nitrate and sulfate plus lactate amendments show that the activities 607
of natural microbial populations present in aquifer sediments can be stimulated in order to 608
immobilize arsenic. The microorganisms react quickly to the amendments, and soluble As 609
removal is achieved over a time scale of weeks. During the initial decrease of soluble As, the 610
two treatments yielded similar rates of removal at about 0.15 μmoles As d-1. However, the 611
removal is more extensive when nitrate is supplied compared to sulfate plus lactate. In the 612
latter case, As levels are not brought into compliance with WHO guidelines within the 613
duration of the experiments. 614
In Figure 5 the predicted removal of soluble As along a flow path, under conditions 615
representative of an aquifer of the type found in the area of Cambodia where the samples for 616
this study were collected, are compared for the two treatments. The simulations suggest that 617
effective As remediation is achievable over a length scale of 50 m and within six months at 618
on June 14, 2018 by guesthttp://aem
.asm.org/
Dow
nloaded from
26
the nitrate dosing levels used in the nitrate amended microcosms (Fig. 5A). It should be 619
noted, however, that the dosing levels are an order of magnitude higher than the WHO nitrate 620
groundwater concentration limit. At lower dosing levels, compliant with groundwater limits, 621
it would take on the order of three years to achieve the same As removal. Clearly, dosing 622
levels would need to be carefully considered in any remediation strategy. The remediation 623
simulations further suggest that it would take over four years of sulfate plus lactate treatment 624
to reach the final arsenic concentrations seen in the corresponding microcosms (Fig. 5B). 625
Furthermore, those concentrations would still be well above the WHO guideline value. 626
Lower aqueous As concentrations, below the WHO limit, were obtained by Saunders et al. 627
(24) during an in situ treatment experiment in a Bangladeshi aquifer using injection of sulfate 628
plus molasses. The reasons for the apparent contradictory results need further investigation. 629
Despite their potential usefulness in remediation, both treatments have significant 630
drawbacks. As shown by our results, treatment with nitrate may exacerbate groundwater Mn 631
contamination. Additional treatment would be needed before the groundwater could be used 632
for domestic consumption, for example by adding an aeration step for the extracted 633
groundwater (57). Aeration could potentially remove any remaining soluble arsenic through 634
sorption to the new Mn(IV) phases that would form. The use of sulfate plus lactate produces 635
various fermentation products, most notably acetate and methane, which do not appear to be 636
removed even when extra sulfate is added. Whereas these products themselves may not 637
present a direct health threat, they are electron donors and could therefore affect redox 638
processes in the subsurface in unpredictable ways. 639
Because the attainment of groundwater As concentrations that meet WHO guidelines 640
within a reasonable time frame should be the goal of any remediation method, our results 641
suggest that inducing sulfate reducing conditions alone would likely not be effective for the 642
groundwater system from which the sediments were obtained. Treatment with nitrate would 643
on June 14, 2018 by guesthttp://aem
.asm.org/
Dow
nloaded from
27
almost certainly be more effective and offers a possible treatment route, although additional 644
measures may be needed to remove any undesired byproducts that are released as a result of 645
the addition of nitrate, most notably manganese. 646
647
Acknowledgments 648
We would like to thank David Cooke for the collection of these samples. We would also like 649
to thank Alastair Bewsher, Catherine Davies, Paul Lythgoe, Paul Wincott, and Bart 650
van Dongen for their help with laboratory work. Funding for EOO was provided by the 651
European Commission Sixth Framework Marie Curie Actions project, AquaTRAIN, MRTN- 652
611 CT-2006-035420. PVC and RMC acknowledge financial support from the Canada 653
Excellence Research Chair (CERC) Program. The views expressed in the paper do not 654
necessarily reflect those of the European Union or of any of the other funders. 655
656
657
References 658
659
1. Nordstrom DK. 2002. Public health - Worldwide occurrences of arsenic in ground 660 water. Science 296:2143-2145. 661
2. Ravenscroft P, Brammer H, Richards K. 2009. Arsenic Pollution: A Global 662 Synthesis. Wiley-Blackwell, Chichester, UK. 663
3. Smith AH, Lopipero PA, Bates MN, Steinmaus CM. 2002. Public health - Arsenic 664 epidemiology and drinking water standards. Science 296:2145-2146. 665
4. Smith AH, Lingas EO, Rahman M. 2000. Contamination of drinking-water by 666 arsenic in Bangladesh: a public health emergency. Bull. W.H.O. 78:1093-1103. 667
5. WHO. 2001. HO Environmental Health Criteria 224. Arsenic and Arsenic 668 Compounds, 2001, World Health Organization. Geneva. 669
6. Smedley PL, Kinniburgh DG. 2002. A review of the source, behaviour and 670 distribution of arsenic in natural waters. Appl. Geochem. 17:517-568. 671
on June 14, 2018 by guesthttp://aem
.asm.org/
Dow
nloaded from
28
7. Yu WH, Harvey CM, Harvey CF. 2003. Arsenic in groundwater in Bangladesh: A 672 geostatistical and epidemiological framework for evaluating health effects and 673 potential remedies. Water Resour Res 39:1146-1162. 674
8. Islam FS, Gault AG, Boothman C, Polya DA, Charnock JM, Chatterjee D, Lloyd 675 JR. 2004. Role of metal-reducing bacteria in arsenic release from Bengal delta 676 sediments. Nature 430:68-71. 677
9. Ainsworth CC, Pilon JL, Gassman PL, Vandersluys WG. 1994. Cobalt, cadmium, 678 and lead sorption to hydrous iron-oxide - residence time effect. Soil Sci. Soc. Am. J. 679 58:1615-1623. 680
10. Dixit S, Hering JG. 2003. Comparison of arsenic(V) and arsenic(III) sorption onto 681 iron oxide minerals: Implications for arsenic mobility. Environ. Sci. Technol. 682 37:4182-4189. 683
11. Sun WJ, Sierra-Alvarez R, Milner L, Oremland R, Field JA. 2009. Arsenite and 684 Ferrous Iron Oxidation Linked to Chemolithotrophic Denitrification for the 685 Immobilization of Arsenic in Anoxic Environments. Environ. Sci. Technol. 43:6585-686 6591. 687
12. Katsoyiannis IA, Zouboulis AI. 2004. Application of biological processes for the 688 removal of arsenic from groundwaters. Water Res. 38:17-26. 689
13. Straub KL, Benz M, Schink B, Widdel F. 1996. Anaerobic, nitrate-dependent 690 microbial oxidation of ferrous iron. Appl. Environ. Microbiol. 62:1458-1460. 691
14. Weber KA, Picardal FW, Roden EE. 2001. Microbially catalyzed nitrate-dependent 692 oxidation of biogenic solid-phase Fe(II) compounds. Environ. Sci. Technol. 35:1644-693 1650. 694
15. Straub KL, Buchholz-Cleven BEE. 1998. Enumeration and detection of anaerobic 695 ferrous iron-oxidizing, nitrate-reducing bacteria from diverse European sediments. 696 Appl. Environ. Microbiol. 64:4846-4856. 697
16. Senn DB, Hemond HF. 2002. Nitrate controls on iron and arsenic in an urban lake. 698 Science 296:2373-2376. 699
17. Rowland H, A., L., Gault AG, Lythgoe P, Polya DA. 2008. Geochemistry of 700 aquifer sediments and arsenic-rich groundwaters from Kandal Province, Cambodia. 701 Appl. Geochem. 23:3029-3046. 702
18. Buschmann J, Berg M. 2009. Impact of sulfate reduction on the scale of arsenic 703 contamination in groundwater of the Mekong, Bengal and Red River deltas. Appl. 704 Geochem. 24:1278-1286. 705
19. Benner SG, Blowes DW, Ptacek CJ. 1997. A full-scale porous reactive wall for 706 prevention of acid mine drainage. Ground Water Monit. Remediat. 17:99-107. 707
20. Dvorak DH, Hedin RS, Edenborn HM, McIntire PE. 1992. Treatment of metal 708 contaminated water using bacterial sulfate reduction-results from pilot scale reactors. 709 Biotechnol. Bioeng. 40:609-616. 710
on June 14, 2018 by guesthttp://aem
.asm.org/
Dow
nloaded from
29
21. Rabus R, Hansen TA, Widdel F. 2006. Dissimilatory Sulfate- and Sulfur-Reducing 711 Prokaryotes, p. 659-768. In Dworkin M, Falkow S, Rosenberg E, Schleifer K-H, 712 Stackebrandt E (ed.), The Prokaryotes. Springer New York. 713
22. Kirk MF, Holm TR, Park J, Jin QS, Sanford RA, Fouke BW, Bethke CM. 2004. 714 Bacterial sulfate reduction limits natural arsenic contamination in groundwater. 715 Geology 32:953-956. 716
23. Kirk MF, Roden EE, Crossey LJ, Brearley AJ, Spilde MN. 2010. Experimental 717 analysis of arsenic precipitation during microbial sulfate and iron reduction in model 718 aquifer sediment reactors. Geochim. Cosmochim. Acta 74:2538-2555. 719
24. Saunders JA, Lee MK, Shamsudduha M, Dhakal P, Uddin A, Chowdury MT, 720 Ahmed KM. 2008. Geochemistry and mineralogy of arsenic in (natural) anaerobic 721 groundwaters. Appl. Geochem. 23:3205-3214. 722
25. Polizzotto ML, Kocar BD, Benner SG, Sampson M, Fendorf S. 2008. Near-surface 723 wetland sediments as a source of arsenic release to ground water in Asia. Nature 724 454:505-508. 725
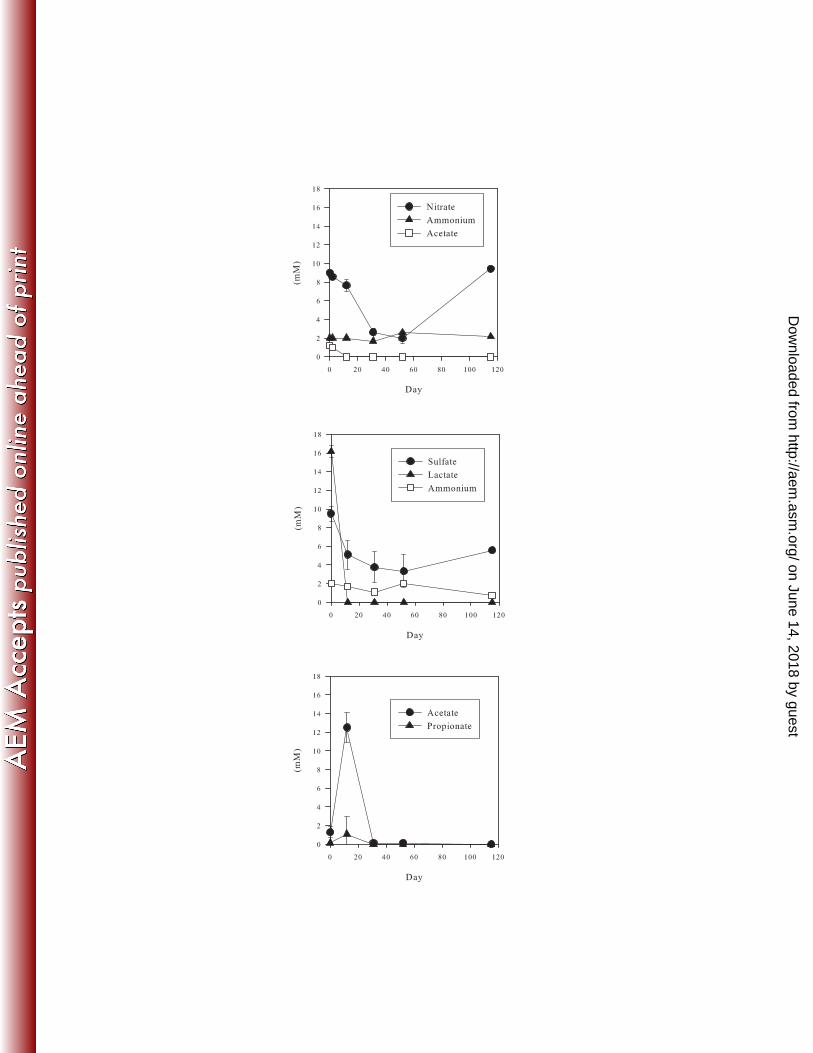
26. Berg M, Stengel C, Trang PTK, Viet PH, Sampson ML, Leng M, Samreth S, 726 Fredericks D. 2007. Magnitude of arsenic pollution in the Mekong and Red River 727 Deltas - Cambodia and Vietnam. Sci. Total Environ. 372:413-425. 728
27. Lovley D, R. , Phillips E, J., P. 1986. Organic-matter mineralization with reduction 729 of ferric iron in anaerobic sediments. Appl. Environ. Microbiol. 51:683-689. 730
28. Smieja JA, Wilkin RT. 2003. Preservation of sulfidic waters containing dissolved 731 As(III). J. Environ. Monit. 5:913-916. 732
29. Niemann H, Duarte J, Hensen C, Omoregie E, Magalhaes VH, Elvert M, 733 Pinheiro LM, Kopf A, Boetius A. 2006. Microbial methane turnover at mud 734 volcanoes of the Gulf of Cadiz. Geochim. Cosmochim. Acta 70:5336. 735
30. Ludwig W, Strunk O, Westram R, Richter L, Meier H, Yadhukumar, Buchner 736 A, Lai T, Steppi S, Jobb G, Forster W, Brettske I, Gerber S, Ginhart AW, Gross 737 O, Grumann S, Hermann S, Jost R, Konig A, Liss T, Lussmann R, May M, 738 Nonhoff B, Reichel B, Strehlow R, Stamatakis A, Stuckmann N, Vilbig A, Lenke 739 M, Ludwig T, Bode A, Schleifer K-H. 2004. ARB: a software environment for 740 sequence data. Nucleic Acids Res. 32:1363-1371. 741
31. Pruesse E, Quast C, Knittel K, Fuchs BM, Ludwig WG, Peplies J, Glockner FO. 742 2007. SILVA: a comprehensive online resource for quality checked and aligned 743 ribosomal RNA sequence data compatible with ARB. Nucleic Acids Res. 35:7188-744 7196. 745
32. Nordstrom DK, Archer DG. 2003. Arsenic thermodynamic data and environmental 746 geochemistry, p. 2-25. In Welch AH, Stollenwerk KG (ed.), Arsenic in Groundwater. 747 Kluwer, Boston. 748
33. Couture RM, Gobeil C, Tessier A. 2010. Arsenic, iron and sulfur co-diagenesis in 749 lake sediments. Geochim. Cosmochim. Acta 74:1238-1255. 750
on June 14, 2018 by guesthttp://aem
.asm.org/
Dow
nloaded from

30
34. Helz GR, Tossell JA. 2008. Thermodynamic model for arsenic speciation in sulfidic 751 waters: A novel use of ab initio computations. Geochim. Cosmochim. Acta 72:4457-752 4468. 753
35. Rowland H, A., L., Pederick RL, Polya DA, Pancost RD, Van Dongen BE, Gault 754 AG, Vaughan DJ, Bryant C, Anderson B, Lloyd JR. 2007. The control of organic 755 matter on microbially mediated iron reduction and arsenic release in shallow alluvial 756 aquifers, Cambodia. Geobiology 5:281-292. 757
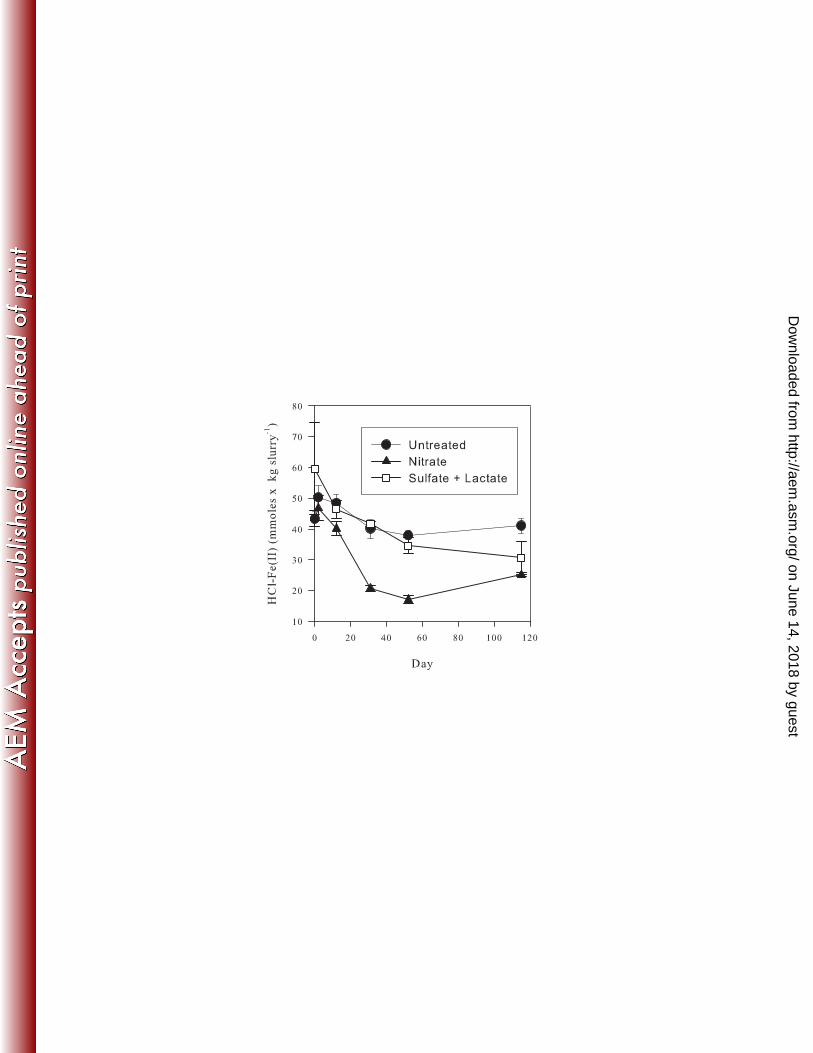
36. MacRae JD, Lloyd JR. 2008. Geobacter uraniireducens mobilizes arsenic sorbed to 758 amorphous iron minerals, American Society for Microbiology General Meeting. 759
37. Lovley D. 2006. Dissimilatory Fe(III)- and Mn(IV)-Reducing Prokaryotes, p. 635-760 658. In Dworkin M, Falkow S, Rosenberg E, Schleifer K-H, Stackebrandt E (ed.), 761 The Prokaryotes. Springer New York. 762
38. Lloyd JR, Gault AG, Héry M, MacRae JD. 2011. Microbial transformations of 763 arsenic in the subsurface, p. 77-90. In Stolz J, F., Oremland R, S. (ed.), Environmental 764 Microbe-Metal Intereactions II. ASM Press, Washington. 765
39. MacRae JD, Lavine IN, McCaffery KA, Ricupero K. 2007. Isolation and 766 characterization of NP4, arsenate-reducing Sulfurospirillum, from Maine 767 groundwater. Journal of Environmental Engineering-Asce 133:81-88. 768
40. Stolz JF, Oremland RS. 1999. Bacterial respiration of arsenic and selenium. FEMS 769 Microbiol. Rev. 23:615-627. 770
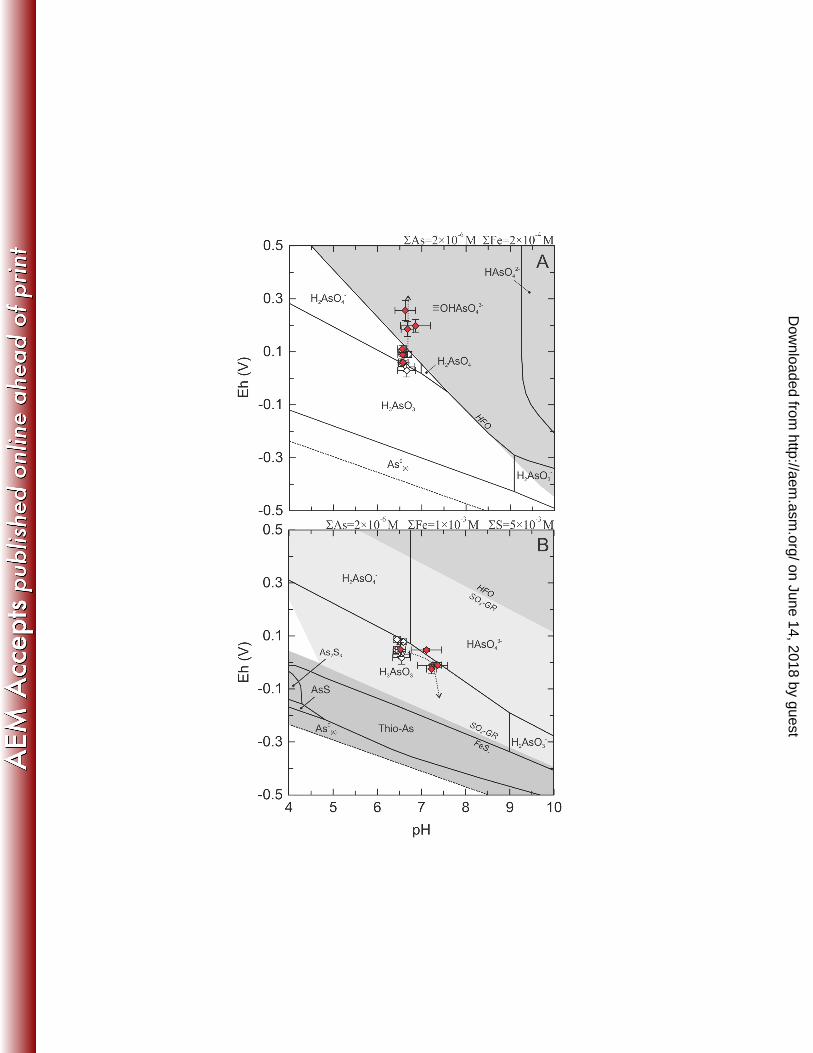
41. Coker V, S. , Gault A, G., Pearce C, I., van der Laan G, Telling N, D. , Charnock 771 J, M., Polya DA, Lloyd J, R. 2006. Incorporation of As(V) within biogenic nano-772 magnetite: A study using x-ray circular dichroism and x-ray absorption spectroscopy. 773 Environmental Science and Technology 40:7745-7750. 774
42. Weiss JV, Rentz JA, Plaia T, Neubauer SC, Merrill-Floyd M, Lilburn T, 775 Bradburne C, Megonigal JP, Emerson D. 2007. Characterization of neutrophilic 776 Fe(II)-oxidizing bacteria isolated from the rhizosphere of wetland plants and 777 description of Ferritrophicum radicicola gen. nov sp nov., and Sideroxydans 778 paludicola sp nov. Geomicrobiol. J. 24:559-570. 779
43. Emerson D, Moyer C. 1997. Isolation and characterization of novel iron-oxidizing 780 bacteria that grow at circumneutral pH. Appl. Environ. Microbiol. 63:4784-4792. 781
44. Rickard D. 2006. The solubility of FeS. Geochim. Cosmochim. Acta 70:5779-5789. 782
45. Couture R-M, Cappellen PV. 2011. Reassessing the role of sulfur geochemistry on 783 arsenic speciation in reducing environments J. Hazard. Mater.:647-652. 784
46. Wolthers M, Charlet L, Van der Weijden CH, Van der Linde PR, Rickard D. 785 2005. Arsenic mobility in the ambient sulfidic environment: Sorption of arsenic(V) 786 and arsenic(III) onto disordered mackinawite. Geochim. Cosmochim. Acta 69:3483-787 3492. 788
on June 14, 2018 by guesthttp://aem
.asm.org/
Dow
nloaded from
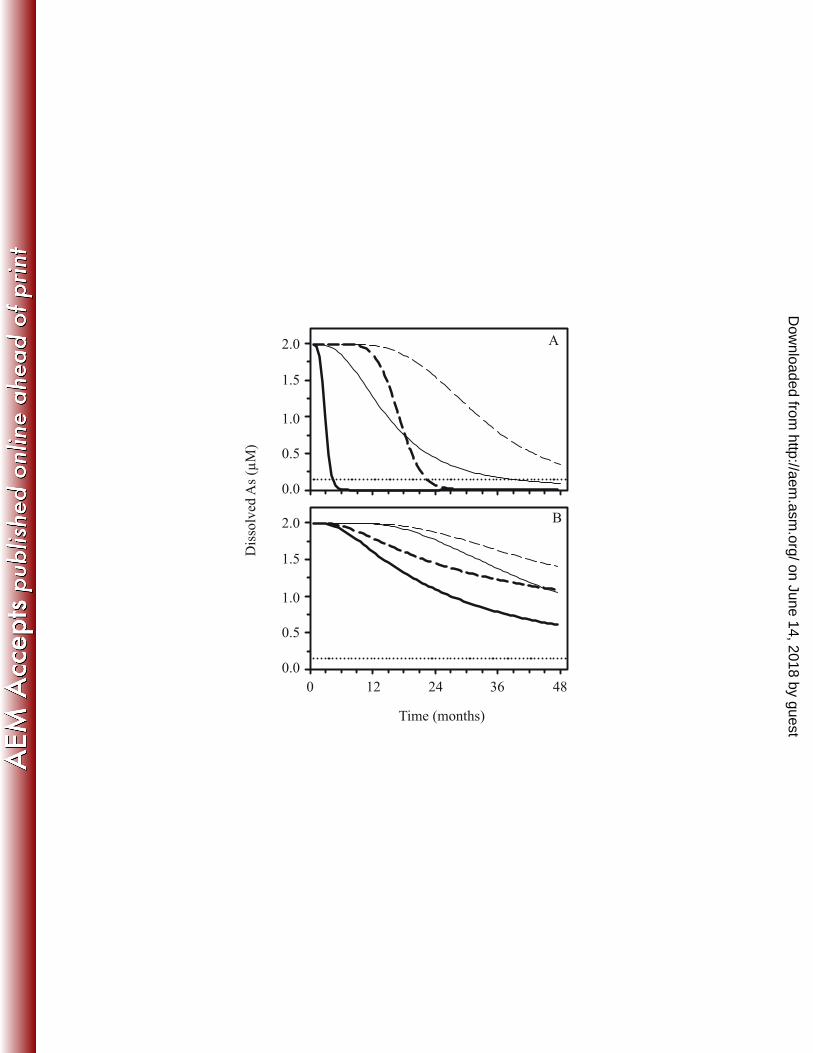
31
47. Farquhar ML, Charnock JM, Livens FR, Vaughan DJ. 2002. Mechanisms of 789 arsenic uptake from aqueous solution by interaction with goethite, lepidocrocite, 790 mackinawite, and pyrite: An X-ray absorption spectroscopy study. Environ. Sci. 791 Technol. 36:1757-1762. 792
48. Lear G, Song B, Gault AG, Polya DA, Lloyd JR. 2007. Molecular analysis of 793 arsenate-reducing bacteria within Cambodian sediments following amendment with 794 acetate. Appl. Environ. Microbiol. 73:1041-1048. 795
49. van Dongen BE, Rowland H, A., L., Gault AG, Polya DA, Bryant C, Pancost RD. 796 2008. Hopane, sterane and n-alkane distributions in shallow sediments hosting high 797 arsenic groundwaters in Cambodia. Appl. Geochem. 23:3047-3058. 798
50. Blothe M, Roden EE. 2009. Composition and activity of an autotrophic Fe(II)-799 oxidizing, nitrate-reducing enrichment Culture. Appl. Environ. Microbiol. 75:6937-800 6940. 801
51. Wasserman GA, Liu XH, Parvez F, Ahsan H, Levy D, Factor-Litvak P, Kline J, 802 van Geen A, Slavkovich V, Lolacono NJ, Cheng ZQ, Zheng Y, Graziano JH. 803 2006. Water manganese exposure and children's intellectual function in Araihazar, 804 Bangladesh. Environ. Health Perspect. 114:124-129. 805
52. Basso O, Caumette P, Magot M. 2005. Desultovibrio putealis sp nov., a novel 806 sulfate-reducing bacterium isolated from a deep subsurface aquifer. Int. J. Syst. Evol. 807 Microbiol. 55:101-104. 808
53. Wolthers M, Butler IB, Rickard D, Mason PRD. 2005. Arsenic uptake by pyrite at 809 ambient environmental conditions: A continuous-flow experiment. Acs Sym Ser 810 915:60-76. 811
54. Burton ED, Johnston SG, Bush RT. 2011. Microbial sulfidogenesis in ferrihydrite-812 rich environments: effects on iron mineralogy and arsenic mobility. Geochim. 813 Cosmochim. Acta In Press, Accepted Manuscript. 814
55. Gallegos TJ, Hyun SP, Hayes KF. 2007. Spectroscopic Investigation of the Uptake 815 of Arsenite From Solution by Synthetic Mackinawite. Environ. Sci. Technol. 816 41:7781-7786. 817
56. O'Day PA, Vlassopoulos D, Root R, Rivera N. 2004. The influence of sulfur and 818 iron on dissolved arsenic concentrations in the shallow subsurface under changing 819 redox conditions. Proc. Natl. Acad. Sci. U.S.A. 101:13703-13708. 820
57. Hallberg KB, Johnson DB. 2005. Biological manganese removal from acid mine 821 drainage in constructed wetlands and prototype bioreactors. Sci. Total Environ. 822 338:115-124. 823
824
825
on June 14, 2018 by guesthttp://aem
.asm.org/
Dow
nloaded from
32
Figure legends 826
827
Figure 1. Soluble arsenic, iron and manganese concentrations for the untreated (A), nitrate 828
treated (B), and sulfate plus lactate treated (C) microcosms. The origin of time on the graphs 829
corresponds to the start of the remediation phase. Average results from three separate 830
microcosms are plotted. Error bars are standard deviations of the results from the three 831
microcosms. The long dashed horizontal line indicates the WHO guideline maximum 832
acceptable concentration for As, short dashed line indicates the WHO guideline maximum 833
concentration for Mn. 834
835
Figure 2. Anion and ammonium measurements from the nitrate treated (A), and sulfate plus 836
lactate treated microcosms (B and C). The origin of time on the graphs corresponds to the 837
start of the remediation phase. Average results from three separate microcosms are plotted. 838
Error bars are standard deviations of the results from the three microcosms. On day 52 of the 839
remediation phase, the microcosms were further amended to approximately 11 mM sodium 840
nitrate, or approximately 13 mM sodium sulfate and 15 mM sodium lactate, respectively. 841
842
Figure 3. HCl-extractible Fe(II). Plots are from the untreated, nitrate treated, and sulfate plus 843
lactate treated microcosms. The origin of time on the graphs corresponds to the start of the 844
remediation phase. Average results from three separate microcosms are plotted. Error bars 845
are standard deviations of the results from the three microcosms. 846
847
Figure 4. Reaction pathway models at 25 oC for the nitrate treated (A), and sulfate plus 848
lactate (B) treated microcosms. Shaded diamonds are calculated Eh and pH values for the 849
nitrate, and sulfate plus lactate treated microcosms. Open diamonds are Eh-pH couples for 850
on June 14, 2018 by guesthttp://aem
.asm.org/
Dow
nloaded from

33
the untreated microcosms. Each point is the average of the three replicate microcosms, and 851
error bars are the standard deviations from those measurements. Dotted lines with arrows 852
indicates the pathway of the reactions. Solid lines delineate the stability fields of various As 853
and Fe species. The symbol ≡ indicates a sorption complex. FeSx represents the combined 854
stability fields of FeSm(s) (mackinawite) and FeS2 (pyrite). 855
856
857
Figure 5. Model predicted As concentration as a function of time along an aquifer flow line, 858
at 50m (solid lines) and 100m (dashed lines) from the site of a continuous nitrate (panel A) or 859
sulfate plus lactate (panel B) injection. The concentrations of sulfate and nitrate injected are 860
either fixed at those used in the microcosms (bold) or at the recommended WHO level for 861
drinking water (thin lines). The horizontal dotted lines indicate the recommended WHO 862
provisional guide value for As in drinking water (0.13 µM). 863
864
865
866
867
on June 14, 2018 by guesthttp://aem
.asm.org/
Dow
nloaded from
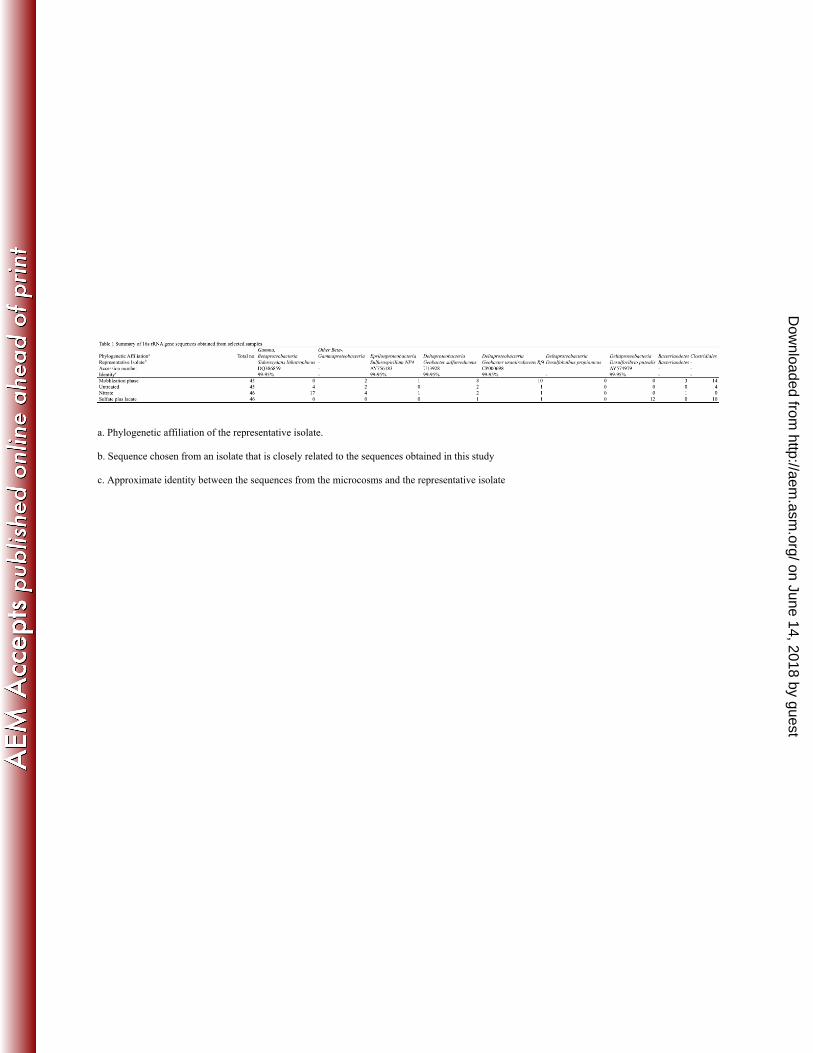
a. Phylogenetic affiliation of the representative isolate.
b. Sequence chosen from an isolate that is closely related to the sequences obtained in this study
c. Approximate identity between the sequences from the microcosms and the representative isolate
on June 14, 2018 by guesthttp://aem
.asm.org/
Dow
nloaded from
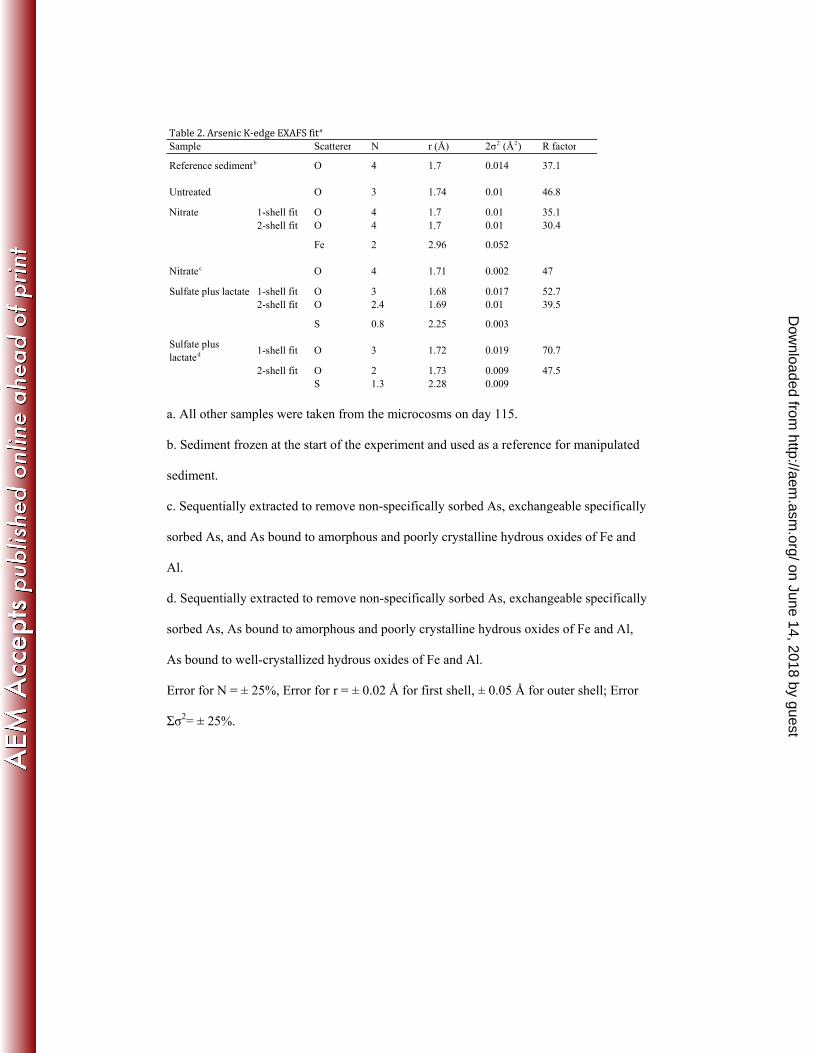
Table 2. Arsenic K-edge EXAFS fitaSample Scatterer N r (Å) 2σ2 (Å2) R factor
Nitrate 1-shell fit O 4 1.7 0.01 35.12-shell fit O 4 1.7 0.01 30.4
Sulfate plus lactate 1-shell fit O 3 1.68 0.017 52.72-shell fit O 2.4 1.69 0.01 39.5
Sulfate plus lactated 1-shell fit O 3 1.72 0.019 70.7
2-shell fit O 2 1.73 0.009 47.5S 1.3 2.28 0.009
37.1Reference sedimentb O 4 1.7 0.014
46.8
Fe 2 2.96 0.052
Untreated O 3 1.74 0.01
47
S 0.8 2.25 0.003
Nitratec O 4 1.71 0.002
a. All other samples were taken from the microcosms on day 115.
b. Sediment frozen at the start of the experiment and used as a reference for manipulated
sediment.
c. Sequentially extracted to remove non-specifically sorbed As, exchangeable specifically
sorbed As, and As bound to amorphous and poorly crystalline hydrous oxides of Fe and
Al.
d. Sequentially extracted to remove non-specifically sorbed As, exchangeable specifically
sorbed As, As bound to amorphous and poorly crystalline hydrous oxides of Fe and Al,
As bound to well-crystallized hydrous oxides of Fe and Al.
Error for N = ± 25%, Error for r = ± 0.02 Å for first shell, ± 0.05 Å for outer shell; Error
Σσ2= ± 25%.
on June 14, 2018 by guesthttp://aem
.asm.org/
Dow
nloaded from
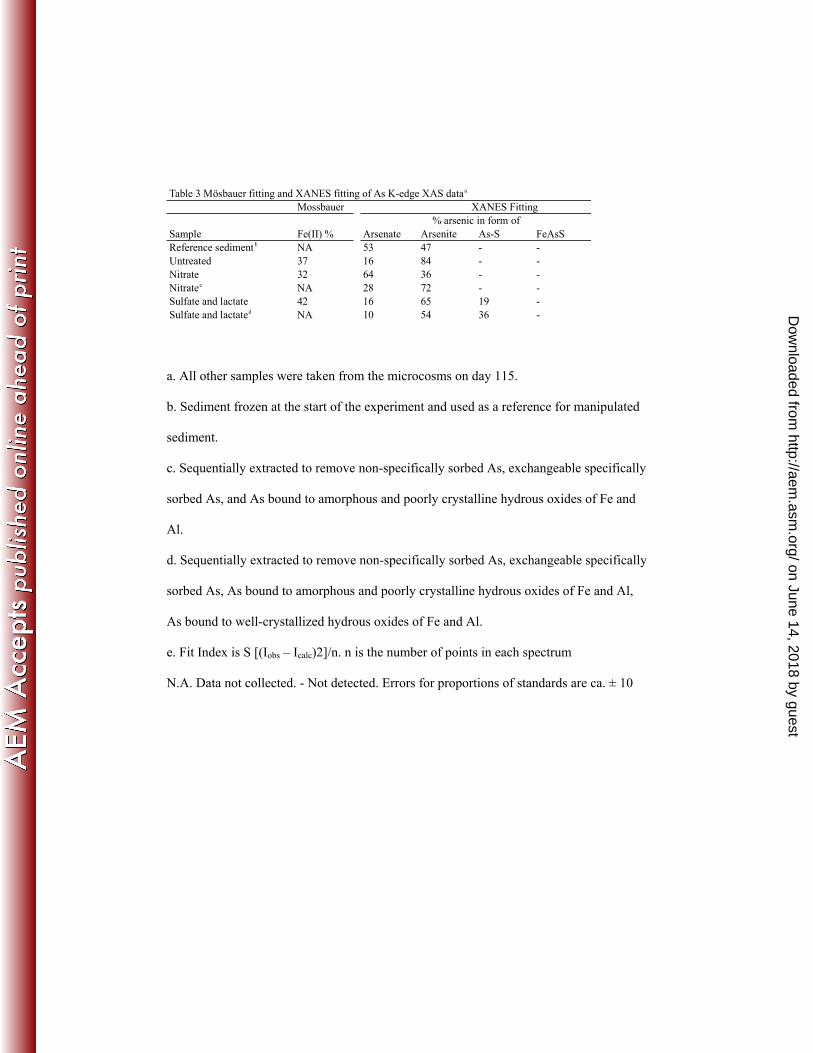
Table 3 Mösbauer fitting and XANES fitting of As K-edge XAS dataa
Mossbauer
Sample Fe(II) % Arsenate Arsenite As-S FeAsSReference sedimentb NA 53 47 - -Untreated 37 16 84 - -Nitrate 32 64 36 - -Nitratec NA 28 72 - -Sulfate and lactate 42 16 65 19 -Sulfate and lactated NA 10 54 36 -
% arsenic in form ofXANES Fitting
a. All other samples were taken from the microcosms on day 115.
b. Sediment frozen at the start of the experiment and used as a reference for manipulated
sediment.
c. Sequentially extracted to remove non-specifically sorbed As, exchangeable specifically
sorbed As, and As bound to amorphous and poorly crystalline hydrous oxides of Fe and
Al.
d. Sequentially extracted to remove non-specifically sorbed As, exchangeable specifically
sorbed As, As bound to amorphous and poorly crystalline hydrous oxides of Fe and Al,
As bound to well-crystallized hydrous oxides of Fe and Al.
e. Fit Index is S [(Iobs – Icalc)2]/n. n is the number of points in each spectrum
N.A. Data not collected. - Not detected. Errors for proportions of standards are ca. ± 10
on June 14, 2018 by guesthttp://aem
.asm.org/
Dow
nloaded from