aecom bim scorecard the uk digital journey · aecom bim scorecard aecom project technologies...
TRANSCRIPT

AECOM BIM Scorecard
AECOM Project Technologies
2016.Q3
Constructing Our World:
THE UK DIGITAL JOURNEY
23rd March, Auckland
David Philp –
AECOM Global BIM/IM Consultancy Director
Chair SFT BIM Working Group
FICE, FCIOB, FRICS, FInstCES

Key Sector Statistics

pro
du
cti
vit
y
A GLOBAL DRIVE TOWARDS INDUSTRY REFORM
A backdrop of declining productivity and a low degree of productivity
Digital and
Industry 4.0
Seen as a
Paradigm
Shift

Bringing National BIM Efforts to a Common European Approach
Bringing together European Public Approach
35%

The traditional construction business model does not act in the long-term interests of the industry. This is not a hyperbolic statement: it is reality.
We need to change the way construction does business look at challenging the current construction business model (associated with low margins, low levels of investment in people and R&D, recent issues of poor quality buildings, pushing risk and responsibility down the supply chain etc.)
We need to learn from best practice and innovation around the world, not just other construction organisation but also other sectors on how to do so.
Construction’s flawed business model
Siloes – with little collaboration Little innovation or R&D spend

A re-chipped outcome based sector
Over Run
Operate & In-UseNo one has spoken with us till no? Where's our data? That’s not what we wanted!
Construction and Assembly
Value Engineering, Change, CEs, VOs
Over-run
Strategic definition and briefing We didn’t learn any lessons from previous projects. The brief is fuzzy!
Concept Design Detailed and Construction DesignCapEx Driven
Soft Landings – Talking to our operational friends – Learning from previous projects
Intelligent data
driven brief
Create the Virtual Asset: Integrated concurrent engineering / AR /VR
Outcome based – digitized / BIM approach
Assemble the Physical Asset$$$ Whole-LifeMinimal Change / DfMA Approach
Maintain the AIM
Operate & In-Use [POE/Refine]
A traditional output based process

80% Long TermWLCFixed in first20% Early Design
Operation &Maintenance
OpEx 80%
BusinessCosts
Organisation Performance 300% x through portfolios
Data: Learning from our assets / user pull
Ratio ofCosts Over anAssetLifecycle
Construct
Design
CapEx 20%
BIM /VDC
BusinessOutcomes
Social Performance 3000% x through society
Lifecycle Data Sciences
Cognitive Asset Management / Natural language interfaceTelemetry / Analytics

We have a long history of promoting reform In the UK construction industry
1944 The Simon Report ‘The Placing and Management of Building Contracts’ chaired by Sir Ernest Simon investigated how the placing and management of contracts could improve the efficiency of the construction industry.
1994 The Latham Report, Constructing the Team By Sir Michael Latham, 1994. Reviewed procurement and contractual arrangements in the UK construction industry, aiming to tackle controversial issues facing the industry during a period of lapse in growth.
1998 The Egan Report, Rethinking Construction
The report by Sir John sought to improve performance through eliminating waste or non-value-adding activities from the construction process.

A need for reform and technological advancement in construction
“We’ve got no money, so we’ve got to think,” New Zealand born physicist, Ernest Rutherford
A time for sector reform
Technologically advanced, highly automated, digitalized process flows and a stream of live production data.
Advanced DfMAHuman robot collaboration / augmenting

BIM = Virtual Asset Lifecycle Engineering:
Allows the virtual production, analysis, evaluation and optimal developmentof an asset in a digital environment that mimics the understanding andbehaviour of the solution to the realization of that solution in reality.
Build Better Before Built & Operated
= Better outcomes
Digital Briefing& Digital
Procurement
OptimisedOperation

IS019650
BIMDigital
EngineeringVDC
Task Groups, Mandates and StandardsReports and Acceleration Committees
Smart ICT
Guides and Road-maps
Pilots
AccelerationCommittee,BIM Handbook

Digital technology is changing the way we plan, build, maintain and use our social and economic infrastructure.
Building Information Modelling (BIM) is already transforming the UK construction industry.
Over the next decade this technology will combinewith the internet of things (providing sensors andother information), advanced data analytics and thedigital economy to enable us to plan newinfrastructure more effectively, build it at lower costand operate and maintain it more efficiently. Aboveall, it will enable citizens to make better use of theinfrastructure we already have.
This is Digital Built Britain (DBB).
THE UK SHIFT TOWARDS SECTOR DIGITISATION

BIM A Journey Not A Destination
Social
Level 4
Outcomes
Level 3
Operational ££
Performance ££
Level1Better
InformationManagement
Stimulating behavioural change within the industry
OPEX£Level 2

2011 Government Construction strategyThe Government Construction Strategy is the
framework for a range of work-streams, all of
which have the ultimate aim of reducing the
cost of government construction projects by
15-20% by the end of the current Parliament.
Ensures the Government consistently gets a
good deal and the country gets the social
and economic infrastructure it needs for the
long-term…'
• Procurement / Lean Client • Standards / Lean Supply • FM / Soft Landings • Data and Benchmarking. • BIM Strategy• Performance Management

Benefits of a mandate
A CENTRALISEDAPPROACH TO BIM:
ACCLERATINGSUPPLY CHAIN ADOPTION AND CAPABAILITY
CONSISTENCY THROUGHSTANDARDS AND GUIDANCE

5.2% Space Savings (through Data-based design)
35% area reduction in complex spaces due to 3D Coordination
20-30% savings through BIM –Based Procurement
Motor Replacement Case Study – 27 day / 11 Man-Hour savings
UK-Government BIM ROI StudyMultiple opportunities to save time and money across the lifecycle with BIM

Level 2 Benefits Realised:
• Encourage collaborative working including early engagement of FM and Operation
• Visualisation & Lifecycle solution testing & preconstruction stage
• Accurate and complete data improving quality of bids, reducing risk allowances in target prices and lump sum bids
• 3D model input into the assessment of the impact changes at all stages in a project lifecycle
• Input of a populated asset data set into CAFM systems – saving time and avoid duplication


CREATING DATA RICH DIGITAL TWINS

BIM in DesignBIM in design

BIM in DesignBIM in design

Escalators – monitor operational
hours, alarms, faults, power
consumption
Building Management Systems –
monitor temperature, faults, HVAC,
weather, powerSCADA – manages and monitors
power systems for electrification
Smart Stations and Infrastructure
Ticket Barriers – monitor
passenger flow, capture
revenue, signal faults
CCTV – security systems, pattern
recognition
Information : OperationsInformation in Operations

23
Digital triage of faults
Performance monitoring → predictive and risk-based maintenance
Sensors and control systems alert faults.
BIM model visualisation allows remote diagnostics and review
Information in MaintenanceInformation in Maintenance

BIM and DfMA a Mutualism
Whilst demand is growing for each individually the real benefits happen when these two themes converge. Both share the same value proposition of technological advancement which unlocks improvements in safety, quality, productivity and cost.

BIM Library Concept‘Reducing Cost and Increasing Quality Through Standardisation’
Concept
Component
Component Assemblies
Standardisation / DFMA etc
Drives down cost here
Drives up value here
Speeds up site times, reduces
risk. Drives down cost here

BIM + DfMA: The Adoption Scale
Key Questions:
Image courtesy: Bryden Wood

BIM
A
VERY
SCOTTISH
STORY

“ BIM will be introduced in central government with a view to encouraging adoption across the public sector. The objective should be that, where appropriate, projects across the public sector adopt BIM level 2 by April 2017.”
Review of Scottish Public Sector Procurement In Construction
• Recommendation endorsed by Scottish Ministers
• Supported by 5 supplementary BIM recommendations

Pro
ject
Org
anis
atio
nal
Data StrategyTemplates
Asset Management
&Maintenance
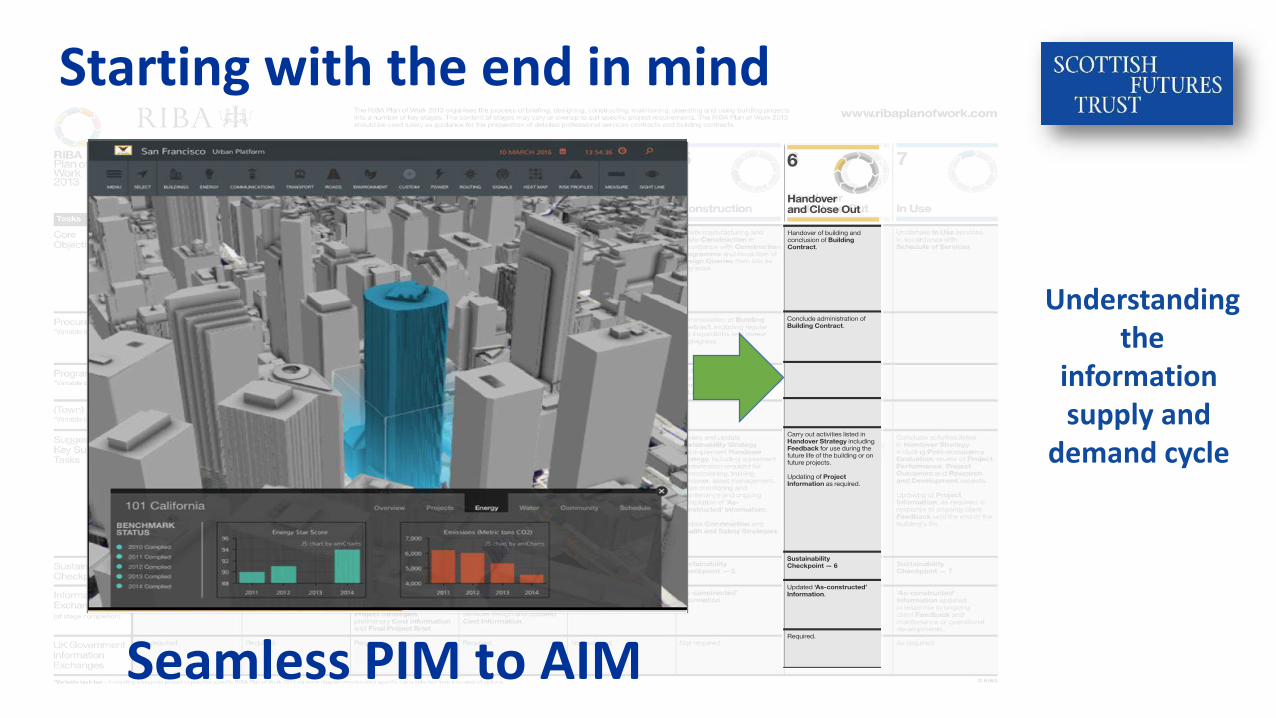
Start with the end in mind
TheoreticalPerformanceTargets
Simulate andTest DesignV Targets
2D PDFs 3D models(native format)
Non graphicaldata (COBie)
Starting with the end in mind
Seamless PIM to AIM
Understandingthe
information supply and
demand cycle

What Data Do You Require?
Motorised valve Yes Stop valve NoPump YesPipes ?Clips No Plant footings NoGrilles ? Acoustic Baffles ?
Product Type/NameSupplier DetailsMaintenance DataDescriptionLocationAsset TagLifecycle DataRoomWeight DimensionsSerial Number
“Proportionate data requirements that have purpose and value”
What Data?What Assets?

Approach To Implementation
When?To Adopt BIM
Level 2
Why?To Adopt BIM
Level 2
How?To Adopt BIM
Level 2
BIM Level 2 Grading Tool BIM Level 2 Benefits Tool BIM Level 2 Guidance

BIM Pathfinder Projects
BIM Pathfinder Projects


Retained estate is also key

WHERE NEXT? THE DIGITAL CONSTRUCTION FUTURE

Industry 4.0 is a ubiquitous connection of people, things and machines.
Enabled by a Level 3 BIM environmentproducts, transport and or tools areexpected to “negotiate” within a virtual marketplace regarding whichProduction elements could bestaccomplish the next production step. This will create a seamless link betweenthe virtual world and the physical objects within the real world.
The future of making things Is both digital and physical

Industry 4.0 Enabled PlantEmbedded Production Engineering Team
CONNECTED TOOLS IN MANUFACTURING

5. The performance modelDelivers product performance rather than the product itself. Primary revenue stream from payments for performance delivered.o Products that are in use for what they do, rather than for
what they areo Provider owns and maintains the producto Clients pays for functionality (pay per use)
CIRCULAR BUSINESS MODELS
PHILIPS – Pay per Lux“I told Philips, ‘I’m not interested in the product, just the performance. I want to buy light, and nothing else.” Thomas Rau
CONNECTED TOOLS IN MANUFACTURING
New product performance models

Level 3 – Measurement & Feedback and Smart
Function 1
Function 2
Function 3
Function n
Organisational Performance
Multiplied through portfolios
Social Performance
Multiplied through society
Operations/
Facilities
Management
Level 2
Level 3
Level 4
Design Build
Interoperable Cross Sector Smart Cities & Grids
Dependency Analytics Using Big Data

i3INFORMATIONINTELLIGENCEINTEGRATION
David Philp – Global BIM/IM Consultancy DirectorFICE, FCIOB, FRICS, FInstCES

Our assertion:Digitization allows us totest many scenarios, make well informed decisionsabout the future, optimizeprocesses, improve assetperformance, usability and learn form real-time data.
Better outcome =Better business

Organized Data DeliveryHandover usable, digital, indexed design and construction documentation.
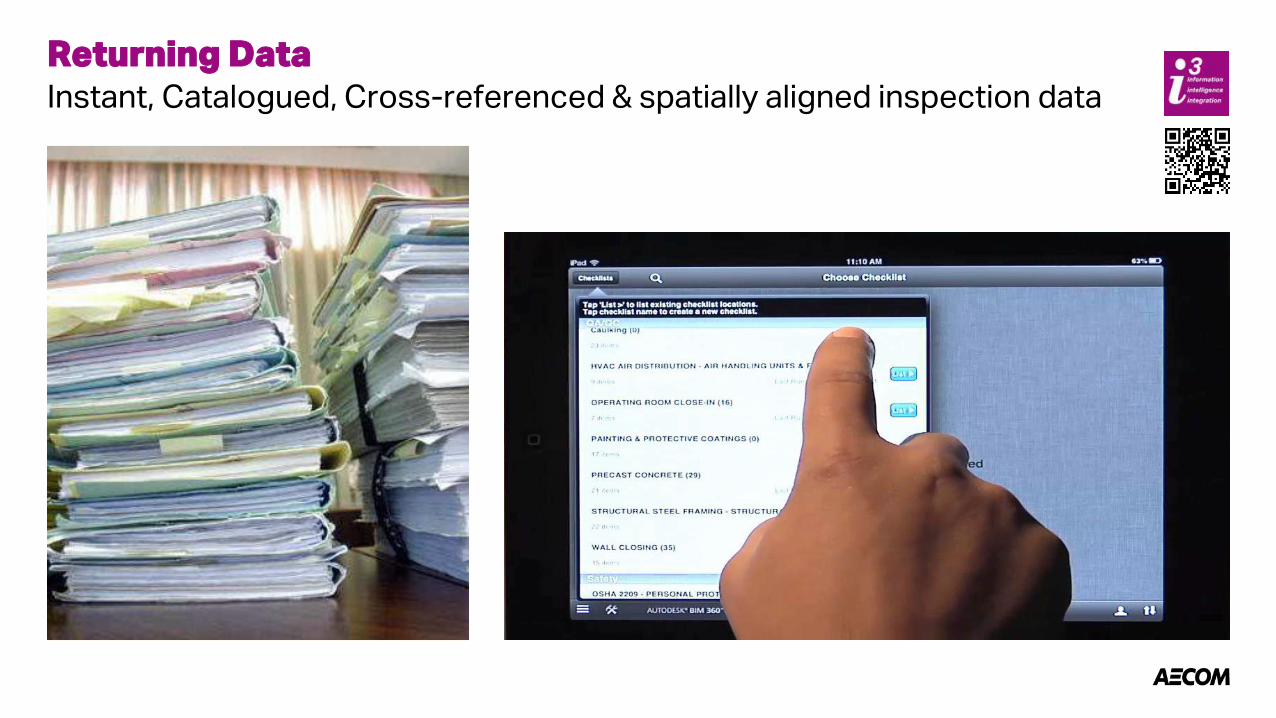
Returning DataInstant, Catalogued, Cross-referenced & spatially aligned inspection data

Real-time access to digital informationAt any point in an asset’s life cycle we ensure that clients can make more reliable, rapid and informed decisions through access to a persona based dash-board access to their information and natural language queries. Right data, right time, right place.

I3 DATA INTEGRATION ENVIRONMENT


Data and Information Science

Data Management

Asset Information Models for whole life value
From Operational Readiness to Operational Excellence

Optimisation of operational delivery

CONTINUOUS COMMISSIONINGSet virtual baselines for system performance in the BIM, and monitor/compare real world conditions to enable operating efficiency, predictive maintenance, a

Select
• Select replacement hardware based on performance
Preempt
• Create intelligent assets where predictive analytics allow repair before fail
Optimize
• Test real performance against modeled performance & optimize operations.
Performance Tuning and Predictive Maintenance
Continuous Commissioning

Edge analytics and dynamic performance optimisation
IoT and operational technology convergence. Data analytics transforming how to make better informed operational decisions
Network Connectivity Operational Intelligence
Adaptive Planning
Pe
rform
ance
An
alysis

The benefits of asset intelligence

WHAT LESSONS DID WE LEARN?

Has an appropriate Level of BIM
Maturity beendetermined?
Have requirementsbeen defined
anddocumented?
Does theSupply chain
have the BIM capability and capacity ?
Has BIMbeen includedin all contracts
and appointments?
Are theappropriate
standards beingused to
create the PIM?
?
Has allverified and
validateddata been
handed over ?
?
Does thePIM incorporate
manufacturerand specialist
Sub-contractor data ?
?
Is therean Asset
InformationModel strategy
In place?
?
Is a common data environment being utilised?
Is there a feedback / lessons learned loop in place?
KEY LEARNINGS
• Clients need to steer the outcomes they necessitate rather than leave the outcome be shaped by their supply chain.
• This requires clear definition of common data standards and information management processes to support and integrated asset life-cycle.
• Support purposeful collaboration and lean working practices across stakeholders.

KEY LEARNINGS
Remember people and collaborative behaviours are the key
• Always start with the end in mind and have clear purpose for your data both during the delivery and operational stages.
• Encourage collaborative working including early engagement of FM and Operation. Digital AIM.
• Common Date Environment and Master Data Management are essential ingredients.
• Structured data - Asset definitions, Deliverable templates, Information metrics.
• Information management and data deliverable processes

and proportionate
BIM Strategy:
Better
Outcomes

AECOM BIM Scorecard
AECOM Project Technologies
2016.Q3
Constructing Our World Presentation:
THANK YOU
23rd March, Auckland