advanced wireless power transfer vehicle and ... wireless power transfer vehicle and infrastructure...
TRANSCRIPT

NREL is a national laboratory of the U.S. Department of Energy, Office of Energy Efficiency and Renewable Energy, operated by the Alliance for Sustainable Energy, LLC.
Project ID # VSS130
Advanced Wireless Power Transfer Vehicle and Infrastructure Analysis
P.I.: Jeff Gonder Team: Aaron Brooker, Evan Burton, Joann Wang,
and Arnaud Konan National Renewable Energy Laboratory Annual Merit Review and Peer Evaluation Meeting June 18, 2014 Washington, D.C. NREL/PR-5400-61937
This presentation does not contain any proprietary, confidential, or otherwise restricted information.

2
Overview
• Project Start Date: October 2013 • Project End Date: September 2014 • Percent Complete: 50%
• Risk Aversion • Cost of Vehicle Electrification • Infrastructure
• Total Project Funding: $200K (all DOE FY14)
• Project also builds on $250K FY13 Interstate Electrification Modeling & Simulation effort
Timeline
Budget
Barriers
• ORNL – technology development, feasibility study collaborator
• Industry – inputs on technology capability/costs, modeling tools and assumptions
• DOT – complementary analysis under the Clean Transportation Sector Initiative
• Project Lead – NREL
Partners
DOT = Department of Transportation NREL = National Renewable Energy Laboratory ORNL = Oak Ridge National Laboratory

3
Relevance to DOE Fuel-Saving Mission
• Increased electric energy available to a vehicle Increased fuel displacement
• Potential BEV enabler o Recharging while driving would mitigate range anxiety o Could improve market penetration and aggregate fuel
savings
• Opportunity to improve electrification cost effectiveness o For BEVs, PHEVs and HEVs o Smaller, more affordable energy storage configurations
may realize fuel displacement similar to a large-battery plug-in vehicle
o Improve sales and total fuel savings
Photo from iStock/7579060 BEV = battery electric vehicle; HEV = hybrid electric vehicle; PHEV = plug-in hybrid electric vehicle

4
Relevance to Addressing Barriers
• Risk aversion o Very much an emergent area with significant uncertainties and risks o Manufacturers therefore are unlikely to pursue aggressively o DOE investment is warranted, given potentially large national benefits
if successful (this project is helping quantify benefits/impacts)
• Cost o Remains a barrier to widespread penetration of electrified vehicles o WPT may improve the cost vs. benefit and marketability of electrified
vehicle technologies
• Infrastructure o Critical to coordinate R&D and analyze potential issues in parallel with
vehicle and component investigations
WPT = wireless power transfer

5
Milestones
Date Milestone or Go/No-Go Decision
Description Status (as of April 2014)
12/31/2013 Milestone Progress update. Completed
3/31/2014 Milestone Progress update. Completed
6/30/2014 Milestone Progress update. On track
9/30/2014 Milestone Report on cost vs. benefit comparison of WPT systems optimization scenarios.
On track

6
Source: Momentum Dynamics
Source: ORNL
Approach/Objective: Conduct Broad Vehicle Impact Assessment, Independent of WPT Technology
• Assume various infrastructure penetration scenarios o Consider both quasi-stationary & (farther out) in-motion implementations o Could be satisfied by a variety of technologies
Source: Volvo Group
Source: Siemens
Source: Utah State University
Source: KAIST
Source: WiTricity WT-3300 Data Sheet
Source: Qualcomm

7
Approach: Consider Range of Vehicle Vocations, Powertrains, and Impact Areas
• Potential vehicle sizes/vocations o Light-duty (LD) o Heavy-duty (HD) Class 8 truck o Medium-/heavy-duty (MD/HD) delivery vehicle
and transit bus – Particularly for quasi-stationary
• Potential vehicle powertrains o Conventional (CV) baseline o E-roadway enabled HEV, PHEV or BEV
• Areas of impact for different approaches/penetration levels o Vehicle performance and capital/operating cost o Road infrastructure o Electrical/grid infrastructure

8
0.010.020.030.040.050.060.070.0
Fuel
Eco
nom
y (M
PG)
Fuel Economy Validation
Actual
Model
Approach: Factor Together Operating Behavior, Powertrain Performance and Adoption Estimates
• Analyze real-world operating profiles, linked to road infrastructure o Databases with ≈3.5M driving miles from
≈12K LD, MD & HD vehicles • Powertrain simulations over profiles
o Validate baseline models against test data o Add WPT capability; simulate fuel use and
electricity consumption • Aggregate impacts analysis
o Estimate LD market adoption o Calculate commercial vehicle net present
cost
Transportation Secure Data
Center (TSDC)
Leveraging extensive data and well-validated
analysis tools
ADOPT = Automotive Deployment Options Projection Tool FASTSim = Future Automotive Systems Technology Simulator

9
Accomplishments: Examined Road Infrastructure Utilization Across Geographies
• Identified potential for small fraction of in-motion WPT infrastructure to cover significant amount of travel o Opportunity to maximize benefit/cost ratio o 1% of infrastructure would cover 15%–20% of travel o 10% of infrastructure would cover ≈60% of travel
National Level State/Metro Area Level

10
Accomplishments: LD Fuel and Electricity Consumption Assessment for Various Scenarios
E.g., Atlanta vehicle sample simulations for different powertrains and WPT coverage cases
0 5,000 10,000 15,000Fuel Use (Gallons)
Interstate & Highway E-HEV
Interstate E-HEV
Small Selection E-HEV
HEV
CV Baseline
All Sample Highways & Interstates
All Sample Interstates
Small Selection of Roads (≈0.01% of Sample)
Miles Traveled
Fraction Fuel Displaced vs. Distance for Each Sample Vehicle
• Very large savings from interstate coverage o Still a relatively small fraction of roads
in the sample o Savings maintained for long distances
• Working to optimize incremental rollout strategy Initial Results
Further refinement ongoing E-HEV = electric roadway enabled HEV

11
Accomplishments: Estimating Impact on LD Vehicle Adoption for Various Market Conditions (Interstate E-HEV)
• Achieve 10-year battery cost reduction targets o E-roadway helps overcome BEV range limitations
Electric Roadway
Large BEV Adoption
Initial Results Further refinement
ongoing

12
Accomplishments: Estimating Impact on LD Vehicle Adoption for Various Market Conditions (Interstate E-HEV)
• Mild technology improvements (absent engine downsizing for CAFE)
o E-HEV operating cost advantage spurs adoption
Electric Roadway
Large E-HEV Adoption
Initial Results Further refinement
ongoing
CAFE = Corporate Average Fuel Economy
13
NA10%
Function Class10%
Function Class238%
Function Class311%
Function Class424%
Function Class517%
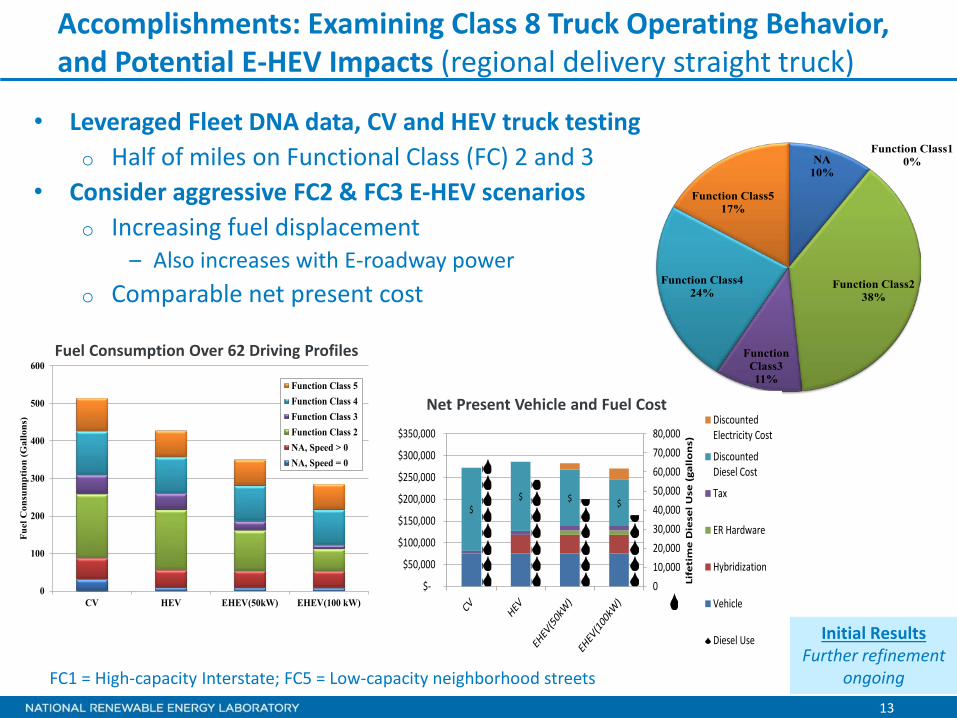
Accomplishments: Examining Class 8 Truck Operating Behavior, and Potential E-HEV Impacts (regional delivery straight truck)
• Leveraged Fleet DNA data, CV and HEV truck testing o Half of miles on Functional Class (FC) 2 and 3
• Consider aggressive FC2 & FC3 E-HEV scenarios o Increasing fuel displacement
– Also increases with E-roadway power o Comparable net present cost
FC1 = High-capacity Interstate; FC5 = Low-capacity neighborhood streets
Initial Results Further refinement
ongoing
$$ $ $
010,00020,00030,00040,00050,00060,00070,00080,000
$-
$50,000
$100,000
$150,000
$200,000
$250,000
$300,000
$350,000
Life
tim
e D
iese
l Use
(ga
llo
ns)
Present Vehicle and Fuel CostDiscountedElectricity Cost
DiscountedDiesel Cost
Tax
ER Hardware
Hybridization
Vehicle
Diesel Use
0
100
200
300
400
500
600
CV HEV EHEV(50kW) EHEV(100 kW)
Fuel
Con
sum
ptio
n (G
allo
ns)
Function Class 5Function Class 4Function Class 3Function Class 2NA, Speed > 0NA, Speed = 0
Fuel Consumption Over 62 Driving Profiles
Net Present Vehicle and Fuel Cost

14
Accomplishments: Examining Class 8 Truck Operating Behavior, and Potential E-HEV Impacts (long-haul tractor-trailer)
• High miles, operating costs and specific infrastructure usage
• Consider high-power FC1 E-HEV scenario o Leveraging long-haul hybridization enhancements o Results in major fuel and cost savings
* See https://www1.eere.energy.gov/vehiclesandfuels/pdfs/truck_efficiency_paper_v2.pdf
Initial Results Further refinement
ongoing
NA5%
Function Class177%
Function Class28%
Function Class36%
Function Class43%
Function Class51%
$$
$
0
50,000
100,000
150,000
200,000
250,000
$-
$100,000
$200,000
$300,000
$400,000
$500,000
$600,000
$700,000
$800,000
CV HEV EHEV on FC1
Life
tim
e D
iese
l Use
(gal
lons
)
Present Vehicle and Fuel Cost DiscountedElectricity CostDiscountedDiesel CostTax
ER Hardware
Hybridization
Vehicle
LifetimePetroleum Use
From DOE Report on Class 8 Truck R&D*
Net Present Vehicle and Fuel Cost
Potential margin each vehicle could
contribute to infrastructure cost (and still pay back)

15
Collaboration and Coordination
• Industry o OEMs and WPT developers such as
Volvo, Qualcomm, WAVE, OLEV, etc.
• ORNL
• DOT Clean Transportation Sector Initiative o Supporting analysis by NREL’s
Electric Vehicle Grid Integration team—exploring incremental generation costs, reduced renewable energy curtailment, etc.
WPT Technology Costs; Feedback on Analysis Tools and Assumptions; Information from
Standards Development
Comparing Market Adoption Estimates; Contributed Line-
Haul Truck Data into Fleet DNA
Road/Grid Infrastructure Impacts and Costs
Additional collaboration with DOE VTO Analysis Program on ADOPT OEM = original equipment manufacturer

16
Responses to Previous Year Reviewers’ Comments Comments Responses
“…expand on stakeholders to include U.S. DOT efforts on electrified roadways”; “…take into account the changes in the future brought about with the DOE SuperTruck program with the development of hybridization for long haul, over-the-road trucks.”
These have been done and are explicitly included in the presentation.
“…should check impact of EVs on GHG, or state assumption that EV energy source is 100% renewable.”
Default assumption is average grid mix; will be clarified when presenting GHG results.
“…important project …builds on the substantial database that NREL has available, which makes them uniquely positioned to do this work.”; “…all topical aspects appear to be covered: consumer preference modeling, dynamometer test data, Class 8 truck duty cycles, and passenger car GPS profiles.”
Retain these elements for the work completed since the last review period.
GHG = greenhouse gas (emissions)

17
Remaining Challenges and Barriers
• Need to complete partner and internal review on initial results o Refine as needed o Address gaps from still-to-be-completed scenario analyses
• Need to consider potential transition paths from zero infrastructure to one of the favorable scenarios o Where to build first?
• Having answers prepared for stakeholders who would make future implementation decisions o What would the expected total implementation costs be? o How would these compare to the potential benefits? o How might the analysis change when applied to a specific location
under consideration?

18
Proposed Future Work
• Refine analyses and evaluate additional scenarios o Including quasi-stationary (bus stop/truck loading dock WPT)
• Complete incremental roll-out analyses o Identify optimal initial locations to maximize benefits o Use in-motion WPT to enable MD/HD HEV engine downsizing?
– E.g., installing in high power demand hill climb locations
• Conduct rigorous cost/benefit analysis across scenarios o Collaborating with partners on road/grid infrastructure costs
• Perform case study with interested municipality or other partner o Apply information learned from scenario analyses to assess the
viability of specific early pilot locations

19
Summary
• Analysis project looking beyond stationary WPT o Considering long-term potential for quasi-stationary and in-motion WPT to
increase electrified vehicle viability and aggregate fuel savings • Integrating multiple techniques and scenario dimensions
o Real-world travel data o Test data and partner inputs o Powertrain modeling o Market adoption estimates
• Initial results show potential long-term in-motion WPT considerations o Large utilization from small fraction of infrastructure o Large individual and aggregate fuel displacement under certain scenarios
• Many factors influence results, will be further explored o Market conditions, evolution of the baseline fleet in response to CAFE o Optimal roll-out (e.g., from 0%–1% infrastructure coverage) for WPT? o Complete analyses of quasi-stationary/lower-speed scenarios
o WPT type and penetration level o Powertrains from CV & HEV to BEV o Vocations (LD, MD & HD) o Vehicle and infrastructure impacts

Technical Back-Up Slides
(Note: please include this “separator” slide if you are including back-up technical slides (maximum of five). These back-up technical slides will be available for your presentation and will be included in the DVD and Web PDF files released to the public.)

21
Integrated Electric Roadway Powertrain Modeling
• Added electric roadway to FASTSim
• Power availability/level is designated by road class
• Benefits: FASTSim captures
o Real world driving o Component power limits o Regenerative braking o Charging by roadway type o Fuel cost o Vehicle cost o Acceleration o Battery life
Roadway Power
Roadway Power
SOC = state of charge

22
Assumptions for Draft Class 8 Truck Cost vs. Benefit Analysis
Inputs Straight-Truck Assumption
Tractor-Trailer Assumption
Vehicle life (years) 19 19 Beginning of life annual miles 30,000 120,000
End of life annual miles travelled 7,000 30,000
Conventional vehicle cost $70,000 $110,000
Hybridizing cost increment $42,900 $61,450
Additional E-HEV cost increment $10,000 $10,000
Diesel cost $3.98/gal $3.98/gal
Electricity cost $0.12/kWh $0.12/kWh Discount rate 4.2% 4.2% Sales tax 7.8% 7.8%

23
Additional Details on the Transportation Secure Data Center (TSDC)
• Secure Archival of and Access to Detailed Transportation Data • Travel studies increasingly use GPS valuable data • TSDC safeguards anonymity while increasing research returns
• Validation, Analysis, and Reporting Functions • Advisory group supports procedure development and oversight • Original data are securely stored and backed up • Processing assures quality and creates downloadable data • Cleansed data are made freely available for download • Secure portal provides access to detailed spatial data
Sponsored by the U.S. DOT Federal Highway Administration and the U.S. DOE Vehicle Technologies Office Operated by the NREL Transportation and Hydrogen Systems Center (THSC) Contact: [email protected] www.nrel.gov/tsdc

24
Additional Details on the Fleet DNA Project
Captures and quantifies drive cycle and technology variation for the multitude of medium and heavy duty vocations For Government: Supplies information for drive cycle development, R&D programs, and rule making For OEMs: Provides better understanding of customer use profiles For Fleets: Explains how to maximize return on vehicle technology investments For Funding Agencies: Reveals ways to optimize impact of financial incentive offers For Researchers: Provides a data source for modeling and simulation Participants/Partners: • OEMs, fleets, national labs, federal and state
agencies o Examples: Paccar, Smith, ORNL, DOT,
California Energy Commission, South Coast Air Quality Management District
Each vocation in Fleet DNA has data products showing relevant use information

25
Additional Details on the Automotive Deployment Options Projection Tool (ADOPT) • Consumer preferences change based on income
• Income levels change over time, and number of sales vary by income
• Competes advanced vehicles with entire existing fleet • Successful models are duplicated (more options for the consumer) • Extensive validation
o Multiple years o 10 different regions o 10 dimensions
Relative importance by income bin

Reviewer-Only Slides
(Note: please include this “separator” slide between those to be presented and the “Reviewer-Only” slides. These slides will be removed from the presentation file and the DVD and Web PDF files.)

27
Related Publications and Presentations
Publications • Gonder, J., Brooker, A., Wang, L., and Burton, E., “Report on Cost/Benefit Analysis for Roadway
Electrification with Commercial Trucks,” DOE Vehicle Technologies Office, Vehicle Systems Simulation and Testing Milestone, September 2013.
• Brooker, A., “Analytical Modeling Linking the FASTSim and ADOPT Software Tools,” DOE Vehicle Technologies Office, Analysis Milestone, September 2013.
• Brooker, A., Wood, E., Burton, E., Gonder, J., Wang, L., Simpson, M., and Markel, T., “Dynamic Wireless Power Transfer Impact Assessment—Draft Analysis Findings,” DOE Vehicle Technologies Office, Vehicle Systems Simulation and Testing Deliverable, May 2013.
• Brooker, A., Thornton, M., and Rugh, J., “Technology Improvement Pathways to Cost-Effective Vehicle Electrification,” Proceedings of the 2010 SAE World Congress, Paper #2010-01-0824, April 2010.
Presentations • Markel, T., et al, “Electrified Roadways: A Pathway to a Clean Transportation Sector,”
presentation at DOT Workshop on the Clean Transportation Sector Initiative, February 2014, Washington, DC.
• Gonder, J., Brooker, A., Burton, E., and Markel, T., “Analysis of In-Motion Power Transfer for Multiple Vehicle Applications,” DOE Vehicle Technologies Annual Merit Review, May 2013, Washington, DC.
• Brooker, A., “Vehicle Choice Model ADOPT,” presentation at EIA DOE Vehicle Choice and Markets Technical Workshop, January 2013, Detroit, MI.

28
Critical Assumptions and Issues (1 of 2)
Critical Assumption/Issue Proposed Solution
Accuracy of premise that dynamic WPT can complement vehicle electrification technologies to increase overall petroleum displacement and GHG emissions reduction.
Apply cost vs. benefit and consumer preference modeling to propagate individual vehicle comparisons out to aggregate market predictions.
Potentially prohibitive cost of electric roadway infrastructure.
Collect device and installation costs from multiple technology developers. Confirm that costs are within the range of other road construction projects. Based on traffic throughput data and vehicle modeling results, quantify the additional fee above electricity cost required to pay for the infrastructure over its usable life.
29
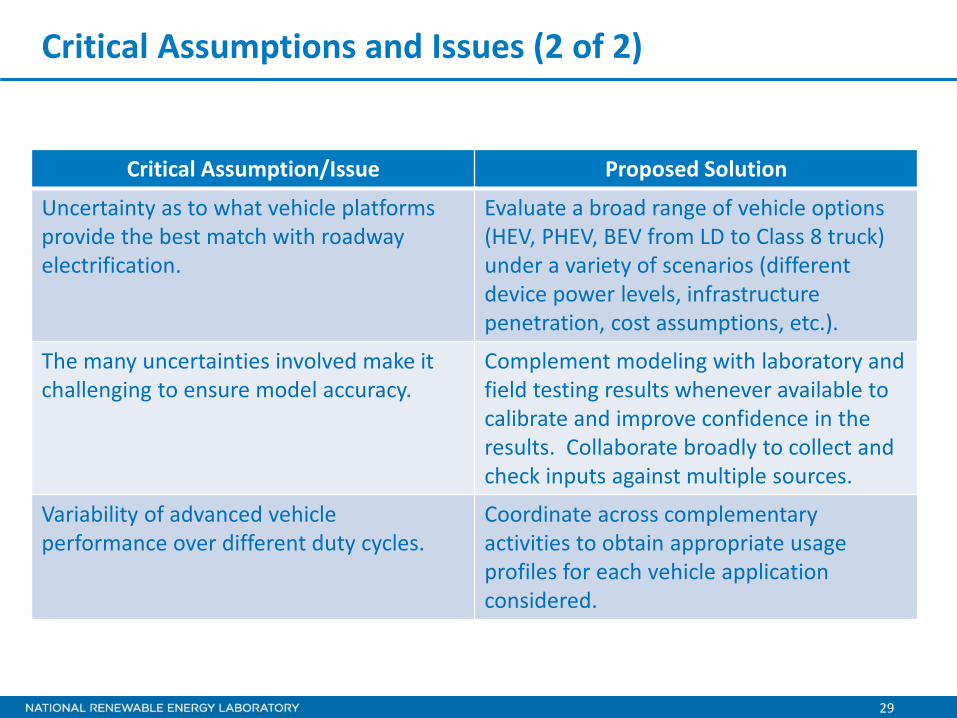
Critical Assumptions and Issues (2 of 2)
Critical Assumption/Issue Proposed Solution
Uncertainty as to what vehicle platforms provide the best match with roadway electrification.
Evaluate a broad range of vehicle options (HEV, PHEV, BEV from LD to Class 8 truck) under a variety of scenarios (different device power levels, infrastructure penetration, cost assumptions, etc.).
The many uncertainties involved make it challenging to ensure model accuracy.
Complement modeling with laboratory and field testing results whenever available to calibrate and improve confidence in the results. Collaborate broadly to collect and check inputs against multiple sources.
Variability of advanced vehicle performance over different duty cycles.
Coordinate across complementary activities to obtain appropriate usage profiles for each vehicle application considered.