advanced qa/qc for wastewater laboratory testing · essential elements of qa plan zschematic...
TRANSCRIPT

George BowmanInorganics Supervisor
State Laboratory of Hygiene
Rick MealyRegional Certification Coordinator
DNR-Laboratory Certification
spon
sore
d by
:
Advanced QA/QC forWastewater Laboratory Testing
Any reference to product or company names does not constitute endorsement by
the Wisconsin State Laboratory of Hygiene, the University of Wisconsin, or
the Department of Natural Resources.
Disclaimer
• QA Manual Kit
• Dealing With Unacceptable LODs
• Spike Calculation Secrets
• Control Limit Tips
• Taking the Correct Corrective Action
• “There’s Something You Should Know About This Data”
• Documenting Your Documentation
Overview
You often don’t notice it…but it’s constantly at the root of daily news stories….…we can see it in the movies or……subtley make reference to it in coversation
From the movie Armageddon, listen as Steve Buscemi’scharacter makes a witty reference to QC (or lack thereof):
Quality Control is all around us

Essential Elements of QA Plan
Schematic DiagramSampling Plan (Permit & Process Control)Sample Handling, PreservationAnalytical Methods
General Lab Quality Control ChecksQuality Control Sample Frequency & CriteriaCorrective Action Plan
Preventive Maintenance PlanData Reporting RequirementsList of SOPs
The #1 QA Manual “DON’T”
This is NOT yourQA planIt’s a tool to help you develop your own QA Plan
ACME Wastewater Treatment Facility
ACME Wastewater Treatment Facility

12 101114
15
13
Plant 1
Plant 2
Grit Chamber
Grit Chamber
Wet Well
FeCl3polyelectrol
addition
Ter tiaryFilt ers
FeCl3polyelectroly
addition
Ferrouschloridadditio
Chlorineaddition
comminutors
36”Interceptorsewer
OU
TFA
LL
Cl2 contactchamber
Cl2 contactchamber
Post
Aer
atio
nTa
nk
12 101114
15
13
Plant 1
Plant 2
Grit Chamber
Grit Chamber
Wet Well
Ter tiaryFilt ers
FeCl3polyelectroly
addition
Ferrouschloridadditio
Chlorineaddition
36”Interceptorsewer
OU
TFA
LL
Cl2 contactchamber
Cl2 contactchamber
Post
Aer
atio
nTa
nk
De-WateringSupernatant
DecantZone
AerobicDigestor
FinalClarifier
AerobicDigestor Final
Clarifier
DecantZone
Efflu
ent C
hann
el
Aer
atio
n B
asin
Aer
atio
n B
asin
Influ
entC
hann
elIn
fluen
tCha
nnel
Efflu
ent C
hann
el
Sample Location and Analyses performed1. Influent: Flow, BOD, TSS2. Effluent: BOD, TSS, NH3-N, T. Phos., pH, DO, Cl2 res., Fecal3. Effluent: Flow4 & 5. Aeration Mixed Liquor: Settleability, TSS, VSS, DO6 & 7. Digestor: Settleability, TSS, VSS, % Solids8 & 9. Clarifier: TSS, Sludge blanket10 & 11. TSS12. Sludge Cake: % Solids13: Digestor: % Solids14.. Dewatering Supernatant: BOD, TSS, NH3-N,15. Backwash: BOD, TSS
Flow Schematic of __________________ WWTPBeverly Hills 90210
Page
1
Sampling Plan: Permit MonitoringPERMIT LIMITS
SAMPLE LOCATION SAMPLE TYPE
SAMPLE POINT (Schematic Reference)
PARAMETERS TESTED
MONITORING FREQUENCY
Daily Minimum
Daily Maximum
Weekly Average (mg/L)
Monthly Average (mg/L)
Influent Continuous
Influent 24-hr composite flow proportionaltime proportional
Influent Grab
Effluent Continuous
Effluent 24-hr composite flow proportional time proportional
Effluent Grab
Flow Totalized 1 Daily
XX 2 BOD 3X weekly --- --- 45 30TSS 3X weekly --- --- 45 30
(May-October) Ammonia 3X weekly --- --- 3.0 ---Total Phosphorus 3X weekly --- --- --- 1.0Acute Toxicity 3X year Chronic Toxicity 3X year
Page
2
XX 1 BOD 3X weekly there should be no limitsTSS 3X weekly here
Flow Totalized 2 Daily
pH Daily 6.0 su 9.0su --- ---May-September 2 Chlorine Residual Daily 38 ug/L --- --- ---May-September Fecal Coliforms weekly --- --- --- 400/100mL
Outfall 001
Outfall 001
Outfall 001
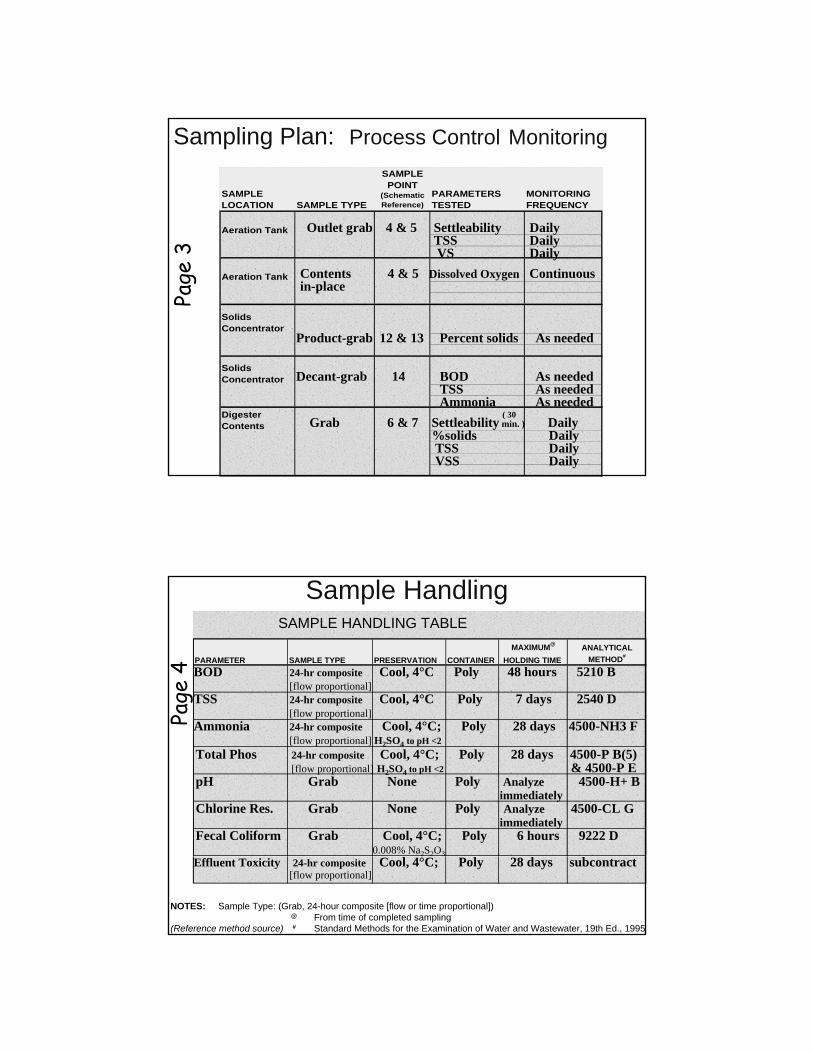
Sampling Plan: Process Control Monitoring
SAMPLE LOCATION SAMPLE TYPE
SAMPLE POINT
(Schematic Reference)
PARAMETERS TESTED
MONITORING FREQUENCY
Aeration Tank
Aeration Tank
Solids Concentrator
Solids Concentrator
Digester Contents
Page
3
Outlet grab 4 & 5 Settleability DailyTSS DailyVS Daily
Contents 4 & 5 Dissolved Oxygen Continuousin-place
( 30Grab 6 & 7 Settleability min. ) Daily
%solids DailyTSS DailyVSS Daily
Product-grab 12 & 13 Percent solids As needed
Decant-grab 14 BOD As neededTSS As neededAmmonia As needed
Sample HandlingSAMPLE HANDLING TABLE
MAXIMUM@ ANALYTICALPARAMETER SAMPLE TYPE PRESERVATION CONTAINER HOLDING TIME METHOD#
Page
4
NOTES: Sample Type: (Grab, 24-hour composite [flow or time proportional])@ From time of completed sampling
(Reference method source) # Standard Methods for the Examination of Water and Wastewater, 19th Ed., 1995
BOD 24-hr composite Cool, 4°C Poly 48 hours 5210 B [flow proportional]
TSS 24-hr composite Cool, 4°C Poly 7 days 2540 D [flow proportional]
Ammonia 24-hr composite Cool, 4°C; Poly 28 days 4500-NH3 F [flow proportional] H2SO4 to pH <2
Total Phos 24-hr composite Cool, 4°C; Poly 28 days 4500-P B(5)[flow proportional] H2SO4 to pH <2 & 4500-P E
pH Grab None Poly Analyze 4500-H+ B immediately
Chlorine Res. Grab None Poly Analyze 4500-CL G immediately
Fecal Coliform Grab Cool, 4°C; Poly 6 hours 9222 D0.008% Na2S2O3
Effluent Toxicity 24-hr composite Cool, 4°C; Poly 28 days subcontract[flow proportional]
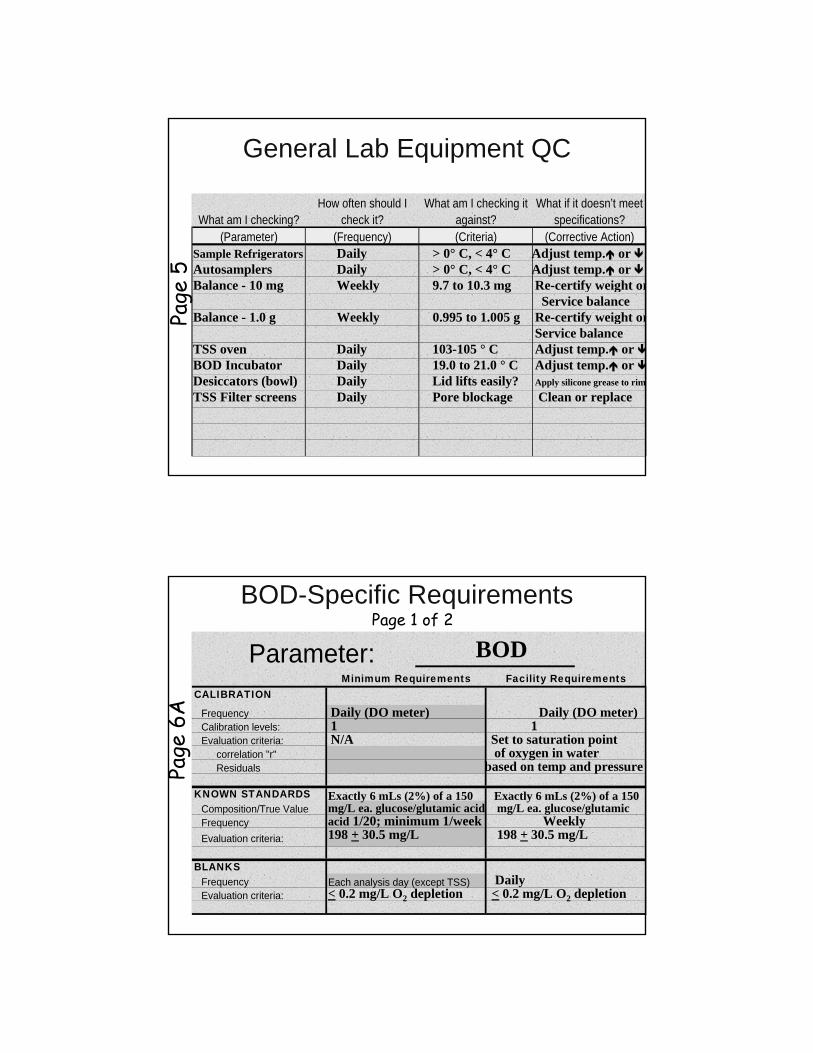
General Lab Equipment QC
What am I checking? How often should I
check it? What am I checking it
against? What if it doesn’t meet
specifications? (Parameter) (Frequency) (Criteria) (Corrective Action)
Page
5
Sample Refrigerators Daily > 0° C, < 4° C Adjust temp. or Autosamplers Daily > 0° C, < 4° C Adjust temp. or Balance - 10 mg Weekly 9.7 to 10.3 mg Re-certify weight or
Service balanceBalance - 1.0 g Weekly 0.995 to 1.005 g Re-certify weight or
Service balanceTSS oven Daily 103-105 ° C Adjust temp. or BOD Incubator Daily 19.0 to 21.0 ° C Adjust temp. or Desiccators (bowl) Daily Lid lifts easily? Apply silicone grease to rim
TSS Filter screens Daily Pore blockage Clean or replace
BOD-Specific Requirements
Page
6A
Parameter:CALIBRATION
FrequencyCalibration levels: Evaluation criteria:
correlation "r"Residuals
KNOWN STANDARDSComposition/True ValueFrequencyEvaluation criteria:
BLANKSFrequency Each analysis day (except TSS)Evaluation criteria:
Minimum Requirements Facility Requirements
BOD
Daily (DO meter) Daily (DO meter)1 1N/A Set to saturation point
of oxygen in waterbased on temp and pressure
Exactly 6 mLs (2%) of a 150 Exactly 6 mLs (2%) of a 150 mg/L ea. glucose/glutamic acid mg/L ea. glucose/glutamic acid 1/20; minimum 1/week Weekly198 + 30.5 mg/L 198 + 30.5 mg/L
Daily< 0.2 mg/L O2 depletion < 0.2 mg/L O2 depletion
Page 1 of 2

BOD Requirements
Page
6B
REPLICATESFrequency 1 per 20 samples per matrix
Influent 1 per 20 samplesEffluent 1 per 20 samples
Evaluation criteria:Influent Range or RPD? Range or RPD?Effluent Range or RPD? Range or RPD?
SPIKESPrepared by:
Adding mLsof a ug/mL standardto mLs of sampleFinal volume= mLs
Frequency 1 per 20 samples per matrixInfluent 1 per 20 samplesEffluent 1 per 20 samples
Evaluation criteria:InfluentEffluent
OTHER SPECIFICS
Preparation of spikes should not dilute the sample matrix by more than 10%. Generally, use the same volume of sample in both the spiked and unspiked samples.
Not Required
Every other week (26/yr) Every other week (26/yr)
14.5% xxxxx0.75 mg/L xxxxxx
Sample depletion > 2 mg/L residual DO > 1 > 2 mg/L residual DO > 1Sample pH 6.5 to 7.5 6.5 - 7.5Residual chlorine Quench if detected Quench if detected# of dilutions At least 2 At least 3 per sampleSupersaturation Sample DO < saturationSeed Controls Must treat exactly as samples
Page 2 of 2
Corrective ActionParameter:
CALIBRATION
Evaluation criteria:correlation "r"Residuals
Corrective Action
KNOWN STANDARDSEvaluation criteria:
Corrective Action
BLANKSEvaluation criteria:
Corrective Action
Minimum Requirements Facility Requirements
(DO meter) Set to saturation point ofN/A oxygen in waterN/AN/A
198 + 30.5 mg/L 198 + 30.5 mg/L
< 0.2 mg/L O2 depletion < 0.2 mg/L O2 depletion
Re-calibrate if blank DOI > saturation point If sample DOI > sat. point, bring to room temp & shake
GGA < 167.5: Weak seed (add more)or bad GGA (replace)GGA > 228.5: Contamination. Identify source and correct
Clean all tubing & glassware
If blanks gain oxygen: Suspect calibration problemIf depletion > 0.2 mg/L Check for contamination. Clean
tubing and still. Obtain new water source.
BOD
Page 7B
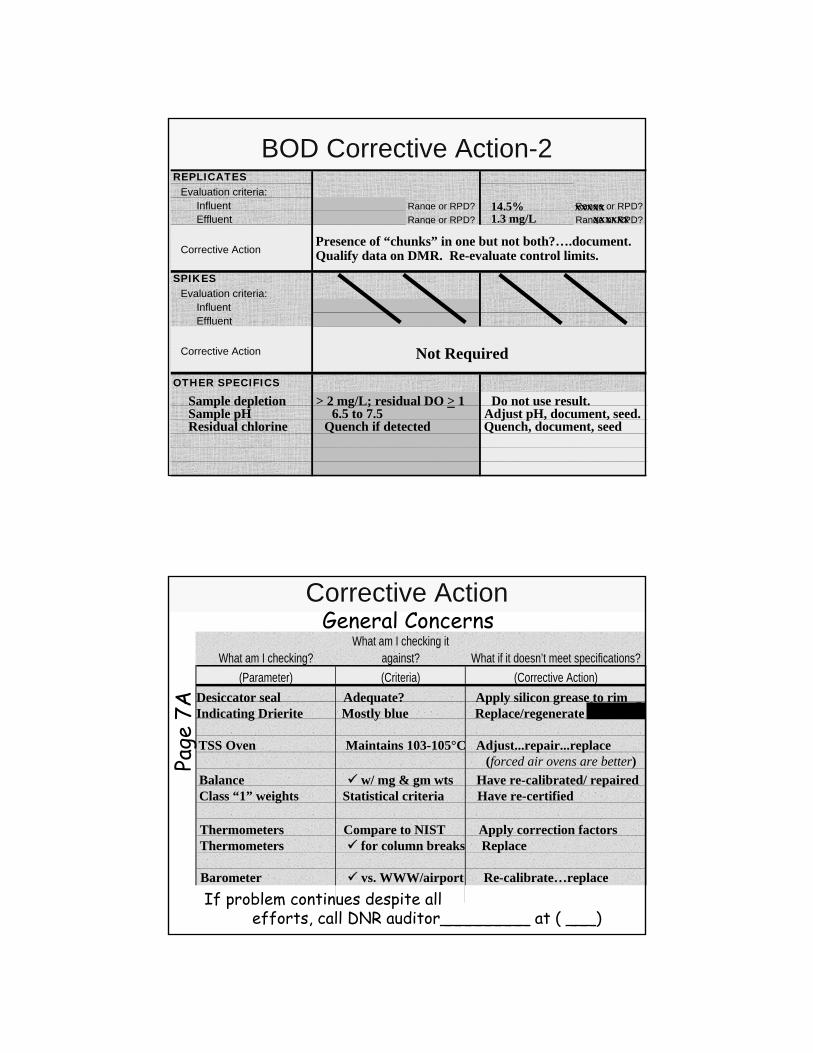
BOD Corrective Action-2REPLICATES
Evaluation criteria:Influent Range or RPD? Range or RPD?Effluent Range or RPD? Range or RPD?
Corrective Action
SPIKESEvaluation criteria:
InfluentEffluent
Corrective Action
OTHER SPECIFICS
Not Required
Sample depletion > 2 mg/L; residual DO > 1 Do not use result.Sample pH 6.5 to 7.5 Adjust pH, document, seed.Residual chlorine Quench if detected Quench, document, seed
14.5% xxxxx1.3 mg/L xxxxxx
Presence of “chunks” in one but not both?….document.Qualify data on DMR. Re-evaluate control limits.
Corrective Action
What am I checking? What am I checking it
against? What if it doesn’t meet specifications? (Parameter) (Criteria) (Corrective Action)
Page
7A Desiccator seal Adequate? Apply silicon grease to rim
Indicating Drierite Mostly blue Replace/regenerate
General Concerns
Balance w/ mg & gm wts Have re-calibrated/ repairedClass “1” weights Statistical criteria Have re-certified
TSS Oven Maintains 103-105°C Adjust...repair...replace(forced air ovens are better)
Thermometers Compare to NIST Apply correction factorsThermometers for column breaks Replace
Barometer vs. WWW/airport Re-calibrate…replace
If problem continues despite all efforts, call DNR auditor_________ at ( ___)

Preventive Maintenance PlanEach instrument must have a maintenance “history” (record)
pre·ven·tive also pre·ven·ta·tive adj.Intended or used to prevent or hinder; acting as an obstacle.Preventing or slowing the course of an illness or disease; prophylactic.
• Clean or replace sample tubing at regular intervals• Change DO membranes at a specific frequency• Clean/replace all tubing used in BOD testing regularly• Regularly scheduled balance maintenance• Routine verification of thermometer accuracy• Replace NH3 probe membranes at a specific frequency• Spectrophotometer: Regularly check λ accuracy
a dilute KMnO4 solution should have peaks at 526 and 546 nm
Preventive Maintenance Chart
Preventive Maintenance ProceduresWhat am I checking? What action am I taking? How often should I do it?
(Equipment/Part) (Action) (Frequency)
Corrective Action: Taken to fix a problemPreventive Maintenance: Taken to prevent Corrective Action
Sampler tubing Clean with dilute bleach Every 2 weeksSampler tubing Replace Every 6 monthsDO membrane Change Every 3 weeksElectrode filling solution Replace Every week
Page 8
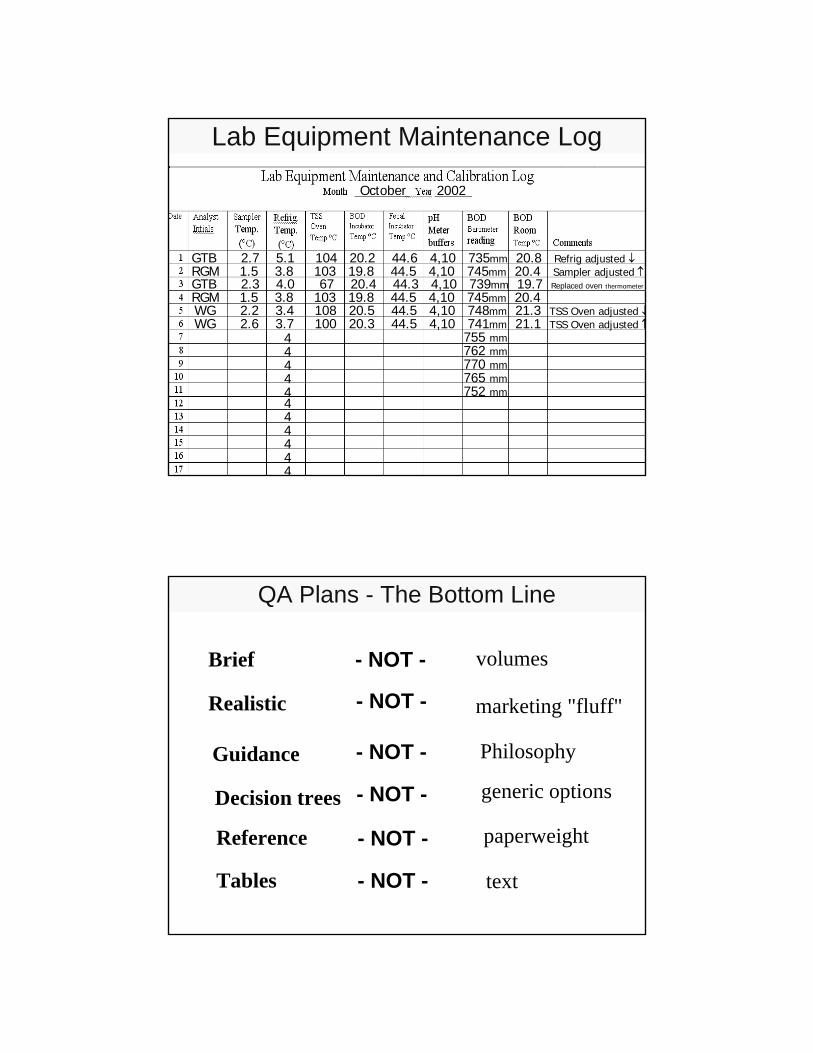
Lab Equipment Maintenance Log
GTB 2.7 5.1 104 20.2 44.6 4,10 735mm 20.8 Refrig adjusted ↓RGM 1.5 3.8 103 19.8 44.5 4,10 745mm 20.4 Sampler adjusted ↑
WG 2.2 3.4 108 20.5 44.5 4,10 748mm 21.3 TSS Oven adjusted ↓
October 2002
44444444444
WG 2.6 3.7 100 20.3 44.5 4,10 741mm 21.1 TSS Oven adjusted ↑
GTB 2.3 4.0 67 20.4 44.3 4,10 739mm 19.7 Replaced oven thermometer
RGM 1.5 3.8 103 19.8 44.5 4,10 745mm 20.4
755 mm762 mm770 mm765 mm752 mm
Realistic
QA Plans - The Bottom Line
- NOT - volumesBrief
Tables
Reference
Decision trees
Guidance
marketing "fluff"
Philosophy
generic options
paperweight
text
- NOT -
- NOT -
- NOT -
- NOT -
- NOT -
Detection Limits
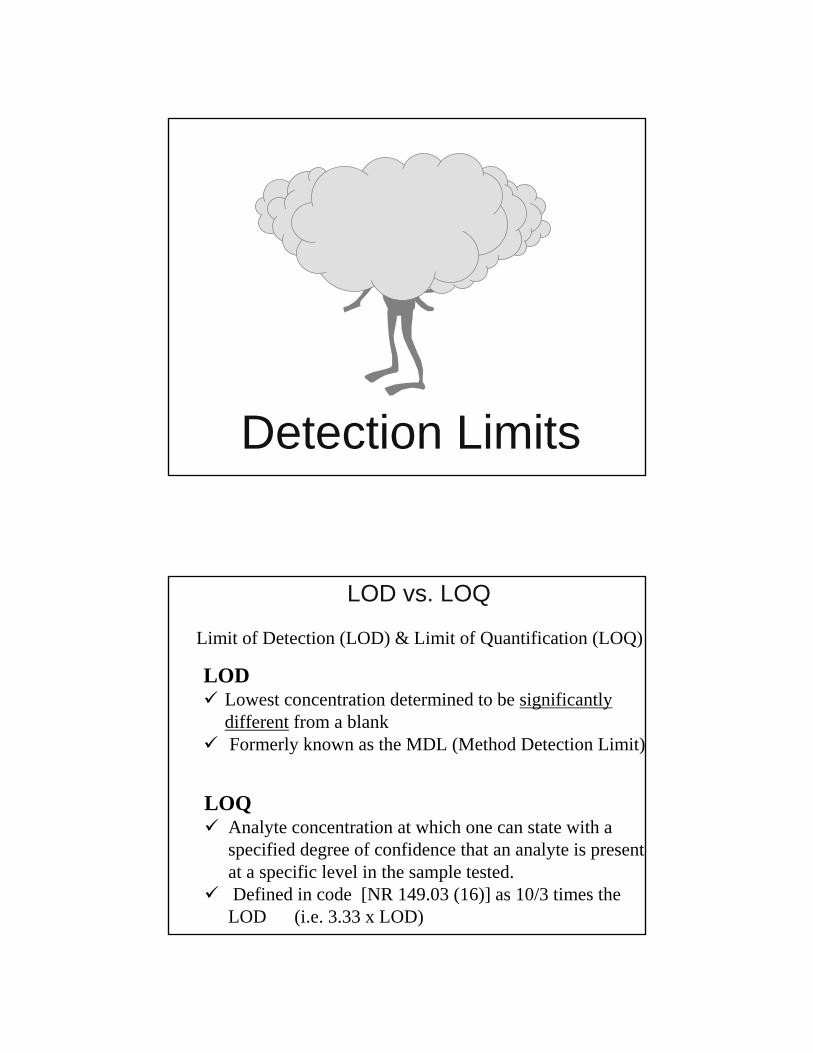
LODLowest concentration determined to be significantly different from a blankFormerly known as the MDL (Method Detection Limit)
Limit of Detection (LOD) & Limit of Quantification (LOQ)
LOQ Analyte concentration at which one can state with a specified degree of confidence that an analyte is present at a specific level in the sample tested.Defined in code [NR 149.03 (16)] as 10/3 times the LOD (i.e. 3.33 x LOD)
LOD vs. LOQ

Where does the “10/3” come from?Early MDL theory was based on replicate
measurements (10) of a blank
0
# of standard deviations [SD] (of 10 measurements)
3X the SD was deemed to be the MDL or LOD
10X the SD deemed to
be the LOQ
103
LOQLOD
=
The t-value for 7 replicates = 3.143The t-value for 8 replicates = 2.998 (or 3)
Close enough for gov’t work?
(these first 3 are mandatory checks)Spiked at 0.1LOD= 0.036
1. Is LOD greater than 10% of the spike level? yes
Spiked at 0.1, so LOD should be > 0.01If LOD < 10% of spike level, re-do at lower spike level
2. Is the spike level greater than the LOD? yes
Common sense: if LOD > spike level, couldn’t detect it
3. Is the LOD below any relevant permit limit? N/A
(if there is one) Permit limit =
LOD Evaluation: The 5-point check
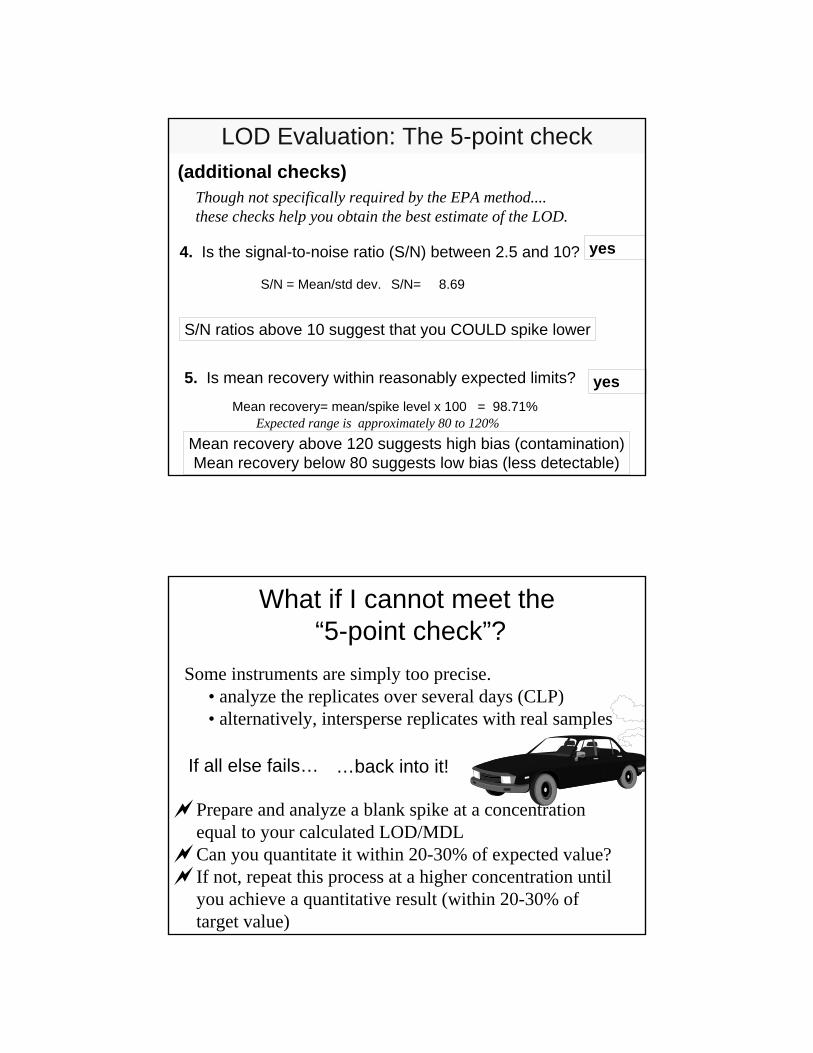
(additional checks)Though not specifically required by the EPA method....these checks help you obtain the best estimate of the LOD.
4. Is the signal-to-noise ratio (S/N) between 2.5 and 10? yes
S/N = Mean/std dev. S/N= 8.69
5. Is mean recovery within reasonably expected limits? yesMean recovery= mean/spike level x 100 = 98.71%
Expected range is approximately 80 to 120%
LOD Evaluation: The 5-point check
S/N ratios above 10 suggest that you COULD spike lower
Mean recovery above 120 suggests high bias (contamination)Mean recovery below 80 suggests low bias (less detectable)
What if I cannot meet the“5-point check”?
Some instruments are simply too precise.• analyze the replicates over several days (CLP)• alternatively, intersperse replicates with real samples
If all else fails… …back into it!
Prepare and analyze a blank spike at a concentration equal to your calculated LOD/MDLCan you quantitate it within 20-30% of expected value?If not, repeat this process at a higher concentration until you achieve a quantitative result (within 20-30% of target value)
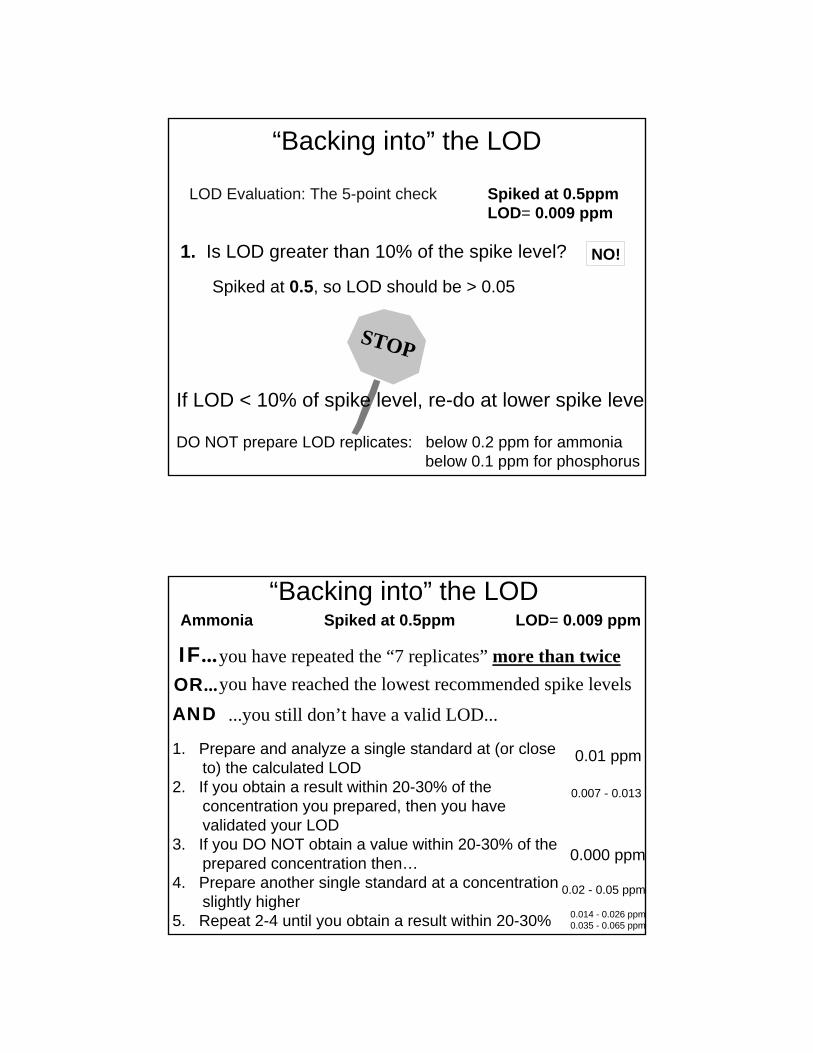
“Backing into” the LOD
Spiked at 0.5ppmLOD= 0.009 ppm
1. Is LOD greater than 10% of the spike level?
Spiked at 0.5, so LOD should be > 0.05
LOD Evaluation: The 5-point check
NO!
DO NOT prepare LOD replicates: below 0.2 ppm for ammoniabelow 0.1 ppm for phosphorus
STOP
If LOD < 10% of spike level, re-do at lower spike level
“Backing into” the LODAmmonia Spiked at 0.5ppm LOD= 0.009 ppm
you have reached the lowest recommended spike levelsIF...OR...AND
you have repeated the “7 replicates” more than twice
...you still don’t have a valid LOD...
1. Prepare and analyze a single standard at (or close to) the calculated LOD
2. If you obtain a result within 20-30% of the concentration you prepared, then you have validated your LOD
3. If you DO NOT obtain a value within 20-30% of the prepared concentration then…
4. Prepare another single standard at a concentration slightly higher
5. Repeat 2-4 until you obtain a result within 20-30%
0.01 ppm
0.000 ppm
0.007 - 0.013
0.02 - 0.05 ppm
0.014 - 0.026 ppm0.035 - 0.065 ppm

Spike Calculations
SPIKE - SAMPLE x 100SPIKE AMOUNT
Forget What You Know…it’s just not as simple as
(although it can be…in some circumstances)
SPIKE - SAMPLE x 100SPIKE AMOUNT
( )Corrected for dilution
( )Corrected for dilution
The correct equation...implied, but never said, is:

• Calculating by concentration and• not accounting for dilution of the sample, • not accounting for dilution of the spike solution, • or both.
Common Spike Calculation Errors
• Calculating a ratio rather than a recovery.
• Using an incorrect formula.• The only acceptable formula is• Spiked Sample - Unspiked sample
Spike Amount
Theremembering that you are dealing with MASS (weight) rather than CONCENTRATION.
50
40
30
20
10
50
40
30
20
10
to understanding spike calculations is
With spikes, you are adding a known MASS of analyte.
Rather than dealing with the problems of adding solid material directly, you dissolve a specific salt in reagent water.
The volume of reagent water is merely a vehicle for delivery of the analyte
Mass vs. concentration

1 mL x1 g
1 L 1000 mL
1 g x1000 mg
ppm = parts per million = 1 part
1,000,000 parts
ppm = mg/L = milligrams per Liter =1 mg ⌧L
ppm = ug/mL = micrograms per milliliter =1 mg x1000 ug
1 mL 1 g
1 g x1000 mg
1 ug xmL
Concentration Terms
=
=
= 1 part 1000 X 1000 parts
Joe analyzes a sample for ammonia.He takes 50 mLs of sample, adds his buffer solutionAfter stabilizing, the meter reads 5.0 mg/L.The concentration value, 5.0 mg/L, means that in a liter of water, you would find 5.0 mg of ammonia dissolved in it.
But Joe only analyzed 50 mLs of sample; how many mgs of ammonia were in that 50 mLs?
5.0 mg is the same as 5.0 ugL mL
Concentration volume = mass
1 mg = 0.25 mg1000 ug
Concentration basics
5.0 ugmL
50 mL = 250 ug

× Y mLsX ugmL
=XY ug
A concentration...
...times a volume
= a mass
Diluting to Known Volume
Sample45 mL
Spike 5 mL
50 mL
Dilute “to known volume”
• If you dilute spike (with sample) to a known volume.…(sample volume used in spike is LESS than that in the unspiked)sample concentration must be adjusted.
Since there is LESS sample-volume in the SPIKE than there is the SAMPLE, we cannot simply subtract the unspiked sample concentration
Furthermore, because we’ve added volume from the spike solution, we have actually DILUTED the sample concentration

Corrections: Dilution to Known VolumeYou cannot directly subtract background sample concentration when using the “Dilute to Known Volume” method.
In this case, rather than subtracting 2.0 ppmfrom the spiked sample,
Sample45 mL
Spike 5 mL
Sample50 mL
Measured to be 2.0 ppm
Measured to be 6.5 ppm
you must subtract only 45/50 x 2.0 [i.e.,1.8]to account for the fact that less sample (and thus less concentration) was in the spike
Sample50 mL
Spike 5 mL50 mL
Spiking “on top”
• If the spike is added “on top of” the sample(amount of sample used in spike is SAME as in the unspiked)the spike concentration must be adjusted.
Analysts are often “tricked” into thinking that 10 mLs of spike solution added to 100 mLs of sample represents a 10-fold dilution of the spiking solution.
The TRUE spike amount [concentration] is determined as the ratio of spike volume to TOTAL sample volume times the spike solution concentration.
“Adding on top”

Adding on top - differential effects
If there is no pre-treatment or sample volume reduction involved (e.g., digestion, distillation):
If there is a pre-treatment step or sample volume reduction involved (e.g., digestion, distillation):
TWO correction factors are required:• one for the dilution of sample concentration, and • another for dilution of spike concentration
No correction factor is required.Examples: Total phosphorus by hot plate, distilled ammonia
Spiked sample result – Unspiked sample resultSpike Amount
Remember: we are dealing with concentrations here.If the concentration of unspiked sample was 0.1 ug/mL, and 50 mLs of sample were used, then we know 5.0 ug (50 x 0.1) of ammonia came from the sample.
0.2 ppm – 0.1 ppm0.2 ppm
X 100 = 50% Right?0.0833 58.3
It measures 0.1 ppm [ug/mL] ammoniaI take another 50 mLs of sample and add 10 mLs of a 1.0 ppm [ug/mL] ammonia standard. I analyze this spike and I get 0.2 ppm [ug/mL]
I analyze 50 mLs of sample.
We also know that the total volume of the sample + spike was 60 mLs.Thus the concentration of the unspiked sample is now 5 ug = 0.0833 ppm
60 mLs
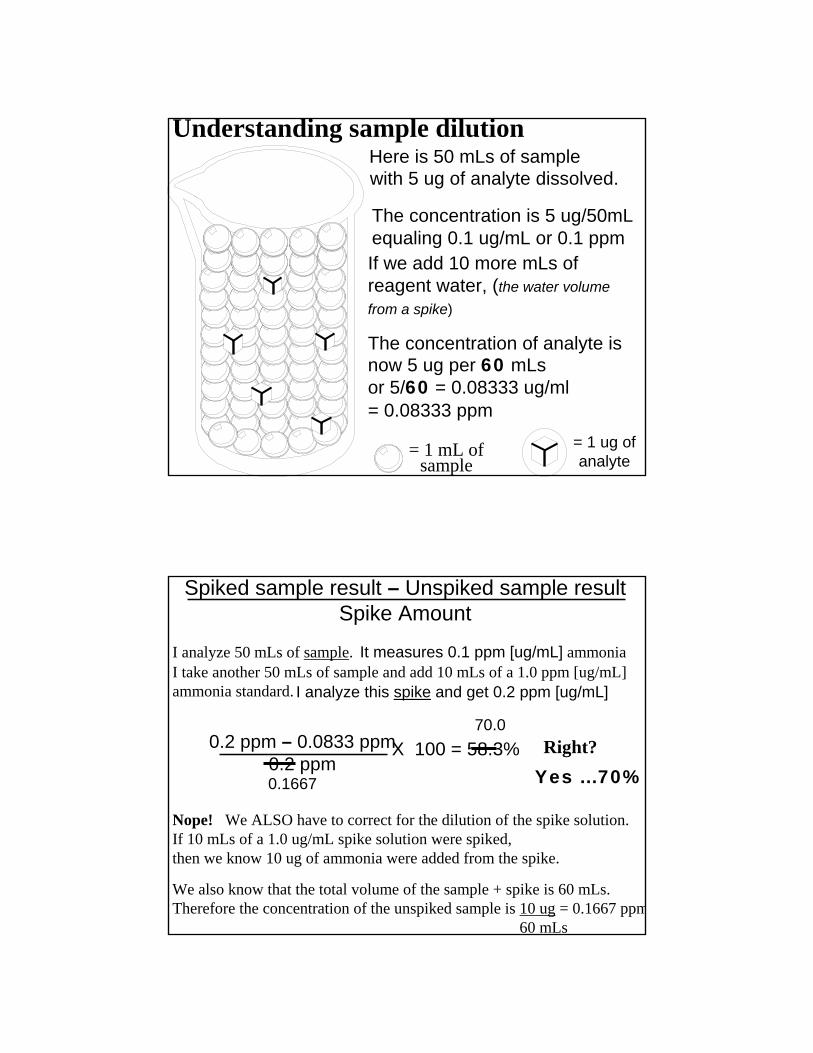
The concentration is 5 ug/50mLequaling 0.1 ug/mL or 0.1 ppm
= 1 mL of sample
= 1 ug of analyte
If we add 10 more mLs of reagent water, (the water volume from a spike)
with 5 ug of analyte dissolved.Here is 50 mLs of sample
The concentration of analyte is now 5 ug per 60 mLsor 5/60 = 0.08333 ug/ml= 0.08333 ppm
Understanding sample dilution
Spiked sample result – Unspiked sample resultSpike Amount
0.2 ppm – 0.0833 ppm0.2 ppm
X 100 = 58.3% Right?
It measures 0.1 ppm [ug/mL] ammoniaI take another 50 mLs of sample and add 10 mLs of a 1.0 ppm [ug/mL] ammonia standard. I analyze this spike and get 0.2 ppm [ug/mL]
I analyze 50 mLs of sample.
Nope! We ALSO have to correct for the dilution of the spike solution.If 10 mLs of a 1.0 ug/mL spike solution were spiked, then we know 10 ug of ammonia were added from the spike.
0.1667
70.0
We also know that the total volume of the sample + spike is 60 mLs.Therefore the concentration of the unspiked sample is 10 ug = 0.1667 ppm
60 mLs
Yes …70%
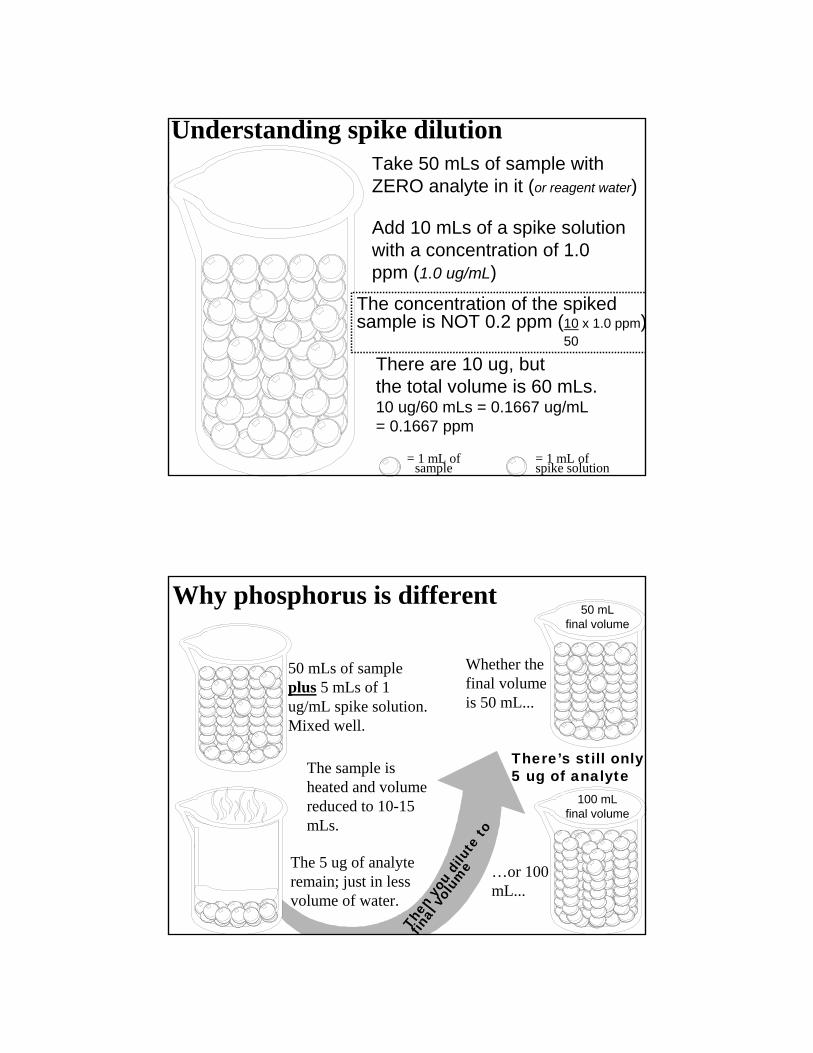
There are 10 ug, but the total volume is 60 mLs. 10 ug/60 mLs = 0.1667 ug/mL= 0.1667 ppm
= 1 mL of sample
= 1 mL of spike solution
Understanding spike dilution
Add 10 mLs of a spike solution with a concentration of 1.0 ppm (1.0 ug/mL)
Take 50 mLs of sample with ZERO analyte in it (or reagent water)
The concentration of the spiked sample is NOT 0.2 ppm (10 x 1.0 ppm)
50
1 ug
1 ug1 ug
1 ug
1 ug
1 ug
1 ug
1 ug1 ug
1 ug
1 ugTh
en y
ou d
ilute
to
final
vol
ume
Why phosphorus is different
50 mLs of sample plus 5 mLs of 1 ug/mL spike solution. Mixed well.
The sample is heated and volume reduced to 10-15 mLs.
The 5 ug of analyte remain; just in less volume of water.
There’s still only 5 ug of analyte
50 mL final volume
Whether the final volume is 50 mL...
100 mL final volume
…or 100 mL...
Spike volume 5 mLSpike Conc. 25 ug/mL
Unspiked sample 2.0 ug/mLUnspiked Sample Volume 50 mL
Spiked sample 4.25 ug/mLTotal volume 55 mL
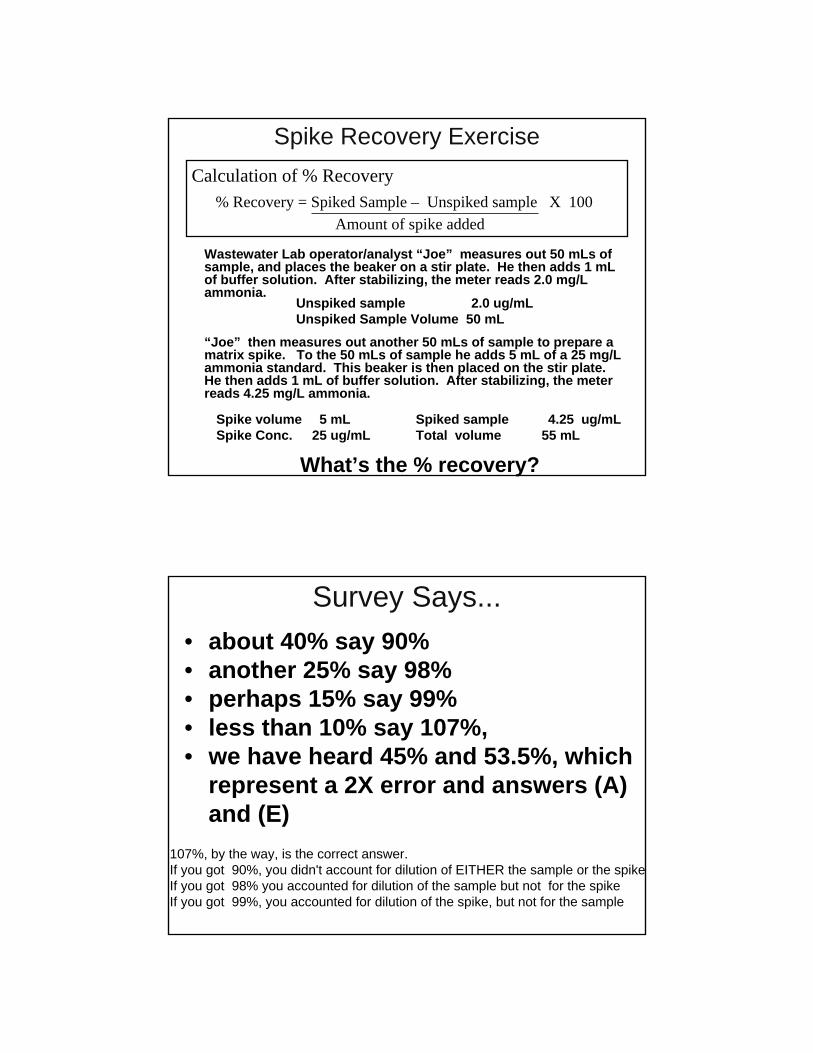
Calculation of % Recovery% Recovery = Spiked Sample – Unspiked sample X 100
Amount of spike added
Wastewater Lab operator/analyst “Joe” measures out 50 mLs of sample, and places the beaker on a stir plate. He then adds 1 mL of buffer solution. After stabilizing, the meter reads 2.0 mg/Lammonia.
“Joe” then measures out another 50 mLs of sample to prepare a matrix spike. To the 50 mLs of sample he adds 5 mL of a 25 mg/L ammonia standard. This beaker is then placed on the stir plate.He then adds 1 mL of buffer solution. After stabilizing, the meter reads 4.25 mg/L ammonia.
What’s the % recovery?
Spike Recovery Exercise
• about 40% say 90% • another 25% say 98%• perhaps 15% say 99%• less than 10% say 107%, • we have heard 45% and 53.5%, which
represent a 2X error and answers (A) and (E)
107%, by the way, is the correct answer.If you got 90%, you didn't account for dilution of EITHER the sample or the spikeIf you got 98% you accounted for dilution of the sample but not for the spikeIf you got 99%, you accounted for dilution of the spike, but not for the sample
Survey Says...

A. Correct the concentration in the unspiked sample = 1.82 2.0 ug/mL X (50/55) mL = 2.0 x 0.91
B. Correct the spike concentration = 2.2725 ug/mL X (5/55) mL = .091
C. Calculate recovered concentration = 2.43=(4.25 ug/mL - 1.82 ug/mL
% Recovery = 107.0%= (C / B) x 100 =(2.43 / 2.27) X 100
Spike volume 5 mLSpike Conc. 25 ug/mL
Unspiked sample 2.0 ug/mLUnspiked Sample Volume 50 mL
Spiked sample 4.25 ug/mLTotal volume 55 mL
Matrix Spikes: Ammonia example- adding “on top”
Conventional Calculation: “spike “on top”
A. Determine the contribution (ug) from the sample in the spike1. Subtract the mLs of the spike from the total mLs of sample + spike2. Multiply the answer from A.1 (above) by the sample concentration
B. Determine the # of ug (of analyte) spikedMultiply the concentration of the solution used to spike by the # mLs spiked
C. Determine the # of ug (of analyte) in the spiked sampleMultiply the spiked sample concentration by the # mLs of this sample
D. Determine the # of ug (of analyte) recoveredSubtract “A” from “C”
% Recovery = Divide “D” by “B” and multiply by 100
key relationship: mg/L = ppm =ug/mL
Calculating Recovery: A New Way

A. Contribution (ug) from the sample in the spike = 1002.0 ug/mL X (55 mL - 5 mL) = 2.0 X 50
B. The # of ug (of analyte) spiked = 12525 ug/mL X 5 mL
C. The # of ug (of analyte) in the spiked sample = 233.754.25 ug/mL X 55 mL
D. The # of ug (of analyte) recovered = 133.75= C - A = 233.75 - 100
% Recovery = 107.0%= D / B =(133.75 / 125) X 100
Spike volume 5 mLSpike Conc. 25 ug/mL
Unspiked sample 2.0 ug/mLUnspiked Sample Volume 50 mL
Spiked sample 4.25 ug/mLTotal volume 55 mL
NEW Calculation: “spike “on top”(use for any analysis that is similar)
% Recovery = ____%(______ / ______) X 100
D. The # of ug (of analyte) recovered = ___________ - ______
C. The # of ug (of analyte) in the spiked sample = __________ ug/mL X _____ mL
B. The # of ug (of analyte) spiked = ___________ ug/mL X ______ mL
Example: Phosphorus- hotplate
A. Contribution (ug) from the sample in the spike = ___________ ug/mL X (_____ mL - _____ mL) = ______ X ____
Spike volume 1 mLSpike Conc. 5 ug/mL
Unspiked sample .246 X 25 = 6.15ug/mLUnspiked sample Volume 2mL=>50 mL
Spiked sample .346x 25= 8.65 ug/mLTotal volume 2 mL + 1 mL =>50 mL

Control Limit Reminders
Matrix spike & RPD Control limits1. Test the data for and eliminate outliers before proceeding.
2. Calculate the mean and standard deviation of the data.
3. Warning limits = Mean + 2 standard deviations
4. Control limits = Mean + 3 standard deviationsNOTE: RPD is a 1-tailed test, so only Mean +
Range Control limits1. Test the data for and eliminate outliers before proceeding.
2. Calculate the mean of the data.
3. Warning limits = 2.51 x Mean
4. Control limits = 3.27 x Mean
Calculating Control Limits

NR 149.14 (3) (g)
For labs with• less than 20 quality control results • within 12 months,
the laboratory may set quality control limits based oninformation given in the authoritative sources,
Standard Methods 18th ed., Table 1020I• Spikes: 80-120%• RPD (high concentration): + 10% • RPD (low concentration): + 25%
laboratory experience, Be prepared to defend what you’ve come up with!
or the experience of other laboratories.Could use limits from an adjacent facility. Only do this if the facility has similar processes to your own and they are using the same procedure as you are.
What if I don’t have enough data?If you do QC any less frequently than once every 2 weeks, you will not have enough data.
The Auditor says your limits are too broad
How do they know that?• Remember: RPD should be about 20% or less• 20% RPD means a range that is 1/5 of the mean• Therefore, your upper control limit should be
no more than 20% of your sample mean• Effluent Range control limit should be no more than 20%
of average effluent concentration• Example…Effluent BOD averages 7 ppm Your replicate control limit
should not be greater than about 0.2 x 7 = 1.4 ppm
• Influent Range control limit should also be no more than 20% of average influent concentration

This is every lab auditor’s dream!
1. Be sure that you are not excluding out-of-control data!Outliers should be excluded, but all out-of-control points are not outliers.
2. Include enough significant figures.• If values are whole numbers (e.g., 10, 89%), you can use
one or even two decimal points to include some variability(10.2, 89.3%).
• This same problem has been observed when a laboratory only reported recoveries to the nearest 5%.
What if I think my control limits are TOO tight?
11=10.6 - 11.48= 7.5 - 8.5
Date Sample Replicate Range1 10 10 02 5 4 13 10 10 04 10 10 05 8 8 06 11 10 17 8 7 18 11 11 09 6 6 0
10 8 8 011 10 10 012 11 11 013 11 10 114 9 8 115 6 6 016 8 8 017 11 10 118 9 8 119 5 5 020 11 10 1
Sum 178 170 8Mean 9 9 0.40Warning 2.51 X 1.004Control Limit 3.27 X 1.308
Control limit should be no > 1.74
Sample Replicate Range9.9 9.6 0.34.6 3.5 1.19.6 9.6 09.5 9.9 0.47.7 7.9 0.2
10.6 9.9 0.77.5 6.6 0.9
10.7 10.7 05.8 5.5 0.37.6 7.7 0.19.6 9.6 0
10.6 10.8 0.210.6 9.8 0.88.7 7.6 1.15.6 5.7 0.17.6 7.9 0.3
10.8 9.9 0.98.8 7.5 1.34.8 4.9 0.1
10.9 9.6 1.3
172 164 109 8 0.51
2.51 X 0.505 = 1.267553.27 X 0.505 = 1.65135
1.68
• 19 of 20 runs: control limits higher without rounding
• Sample range 4-10 ppm• 1 ppm max range• correlation 0.922• average percent increase
was 18%• Range was -1% to +44%
Control Limits vs. Data Reporting
0
0.5
1
1.5
2
2.5
0 0.5 1 1.5 2 2.5
Reporting whole numbers
Repo
rtin
g 1
deci
mal
pl
ace
Data Reporting vs. Control Limits
25% increase in control limit

DATE %R11/01 81 11/04 87 11/07 90 11/10 93 11/13 80 11/16 82 11/19 91 11/22 94 11/25 83 11/28 11012/01 91 12/04 92 12/07 80 12/10 88 12/13 94 12/16 92 12/19 83 12/22 80 12/25 91 12/28 95
N = 20 SD = 7.28 Mean = 88.85 Limits = 67 to 110.7%
11/01 11/07 11/13 11/19 11/25 12/01 12/07 12/13 12/19 12/25
100
110
120
130
50
60
70
80
90
DO NOT plot the data used to create limits against those same limits!
There are many statistical tests available for identifying outliers. One that is relatively easy to use is the Grubbs test.
Z = mean - questionable data pointSD
Ignore the sign of the “Z” value….is always “ + ”For replicates, test only the highest value
For spikes, test both the lowest & highest values
Include suspect outlier when calculating mean, SDIf the calculated Z-value > Critical Z value
...for that number of data points,
...then the value is an outlier
Critical N Z18 2.6519 2.6820 2.7121 2.7322 2.7623 2.7824 2.8025 2.8226 2.8427 2.8628 2.8829 2.8930 2.9135 2.9840 3.0450 3.1360 3.20
Dealing With Outlier Data

DATE %R11/01 81 11/04 87 11/07 90 11/10 93 11/13 80 11/16 82 11/19 91 11/22 94 11/25 83 11/28 110 12/01 91 12/04 92 12/07 80 12/10 88 12/13 94 12/16 92 12/19 83 12/22 80 12/25 91 12/28 95
1. Calculate the mean and SDMean = 88.85 SD = 7.278 Limits =67 - 110.7
2. Test the high value (110)Z= 110 - 88.85 = 2.9058
7.2783. Test the low value (80)
Z= 88.85 - 80 = 1.21597.278
Critical N Z18 2.6519 2.6820 2.71
4. Discard outliers; re-calculate mean and SDSince Z110 > criterion, 110 is an outlier
Mean =87.737 SD= 5.4553 Limits = 71 - 104
NOTE: Step 4 may also require a re-check for additional outliers!
Outlier Test Example?
Corrective Action

In a nutshell, Corrective Action is anything done in response to an out-of-control situation.
It MUST, however, be designed to identify the reason for the failure, and then correct it.
There should also be a plan to quickly verify that the action taken has the desired effect.
What IS Corrective Action?
Writing “I don’t know why it failed”Simply considering all matrix spike failures as
“matrix effects”Checking calculations onlySimply re-running the samples
What IS NOT Corrective Action?
InactionA limited repertoire of fixesAddressing the effect vs. the causeFailure to ensure resolution
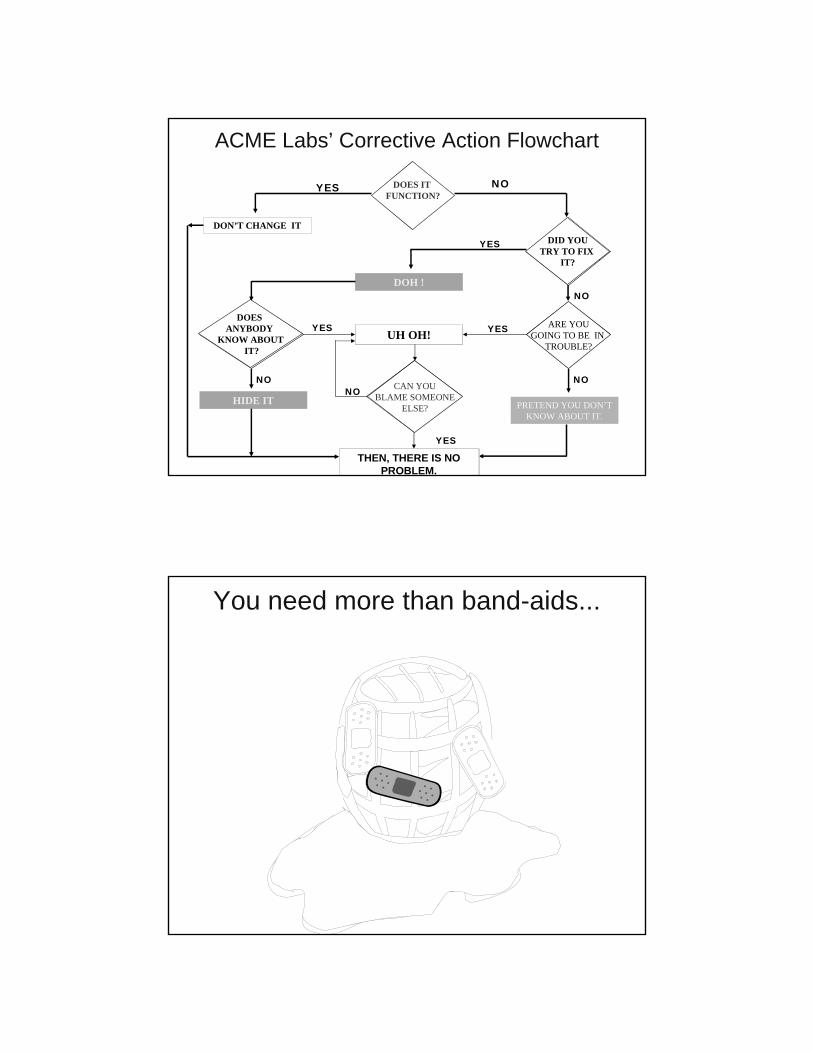
ACME Labs’ Corrective Action Flowchart
DON’T CHANGE IT
DID YOUTRY TO FIX IT?
DOES IT FUNCTION?
YES NO
YES
DOH !NO
ARE YOUGOING TO BE IN
TROUBLE?
NO
PRETEND YOU DON’T KNOW ABOUT IT.
DOES ANYBODY
KNOW ABOUTIT?
UH OH! YESYES
NO
HIDE ITCAN YOU
BLAME SOMEONEELSE?
NO
THEN, THERE IS NO PROBLEM.
YES
DOES IT FUNCTION?
DID YOUTRY TO FIX
IT?
DOES ANYBODY
KNOW ABOUTIT?
ARE YOUGOING TO BE IN
TROUBLE?
CAN YOUBLAME SOMEONE
ELSE?
THEN, THERE IS NO PROBLEM.
THEN, THERE IS NO PROBLEM.
THEN, THERE IS NO PROBLEM.
UH OH!
You need more than band-aids...

Getting past the Symptoms; Determining & Treating the Illness
If you’re not prone to headaches, and suddenly develop a major migraine...
Aspirin
…how would you feel if the doctor simply prescribed ...?
Sure… it might work, but as the one with the problem, YOU don’t want to waste time with “maybe” solutions
The first step in Corrective Action is to identify the cause of the problem at hand
morphine
Plan
Do
Act
Check
Corrective Action = Continuous Quality Improvement

PlanReally think about potential causesTwo heads are better than one…consult othersMaybe check corrective action logs
(we’ll discuss those later)
Identify a plan of action to address the problem
Collect data or observationsEstablish a timetable for
follow-up
Do
Implement the plan--on a small scale
Try to incorporate routine variables
Don’t commit to wholesale changes at this stage
Most important…do not assume your plan is the ultimate solution…or even a viable one

You've carefully thought out all the angles.
You've done it a thousand times.
It comes naturally to you.
You know what you're doing, its what you've been trained to do your whole life.
Nothing could possibly go wrong, right ?
Think you have it covered?
Think Again

Check
Time to evaluate results
Did the action correct the problem?
Did it work under most routine situations?
What did you learn?
Be sure to document each and every step
along the way
Act
Decision Time!
If your plan seems to have corrected things, consider full-scale implementation
Alternatively, consider other options
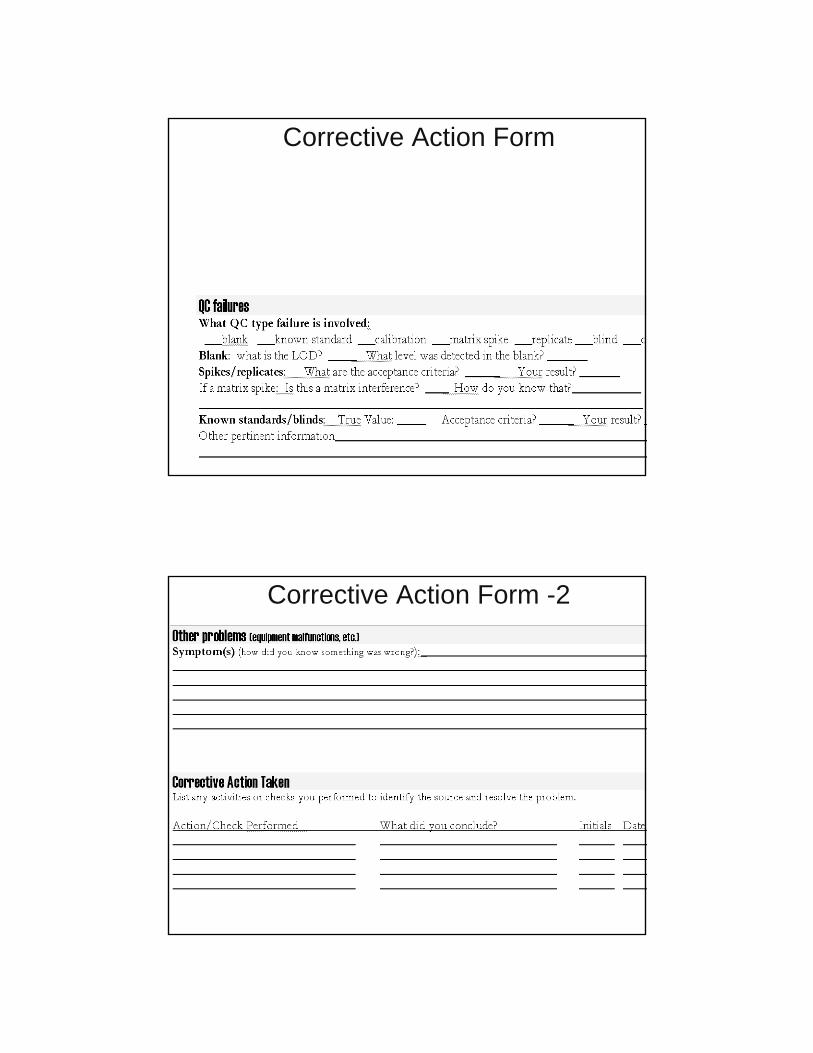
Corrective Action Form
Corrective Action Form -2
Corrective Action Form -3
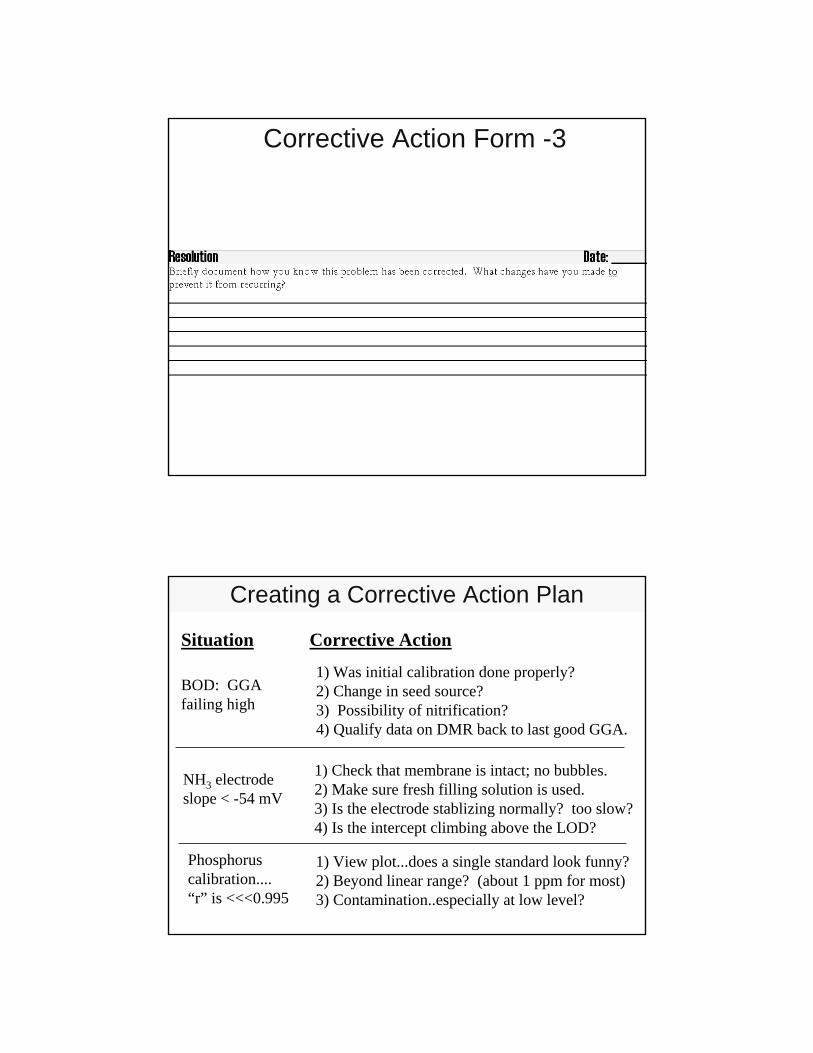
BOD: GGA failing high
1) Was initial calibration done properly?2) Change in seed source?3) Possibility of nitrification?4) Qualify data on DMR back to last good GGA.
Situation Corrective Action
NH3 electrode slope < -54 mV
1) Check that membrane is intact; no bubbles.2) Make sure fresh filling solution is used.3) Is the electrode stablizing normally? too slow?4) Is the intercept climbing above the LOD?
Phosphorus calibration....“r” is <<<0.995
1) View plot...does a single standard look funny?2) Beyond linear range? (about 1 ppm for most)3) Contamination..especially at low level?
Creating a Corrective Action Plan

Corrective Action?
Or Taking the Correct Action?
Time to STOP being the scientist….
Corrective Action means changing roles

Summary: Corrective Action
Identify the source of the problem
Look beyond the effects…find the cause
Develop a Game Plan to address the problem
Implement the plan on a trial basis (Do)
Evaluate the results of the change (Check)Decide whether or not the problem is solved (Act)
Develop a documentation protocol (trail of bread crumbs)
Qualify any affected data
Qualifying Data

DMR: Laboratory QC Comments Box
This box is reserved for comments SPECIFICALLY related to laboratory QA/QC problems
Report any Quality Control exceedances hereVery important in assessing data quality
Laboratory QA/QC Comments Box
Failure to report QC exceedances here is a weakness we are seeing during audits
Historically, reporting anything here has been perceived as a “black mark” against the facility
Time to change history!(1) You are required to report this information(2) If engineers do NOT see information here,
we cannot assist you in resolving laboratory problems
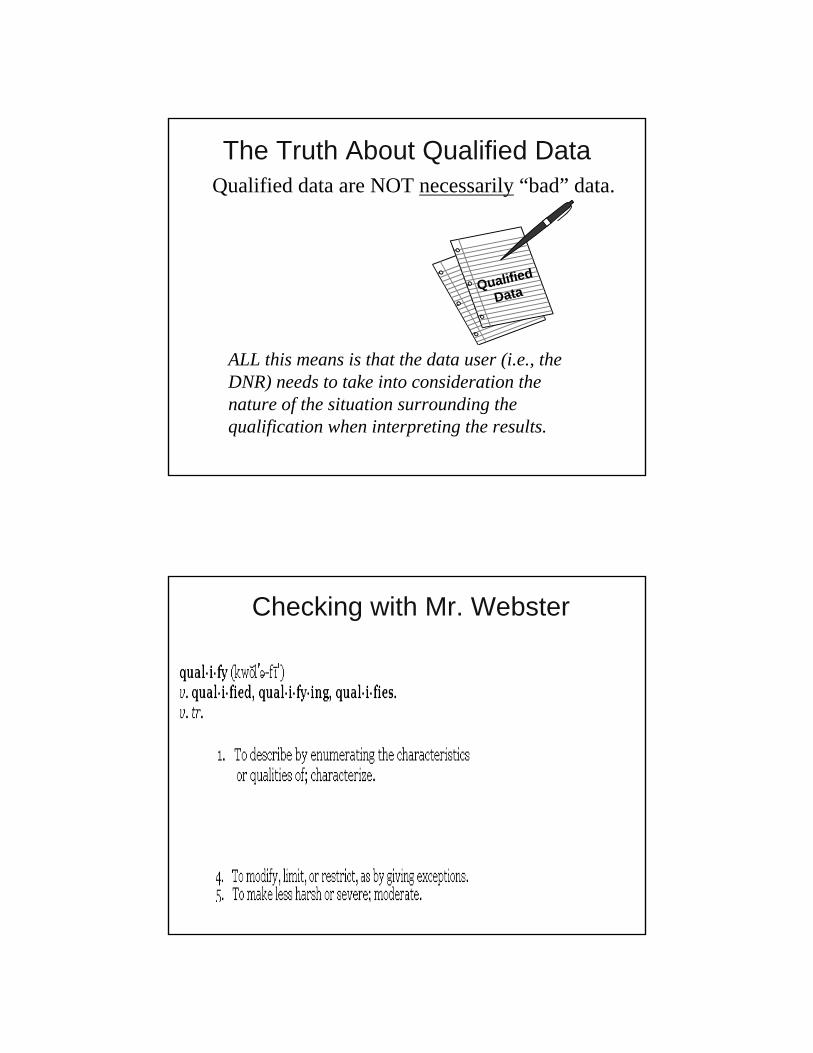
The Truth About Qualified DataQualified data are NOT necessarily “bad” data.
ALL this means is that the data user (i.e., the DNR) needs to take into consideration the nature of the situation surrounding the qualification when interpreting the results.
Qualified
Data
Checking with Mr. Webster

Qualifying Data - Considerations
• Make sure your comments are meaningful and understandable to the end user.
• Provide enough information so that the DNR can assess the data quality.
• Remember to include qualifiers from subcontract labs!
• Attach comments on a separate sheet if necessary. Write “see attachment” in the QC Comments box.
Qualifying Data - Reference Sample Failures
NR 149.13 (4) PROCEDURE FOR CORRECTING UNACCEPTABLE REFERENCE SAMPLE RESULTS.
(a) All test categories, except category 18– safe drinking water tests. After 2 consecutive reference sample failures the laboratory shall…
2. Qualify all test results of the analytes in the test or test categories which the laboratory has failed to meet acceptance limits on 2 consecutive reference samples

Example - Reference Samples
Situation: You have failed your BOD reference sample for the 2nd consecutive round of testing.
Resolution: 1. Order a 3rd reference sample ASAP
2. Identify and correct the problems
3. Pass the remedial reference sample!
4. Qualify any BOD results on the DMR until you pass a reference sample
Qualifying Data - QC Failures
NR 149.14 (3)(h) If the results of• known standards, • spiked samples, • method blanks, or • replicates
exceed the quality control limits,corrective action shall be taken by the laboratory.The laboratory shall
• reanalyze the affected samples or • qualify the results back to the last acceptable
quality control check of the same typeunless the laboratory determines that sample results are unaffected.
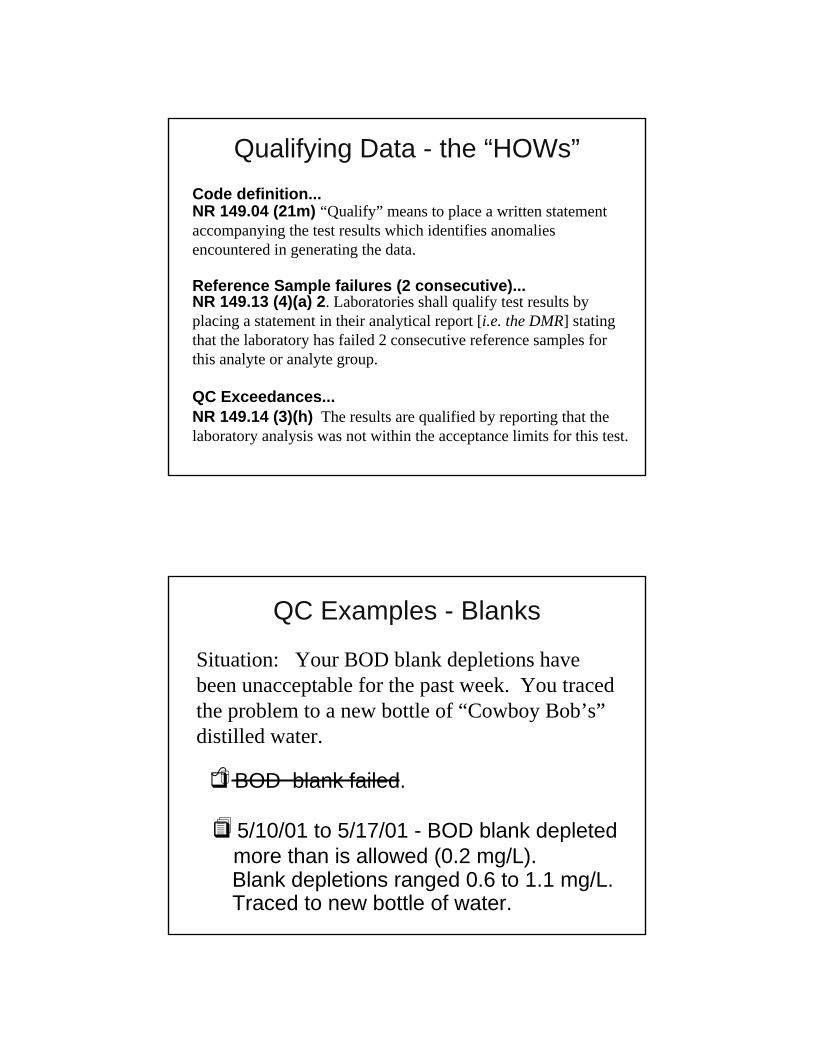
Qualifying Data - the “HOWs”
NR 149.04 (21m) “Qualify” means to place a written statement accompanying the test results which identifies anomalies encountered in generating the data.
NR 149.14 (3)(h) The results are qualified by reporting that the laboratory analysis was not within the acceptance limits for this test.
NR 149.13 (4)(a) 2. Laboratories shall qualify test results by placing a statement in their analytical report [i.e. the DMR] stating that the laboratory has failed 2 consecutive reference samples for this analyte or analyte group.
Code definition...
QC Exceedances...
Reference Sample failures (2 consecutive)...
5/10/01 to 5/17/01 - BOD blank depleted more than is allowed (0.2 mg/L).
BOD blank failed.
QC Examples - Blanks
Situation: Your BOD blank depletions have been unacceptable for the past week. You traced the problem to a new bottle of “Cowboy Bob’s”distilled water.
Blank depletions ranged 0.6 to 1.1 mg/L. Traced to new bottle of water.

GGA exceeded acceptance criteria.
QC Examples - Known Standard
5/7/01 - GGA analyzed this day (235 mg/L) exceeded criteria (198 + 30.5).
Situation: Your BOD glucose-glutamic acid (GGA) exceeded acceptance criteria. You used a new lot of GGA standard the next day and results were fine.
Repeated GGA with new lot on 5/12/01.Result was 202 mg/L.
Replicate failed for TSS.
QC Examples - Replicates
5/17/01 - Replicate result (5.5 mg/L) for TSS on influent exceeded upper control limit (1.9 mg/L).
Situation: Your influent TSS replicate on 5/17/01 exceeded upper control limit.
Replicates are done weekly, so data since 5/10/01 are affected. Heavy rains caused TSS levels to be 3 times typical levels. Did another replicate next day and it passed.
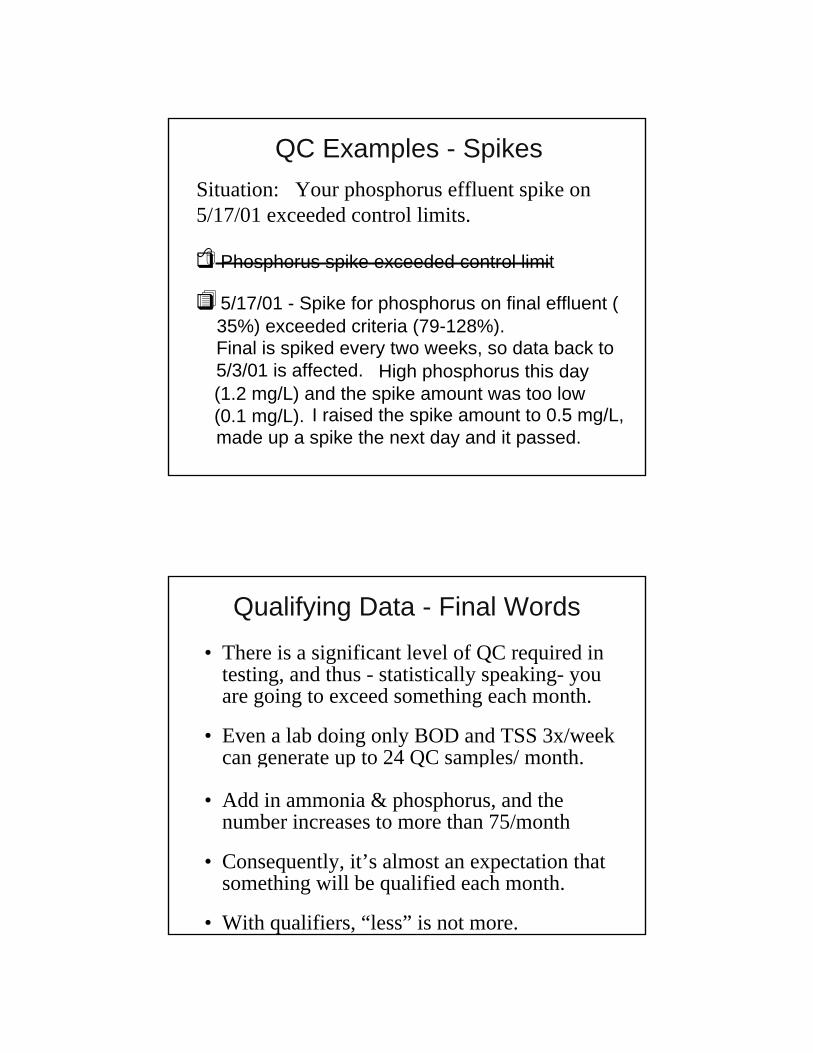
Phosphorus spike exceeded control limit
QC Examples - Spikes
5/17/01 - Spike for phosphorus on final effluent ( 35%) exceeded criteria (79-128%).
Situation: Your phosphorus effluent spike on 5/17/01 exceeded control limits.
Final is spiked every two weeks, so data back to 5/3/01 is affected. High phosphorus this day (1.2 mg/L) and the spike amount was too low (0.1 mg/L). I raised the spike amount to 0.5 mg/L, made up a spike the next day and it passed.
Qualifying Data - Final Words• There is a significant level of QC required in
testing, and thus - statistically speaking- you are going to exceed something each month.
• Even a lab doing only BOD and TSS 3x/week can generate up to 24 QC samples/ month.BOD blanks 1/d x 3d/wk x 4 weeks =12BOD known std (GGA) 1/wk x 4 weeks = 4BOD eff. replicate 1/2wk x 4 weeks = 2BOD inf. replicate 1/2wk x 4 weeks = 2TSS eff. replicate 1/2wk x 4 weeks = 2TSS inf. replicate 1/2wk x 4 weeks = 2
• Add in ammonia & phosphorus, and the number increases to more than 75/month
• Consequently, it’s almost an expectation that something will be qualified each month.
• With qualifiers, “less” is not more.

Documentation
Operating Principles
If you didn’t document it, you didn’t do it!
If you did the work…take credit for it!

Standard: Std. Code:Date Prepared: Prepared by:Date Expires: Storage:Stock Std Code:
Date received: Date Expires:Received by: Date Opened:Required Storage:Chemical or Reagent:
Simple Approach to Consistent Reagent Documentation
Pre-print labels for new chemicals and reagents
New Chemical or Reagent Label
4/2/01 6/03J. Smith 4/12/01
Room temperature, away from light
New Working Standard Label
Ascorbic Acid
Phosphorus, 5 μg/mL 100-38/5/01 A. Smith9/5/01 4oC50-25
General convention:MM/YY means the
FIRST day of the month
Reagent and Standard Control Records
• Full traceability of reagents and standards to the original lot in a logbook
• Traceable record of standards and regents used directly on the analysis record (bench sheet)
• Person preparing the reagents or standards, preparation and expiration dates on all reagents and standards
Remember….traceability is in the “eye of the beholder”

Reagent and Standard Control Records Continued
• Certification records provided by the manufacturer with a direct link to the calibration standards
• Storage conditions
Remember to record the standard code on the certificate so there is a link to the standards logbook!
The Not-so-obvious Things that Need to be Documented
Items that are often overlooked!• Corrective actions taken
Remember…you need to be able to show auditors or courts what was done ….not just tell them!
• Historical QC limitsYou may need to defend data 3-4 years old. Could you tell the courts what the QC limits were when the tests were done?
• Performance on blind samples and reference samples
show
JeffersonCity

less
Paperless laboratories - Reality or Pipe Dream?
Automating and using electronic recording keeping process just means….
Paperless
Free Lunch
….and nosuch thing as a paperless laboratory!!!
Recommended Practices when using Electronic Record-Keeping Processes
• Automated audit trail when ever records are changed
• Limit records access to a few authorized individuals
• Implement a process to document any changes by the systems administrator
e.g., Systems Administrator, Lab Director, etc.
• Back-up data daily and use a media that will allow retrieval years later
e.g., Optical storage has a longer life than magnetic media
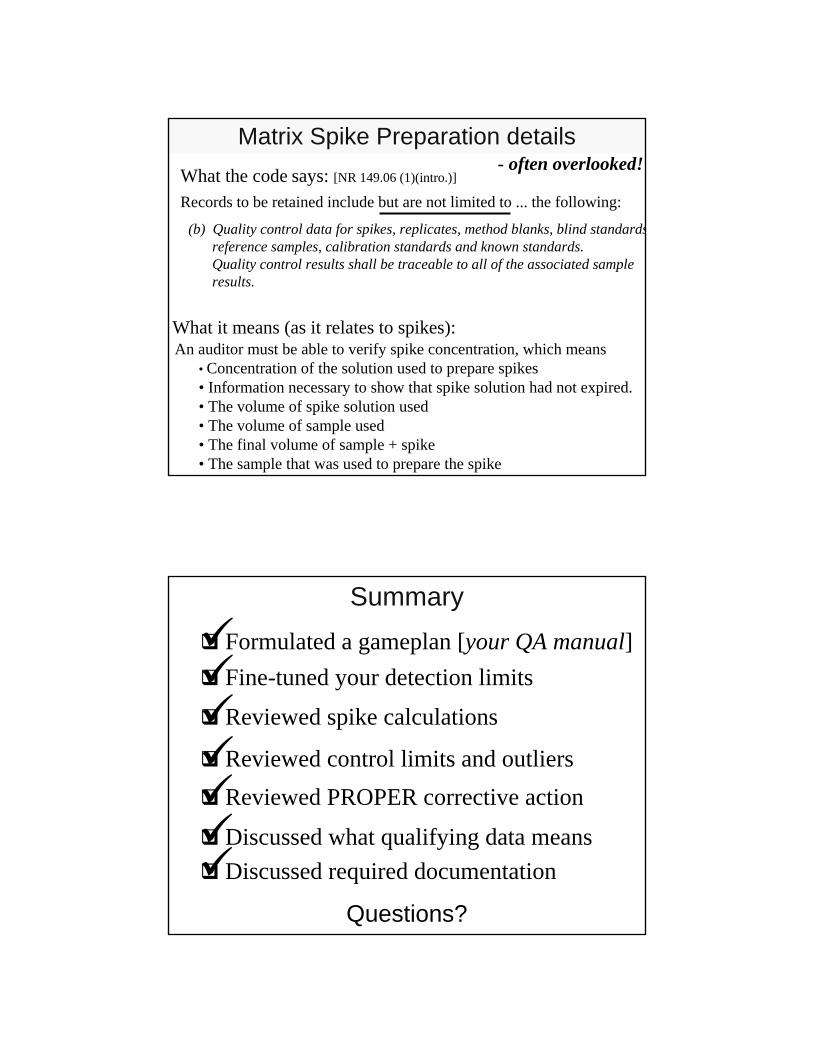
- often overlooked!What the code says: [NR 149.06 (1)(intro.)]
Records to be retained include but are not limited to ... the following:
What it means (as it relates to spikes):An auditor must be able to verify spike concentration, which means
• Concentration of the solution used to prepare spikes• Information necessary to show that spike solution had not expired.• The volume of spike solution used• The volume of sample used• The final volume of sample + spike• The sample that was used to prepare the spike
(b) Quality control data for spikes, replicates, method blanks, blind standardsreference samples, calibration standards and known standards. Quality control results shall be traceable to all of the associated sample results.
Matrix Spike Preparation details
Questions?
Formulated a gameplan [your QA manual]Fine-tuned your detection limits
Reviewed spike calculations
Reviewed control limits and outliersReviewed PROPER corrective action
Summary
Discussed required documentationDiscussed what qualifying data means
George Bowman(608) 224-6279----------------------
Bill Sonzogni, DirectorState Laboratory of Hygiene
2601 Agriculture DriveMadison, WI 53718
Rick Mealy(608) 264-6006
-----------------------
Wisconsin DNRPO Box 7921
Madison, WI [email protected]
State Lab web address:http://www.slh.wisc.edu/outreach/
DNR’s LabCert homepage:http://www.dnr.state.wi.us/org/es/science/lc/