advanced phosphorous removal:how low can we go?
TRANSCRIPT

Advanced phosphorous removal:how low can we go?
Kieran Healey
9th European Wastewater Management Conference and Exhibition
12th October 2015

Dual Media Filter’s
Electrochemical
Membranes
Advanced Media
Reed Beds
Ballasted Coagulation
Immobilised
Algal
Nanoparticle Embedded
Ion Exchange
Passive Precipitation
Upflow Moving Bed Filter’s
Microsieves
Discfilter

Discfilter Technology
Tertiary P Removal and Discfilters
Pilot & Full Scale Experience
Questions
Advanced phosphorus removal:how low can we go?
3

Discfilter Technology

Discfilter Technology …

Discfilter Technology …

Discfilter Technology …
o Standard range
o 1.7m, 2.2m and 2.6m diameter
o Max filter area: 228 m² (30 discs)
o Small footprint
o Monofilament polyester cloth
o Pore size: 10 to 1000 microns
o Discs 50-60% submerged
o Filtration during backwash
o Low backwash reject <3%
o Low head loss, 250mm max

Discfilter Technology …
In Tank Option

Discfilter Technology …
In Frame Option

Tertiary TP Removal &
Discfilter’s

P – removal in tertiary filtration
11
TP Effluent Requirement
0.2 to 0.8 mg/l Upstream
Co-Precipitation
0.1 to 0.3 mg/l
> 0.1 mg/l
Upstream
Co-Precipitation
Tertiary
Coag/Floc
Upstream
Co-Precipitation
<1.5 mg/l
Tertiary
Coag/Floc

When is co-precipitation not enough …
Total Phosphate
TP
Particulate Phosphate
PP = TP-Ps
Total Soluble Phosphate
Ps (0.45µm Filter)
Soluble Non Reactive Phosphorus
sNRP = Ps-P-PO4
Soluble Reactive Phosphorus
P-PO4 (0.45µm Filter)
1mg/l
0.5mg/l
0.3mg/l
0.1mg/l
<0.1mg/l
TP Standard

How low can we go? …
Total Phosphate
TP
Particulate Phosphate
PP = TP-Ps
Total Soluble Phosphate
Ps (0.45µm Filter)
Soluble Non Reactive Phosphorus
sNRP = Ps-P-PO4
Soluble Reactive Phosphorus
P-PO4 (0.45µm Filter)
1mg/l
0.5mg/l
0.3mg/l
0.1mg/l
<0.1mg/l
TP Standard Range 10 to 70 µg/l
Typically 10 to 20 µg/l
Low removal in Tertiary treatment observed
Correlation to TP removal efficiency
If high can impact on TP achievable

How low can we go ? ...
0
10
20
30
40
50
60
70
80
90
100
0 20 40 60 80 100 120
TP R
em
ova
l
Influent snrP- ug/l
Extracted from OXERAM 2 Contract Report 2013

Key design criteria for low P ...
15
Correct Dosage & adequate Dispersion
Precipitation of coagulant cations + phosphate anions
Coagulation – Micro flocs
Flocculation – Macro flocs
Floc separation

Key design criteria for low TP…
10 µm
Coagulation
Flocculation Microsieve
Me3+
Polymer
Flow
Ortho- P
Turbidity
G Value
HRT
Create Shear resistant flocs
Maximise filtration times
Mimimise backwash times
Mimimise backwash times
Chemical & energy optimisation

Backwash ...
0
5
10
15
20
25
30
0 20 40 60
Filt
rate
flo
w -
m3
/hr
Time - sec
Backwash
period
Flow range varies
with coagulant
Backwash time varies with coagulant,
polymer & G values

Backwash ...
0
0.1
0.2
0.3
0.4
0.5
0.6
0.7
Coag pumps
Coag motors
Floc pumps
Floc motors
BW pump DF drive
% T
ota
l Wh
/m3
Chemical dosing
Discfilter
Chemical cleaning:
o HCL & Sodium hypochlorite
o 4 – 12 weeks intervals
o Reduces backwash frequency
o Maximise’s filtration rate
o Minimise’s energy costs

Pilot Plant & Full Scale
Experience

Co-precipitation: Rya WWTP , Sweden …
Effluent as yearly average
TP < 0.3 mg/L
BOD < 10 mg/l
TSS < 5 mg/l
TN <10 mg/l
Activated sludge
Secondary Clarifier
Trickling filter
50%
50%
Me3+
880,000 PE
TP = 0.5mg/l
TN =15mg/l
2006
Gota River Primary Clarifier

Co-precipitation: Rya WWTP , Sweden …
Activated sludge
MBBR Post DN 4 600 m3 of K1
32 x HSF 2220 15 µm
Secondary Clarifier
Trickling filter
50%
50%
methanol
Me3+
880,000 PE
No post chemical addition
Primary Clarifier


Operation results ...
Average TP = 0.18 mg/l Average TN = 7.9 mg/l
Average BOD7 = 7.9 mg/l
Source: Gryaab
0
1
2
3
4
5
6
7
8
9
10 A
ug-
14
Sep
-14
Oct
-14
No
v-1
4
Dec
-14
Jan
-15
Feb
-15
Mar
-15
Ap
r-1
5
May
-15
Jun
-15
Jul-
15
Au
g-1
5
Sep
-15
Oct
-15
No
v-1
5
mg/
l
TP TN BOD7
Power – 13 Wh/m3
HCL Clean – 4 weeks NaCLO Clean - 12 weeks

Pilot test’s at Berlin WWT
Berlin Centre of Competence for
Water
Long term test (>24 months)
Objective <80 µg/l TP
Trial included
Discfilters/Membranes UF &
MF/dual media filters
OXERAM 2 pilot trials…

Oxeram discfilter pilot trial…
10 µm
Coagulation
Flocculation Discfilter
Me3+
polymer

Pilot plant operating conditions ...
Time scale Hydraulics Chemical dosing
Control Flow (m3/hr) Control Coagulant Polymer
October 2010 Constant 10 or 20 Volume 4 or 5 mg Fe/l 1.9 or 2.4 mgAl/l
2mg/l
May 2011 Fixed Diurnal 11 - 23 Volume 1.9 or 2.4 mg Al/l 2mg/l
August 2011 Fixed Diurnal
11 - 23 Load 1.9 – 2.9mgAl/l 1.5-2.0 mg/l
September 2011 Dynamic 10 - 29 Load 1.9 – 2.9mgAl/l
1.5-2.0 mg/l
November 2011 Dynamic 10 - 29
Load 1.9 – 2.9mgAl/l
0.76 – 2.0 mg/l
January 2012 Dynamic 10 - 29
Load 1.9 – 2.9mgAl/l
0.57 – 1.1 mg/l

Good consistant TP removal with <80 µg/l achieved
Ability to achieve <40 µg/l limited by sNRP
Chemical dosing optimisation key to good
performance
PACL better than Ferric Chloride – TP, TSS, UV
transmittance
Load proportional dosing enhanced performance
Polymer optimised at average of 0.6 mg/l
Summary of results ...
FeCl3
PACL

Pilot plant operation ...
Parameter Unit Value
Average BW time % 47
Backwash water range % 1.1 to 3.6
Average BW % 1.8
TSS mg/l 580 to 1000
SVI <50ml/g
Chemical cleaning HCl & NaClO
Frequency weeks 4-7
Power Wh/m3 21

Environmental & economic efficiency …
Source KWB
Low
CO2eq
Low cost

North Attleborough, USA …
Inlet works
Primary Clarification
BNR AS Secondary
Clarification
Dual Media Filters
Influent
Me3+ Me3+
1mg/l TP
river
discharge
0.1mg/l TP
river
discharge
Me3+ Polymer
90,000PE
Coagulation & flocculation
tanks

Phase 1 pilot plant study ...
Two stage deep bed upflow sand fillers DiscFilter
Dual Media Filter
Actiflo
Membrane filtration
o All stage 1 pilots achieved less <0.1mg/l
o Additional stage 2 achieved further reduction of 51%
o Stage 1 sNRP reduction from 50 to 10 µg/l
o Discfilters chosen for Phase 2 pilot study
o Could be retroffited into existing building
o Discfilters fitted existing hydraulic profile without pumping
Source WEFTEC 2010

5 week Trial
27 trial runs
Comparison of Alum, PACL & Ferric
Hydraulic variation- max month, peak hourly
flow
Performance guarantee conditions
Clarifier upset – 75,130,160 & 220 mg/l
Phase 2 pilot study ...
Source WEFTEC 2012
o Pilot Discfilter achieved <0.1mg/l with
influent TP , STP & TSS concentrations up to
8.4 mg/l, 1.3 mg/l and 220 mg/l respectively
o PACL & Ferric chloride coagulation both
achieved <0.1 mg/l
o Ferric chloride able to achieve Al consent of 92 µg/l
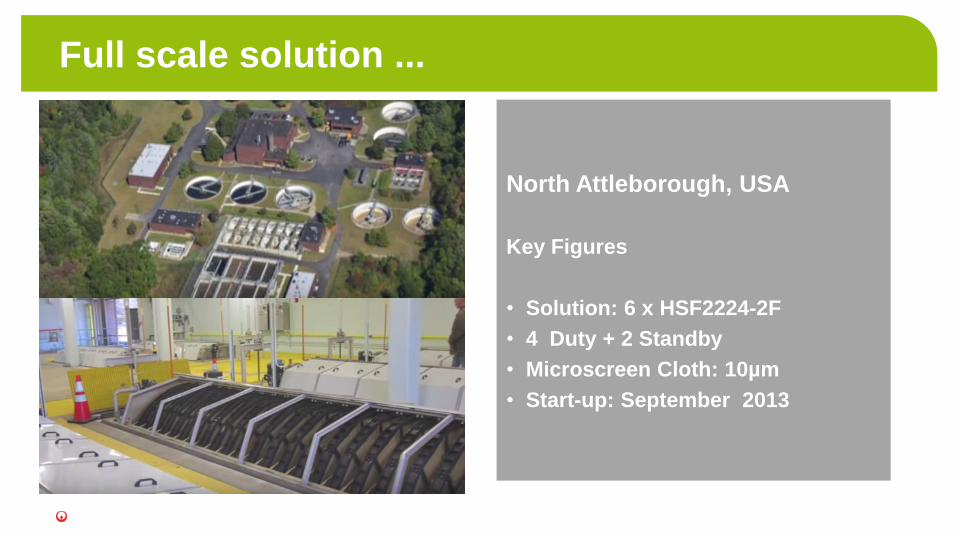
Full scale solution ...
North Attleborough, USA
Key Figures
• Solution: 6 x HSF2224-2F
• 4 Duty + 2 Standby
• Microscreen Cloth: 10µm
• Start-up: September 2013

Full scale operational results …
0
1
2
3
4
5
6
7
mg/
l
Eff TSS Inf TP Eff TP
Inf TP Eff TP Eff TSS
Av 3.0 0.04 2.5
95%ile 4.0 0.11 5.8
Max 4.4 0.36 6.5
Consent monthly seasonal average (April to October ) =
<0.1 mg/l

MBBRTM process features ... Arvidstorp STW Sweden
oTP consent change from 0.5mg/l to 0.3 mg/l
o 35m underground, 12m above sea level
o Limited expansion possibilities
o Combined primary & biological effluent during wet weather
o First full scale discfilter + pretreatment installation in Sweden
2014 upgrade 62000 pe
Gota River

Arvidstorp WWTP solution ...
Arvidstorp WWTP, Sweden
Key Figures
• Solution: 6 x HSF2626-2F
• Capacity: up to 2700 m3/h
• Microscreen cloth: 10µm
• Start-up: Spring 2014

First years operation results ...
Dosing 1 = 2mgAl3+ /l + 1mg/l anionic polymer
Dosing 2 = 2 mg/lAl3+ /l + 0.7 mg/l anionic polymer
Parameter Unit Prior to DF
After DF
TP mg/l 0.46
0.2
Consent mg/l 0.5 0.3

First years operation ...
Parameter Unit Value
Average BW time % 30
Backwash water range % 1.1 to 3.6
Average BW % 1.9
TSS % 0.11 to 0.75
Chemical cleaning HCL & NaCLO
Frequency weeks 6
Total power Wh/m3 34

Conclusions ...
Disc Filter
Actiflo
o Based on extensive pilot plant and full scale experience
discfilters can reliably achieve < 0.1 mg/l TP
o Two stage coagulation and flocculation is required
o Optimised chemical dosing is key to performance
o Chemical choice is site specific
o Influent soluble non-reactive phosphate sets the limits
of achievable removal

Thank You for your
Attention