advanced optical modulation formats and their · pdf fileadvanced optical modulation formats...
TRANSCRIPT

Advanced Optical Modulation Formats and TheirComparison in Fiber-Optic Systems
R Hui, S. Zhang, B. Zhu, R. Huang, C. Allen,D. Demarest
ITTC-FY2004-TR-15666-01
January 2004
Copyright © 2004:The University of Kansas and Sprint Corporation2335 Irving Hill Road, Lawrence, KS 66045.All rights reserved.
Project Sponsor:Sprint
Technical Report
The University of Kansas

Abstract This project started a few years ago and the initial scope of the research was mainly focused on the investigation of sub-carrier multiplexed (SCM) WDM optical systems. As directed by Sprint, during the course of the research, we have expanded our focus to other digital modulation formats for high-speed optical transmission and the comparison of the system performance in various fiber types.
In an early work sponsored by Sprint, we have proved the feasibility of digital WDM/SCM optical transmission and demonstrated a four-channel digital SCM system with the aggregated capacity of 10Gb/s using optical single-sideband modulation. As the continuation, in this new effort we proposed and demonstrated a novel method to eliminate the effect of polarization mode dispersion (PMD) in high-speed SCM optical systems. We evaluated the effect of nonlinear crosstalks in SCM/WDM optical systems and the impact due to fiber characteristics. We also demonstrated a multi-channel ultra dense WDM optical transmitter using one laser diode and one electro-optic modulator. These new developments helped a better understanding of digital SCM optical transmission and made SCM/WDM optical systems more practical.
In recent years there has been a great interest in other digital optical modulation formats for ultra-long distance optical transmission. The impact of optical modulation formats on transmission fiber types and data-rates in WDM systems is critically important for Sprint to make strategic decisions on the fiber plant investments and fiber-optic equipment purchasing. Our comparative study demonstrated that (1) for 10Gb/s DWDM optical transmission, standard single mode fiber (SMF-28) has the best performance for all optical modulation formats because of it low nonlinear crosstalks and (2) In 40Gb/s optical systems, self-phase modulation (SPM) in the transmission fiber becomes the major source of performance degradation, which makes SMF-28 vulnerable because of its high dispersion. In order to make SMF-28 more competitive for 40Gb/s optical transmission, optical phase modulation may be used, such as DPSK. Another way to reduce the effect of SCM is to use optimum pre-chirping and pre-distortion of optical signals in the transmitter. We proposed a possible method to achieve the optimum pre-chirping and pre-distortion, however, effectiveness may need to be further investigated.
1. Introduction Because of the rapid growth of capacity requirement on long distance transmission, fiber-optic telecommunications is advancing into high datarate and dense wavelength division multiplexing (DWDM). In order to maximize the system capacity and minimize the performance degradation caused by transmission impairments, system engineering and optimization are important. Similar to other telecommunication systems, signal modulation format is a key issue, which determines transmission quality and spectral efficiency.
In fiber optical transmission systems, the degradation effects can be categorized into random noise and waveform distortion. For multi-span optically amplified systems, the major contribution to the receiver noise is the amplified spontaneous emission (ASE) generated by optical amplifiers. At an optical receiver, signal-ASE beat noise is the dominant noise and the calculation of system noise performance is quite straightforward by using a Gaussian approximation. On the other hand, signal waveform distortion can be generated by linear chromatic dispersion, fiber nonlinearity and their combination. In high-speed TDM optical systems, because of the short optical pulses and wide optical spectrum, the effect of chromatic dispersion dominates the system performance. In multi-wavelength DWDM optical systems with relatively low data rate per wavelength, inter-channel crosstalk originated by fiber nonlinearity, such as cross-phase modulation (XPM) and four-wave mixing (FWM) will become a limiting factor.
With the increased transmission distance, a larger number of optical amplifiers have to be used, that generates more optical noise. To ensure a decent signal-to-noise-ratio (SNR), a higher signal optical power has to be used, that generates strong crosstalk through fiber nonlinear effect. Similarly, with the increased datarate at each wavelength channel, the optical spectral width is increased, which makes the system more susceptible to chromatic dispersion. The increased datarate also requires a larger receiver electrical bandwidth, which degrades the receiver SNR. To maximize optical network capacity, system design and optimization have to take into account all the contributing facts, such as channel data rate, transmission distance, signal optical power, amplifier noise figure, channel wavelength spacing, optical amplifier spacing, fiber dispersion and nonlinear parameter, dispersion management strategy, receiver bandwidth and so on. One of the most important facts in the system, which affects the choices of all other system parameters, is the signal optical modulation format. In fact, signal optical spectral bandwidth, tolerance to chromatic dispersion, resistance to nonlinear crosstalk, susceptibility to accumulated noise, and other system performance measures are directly related to the optical modulation format.
Until not a long time ago, non-return-to-zero (NRZ), on-off key (OOK) had been the dominant optical modulation format in intensity-modulation, direct-detection (IM/DD) fiber-optic systems. Recent research in advanced optical modulation formats was motivated by the demand of high transmission capacity, better system reliability and optimum operation conditions. From information theory point of view, a variety of signal modulation formats have been studied extensively in telecommunication systems and networks. In comparison with cable transmission, microwave transmission and wireless communication systems, fiber-optic system has its unique properties and different sources of system performance degradation. Although there does not exist a magic modulation format that is immune to all the sources of performance degradations, a proper selection of an advanced optical modulation

format does improve the system performance to some extent by minimizing the effect of some of the degradation sources. In general, the choice of optimum optical modulation format depends on many factors such as fiber types, per-channel datarate, wavelength spacing and so on. In this report, we will first present our investigation in SCM optical systems and then we will present our theoretical evaluations on other digital optical modulation formats and their impact in fiber selection and data rate preference.

2. SCM-WDM optical Systems
2-1. Overview of SCM optical systems
Optical sub-carrier multiplexing (SCM) is a scheme where multiple signals are multiplexed in the RF domain and transmitted by a single wavelength. A significant advantage of SCM is that microwave devices are more mature than optical devices: the stability of a microwave oscillator and the frequency selectivity of a microwave filter are much better than their optical counterparts. In addition, the low phase noise of RF oscillators makes coherent detection in the RF domain easier than optical coherent detection, and advanced modulation formats can be applied easily. A popular application of SCM technology in fiber optic systems is analog CATV distribution [1, 2]. Because of the simple and low-cost implementation, SCM has also been proposed to transmit multi-channel digital optical signals using direct detection [3, 4] for local area optical networks.
We have analyzed the performance of high-speed digital fiber-optic transmission using SCM both analytically and numerically. In order to minimize the impact of fiber chromatic dispersion, optical single-side-band (OSSB) modulation is used which also increases the optical bandwidth efficiency. Fiber nonlinearities such as cross phase modulation (XPM) and four wave mixing (FWM) may generate significant amounts of nonlinear crosstalk between adjacent SCM channels because they are very closely spaced. Although chromatic dispersion is not a limiting factor in OSSB modulated SCM systems because the data rate at each sub-carrier is relatively low, carrier fading due to PMD may be significant because of high sub-carrier frequencies [14]. In order to optimize the system performance, tradeoffs have to be made between data-rate per sub-carrier, levels of modulation, channel spacing between sub-carriers, optical power and modulation indices. An experiment of 10 Gb/s SCM fiber-optical system was performed, in which 4 x 2.5 Gb/s data streams were combined into one wavelength, which occupied an approximately 20 GHz optical bandwidth. Optical single-side-band modulation was achieved using a balanced dual-electrode electro-optic modulator. This 10 Gb/s composite optical signal was transmitted over 150 km equivalent standard single-mode fiber (SMF) without any dispersion compensation [5]. The combination of SCM and WDM may provide a more flexible platform for high-speed optical transport networks with high optical bandwidth efficiency and high dispersion tolerance.
The basic configuration of an SCM/WDM optical system is shown in Fig.1. In this example, n independent high-speed digital signals are mixed by N different microwave carrier frequencies fi. These are combined and optically modulated onto an optical carrier. m wavelengths are then multiplexed together in an optical WDM configuration. At the receiver, an optical demultiplexer separates the wavelengths for individual optical detectors. Then RF coherent detection is used at the SCM level to separate the digital signal channels. Channel add/drop is also possible at both the wavelength and SCM levels. While this SCM/WDM is, in fact, an ultra-dense WDM system, sophisticated microwave and RF technology enables the channel spacing to be comparable to the spectral width of the baseband, which is otherwise not feasible by using optical technology. Compared to conventional high-speed TDM systems, SCM is less sensitive to fiber dispersion, because the dispersion penalty is determined by the width of the baseband of each individual signal channel. Compared to conventional WDM systems, on the other hand, it has better optical spectral efficiency because much narrower channel spacing is allowed.

Conventional SCM generally occupies a wide modulation bandwidth, because of its double-sideband spectrum structure, and, therefore is susceptible to chromatic dispersion. In order to reduce dispersion penalty and increase optical bandwidth efficiency, optical SSB modulation is essential for long-haul SCM/WDM optical systems. Fortunately, optical SSB is relatively easy to accomplish in SCM systems. This is because there are no low frequency components, and the Hilbert transformation is thus much simpler than OSSB in conventional TDM systems [6, 7].
2-2. Experiment on SCM system
In order to investigate the feasibility of long-haul digital SCM transmission at high speed, an experiment was conducted at 10 Gb/s capacity per wavelength. Four 2.5 Gb/s digital signals were mixed with four RF carriers each at 3.6 GHz, 8.3 GHz, 13 GHz and 18 GHz and BPSK modulation format was used in the RF domain. The RF carriers were then combined and amplified to drive a dual electrode LiNbO3 Mach-Zehnder modulator with a 20 GHz bandwidth. As shown in Fig. 2, in order to generate optical single-sideband, the composite signal was applied to both of the two balanced electrodes with a π/2 phase shift in one of the arms using a 90o hybrid splitter. A dc bias sets the modulator at the quadrature point to generate optical SSB [8]. Fig. 3 shows the SSB optical spectrum measured by a scanning Fabry-Perot interferometer with a 1 GHz resolution bandwidth. Suppression of the unwanted sideband of at least 13 dB was achieved as can be seen from Fig. 3.
To measure the transmission performance, this optical signal was then launched into a single-mode fiber link with accumulated chromatic dispersion of –2640 ps/nm, which is equivalent to approximately 160 km of standard single-mode fiber. The experiment
Receiver 1
Opt
ical
DM
UX
Receiver m
Σ
f1ch.1
fn
ch.nλ1
PD
Opt
ical
MU
X
Transmitter 1
Σ
LDf1
ch.1
fn
ch.n
λ1
Mod
Transmitter m
Σ
λm
fnch.n
f1 ch.1
LD
Mod Σ fn
ch.n
f1ch.1
λm
PD
Figure 1, SCM/WDM system architecture

was performed using dispersion compensating fibers (DCF) (Lucent DK series), which have large negative dispersion values. No dispersion compensation was used. At the receiver, the optical signal was pre-amplified and detected by a wideband photo-detector. A typical spectrum of the detected composite RF signal after the wideband photodiode is shown in Fig.4, where four optical sub-carriers are converted into the RF domain. Each sub-carrier was then down-converted to an individual baseband by mixing the composite signal with an appropriate RF local oscillator, and then passing through a 1.75 GHz lowpass filter. Although both ASK and PSK modulation/detection schemes may be used, in our experiment we have used PSK format in the RF domain for better receiver sensitivity.
The bit-error rate (BER) was measured for all four channels both back-to-back and over the fiber. The measured BER plotted as a function of received optical power level is shown in Fig. 5. The measurement was performed under the condition that all four SCM channels were operated simultaneously. At the BER level of 10-10, the back-to-back sensitivity ranges from –25 dBm to –27 dBm for the different channels due to the ripples in the microwave devices and the inaccuracy of the modulation index of each individual SCM channel. After transmission, the sensitivity is degraded by about 2.5 dB. In our experiment, this degradation was largely attributed to the frequency instability of the local oscillators. In this 4-RF channel experiment, an
0 90o
Laser
90o Hybrid
MZ modulator
AC
AC
DC Optical signal out
RF signal in
Figure 2, Illustration of optical SSB modulation using dual-electrode MZ modulator
Figure 3, Measured optical SSB spectrum (Vertical: 5dB/div, Horizontal 10GHz/div)

approximately 4.7 GHz spacing between RF channels was used, this spacing was selected based on the tradeoff between the inter-channel crosstalk and the bandwidth efficiency. In fact, the minimum allowed spacing between RF channels largely depends on the quality of the baseband filter. Fig. 6 shows the measured receiver sensitivity (BER = 10-9) versus RF channel spacing. Significant sensitivity degradation results for channel spacing of less than 4.7 GHz due to inter-channel crosstalk. The results shown in Fig.6 are for a case where only two sub-carrier channels were used thus the maximum allowable modulation index is higher than a four-channel case, therefore, the sensitivity in Fig.6 is better than that in Fig.5. Further improvement of bandwidth efficiency might be achieved using microwave single-side-band modulation.
-55
-50
-45
-40
-35
-30
-25
-20
0 2 4 6 8 10 12 14 16 18 20 22Frequency (GHz)
Inte
nsity
(dB
m)
Figure 4, Example of the measured RF composite spectrum at the receiver.
Receiver power (dBm)
Bit-
erro
r rat
e
-38 -36 -34 -32 -30 -28 -26 -24 -22 -2010-10
10-4
10-5
10-6
10-7
10-8
10-9
10-11
10-3
Figure 5, Measured bit-error rate in a system with 4 sub-carrier channels before (solid points) and after (open points) a fiber transmission line with a –2640 ps/nm total dispersion.

-35
-34
-33
-32
-31
-30
-29
-28
-27
-26
4.4 4.6 4.8 5 5.2 5.4 5.6 5.8 FR channel separation (GHz)
Rec
eive
r se
nsiti
vity
(dB
m)
Figure 6, Measured receiver sensitivity (at BER = 10-9) versus frequency spacing between RF channels. Only two RF channel are used.
-35
-30
-25
-20
-15
-10
-5
SMF Equivalent Fiber Length (km)
Rec
eive
r sen
sitiv
ity (d
Bm
)
TDM
SCM
0 20 40 60 80 100 120 140 160 180 200
340 680 1020 1360 1700 2040 2380 2720 3060 34000
Accumulated dispersion (ps/nm)
Figure 7, Receiver sensitivity (at BER of 10-9) comparison between a 10 Gb/s TDM system and a 4-tone SCM system with 10Gb/s capacity.

Owing to the relative low data rates carried by each individual SCM channel, the SCM system can tolerate more chromatic dispersion than a TDM system of same capacity. We have made an experimental comparison of the system performance between an OC-192 TDM system and a 4-channel OC-48 SCM system. Fig. 7 shows the measured receiver sensitivities versus the accumulated dispersion. At back-to-back, the sensitivity of SCM system is about 6 dB worse compared to its TDM counterpart because of small modulation index in the SCM system. However, with the accumulated dispersion of higher than 1700 ps/nm (corresponding to 100 km of SMF), the performance of the TDM system deteriorates rapidly, while the performance of the SCM system remains essentially unchanged. Since the transmission fiber used in our experiment has high negative dispersion, the effect of fiber nonlinear crosstalk may be under estimated.
2-3. Carrier suppression
An important issue in an SCM system is inter-modulation distortion. This mainly comes from nonlinear modulation characteristic of opto-electronic modulators. For an OSSB modulation using dual electrode Mach-Zehnder (MZ) modulator, if the modulator is single-frequency modulated by cos(Ωt), the output optical field is [8]:
[ ] [ ]
[ ] [ ][ ]
+Ω−++Ω−+Ω+−−
=+Ω++Ω++=
........)3(sin)(2)2(sin)(2)(cos)(2)4/sin()(2
2
)2/cos(coscos2/cos2
3
210
0
tJtJtJtJE
ttttE
E
c
ccci
cci
ωβπωβπωβππωβπ
πβπωβππω
(1)
Where Ei(t) is the input optical field, ωc = 2πfc is the lightwave carrier frequency, Ω is the RF frequency of the modulation and βπ = πVac/Vπ is the normalized amplitude of the RF drive signal. Vπ is the switching voltage of the MZ modulator and Vac is the amplitude of the sinusoid drive signal. Since MZ modulators do not have a linear transfer function, significant high order harmonics can be generated if the modulation strength βπ is too high and this introduces crosstalk between channels. In practice βπ << 1 has to be maintained so that the signal term J1(βπ) is much higher than the higher order terms. For example, βπ has to be smaller than 0.4 to guarantee that the signal power is 20 dB higher than the power of the second harmonic. However, at βπ = 0.4, the power at CW carrier, represented by the J0(βπ) term in eq.(1), is approximately 11 dB higher than the signal. Obviously, a small modulation index means inefficient modulation and poor receiver sensitivity because the strong carrier component does not carry information. In order to increase the modulation efficiency while maintaining reasonably good linearity, optical carrier suppression may be applied using an optical notch filter. Fig.8 illustrates the motivation of optical carrier suppression. Note that the carrier cannot be completely suppressed because the energy in the carrier must be equal to or higher than that of the signal. Otherwise, signal clipping will occur [9], which may introduce significant waveform distortion. In our experiment, we used a Fabry-Perot (FP) tunable filter in the reflection mode to perform optical carrier suppression.

The implementation of optical circuit for carrier suppression is shown in Fig. 9 where an optical circulator is used to catch the reflected lightwave signal from the FP filter and an active control is used on FP to stabilize the notch frequency at the optical carrier. To verify the effect of carrier suppression on system performance, we have measured the receiver sensitivity (at BER = 10-9) for an SCM system with a single RF carrier and 2.5 Gb/s data rate. The power suppression ratio for the carrier was approximately 7 dB when the carrier suppression was applied. Fig.10 shows the measured receiver sensitivity with and without carrier suppression. It is evident that the sensitivity improvement introduced by optical carrier suppression is inversely proportional to the RF power used to drive the electro-optic modulator. Although a calibration was not made between the RF power and the modulation index in our experiment, they should be directly proportional. Fig. 10 indicates that for high modulation indices, system performance improvement induced by carrier suppression is less. The reason is that at high modulation index, the modulator already works in the nonlinear regime and carrier component is not a dominant term in the composite optical signal.
ω t
ω
Optical notch filter
t
Optical carrier
Carrier suppressed
Figure 8, Illustration of optical carrier suppression
FPI
Bias control
FPI reflection FPI transmission
Signal in
Signal out
Figure 9, Optical circuit for carrier suppression

2-4. Receiver Sensitivity
In this section, we analyze the sensitivity of a digital SCM system with an optically pre-amplified receiver. A simplified block diagram of this system is shown in Fig. 11. In an SCM optical system with N sub-carrier channels, similar to equation (1), the output electrical field from the electro-optic modulator is,
Ω+−
Ω−= ∑∑
==
N
kkkkc
N
kkkkc
i ttutttutE
E11
0 cos)(sinsin)(cos2
πβωπβω (2)
Where uk(t) is the normalized digital signal at the kth sub-carrier channel. For PSK modulation, uk(t) = ±1 and for ASK modulation uk(t) = 0, 1 to represent digital signal “0” and “1”, respectively. ωc is the carrier frequency and Ωk is the RF sub-carrier frequency of the kth channel.
-39
-37
-35
-33
-31
-29
0 2 4 6 8RF power to modulator (dBm)
Rec
eive
d se
nsiti
vity
(dB
m) no carrier suppression
with carrier suppression
Figure 10, Measured receiver sensitivity (at BER = 10-9) versus RF power used on the electro-optic modulator with and without optical carrier suppression. Only single RF channel is used at 8 GHz. Triangles: without carrier suppression and squares: with approximately 7 dB optical carrier suppression
mEDFA Laser Modulator
Digital
RF Carrier
LPF Fiber
Preamplified optical receiver
EDFA
Figure 11, Simplified block diagram of SCM system with amplified optical receiver

In order to keep higher order harmonics small and operate the modulator in the linear regime, the modulation has to be weak. Under the assumption of small-signal
modulation, 11
<<∑=
N
kkπβ and eq. (2) can be linearized as,
Ω+−−= ∑=
N
kkckkc
i ttutE
E1
0 )cos()(2
1)4/sin(2
ωπβπω (3)
Here the first term in the bracket represents the carrier and the second term is the signal. If optical carrier suppression is considered, eq. (3) can be modified as,
Ω+−−= ∑=
N
kkckkc
i ttutE
E1
0 )cos()(2
1)4/sin(2
ωπβζπω (4)
Where 10 ≤≤ ζ is the power suppression ratio of the carrier. At the receiver, the optical carrier beats with the sub-carriers at the photodiode, down converting the optical sub-carrier into the RF domain. The generated photocurrent at the receiver is
Ω+≈ℜ= ∑=
N
kkkks ttumIGEI
10
20 )cos()(11
ζη (5)
Where η is the system transmission and coupling loss, ℜ is the photodiode responsivity, G is the gain of the optical pre-amplifier, ℜ=ℜ= GPEGI ini 2/2
0 ηζ is the average photo-current, Pin is the average power of the optical signal reaching the pre-amplified optical receiver and πβ kkm 2= is the normalized modulation index. Obviously, the useful photo-current signal for the kth channel is
ζ/)cos()( ttumGPI kkkink Ωℜ= . In deriving eq. (5), a small-signal approximation has been used. Since receiver photo-current has to be positive, therefore
ζ≤Ω∑=
n
kkkk ttum
1)cos()( (6)
Eq.(6) sets a conservative approximation for the maximum amount of carrier suppression that can be applied without introducing clipping. In conventional analog SCM CATV systems with a large number of channels, clipping-induced signal-to-noise ratio (SNR) degradation is proportional to the power addition of all the channels [9]. In digital systems, however the performance is measured by BER. Because of the nonlinear relationship between SNR and BER determined by an error function, a small degradation in SNR may induce a large BER change at low BER levels. Although eq.(6) is a worst-case approach, it is appropriate for high capacity digital systems with a limited number of channels.
In order to calculate the receiver sensitivity, amplified spontaneous emission (ASE) noise generated by EDFA pre-amplifier must be considered. The ASE noise spectral density is,
ρ ν νase spn h G Fh G= − = −2 1 1( ) ( ) . (7)
Where nsp is the spontaneous emission factor, F is the noise figure of the EDFA, h is the Planck’s constant, v is the optical frequency, and G is the optical gain of the EDFA. Note that the factor 2 in front of nsp is there to account for both polarizations

of the ASE. After photo detection the optical ASE noise is converted into the electronic domain. Consider only signal-ASE beat noise, which is usually the dominant noise source in an optically pre-amplified receiver. Under Gaussian approximation, the double-sideband electrical power spectral density of signal-ASE beat noise is
GPi inasespsig ρ221 22 ℜ=− (8)
The factor ½ in eq. (8) accounts for the fact that signal has only a single polarization, the factor 2 in eq.(8) takes into account the double optical sidebands of the ASE noise (symmetric optical noise around the optical carrier). Since the noise is random, it can be decomposed into in-phase and quadrature components nc(t) and ns(t), respectively, and thus the total ac signal of the k-th RF channel entering the RF demodulator is
)sin()()cos()(/)cos()(1 ttnttnttumGPU kskckkkin Ω+Ω+Ωℜ= ζ (9)
Where the total noise power is
einasespsigesc GBPiBnn ρ2222 2221
21
ℜ==+ − , and 22sc nn =
Where Be is the spectral width of the signal baseband (2Be accounts for double RF sidebands).
At the RF demodulator, U1(t) coherently mixes with a local oscillator 2cos(Ωkt), the output of the demodulator is:
)(/)(2 tntumGPU ckkin +ℜ= ζ (10)
Where frequency-doubled components have been filtered out. Assuming a reasonable optical gain of the EDFA preamplifier, G >> 1, the signal-to-noise-ratio is therefore,
ζν
ζ
ρ
ζ
e
kkin
ein
kkin
easein
kkin
FhBtumP
GBGFhP
tumGP
GBP
tumGPSNR
2)(
)1(2
/)(
2
/)( 22
22≈
−ℜ
ℜ=
ℜ
ℜ=
(11)
It is worth mentioning that in conventional intensity modulation, direct detection optical systems, signal-dependent noise, such as signal-ASE beat noise, does not exist during signal “0”. However, in SCM optical systems, receiver noise is identical at signal “1”s and “0”s as long as the frequency of sub-carrier is higher than the data rate it carries.
Using PSK modulation, taking into account the fact that )1,1()( −∈tuk , therefore, in the ideal case without signal waveform distortion, the receiver Q value can be approximated as
ζζ e
kin
e
kinkin
FhBmPx
FhBmPmP
Q2222
)1(=
−−= (12)
Where x = 2 for PSK modulation.

For ASK modulation, )1,0()( ∈tuk and for QPSK, )2
1,21()( −
∈tuk , therefore, x =
1 for ASK and 2=x for QPSK. To achieve a bit-error-rate of 10-9 (Q = 6), the minimum required optical signal power has to be:
22288k
ein mx
BhFP
ζ= (13)
This value is commonly referred to as receiver sensitivity. In an SCM system, as the number of RF channels is increased, the modulation index of each channel has to be decreased to satisfy equation (6). Assuming an identical modulation index for all RF channels, we have ( ) Nmk /1/ ≤ζ . In addition, the receiver electrical bandwidth Be is determined by the data rate per RF channel. In a binary NRZ system, we can use
NBBe /7.0= where B is the total bit rate per sub-carrier channel. Fig. 12 shows a practical example of receiver sensitivity versus the number of RF channels. In this example, the total data rate per wavelength is 10 Gb/s and the optical amplifier noise figure is 5 dB. As shown in Fig. 12, receiver sensitivity degrades as the number of sub-carrier channels at each wavelength increases, this is mainly because of the decrease of the modulation index. For a BPSK system with N = 4, the minimum achievable receiver sensitivity is approximately –31 dBm.
In the sensitivity analysis presented so far, we have assumed that the optical bandwidth of the receiver is wide enough such that the optical noise is symmetric around the carrier (although optical signals are only at one side of the carrier because of the SSB modulation). If a narrowband optical filter is used in front of the receiver, optical noise on the mirror side of the optical signals may be removed and therefore the optical noise becomes single sided. Fig. 13 illustrates the effect of the narrowband optical receiver filter. If the bandwidth and center wavelength of the optical filter is properly arranged, the signal-ASE beat noise presented by eq. (8) will be halved and the receiver sensitivity will be improved by 3 dB.
-34
-32
-30
-28
-26
-24
-22
-20
-18
-16
-14
0 5 10 15 20 25 30 35
Number of RF channels
Rec
eive
r sen
sitiv
ity (d
Bm
)
ASK
QPSK
BPSK
Figure 12, Calculated receiver sensitivity versus the number of RF channels for ASK, BPSK and QPAS modulation formats. Total data rate is 10 Gb/s and the optical amplifier noise figure is 5 dB.

It should be pointed out that the receiver sensitivity presented so far did not include signal waveform distortion and inter-channel crosstalk. Signal waveform distortion may be introduced by non-ideal transfer function of RF circuitry and optical modulator, chromatic dispersion, self-phase modulation (SPM), and polarization mode dispersion (PMD). In an SCM optical system using OSSB modulation, since the datarate per sub-carrier channel is low and the system tolerance to chromatic dispersion is increased by N2 compared to a conventional TDM system at the same data rate per wavelength. SPM depends on the optical power per sub-carrier, with a fixed optical power per wavelength, the effect of SPM will decrease with N. However, we will show in section VI that PMD is likely a limiting factor in SCM optical systems. In addition, with a fixed optical modulator bandwidth, increasing the number of RF channels will decrease the frequency spacing between them. Although linear crosstalk can be minimized using high quality microwave filters, nonlinear crosstalk created during the transmission in the optical fiber may become significant. This will be discussed in the next section.
2-5. Crosstalk created by fiber nonlinearity
Cross-phase modulation (XPM) and four-wave mixing (FWM) are two of the most important sources of nonlinear crosstalk in multi-wavelength fiber-optic systems. Their effects are generally proportional to signal optical power and inversely proportional to the channel spacing [10,11]. In contrast to a conventional WDM system, an SCM optical system packs low data-rate RF channels tightly within the available modulation bandwidth of an optical modulator, and the optical power per RF channel is relatively low. The understanding of nonlinear crosstalk optical SCM systems is critical in the system design.
In the following evaluation, we assume that the total data rate carried by one wavelength is 10 Gb/s, the total RF bandwidth of the modulator is 20 GHz, the total optical power is 4 mW after each optical amplifier and each RF sub-carrier has the
f0 f0+f1 f0+f2f0-f1f0-f2 f0+f3 f0+f4 f0-f3f0-f4
Receiver optical filter
ASE noise floor
f0 f0+f1 f0+f2f0-f1f0-f2 f0+f3 f0+f4 f0-f3f0-f4
Figure 13, Illustration of receiver noise reduction by using a tuned narrowband optical filter

same optical power and data rate. We use a Gaussian approximation to quantify the level of nonlinear crosstalks due to XPM and FWM and evaluating their standard deviations normalized to the optical signal. For simplicity, we assume a non-dispersion-compensated optical system with 5 optically amplified fiber spans, each has 80 km of optical fiber and only the performance at the center channel is evaluated because it usually has the strongest nonlinear crosstalk.
The evaluation of XPM crosstalk follows the analysis in [11]. Fiber dispersion and thus the relative walk-off between adjacent RF channels, represented by jkjk Dd λ∆= , is an important parameter to determine XPM crosstalk. d jk >> β2 2Ω / was assumed in [11] but is no longer valid here because the modulation data rate is comparable to the frequency spacing between RF channels. In the above expressions, D is the fiber dispersion parameter, λ and ∆λjk are the average wavelength and the wavelength
separation between adjacent RF channels, respectively, Dcπ
λβ2
2
2 −= is the
dispersion coefficient, Ω is the baseband frequency, and c is the speed of light. In a system with N RF channels and M optical amplified fiber spans, the normalized noise power generated at the jth channel by XPM is
∑ ∫≠=
∞ΩΩΩ∆=
N
jkkMjkxpm dHLp
,10
2 )(),(σ (14)
With, 2
1
22
22
22
22
1
1
)()()(
)2/()exp()2/exp(
)2/()exp()2/exp(
]exp[)0,(2
),( ∑∑
=
−
=
Ω−Ω−
Ω+−−Ω−−
Ω+Ω−
Ω+−−ΩΩΩ
=Ω∆M
i
jk
ijki
jk
ijkii
n
nnjk
iki
Mjk
idiiLdiLi
idiiLdiLi
Ldip
Lp
βααβ
βααβ
γ
(15)
Here, H(Ω) is the receiver electrical power transfer function, α is the attenuation coefficient of the fiber, Li is the length of the i-th fiber span and LM is the accumulated fiber length of the whole system, )/(2 2 effji An λπγ = is the nonlinear coefficient, n2 is the nonlinear refractive index, λj and λk are the RF channel wavelengths, Aeff is the fiber effective core area, pk = |Ak|2 and pj = |Aj|2 are optical powers of the pump and the probe RF channels, respectively.
In an SCM optical system, we assume 50% of the optical power is in the carrier. Since the carrier is always CW, it does not contribute to cross phase modulation. Fig. 14(a) shows the normalized standard deviation due to XPM. The plot starts from 2 RF channels (with 5 Gb/s data rate per RF channel and 10 GHz channel spacing) and ends with 32 RF channels (with 312.5 MHz data rate per RF channel and 625 MHz channel spacing). Fig. 14(a) demonstrates that with the increase of the number of channels, the XPM crosstalk decreases monotonically. The effect of decreased channel spacing is approximately compensated by the decrease of signal optical power per channel. On the other hand, since the XPM spectral transfer functions have typically high-pass characteristics, especially at low frequencies [11], the decrease of

channel data rate, and thus the decrease of the baseband filter bandwidth, decreases the effect of XPM crosstalk at the large RF channel counts. Due to interference between XPM created by various amplified fiber spans, the XPM contribution versus channel spacing is usually not monotonic at small number of channels, this can also be explained by the non-uniformity of XPM spectral transfer function in the frequency domain [11].
-60
-55
-50
-45
-40
-35
-30
-25
2 4 6 8 10 12 14 16 18 20 22 24 26 28 30 32
σcr
eate
dby
XPM
cros
stal
k(d
B)
Number of RF channels
NZDSF
SMF(a)
Number of RF channels
-38
-34
-30
-26
-22
-18
-14
-10
2 4 6 8 10 12 14 16 18 20 22 24 26 28 30 32
σcr
eate
dby
FWM
cros
stal
k(d
B)
NZDSF
SMF
(b)
Figure 14, Calculated XPM (a) and FWM (b) crosstalk in SCM systems. Total data rate is 10Gb/s, total RF bandwidth is 20 GHz, 5 amplified spans each with 80 km of fiber, EDFA output optical power is 4 mW.

FWM is another source of nonlinear crosstalk created by Kerr effect in optical fibers. Assume that all beating components around the signal frequency fj are within the receiver bandwidth. Consider three channels, j, k and l, beat to generate a crosstalk at the nth channel. The frequency relation has to satisfy lkjnjkl fffff −+== , kjl ,≠ . Using small-signal approximation, assuming equal channel power and equal channel spacing, the crosstalk power generated by FWM has a simple expression:
∑ ∆+=
jkljkl
jkl
jklfwm x
GP22
2222 4
βαγ
σ (16)
With ))((2 2
lkljjkl ffffc
D−−=∆
πλβ (17)
Where Gjkl = 1 for two-tone products and 2 for three-tone products. P is the optical power per RF channel and xjkl represents a combined effect of the relative phase between the contributing waves and the statistics of the data signal [12]. In SCM optical systems with RF phase modulation, such as PSK, signal has the same optical power for digital ‘0’s and ‘1’s. Only consider the random phase relationship between different contributing waves, xjkl = ½ if all the powers are the same. However, in an SCM optical system the CW optical carrier contains at least half of the total optical power, Pcarrier = MP. Where M is the number of RF channels per wavelength P is the optical power per RF channel and Pcarrier is the optical power of the carrier. Although the CW carrier does not contribute to XPM process, it has to be considered in FWM analysis because of its high optical power. We can simply set 2/Mx jkl = if any one of j, k and l represents the carrier.
Fig. 14(b) shows the normalized standard deviation due to FWM. Since the effect of FWM is proportional to the signal optical power and inversely proportional to the square of the channel spacing, it generally increases with the increase of the number of channels as shown in Fig. 14(b). However, when the RF channel spacing is too small, there is negligible walk-off within the fiber nonlinear length. If jklβα ∆> , σfwm will no longer increase with the number of channels.
Comparing Fig.14(a) and Fig.14(b), it is evident that FWM is the major source of nonlinear crosstalk in SCM optical systems with low data rate per channel and extremely narrow spacing between RF channels. Although a low optical power level is desired for the reduction of FWM crosstalk, it hurts the system by reducing the SNR at the receiver. The estimation of maximum transmission distance of the system may require numerical simulations, which optimize optical power level according to the characteristics of optical amplifiers, optical fibers, dispersion compensation strategies, the number of wavelengths, the number of RF channels per wavelength and so on. In addition, PMD characteristic of the transmission fiber is also a big concern.
2-6. Effect of polarization-mode dispersion
It has been recognized in recent years that in high-speed fiber-optic transmission systems, PMD is one of the important sources of performance degradation. The phenomena of PMD can be easily explained in the time domain. An optical signal in a fiber is decomposed into two orthogonal polarization modes and each of them travels in slightly different speeds. This causes a differential group delay (DGD) of the

optical signals and, thus, introduces signal waveform distortion at the receiver. The generally accepted limit for DGD is about 15% of the bit time for the non-return-to-zero (NRZ) modulation format [13].
Another, yet equivalent, explanation of PMD is in the frequency domain, where we consider that two lightwave signals with slightly different wavelengths are launched into an optical fiber. Although the two lightwave signals have the same state of polarization (SOP) at the fiber input, their SOP may walk off from each other after propagating through the fiber. This SOP walk-off is caused by PMD and the amount of SOP walk-off is proportional to both wavelength separation between the two lightwave signals and the DGD of the fiber.
In an SCM optical system, the composite electrical signal at the receiver is produced by the heterodyne beating between the carrier and the sub-carriers. In order to maintain a stable and acceptable level of electrical signal at the receiver, the SOPs must be aligned between the carrier and the sub-carrier. Any SOP walk-off will introduce fading in the beating signal. If the frequency separation between the carrier and the sub-carrier is ∆ω in radians and the DGD of the fiber system is ∆τ in seconds, then the angle separation of SOP between these two frequency components on the Poincare coordinate is
ωτθ ∆⋅∆=∆
This formula has been used in fiber PMD measurements, and it is commonly referred to as the fixed-analyzer method [14]. Because of this SOP walk-off, the electrical signal at the receiver is decreased by a factor
)2/cos()2/cos( ωτθ ∆⋅∆=∆=A (18)
Since the noise at the receiver is not affected by this SOP walk-off, therefore, A is also the degradation factor of the receiver signal-to-noise-ratio (SNR). Fig. 15 shows the SNR degradation versus the accumulated system DGD. As an example, for 1 dB SNR degradation (A = -1 dB), and 15 GHz carrier/sub-carrier separation, the required system DGD has to be smaller than 10 ps. It is worth mentioning that the SOP walk-off induced SNR degradation is, to first order, independent of the data rate on each RF sub-carrier, it only depends on the frequency separation between the carrier and the sub-carrier. This is indeed a stringent limitation for the system.
This signal fading can also be explained in the time domain [15]. During fiber transmission, both the carrier and the sub-carrier are decomposed into fast and slow principal-states-of-polarization (PSPs). This causes a phase difference in the received sub-carrier signal at the photodiode. If we assume an equal amount of optical power is distributed into the fast and slow PSPs, the received sub-carrier component in the RF domain is,
)2/cos()]2/(cos[)()]cos())[cos((5.0)( τωτωτωωω ∆⋅∆⋅∆+∆=∆∆+∆+∆= ttatttatI
Where a(t) is the data signal carried by the sub-carrier. Obviously, the PMD-induced sub-carrier fading is proportional to )2/cos( τω ∆⋅∆ , which is identical to the amount of fading described by the polarization walk-off. Although the sub-carrier fading can be explained in two seemingly quite different ways, they originate from the same physical mechanism and the effect should not be double counted.

2-7. Summary of SCM optical systems
We have analyzed the performance of fiber-optic SCM transmission using OSSB both experimentally and theoretically. OSSB is an effective method to reduce the impact of fiber chromatic dispersion and increase bandwidth efficiency. Receiver sensitivity has been evaluated for SCM systems using optically pre-amplified receiver and a comparison has been made between different modulation formats. Optical carrier suppression was suggested to increase modulation efficiency while keeping MZ modulator inter-modulation crosstalk low. Since in SCM systems frequency spacing between adjacent RF channels is much narrower than a conventional DWDM system, we have evaluated the effect of nonlinear crosstalk in optical fibers created by XPM and FWM. We have demonstrated that FWM is the dominant source of nonlinear crosstalk in SCM optical systems. Although chromatic dispersion is not a limiting factor in SCM systems, polarization-mode dispersion has a big impact in the system performance if RF coherent detection is used in the receiver. In order to optimize the system performance, tradeoffs have to be made between data-rate per sub-carrier, levels of modulation, channel spacing between sub-carriers, optical power and modulation indices. A 10 Gb/s SCM test bed has been setup, in which 4 x 2.5 Gb/s data streams are combined into one wavelength, which occupies a 20 GHz optical bandwidth. Optical single-sideband modulation is used in the experiment. The measured results agree well with the analytical prediction.
-12
-10
-8
-6
-4
-2
00 20 40 60 80 100
20GH 15GH
10GH
5GHz
System DGD (ps)
Rec
eive
r SN
R d
egra
datio
n (d
B)
Figure 15, Calculated receiver sensitivity penalty caused by PMD for sub-carrier channels with several different RF frequencies.
3. PMD-insensitive SCM optical receiver using polarization diversity It has been discussed in section 2 that in SCM optical systems, the impact of fiber chromatic dispersion is minimized by using optical single-side-band (SSB) modulation. For this case, system tolerance to chromatic dispersion depends on the data rate on each individual sub-carrier channel. However, as shown in Fig.15, polarization-mode dispersion (PMD) has become a limiting factor in this type of optical system.
In an optical fiber with PMD, two distinct orthogonal polarization modes exist with different propagation constants and different group velocities. This is described as the differential group delay (DGD) between the two orthogonal principal-states-of-polarization (PSPs) of the fiber. Due to the statistical nature of the perturbations along the fiber, instantaneous DGD has a random value which generally follows a Maxwellian probability distribution. While SCM optical modulation distributes the total capacity of each laser transmitter into a number of subcarriers and therefore the data rate carried by each subcarrier is relatively low, the impact of PMD on SCM systems is determined mainly by the frequency of each RF subcarrier rather than the bandwidth of each individual subcarrier.
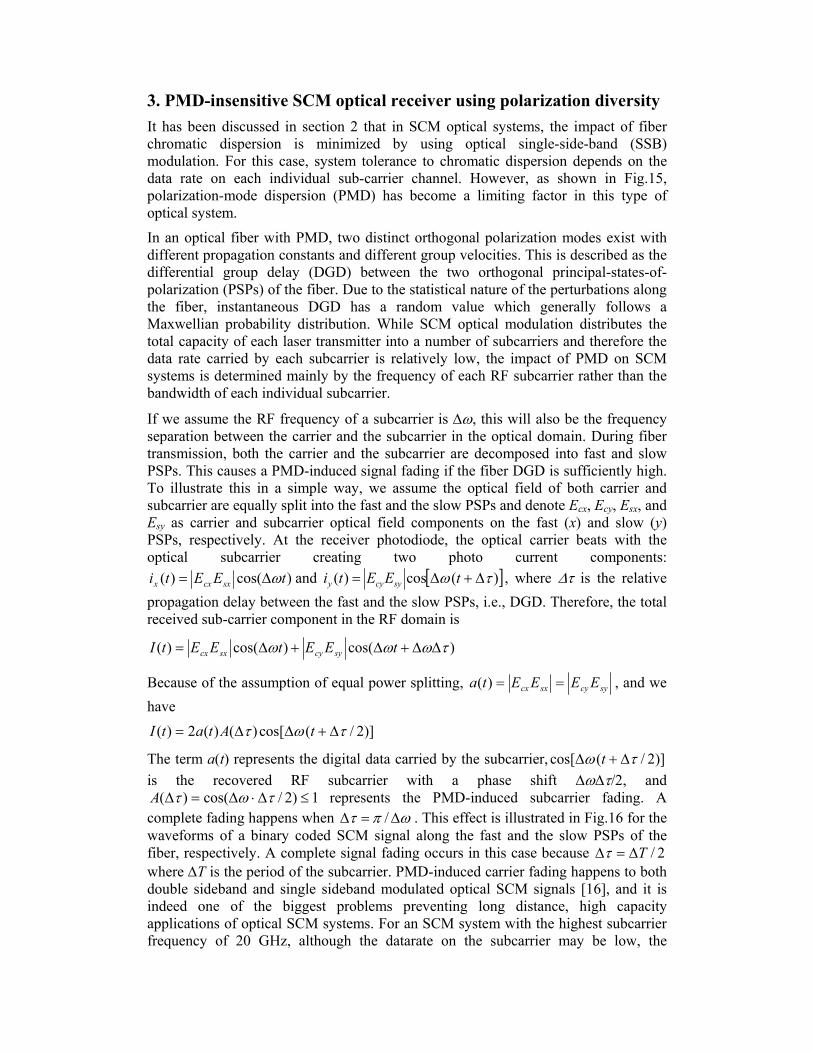
If we assume the RF frequency of a subcarrier is ∆ω, this will also be the frequency separation between the carrier and the subcarrier in the optical domain. During fiber transmission, both the carrier and the subcarrier are decomposed into fast and slow PSPs. This causes a PMD-induced signal fading if the fiber DGD is sufficiently high. To illustrate this in a simple way, we assume the optical field of both carrier and subcarrier are equally split into the fast and the slow PSPs and denote Ecx, Ecy, Esx, and Esy as carrier and subcarrier optical field components on the fast (x) and slow (y) PSPs, respectively. At the receiver photodiode, the optical carrier beats with the optical subcarrier creating two photo current components:
)cos()( tEEti sxcxx ω∆= and [ ])(cos)( τω ∆+∆= tEEti sycyy , where ∆τ is the relative propagation delay between the fast and the slow PSPs, i.e., DGD. Therefore, the total received sub-carrier component in the RF domain is
)cos()cos()( τωωω ∆∆+∆+∆= tEEtEEtI sycysxcx
Because of the assumption of equal power splitting, sycysxcx EEEEta ==)( , and we have
)]2/(cos[)()(2)( τωτ ∆+∆∆= tAtatI
The term a(t) represents the digital data carried by the subcarrier, )]2/(cos[ τω ∆+∆ t is the recovered RF subcarrier with a phase shift ∆ω∆τ/2, and
1)2/cos()( ≤∆⋅∆=∆ τωτA represents the PMD-induced subcarrier fading. A complete fading happens when ωπτ ∆=∆ / . This effect is illustrated in Fig.16 for the waveforms of a binary coded SCM signal along the fast and the slow PSPs of the fiber, respectively. A complete signal fading occurs in this case because 2/T∆=∆τ where ∆T is the period of the subcarrier. PMD-induced carrier fading happens to both double sideband and single sideband modulated optical SCM signals [16], and it is indeed one of the biggest problems preventing long distance, high capacity applications of optical SCM systems. For an SCM system with the highest subcarrier frequency of 20 GHz, although the datarate on the subcarrier may be low, the

accumulated DGD in the transmission fiber has to be much smaller than 25 ps in order to avoid carrier fading. Therefore, for most practical applications of reasonable transmission distance, active PMD compensation will have to be used.
PMD compensation is currently an active area of fiber-optic system research. In many adaptive PMD compensating systems [17,18], as shown in Fig.2(a), a polarization beam splitter (PBS) is used to separate the signals carried by the two PSPs. A polarization controller (PC) precedes the PBS to align the PSPs with the principal axes of the PBS. Following the PBS is a variable delay line to compensate for the link DGD. Finally, the two optical paths are recombined and the effects of PMD can be entirely compensated in the optical domain. Continuous monitoring of the residual PMD can be derived from the signal to provide feedback signal parameters for controlling the PC and the variable delay line. In such a system, the variable optical delay line is often implemented using a mechanical system to provide the needed DGD range. The speed, size, and reliability of this mechanism raise concerns.
In order to eliminate PMD-induced carrier fading in SCM systems, we propose to use a polarization diversity optical receiver as shown in Fig.2 (b) and 2 (c). The setup shown in Fig.2 (b) works for ASK SCM modulation scheme. Two photodiodes are used to detect the two PSP components at the output of the system. In order to ensure the alignment between the principal axis of the PBS and the PSP of the fiber, a polarization controller is used before the PBS. If the principal axis of the PBS is properly aligned with the PSPs of the optical fiber system, the amplitude of signals detected by both photodiodes will not be affected by PMD induced fading. The effect of PMD will be shown as a relative time delay between the waveforms carried by the two PSP components as shown in fig.1. An RF bandpass filter is used after each photodiode to select the desired subcarrier channel followed by an RF detector to detect the signal envelope and remove the high frequency subcarrier. The signals carried by the two PSPs are recombined after the subcarrier is removed and therefore, PMD-induced carrier fading is eliminated.
0 1 1 0 1 0
0 1 1 0 1 0
∆τ
t
Figure 16, Illustration of signal waveform of an SCM system carried by two PSPs of the optical fiber. ∆τ is the relative delay between the two PSP components.

Tx Polarization controller
Σ
LPFAmpControl circuit
To decision
Spliter
PB
(b)
Subcarrier
RF detection
BPF
RF detection
BPF
Tx Polarization controller
AmpControl circuit
To
Spliter
PBS
Tunable optical delay
LP
(a)
Polarization controller
Σ
LPF Amp.Control Circuit
To decision circuit
Spliter
PB
Amp
Amp
Phase shift
RF Local oscillator
(c)
Figure 17, Block diagrams of (a) optical domain PMD compensation using a tunable optical delay line, (b) PMD insensitive SCM optical receiver using polarization diversity with RF envelope detection, and (c) PMD insensitive SCM optical receiver using polarization diversity with RF coherent detection

For PSK modulated SCM systems with coherent RF detection, an RF local oscillator is used to detect the baseband signal which is carried as phase information on each subcarrier component. To eliminate PMD-induced carrier fading in this type of system, a voltage controlled phase shifter can be used as shown in Fig.2 (c). Since PMD is a relatively slow process, the phase tuning speed does not have to be very fast. This type of voltage controlled phase shifter is available commercially.
To verify this concept, we have first built a system transmitting only a subcarrier tone without any data on it. As shown in Fig.18(a), in this experiment, an 8 GHz sinusoid was applied to an external optical modulator. A PMD emulator was used to create a desired amount of DGD. A PBS was used to separate the two orthogonal PSPs and a polarization controller was used to align the principal axes of the PBS to the system PSPs. Two high-speed photodiodes were used to detect optical signals from both output arms of the PBS. A two-channel digital oscilloscope was used to display the detected signal waveforms.
With the DGD value of the PMD emulator set to zero, the two waveforms detected by both photodiodes are exactly in-phase, as shown in Fig.19. Adjusting the angle of the
LD
PB
MD PMD Emulator
8 GHz
Oscilloscope
Trigger
Fiber
PD 1
PD 2 POL POL
(a)
( )2
PB
Oscilloscope
Trigger
L MPMD Emulator
Pattern generator (2 Gb/s)
Mixer
( )2
POL POL
PD 1
PD 2
(b)Figure 18: Experimental setups: (a) An SCM system transmitting a non-modulated 8 GHz sub-carrier only, and (b) An SCM system transmitting 2 Gb/s pseudo-random NRZ data carried on an 8 GHz sub-carrier. LD: laser diode, MD: optical modulator, POL: polarization controller, PBS: polarization beam splitter, PD: photodiode, ( )2: square-law detector.

PBS only resulted in amplitude redistribution between the two waveforms. By introducing a DGD using the PMD emulator, these two waveforms are no longer in phase and the relative time delay between them is equal to the value of DGD. Fig.20 shows the measured waveforms when the DGD is set at 62.5 ps causing the two waveforms to be exactly out-of-phase. Fig.20 (a) was measured when the optical input is launched into the fiber with 50/50 splitting between the two PSPs and the principal axes of the PBS are aligned with the PSPs. In this case, the two waveforms have equal amplitude and opposite phase. Fig.20(b) was obtained when the optical input is launched into the fiber with 50/50 splitting between the two PSPs, but the principal axes of the PBS is aligned half way between the two PSPs. This is the worst case in terms of PMD effect and complete carrier fading happens at both photodiodes.
PD
PD
Figure 19: Measured RF waveforms at two photodiodes, using the experimental setup shown in Fig.3(a), when there is no PMD in the fiber system. Horizontal: 50 ps/div.
Figure 20: Measured RF waveforms at the two photodiodes using the experimental setup shown in Fig.3(a). Fiber system has 62.5 ps DGD. Horizontal scale: 50 ps/div. (a) PBS aligned with fiber PSP, signal SOP is midway between the fast and the slow PSPs. (b) PBS is midway between the two fiber PSPs, the signal SOP is also midway between the two PSPs. (c) PBS is aligned with the fiber PSPs, the signal SOP is aligned with the fast PSP PBS is aligned with the fiber PSPs, the signal SOP is aligned with the slow PSP
(a)
(b)
(c)
(d)
PD
PD
PD
PD
PD
PD
PD
PD

Fig.20(c) and 20(d) show the measured signal waveforms when the input optical signal is aligned with the fast and the slow fiber PSPs, respectively. To avoid carrier fading at each diode, it is essential to align the principal axes of the PBS with the PSPs of the fiber system. In this case, since the optical phase information is removed during photo detection, the sum of the RF signal power detected by the two photodiodes will be constant. The signal power partitioning in the two photodiodes will depend on the polarization alignment between laser source and the fiber PSPs.
In order to demonstrate the application of this concept in sub-carrier multiplexed digital systems, a digital transmission experiment was conducted using the setup shown in Fig.18(b). In this experiment a 2-Gb/s pseudo-random NRZ signal was carried by an 8-GHz RF sub-carrier. Again, a 62.5-ps DGD was artificially inserted by the PMD emulator. When the principal axes of the PBS are aligned with fiber system PSPs, no PMD distortion of signal waveforms results, but the relative amplitude of the waveforms detected by each photodiode depends on the signal SOP. Figs. 21(a) and 21(b) show the detected waveforms when the signal SOP is aligned with the fast and the slow PSP, respectively, and Fig.21 (c) shows the waveforms when signal SOP is midway between the two PSPs. In this measurement, even though the amount of system DGD is 62.5-ps, which is equivalent to a π phase shift of the RF carrier, the sum of the signal eye diagrams detected at the two receiver arms remain independent of the signal SOP. Because of the RF envelope detection after each photodiode, which eliminates the RF carrier, carrier fading is suppressed when combining the signal waveforms from the two branches.
On the other hand, if the principal axes of the PBS are not aligned with the fiber system PSPs, PMD-induced carrier fading would happen at both of the two detection arms. Fig.21(d) shows the detected waveforms when the principal axis of the PBS is set midway between the two PSPs of the fiber. In this worst case, complete signal fading results.
(a)
(b)
PD
PD
PD
PD
(d)
(c)
PD
PD
PD
PD
Figure 21: Measured signal eye diagrams at the two photodiodes using the experimental setup shown in Fig.3(b). Fiber system has 62.5 ps DGD. Horizontal scale: 200 ps/div. (a) PBS aligned with the fiber PSPs, signal SOP aligned with the fast PSP (b) PBS aligned with the fiber PSPs, signal SOP aligned with the slow PSP (c) PBS aligned with the fiber PSPs, signal SOP is midway between the fast and the slow PSPs (d) PBS is midway between the two fiber PSPs, the signal SOP is also midway between the two PSPs.

It is important to note that there is no tunable delay line used in this receiver. Even though carrier fading can be avoided by removing RF phase information before adding signals from each photodiode, the relative delay between the two branches still exists which is determined by the fiber system DGD. For typical SCM optical systems, where the data rate carried by each subcarrier is relatively low, a moderate amount of DGD will not significantly degrade system performance.
To conclude this section, we have demonstrated a carrier fading free optical receiver for SCM optical systems using polarization diversity. Since a tunable optical delay line is not required in this setup, it may have advantages over optical domain PMD compensation.
4. Multi-tributary OFDM Optical Transmitter Using Carrier-suppressed Optical Single-sideband Modulation In the previous two sections, we have discussed optical transmission using SCM technology and the reduction of PMD. In that case, optical detection was performed by the beating of carrier and the sub-carriers to translate signals from optical frequencies into FR frequencies. This is usually referred to as self-coherent detection. On the other hand, it is also possible to detect this multi-subcarrier optical signal using narrowband optical filters. Because the frequency separation between sub-carriers is very narrow, which is comparable to the datarate, this type of optical signal structure is commonly referred to as optical frequency-division multiplexing (OFDM) [19].
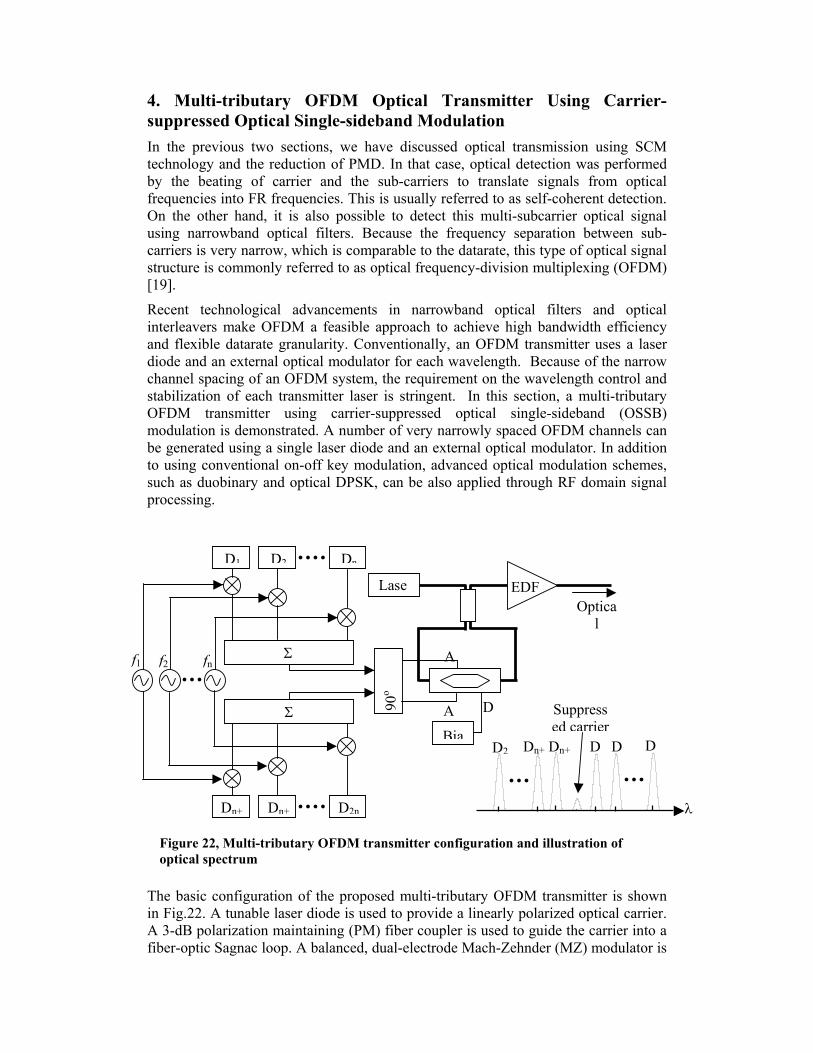
Recent technological advancements in narrowband optical filters and optical interleavers make OFDM a feasible approach to achieve high bandwidth efficiency and flexible datarate granularity. Conventionally, an OFDM transmitter uses a laser diode and an external optical modulator for each wavelength. Because of the narrow channel spacing of an OFDM system, the requirement on the wavelength control and stabilization of each transmitter laser is stringent. In this section, a multi-tributary OFDM transmitter using carrier-suppressed optical single-sideband (OSSB) modulation is demonstrated. A number of very narrowly spaced OFDM channels can be generated using a single laser diode and an external optical modulator. In addition to using conventional on-off key modulation, advanced optical modulation schemes, such as duobinary and optical DPSK, can be also applied through RF domain signal processing.
The basic configuration of the proposed multi-tributary OFDM transmitter is shown in Fig.22. A tunable laser diode is used to provide a linearly polarized optical carrier. A 3-dB polarization maintaining (PM) fiber coupler is used to guide the carrier into a fiber-optic Sagnac loop. A balanced, dual-electrode Mach-Zehnder (MZ) modulator is
Figure 22, Multi-tributary OFDM transmitter configuration and illustration of optical spectrum
f1
Σ
Dn+ Dn+ D2n
Σ
D1 D2 Dn
f2 fn
90o
Lase EDF
A
A
Bia
D Suppressed carrier
λ
D D DDn+Dn+D2
Optical

placed in the middle of the Sagnac loop. In order to maintain a stable operation, all fiber elements inside the Sagnac loop, including the pigtails of the MZ modulator are PM. This optical circuit allows us to generate carrier suppressed OSSB modulation similar to that described in section 2. In order to utilize both the upper and the lower sidebands of the optical spectrum, a 4-port, 90-degree RF hybrid is used. Two sets of data channels D1 – Dn and Dn+1 – D2n are simultaneously applied. Each data channel is mixed with a corresponding RF carrier before each set of channels are combined and sent to one of the two input ports of the 90-degree hybrid. As the result of OSSB modulation, one set of data channels D1 – Dn is translated to the upper sideband and the other set of channels Dn+1 – D2n is translated to the lower sideband of the output optical spectrum as illustrated in the inset of Fig.1. In this configuration, wavelength allocation of OFDM channels are determined by RF oscillators which can be precisely controlled. In an OFDM receiver, both direct detection using a narrowband optical filter for channel selection and coherent detection may be used. Compare to a conventional subcarrier multiplexed (SCM) optical system as described in section 2, an OFDM system has better tolerance to polarization-mode dispersion (PMD).
In our experiment, the overall RF bandwidth of the modulator/driver combination was approximately 10GHz. Fig.23 shows an example of the measured optical spectrum where 2 data channels each at 2.5Gb/s were used. The RF carrier frequency was 8GHz. More than 15dB suppression of unwanted sideband was achieved by biasing the MZ modulator at the quadrature point. The optical carrier was suppressed by the Sagnac loop so that it was approximately 13dB lower than the signal sidebands in our experiment. The reason of displaying the spectrum with only two data channels is because of the limitation of the OSA spectral resolution (0.05nm). With signal modulation turned on, the carrier power seemed to be increased on the spectrum, this was also largely due to the poor resolution of the OSA. The carrier suppression ratio could be further improved by selecting an ideal 3-dB coupling ratio for the PM coupler in the Sagnac loop [20].
Signal upper SB
Signal lower SB
Suppressed SB
Suppressed SB
Residual carrier
Composite spectrum
Wavelength (nm)
Opt
ical
spec
trum
(dB
)
Figure 23, Measured optical spectrum with an upper signal sideband, a lower signal sideband and residual carrier

In the direct-detection optical receiver, a fiber-Bragg grating (FBG) filter was used followed by an EDFA optical preamplifier. This FBG filter has a 0.5nm optical bandwidth and approximately 0.8dB/GHz roll-off rate at the edge. In order to select one from the two OFDM channels, the optical carrier frequency was tuned to the edge of the FBG filter. Fig.24 shows a measured BER plot at the datarate of 2.5Gb/s (27-1 PRBS). By turning on the non-selected channel in the opposite sideband, the receiver sensitivity was degraded by approximately 0.4dB. This degradation was mainly attributed the non-ideal selectivity of the FBG optical filter, which differentiated the selected and non-selected channels by approximately 13dB. The inset in Fig.24 shows a measured eye diagram with –39dBm input optical power.
It is important to note that in this transmitter, advanced modulation formats can also be applied. As an example, Fig.25 shows a measured heterodyne spectrum which compares a binary on-off key modulated signal on the upper sideband and a duo-binary modulated signal on the lower sideband, each carrying a 3.5Gb/s digital data. This spectrum was measured by translating the optical spectrum into RF band with an optical local oscillator. For binary on-off key modulation, the lower level of the data signal sent to the RF mixer was zero. On the other hand, to obtain the duo-binary modulation, the 3.5Gb/s data signal was filtered through a 1.1GHz lowpass filter [21] before being sent to the mixer. The average level of the filtered signal was set at zero to allow a 3-level signal format. Because of the lowpass filtering, the duo-binary signal occupies less optical bandwidth than it’s binary counterpart as demonstrated in Fig.25, it improves the bandwidth efficiency [21]. The eye diagram shown in Fig.25(b) has all the features of a typical duo-binary optical waveform.
Other modulation formats such as DPSK and carrier suppressed RZ can also be applied through similar RF domain signal processing in straightforward ways. It is worth mentioning that we have characterized a transmitter with only two OFDM channels, however adding more channels are straightforward as shown in Fig.26, where a heterodyne spectrum with 4x2.5Gb/s data channels are displayed. Although
Figure 24, BER plot with the non-selected channel on (dots) and off (triangles). Inset is a typical eye diagram (100ps/div)
10-11
-44
-43 -42 -41 -40 -39
2-channel1-channels
10-9
10-7
10-5
10-3
Signal optical power (dBm)
Bit
erro
r rat
e
2.5Gb/s

we were not able to make direct detection in this case due to the lack of appropriate narrowband optical filter, the selection of closely spaced OFDM channels has been demonstrated to be feasible [22].
To conclude this section, we have demonstrated a multi-tributary optical transmitter using carrier-suppressed optical single-sideband modulation. We were able to pack several very closely spaced OFDM channels using a single laser diode and optical modulator. In addition, bandwidth efficient duobinary modulation has been demonstrated in this transmitter to increase optical bandwidth efficiency. Other advanced modulation formats can also be applied through similar RF domain signal processing.
Figure 25, (a) Heterodyne spectrum. Upper sideband: duo-binary. Lower sideband binary. Each carries 3.5Gb/s data. (b) typical eye diagram of duo-binary signal (100ps/div)
(a) (b)
Figure 26, Measured heterodyne spectrum. 4-OFDM channels, each carries 2.5Gb/s data

5. Comparison of Modulation Formats and Their Compatibility with Different Fiber Types
In addition to SCM, several advanced optical modulation formats have proposed in recent years for ultra long distance digital optical transmission. Among them, carrier suppressed return to zero (CS-RZ), non-return-to-zero differential phase shift key (NRZ-DPSK) and return-to-zero differential phase shift key (RZ-DPSK) (which, sometimes is also referred to as intensity-modulated DPSK (IM-DPSK)) have shown promising experimental results with minimum transmitter-receiver complexity increase compared conventional NRZ modulation. There are a number of published papers comparing the performance of various optical modulation formats. For example, reference [24] compares NRZ and CS-RZ on-off-key (OOK) with NRZ-DPSK and RZ-DPSK in a 10 Gb/s WDM system with 45 GHz channel spacing. Reference [25] compares CS-RZ, RZ and single-sideband RZ in a 40Gb/s WDM system. Reference [26] compares RZ, IM-DPSK, and CS-RZ in a 40 Gb/s WDM system with channel spacing of 75 GHz. Reference [23] compares the performance of NRZ in different fiber types with the data-rates of 10Gb/s and 40Gb/s.
So far, there has been no comprehensive study detailing the impact of various optical modulation formats on different transmission fiber types and different data-rates in WDM systems. In fact, this comparative study is critically important for a telecommunication service provider like Sprint to make strategic decisions on the fiber plant investments and fiber-optic equipment purchasing.
In this project report, we present the results of our study focused on the comparison of optical system performance with standard single-mode fiber (SMF), large effective area fiber (LEAF), true-wave (TW) fiber and true-wave reduced-slope (TW-RS) fiber. Four different optical modulation formats have been considered for each fiber type, which are NRZ-OOK, CS-RZ-OOK, RZ-DPSK and NRZ-DPSK. In addition to computer simulations, we also provide our explanations on the major results and try to outline the physical mechanisms behind our conclusions.
In the first part of this report, we will introduce the operation principles of different modulation formats, describing their signal generation and detection, spectral characteristics and their tolerance to the linear and nonlinear impairments. In the second part, we describe the system configurations used in our simulation. In the third part, we will present our simulation results and compare system performance with different fiber types, different modulation formats. Systems with both 40Gb/s and 10Gb/s data-rates have been considered for the purpose of comparison. In the conclusion, we will present our preference and our recommendations. 5-1, Overview of Digital Optical Modulation Formats A. NRZ
For a long time, NRZ has been the dominant modulation format in IM/DD fiber-optical communication systems. The major reasons for using NRZ in the early days of fiber-optical communication are probably due to (1) it requires a relatively low electrical bandwidth for the transmitters and receivers (compared to RZ) and (2) it is not sensitive to laser phase noise (compared to PSK). In recent years, as optical communication is advancing to higher datarates, DWDM and long distance with optical amplifiers, NRZ modulation format may not be the best choice for high

capacity optical systems. However, due to its simplicity, and its historic dominance, NRZ can be used as a good reference for the purpose of comparison.
The schematic diagram of NRZ transmitter, with an external electro-optic intensity modulator, is shown in Fig27. The intensity modulator can either be Mach-Zehnder type or electro-absorption type, which converts an OOK electric signal with data rate of Rb into an OOK optical signal at the same data rate. The optical pulse width of each isolated digital “1” is equal to the inverse of the data-rate. Assume a transform limited pulse, the normalized optical spectral density is approximately ρ(f) = 0.25 sinc2(πfT), where T is the pulse width. In general, NRZ modulated optical signal has the most compact spectrum compared to that with other modulate formats. However, this does not mean that NRZ optical signal has superior resistance to residual chromatic dispersion in an amplified fiber system with dispersion compensation. In addition, NRZ modulated optical signal has been found to be less resistive to fiber nonlinear effect compared to its NR counterpart. A simple explanation is that different data patterns in a PRBS NRZ data stream require different optimum residual dispersion for the best eye opening. For example, an isolated digital “1” would generate more self-phase modulation (SPM) effect than continuous digital “1”s. Since SPM can be treated as an equivalent signal frequency chirp, it modifies the optimum value of the dispersion compensation in the system. The difference in the optimum dispersion compensation between an isolated digital “1” and continuous digital “1”s makes it impossible to optimize the residual dispersion in the system and thus makes the system performance vulnerable to the data patent-dependent fiber nonlinear effect. This effect is especially important in long distance fiber-optic systems.
LD MOD
NRZ transmitterNRZ optical signal
1 0 1 1
1 0 1 1
NRZ electric signal
Fig 27 Schematic of NRZ OOK transmitter
B. NRZ-DPSK
With optical intensity modulation, digital signal is represented by instantaneous optical power levels. Similarly, digital signal can also be represented by the phase of an optical carrier and this is commonly referred to as optical phase-shift-key (PSK). In the early days of optical communications, because of the immaturity of semiconductor laser sources, the optical phase was not stable enough for phase-based modulation schemes. In recent years, with the rapid improvement of single-frequency laser sources and the application of active optical phase-locking, PSK becomes feasible in practical optical systems. Specifically, differential phase shift key (DPSK) is the most often used format. In a DPSK encoder, the NRZ data is converted by a NOR gate first and then combined with its one-bit delay version by a XOR gate. This DPSK encoded electrical signal is then used to drive an electro-optic phase modulator to generate a DPSK optical signal. A digital “1” is represented by a π phase change in the optical

carrier between the consecutive data bits, while the signal optical power is always kept constant.
At a DPSK optical receiver, a one-bit-delay Mach-Zehnder Interferometer (MZI) is usually used as shown in Fig.28, which correlates each bit with its neighbor and makes the phase-to-intensity conversion. When the two consecutive bits are in-phase, they are added constructively in the MZI and results in a high signal level. Otherwise, if the there is a π phase difference between the two bits, they cancel each other in the MZI and results in a low signal level. In a practical DPSK receiver, the MZI has two balanced output ports (constructive port and destructive port). A photodiode can be used at each MZI output and then the two photocurrents are combined to double the signal level. In this configuration, the receiver sensitivity is improved by 3dB compared to using only a single photodiode. At a certain input optical signal level, this means a 3dB increase in the receiver Q (in terms of 20log(Q)). In a DPSK system, since signal amplitude swings from “1” to “-1”, in the ideal case, when a balanced photo-detection and matched optical filter is used, its receiver sensitivity is 3dB better than a conventional NRZ-OOK system, where the signal swings only from “1” to “1”.
For a DPSK optical signal with NRZ coding (NRZ-DPSK), the optical power is constant, however, the optical field shifts between “1” and “-1” (or the phase shifts between “0” and “π”) and the average optical field is zero. As a consequence, there is no carrier component in the optical field spectrum. This differs from the spectrum of NRZ-OOK, where the carrier component is strong.
LD E/O PhaseModulator
DPSKencoder
NRZ-DPSK transmitter NRZ-DPSK(optical)
NRZ data(electric)
1 0 1 1
0 ππ 0
power
phase
NRZ-DPSK Receiver
BPF
1 bit delay
PD
PD
MZI
-
DPSKoptical signal
Fig 28. Block diagrams of NRZ-DPSK transceiver and receiver

Intuitively, DPSK modulated signal has a constant optical power and its performance is not affected by optical power modulation-related nonlinear effects such as SPM and XPM. However, when the chromatic dispersion is considered, this conclusion is not entirely true. Phase modulations can be converted into intensity modulation through group velocity dispersion (GVD), and then SPM and XPM may contribute to waveform distortion to some extent [26]. In a long distance DPSK system with optical amplifiers, nonlinear phase noise is usually the limiting factor of system performance. Amplified spontaneous emission (ASE) noise generated by optical amplifiers are converted into phase noise through the Kerr effect nonlinearity in the transmission fiber, this disturbs the signal optical phase and causes waveform distortions. C. RZ-DPSK
In order to improve system tolerance to nonlinear distortion and to achieve a longer transmission distance, return-to-zero DPSK (RZ-DPSK) has been proposed. In this modulation format, an optical pulse appears in each bit slot, with the binary data encoded as either a “0” or a “π” phase shift between adjacent bits. In general, the width of the optical pulses is narrower than the bit slot and therefore, the signal optical power returns to zero at the edge of each bit slot. In order to generate the RZ-DPSK optical signal, one more intensity modulator has to be used compare to the generation of NRZ-DPSK. The block diagram of a RZ-DPSK transmitter is shown in Fig.29. First, an electro-optic phase modulator generates a conventional NRZ-DPSK optical signal, and then, this NRZ-DPSK optical signal is sampled by a periodic pulse train at the clock rate through an electro-optic intensity modulator.
LD E/O PhaseModulator
DPSKencoder
RZ-DPSK transmitter
NRZ-DPSK(optical)
NRZ data(electric)
1 0 1 1
E/O intensitymodulator
Pulse train(electrical)
power
0 0ππ
phase
Fig 29, Block diagram of RZ-DPSK transmitter
Because there is an additional bit-synchronized intensity modulation, RZ-DPSK is also referred to as intensity modulated DPSK (IM-DPSK). In this modulation format, the signal optical intensity is no longer constant, this will probably introduce the sensitivity to SPM. In addition, due to the narrow pulse intensity sampling, the optical spectrum of RZ-DPSK is wider than a conventional NRZ-DPSK. Intuitively, this wide optical spectrum would make the system more susceptible to chromatic dispersion. However, in long distance optical systems, periodic dispersion compensation is often used and RZ modulation format makes it easy to find the optimum dispersion compensation because of its regular bit patterns.
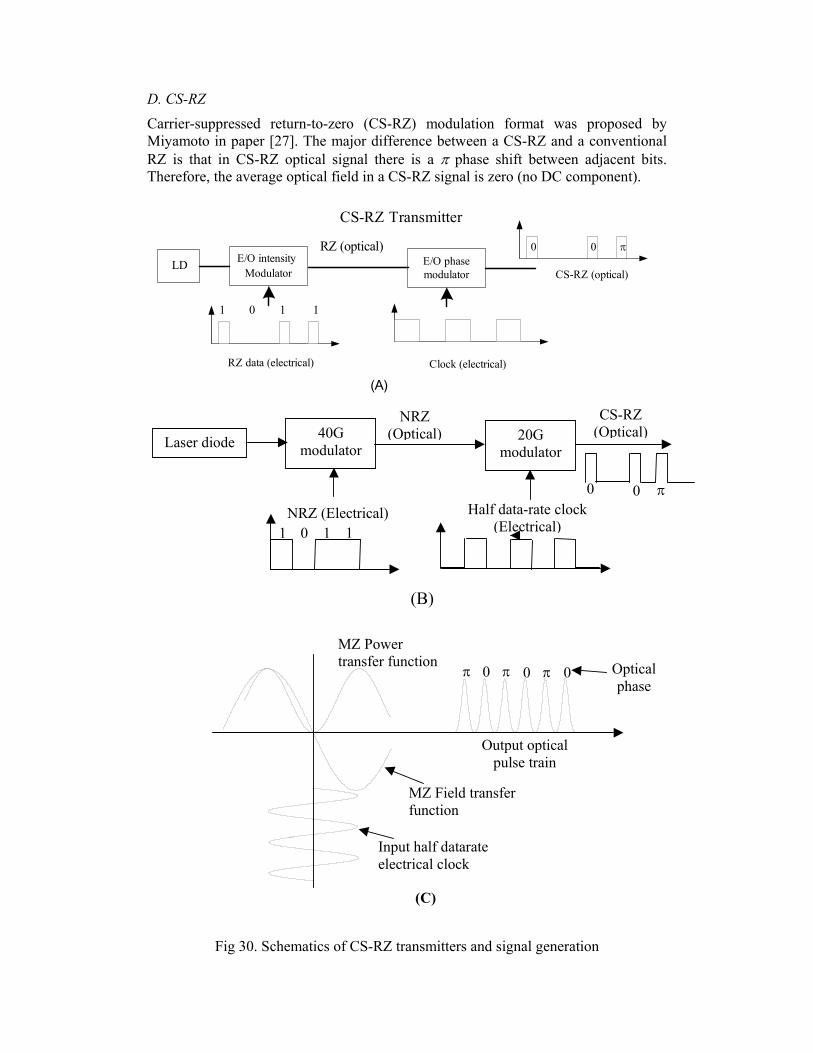
D. CS-RZ
Carrier-suppressed return-to-zero (CS-RZ) modulation format was proposed by Miyamoto in paper [27]. The major difference between a CS-RZ and a conventional RZ is that in CS-RZ optical signal there is a π phase shift between adjacent bits. Therefore, the average optical field in a CS-RZ signal is zero (no DC component).
LD E/O intensityModulator
CS-RZ Transmitter
RZ (optical)
RZ data (electrical)
E/O phasemodulator
Clock (electrical)
1 0 1 1
0 π0
CS-RZ (optical)
(A)
Fig 30. Schematics of CS-RZ transmitters and signal generation
MZ Field transfer function
MZ Power transfer function
Input half datarate electrical clock
Output optical pulse train
π π π 0 0 0 Optical phase
(C)
Laser diode 40G modulator
20G modulator
NRZ (Electrical)
NRZ (Optical)
Half data-rate clock (Electrical)
CS-RZ (Optical)
1 0 1 1
0 0 π
(B)
In the frequency domain, this translates into a carrier-suppression in the optical spectrum. In general, the generation of a CS-RZ optical signal requires two electro-optic modulators as shown in Fig.30(A). The first intensity modulator generates a conventional chirp-free RZ optical signal and the second electro-optic phase modulator produces a π optical phase shift between adjacent bits. In this transmitter configuration, the modulation bandwidths of both of these two electro-optic modulators have to be in the same level as the data rate. Fig.30(B) shows an alternative CS-RZ transmitter scheme. In this configuration, the first intensity modulator encodes the NRZ data. The second Mach-Zehnder type intensity modulator is biased at the minimum power transmission point and driven by a sinusoid at the half data rate. As illustrated in Fig.30(C), a MZ intensity modulator biased at this condition performs frequency doubling for the modulating signal and the output pulse train is phase alternated between adjacent bits. This configuration reduces the bandwidth requirement for the electro-optical modulators. In fact, the bandwidth required for the second modulator is only a half of the signal data rate.
CS-RZ is another modulation format considered to have better tolerance to fiber nonlinearity and residual chromatic dispersion. Phase alternating between adjacent bit slots reduces the fundamental frequency components to half of the data rate and regular RZ intensity bit pattern makes it easy to find the optimum dispersion compensation. In addition, carrier suppression reduces the efficiency of four wave-mixing in WDM systems.

5-2, Description of Systems A. Schematic of System Setup In order to compare the transmission performances of various advanced modulation formats and their impact in the selection of optical fiber types, we have performed a systemic computer simulation. The overall system configuration is shown in Fig.31. Both 40Gb/s and 10Gb/s data rate per wavelength were considered. The total system capacitor was assumed to be 1.6Tb/s. For 40Gb/s data-rate, 40 wavelength channels were used with the channel spacing of 100GHz (or equivalently 0.8nm). For 10Gb/s data-rate, we have used 160 wavelength channels with 25GHz (0.2nm) channel spacing. In both cases, the bandwidth efficiency is 25%. Simulations were performed in the C-band (1530nm – 1565nm). Periodic optical amplifications are provided by erbium-doped fiber amplifiers (EDFA). In an EDFA, a piece of dispersion compensating fiber (DCF) is sandwiched between two sections of erbium-doped fibers. The noise figure of each combined EDFA is 4dB and the optical power input into the DCF is always controlled to be less than –25dBm to avoid the nonlinear effect in the DCF. At the optical receiver, an optical pre-amplifier is used at each wavelength channel after the DEMUX to provide a +2dBm optical signal power for optical detection at the photodiode. Detailed system parameters are listed in Table 1, which includes the wavelength setting of channels, channel spacing, receiver optical bandwidth (channel bandwidth in optical DEMUX), and receiver electrical bandwidth.
For the purpose of comparison and identification of degradation sources, we have also calculated the performances of systems with single wavelength. In these cases, no optical MUX and DEMUX were used in the system. The single-wavelength carrier is set as 193.9THz, corresponds to Channel No.20 in 40 GHz system or Channel No.80 in 10 GHz system. There is no optical filter used in the transmitter and a bandpass optical filter centered at 193.9 THz was used in the receiver with the same characteristics as the DEMUX in WDM systems.
Four different fiber types were used in the simulations. They are Standard Single Mode Fiber (SMF), True Wave fiber (TW), True Wave-Reduced Slope fiber (TW-RS) and Large Effective Area Fiber (LEAF). Tabel 2 lists the major physical parameters of these fibers. The parameters of dispersion compensation fiber (DCF) are also listed in Table 2. Except for a different dispersion slope of DCF used with each different transmission fiber to make perfect slope compensation, other DCF parameters were assumed to be identical when used in different transmission fiber systems. Although some of these DCFs may not exist as standard products in the market, this assumption is essential for making fare comparisons between different transmission fiber types.
Another feature in the system is the dispersion pre-compensation module inserted immediately after the WDM multiplexer. For each different modulation format at each power level and each fiber type, the single-channel transmission performance is optimized by adjusting the value of pre-compensation from –1000 ps/nm to 0 ps/nm. Then this optimum value of pre-compensation is used in the corresponding WDM scenario (the multi-channel system using the same modulation format, same fiber types and same power level per channel as the single channel case). In WDM systems simulation, we set the residual dispersion of central wavelength channel at frequency of 193.9THz to zero by adjusting the length of DCFs in the transmission line. For channels other than the central channel, we adjusted the value

of the tunable dispersion compensator at each wavelength after DEMUX to compensate for the residual dispersion at that wavelength. The insertion losses of both the MUX at the transmitter and the DEMUX at the receiver were neglected.
MUX
Pre-compensation
DCF Transmissionfiber
DCF
1st span
DEMUX
Transmissionfiber
DCF
Nth span
TunableDC PD
Pre-amp2dBm
TunableDC PD
Pre-amp2dBm
LD-1 Transmitter
Data
LD-M Transmitter
Data
Fig 31 Schematic of WDM System Setup

Table 1. System Parameters
10 GHz system 40 GHz system Number of channels
160 40
Channel wavelengths
Ch1 … Ch80 … Ch160 1563.1nm…1547.2nm…1531.4nm
Ch1 … Ch20 … Ch40 1562.5nm…1547.2nm…1531.4nm
Channel spacing 25 GHz 100 GHz Total capacity 1.6 Tb/s 1.6 Tb/s Optical filter in
DEMUX 20 GHz Bessel filter, 6th order 80 GHz Bessel filter, 6th order
Bandwidth of LPF in receiver
7 GHz Bessel filter, 6th order 28 GHz Bessel filter, 6th order
Length of trans. fiber per span
80 km 80 km
Number of spans 5, 10, 15, 20 5, 10, 15, 20 Dispersion
Management 100% dispersion compensated
ideal dispersion slope compensated 100% dispersion compensated
ideal dispersion slope compensated Output power of
preamplifier +2 dBm per channel +2 dBm per channel
NF of EDFA 4dB 4dB Table 2: Physical Parameters of all kinds of Fiber
Dispersion D @ 1550nm [ps/nm/km]
Dispersion slope S @1550nm [ps/nm2/km]
Nonlinear refractive index n2
[10-20 m2/W]
Effective core area Aeff [µm2]
Fiber attenuation α [dB/km]
Standard SMF 17 0.058
2.8 80
0.25
DCF for SSMF -90 1790058.0 −
× 4.3 14.3 0
TW 3.5 0.08
3.45
45
0.25
DCF for TW -90 5.3
9008.0 −×
4.3 14.3 0
TW-RS 4.4 0.045 3.2
55 0.25
DCF for TW-RS -90 4.4
90045.0 −×
3.0
14.3 0
LEAF 3.7706 0.11
3.0
72 0.25
DCF for LEAF -90 7706.39011.0 −
×4.3 14.3 0

B. Computer Simulation Model A commercial simulation package “VPI transmission maker” was used in this work. We have made a number of assumptions in the simulations: (1) the rise and fall time of the electrical data signals is one quarter of the data period. (2) the electro-optic intensity modulator is chirp-free. (3) 212-1 PRBS with 512 bits is used as the data pattern (4) nonlinearity in dispersion compensating fibers is negligible (5) no forward error correction (FEC) is used. The simulator finds the output waveforms by solving the nonlinear Schrodinger equation using the split-step Fourier Transformation. In order to calculate the Q value at the receiver, the accumulated ASE noise from optical amplifiers are combined analytically with the eye opening in the waveform by
σσµµ
01
01
+
−=Q
Where µ1 and µ0 are average signal levels at logical “1”s and “0”s respectively, and σ1 and σ0 are noise standard deviations for at logical “1”s and “0”s. In the simulation of DPSK optical systems, we have used a single detector. In the ideal case with only linear optical noise, the receiver 20log(Q) would be 3dB lower than the receiver using double balanced photodiodes. In practice, however, in long distance, optically amplified DPSK optical systems, nonlinear phase noise converted from ASE intensity noise through fiber Kerr effect nonlinearity becomes significant. In this case, the improvement of using double balanced photodiodes in the receiver is reduced. In the DPSK simulation results reported in the next section, we have added 1.5dB to the calculated 20log(Q) to represent this effect.
In WDM optical systems, because of the nonlinear crosstalk, the middle channel generally has the worst performance. Therefore, in our simulations, the Q factor of the middle channel (Ch20 in the 40 GHz system or Ch80 in the 10 GHz system) is measured in all cases.

5-3, Simulation Results Based on the system described above, a comprehensive computer simulation effort was devoted to compare several optical modulation formats and their performance in different fiber types. In addition to presenting the results of WDM optical systems, performances of systems with single channel are also presented for comparison. Both 40Gb/s and 10Gb/s systems were investigated and the data rate choice different fiber types will be discussed. A. 40 Gb/s Optical systems The simulated system Q factor versus the number of fiber spans for 40Gb/s data rate are presented in this section and shown from Fig.32 to Fig.36.
Fig.32 shows the system performance using NRZ modulation. Fig.32(a), compares single-wavelength transmission performance between SMF-28 and LEAF. It is obvious from this figure that LEAF fiber performs better than SMF-28 and that the discrepancy becomes more significant with increasing number of spans. Since this is only a single channel in the system and no nonlinear crosstalk is involved, this degradation is attributed to the single effect of SPM.
Fig.32(b) shows the simulated result of a 40 channel WDM system where the channel bit-rate and carrier spacing are 40 Gb/s NRZ and 100 GHz, respectively. In addition to SPM, nonlinear cross-talks such as XPM and FWM are now also involved. Comparing Fig.32(a) withFig.32(b), it is evident that the Q-value for the system using LEAF fiber is decreased significantly because of the nonlinear crosstalk while there is only a small degradation in the Q-value for the system using SMF-28. The high local dispersion of SMF-28 created a strong walk-off between WDM channels during transmission and it minimizes the nonlinear crosstalk between them. In this particular system, however, SMF-28 still provides the lowest Q-value after 15 spans of transmission among all four fiber types. The low nonlinear crosstalk penalty owed to a high local dispersion in SMF-28 did not offset the high SPM penalty in a DWDM application.
It is important to note that the fiber related performance strongly depends on the chosen optical signal modulation format. Fig.33(a) shows an example of the system performance using a carrier-suppressed return-to-zero (CS-RZ) modulation format on both SMF-28 and LEAF fibers. To obtain this plot, a single channel 40 Gb/s data rate was used. Comparing Fig.33(a) with Fig.32(a) it is evident that the performance difference between SMF-28 and LEAF is smaller by using CS-RZ. This is attributed to the improved dispersion tolerance of CS-RZ which reduces the penalty due to SPM. Similarly, Fig.33(b) shows the simulated result of a 40 channel WDM system where the channel bit-rate and carrier spacing are 40 Gb/s CS-RZ and 100 GHz, respectively. All the four fiber types were tested here for comparison. Although LEAF still provides the best performance at long transmission distances, the difference between LEAF and SMF-28 is very small.

5 10 15 2010
12
14
16
18
20
22
24
26+3dBm/ch, 1*40GHz system, NRZ format,Q vers. # of spans
N spans
20lo
g(Q
) [dB
]SMFLEAF
5 10 15 208
10
12
14
16
18
20
22
24+3dBm/ch, 40*40GHz system, NRZ format,Q vers. # of spans
N spans
20lo
g(Q
) [dB
]
TW-RSSMFLEAFTW
(a) (b) Fig 32. NRZ in 40 GHz systems, 3dBm per-channel average power
(a) Single Channel and (b) 40-λ WDM with 100GHz channel spacing
5 10 15 2017
18
19
20
21
22
23
24
25
26+3dBm/ch, 1*40GHz system, CS-RZ format,Q vers. # of spans
N spans
20lo
g(Q
) [dB
]
SMFLEAF
(a) (b) Fig 33. CS-RZ in 40 GHz systems, 3dBm per-channel average power (a) Single Channel and (b) 40-λ WDM with 100GHz channel spacing
5 10 15 2014
15
16
17
18
19
20
21
22
23
24+3dBm/ch, 40*40GHz system, CS-RZ format,Q vers. # of spans
N spans
20lo
g(Q
) [dB
]
TW-RSSMFLEAFTW

Fig.32 and Fig.33 demonstrated that in 40Gb/s optical systems, SPM is one of the major contributors for system performance degradation. Especially for SMF-28, which has the highest local chromatic dispersion, the effect of SPM is the strongest. It is noticed that both NRZ and CSRZ are intensity modulation-based optical systems and SPM is originated from the signal intensity modulation. Intuitively, optical phase modulation-base optical systems would significantly reduce the effect of SPM because the optical power is mot modulated.
Fig.34 shows the system performance using NRZ-DPSK modulation. Fig.34(a), compares single-wavelength transmission performance between SMF-28 and LEAF. In this case, there is almost no performance difference between SMF-28 and LEAF in this single-channel system because SPM is not significant here. When multi-channel WDM is considered as shown in Fig.34(b), nonlinear cross-talks such as XPM and FWM are involved. Nonlinear crosstalks introduce strong performance degradation in fiber systems with low chromatic dispersions, while the Q value reduction for the system with SMF-28 is not significant. The high local dispersion of SMF-28 created a strong walk-off between WDM channels during transmission and it minimizes the nonlinear crosstalk between them. Fig.34(b) clearly demonstrated that in a 40Gb/s multi-channel WDM optical system with 100GHz channel spacing, SMF-28 has the best performance among all fiber types when NRZ-DPSK modulation is used. In this case, the optimum optical power level per channel is 0dBm.
Another modulation format we have investigated is RZ-DPSK [30]. Fig.35 summarizes the simulation results for this modulation format. Once again, Fig.35(a) compares single-wavelength transmission performance between SMF-28 and LEAF. Because of the added intensity modulation in RZ-DPSK systems, the effect of SPM cannot be neglected. Therefore, LEAF performs better than SMF-28 in this single
5 10 15 2016
17
18
19
20
21
22
23
240dBm/ch, 1*40G system, NRZ-DPSK format,Q vers. # of spans
N spans
20lo
g10(
Q) [
dB]
SMFLEAF
5 10 15 206
8
10
12
14
16
18
20
220dBm/ch, 40*40G system, NRZ-DPSK format,Q vers. # of spans
N spans
20lo
g10(
Q) [
dB]
TW-RSSMFLEAFTW
(a) (b) Fig 34. NRZ-DPSK in 40 GHz systems, 0dBm per-channel average power
(a) Single Channel and (b) 40-λ WDM with 100GHz channel spacing

channel case. However, compared to other intensity modulation formats, the performance difference between LEAF and SMF-28 is less significant with RZ-DPSK and there is only an approximately 1.5dB difference in the receiver Q value at the 20th span. When multi-channel WDM is considered as shown in Fig.35(b), the performance difference between SMF-28 and LEAF becomes negligible. Stronger nonlinear crosstalk in low local dispersion fibers, such as LEAF, in DWDM applications offsets the strong SPM penalty in high local dispersion fibers such as SMF-28. It is interesting to note that using this modulation format, all fiber types have similar performance except for the poor performance of the TW fiber. This is because the nonlinear parameter γ for the TW fiber is particularly high.
To summarize, for 40Gb/s optical systems with intensity modulation, SPM is one of the most important sources of performance degradation. For high local dispersion fibers such as SMF-28, the effect of SPM is stronger than low local dispersion fibers such as LEAF and TW-RS. On the other hand, SMF-28 has lower sensitivity to nonlinear crosstalk in WDM systems because of the rapid walk-off between adjacent wavelength channels. When optical phase modulation is applied, such as NRZ-DPSK, SPM is not a big concern. In this case SMF-28 outperforms other types of fibers in WDM systems.
Overall, however, the best performance for a transmission distance of 1,600km (20 spans) was obtained by using RZ-DPSK. With this modulation format, SMF-28, LEAF and TW-RS fibers have similar performances. If there is some way to compensate for the effect of SPM, SMF-28 would become the best choice of the fiber type. We will discuss this possibility at the end of this report.
5 10 15 2018
19
20
21
22
23
24
25
26
27
28+3dBm/ch, 1*40G system, RZ-DPSK format,Q vers. # of spans
N spans
20lo
g10(
Q) [
dB]
SMFLEAF
5 10 15 206
8
10
12
14
16
18
20
22
24+3dBm/ch, 40*40G system, RZ-DPSK format,Q vers. # of spans
N spans
20lo
g10(
Q) [
dB]
TW-RSSMFLEAFTW
(a) (b)
Fig 35. RZ-DPSK in 40 GHz systems, 0dBm per-channel average power (a) Single Channel and (b) 40-λ WDM with 100GHz channel spacing

B. 10 GHz system In general, the effect of SPM is proportional to the square of the signal data rate. Form this point of view a 10Gb/s optical system would be much more suitable for SMF-28 because of its high tolerance to nonlinear crosstalk. To verify this point, we have also performed computer simulations based on 10Gb/s data rate in a narrower channel spacing (25GHz) DWDM systems. Compared to 40Gb/s per-channel with 100GHz channel spacing, this 10Gb/s system has the same bandwidth efficiency.
The results of 10 GHz system are presented in this section in Fig 36 and Fig 37. The optical power levels per wavelength used in the simulation was -3dBm for all the four different modulation format to achieve the best performances. At this signal optical power level, we have confirmed that SPM is not a big concern in 10Gb/s systems. Fig.36 compares the Q-values between the SMF-28 and the LEAF fiber systems for a single-channel transmission using 4 different modulation formats.
Fig.36 shows that for single wavelength operation at 10Gb/s data-rate, SMF-28 and LEAF fibers have almost identical performances for all the 4 different optical modulation formats. In this case, the receiver Q value reduction at larger number of
5 10 15 2022
23
24
25
26
27
28
29-3dBm/ch, 1*10G system, RZ-DPSK format,Q vers. # of spans
N spans
20lo
g10(
Q) [
dB]
SMFLEAF
5 10 15 2019
20
21
22
23
24
25
26-3dBm/ch, 1*10G system, NRZ format,Q vers. # of spans
N spans
20lo
g10(
Q) [
dB]
SMFLEAF
5 10 15 2020
21
22
23
24
25
26-3dBm/ch, 1*10G system, CS-RZ format,Q vers. # of spans
N spans
20lo
g10(
Q) [
dB]
SMFLEAF
5 10 15 2020
21
22
23
24
25
26
27-3dBm/ch, 1*10G system, nrzdpsk format,Q vers. # of spans
N spans
20lo
g10(
Q) [
dB]
SMFLEAF
(a) (b)
(c) (d)
Fig 36. Comparison between SMF-28 and LEAF fibers in a single channel 10 GHz system, -3dBm per-channel average power. (a) NRZ (b) CS-RZ (c) NRZ-DPSK and (d) RZ-DPSK

spans is mainly due to the accumulated ASE noise of the optical amplifiers. Fig.36 clearly suggested that the effect of SPM is not significant in a 10Gb/s system at this power level. For WDM systems, on the other hand, nonlinear crosstalk will have to be considered.
Fig.37 shows the simulated Q values for 10Gb/s DWDM systems with 160-wavelength, 25GHz channel spacing and -3dBm average signal optical power per channel. All the four optical modulation formats were investigated each operating with different fiber types. It is not surprising that SMF-28 always has the best performance because of its high local dispersion and thus high resistance to nonlinear crosstalk compared to other types of fibers with low local dispersion.
By comparing results in Fig.37 for 10Gb/s systems with those for 40Gb/s systems shown in Fig.32 – Fig.35, it is quite clear that at 20 fiber spans, the performance of 10Gb/s systems are always better than that of the 40Gb/s systems although they have the same optical spectral efficiency. In addition, SMF-28 has clear competitive advantages for relatively low data rate DWDM systems with narrow channel spacing.
5 10 15 2012
14
16
18
20
22
24
26-3dBm/ch, 160*10G system, NRZ format,Q vers. # of spans
N spans
20lo
g10(
Q) [
dB]
TW-RSSMFLEAFTW
5 10 15 205
10
15
20
25-3dBm/ch, 160*10G system, CS-RZ format,Q vers. # of spans
20lo
g10(
Q) [
dB]
TW-RSSMFLEAFTW
N spans
5 10 15 2018
19
20
21
22
23
24
25-3dBm/ch, 160*10G system, nrzdpsk format,Q vers. # of spans
N spans
20lo
g10(
Q) [
dB]
TW-RSSMFLEAFTW
5 10 15 2014
16
18
20
22
24
26-3dBm/ch, 160*10G system, RZ-DPSK format,Q vers. # of spans
N spans
20lo
g10(
Q) [
dB]
TW-RSSMFLEAFTW
(a) (b)
(c) (d)
Fig 37. 160-λ, 10Gb/s systems with 25GHz channel spacing and -3dBm per-channel average power (a) NRZ (b) CS-RZ (c) NRZ-DPSK and (d) RZ-DPSK

5-4. Discussion: So far, we have investigated the performance of 10Gb/s and 40Gb/s optical systems with various optical modulation formats and various types of fibers. For 10Gb/s DWDM systems with narrow channel spacing, nonlinear crosstalk originated from XPM and FWM are major sources of system performance degradation. No matter what optical modulation format was used, standard single-mode fiber (SMF-28) always had the best performance compared to other types of fibers. This was due to the high local dispersion of SMF-28, which created a strong walk-off between different wavelength channels and reduced the effect of nonlinear crosstalk. On the other hand, for 40Gb/s optical systems with 100GHz channel spacing, SPM was identified as the major source of performance degradation if NRZ modulation format was used. SPM effect can be reduced to some extent by using advanced modulation formats and optical phase modulation provided the optimum suppression to SPM effect because no intensity modulation was involved. Since SPM effect is strong in fibers with high local dispersion, how to effectively reduce the effect of SPM will be a key for practical application of 40Gb/s optical transmission in SMF-28 based fiber plants.
SPM is a parasitic phase modulation caused by signal optical power modulation and fiber nonlinearity, which broadens the signal optical spectrum. In intensity modulated, direct detection systems, this parasitic phase modulation and spectral broadening will not cause performance degradation by itself. This parasitic phase modulation, however, can be converted into an unwanted intensity modulation through chromatic dispersion of the transmission fiber, thus causing waveform distortion. From this point of view, high chromatic dispersion makes a system particularly vulnerable to SPM. Although dispersion compensation at the end of each fiber span can correct for the waveform distortion caused by linear chromatic dispersion, it cannot completely compensate for the distortion caused by SPM. The major reason is that SPM-induced parasitic phase shift is created along the fiber in a continuous way and the SPM created at each location requires a different value of optical dispersion compensation. This problem becomes more significant when the signal data rate is high and the dispersion length is comparable to the effective nonlinear length. Here, the dispersion length is defined by )/(2 22 DcTLD λπ= and the effective nonlinear length is defined by α/1=effL , where T is the signaling time period, D is the dispersion parameter and α is the fiber attenuation parameter. For SSMF, the attenuation is 0.2 dB/km ( ]/[0461.0 kmNeper≈α ) and ][17 11 −− ⋅⋅= kmnmpsD . The effective nonlinear length is then kmLeff 22≈ . For a 10 Gb/s bit-rate, the dispersion length is kmLD 462= , which is much longer than the nonlinear length, while for a 40Gb/s bit-rate, the dispersion length is approximately kmLD 29= , which is now similar to the nonlinear length. Since SPM is created continuously within the fiber nonlinear length and dispersion-induced pulse broadening is significant during this fiber length for 40Gb/s transmission, waveform distortion caused by SPM is expected to be significant, even with optimum dispersion compensation.
As a more specific analogy, we look at a single-span optical system with chromatic dispersion compensation. Suppose the signal optical pulse is Gaussian,

−= 2
2
0 2exp)(
σtPtP
Where σ is a parameter proportional to the pulse width.
Due to fiber nonlinearity, the nonlinear phase shift is,
−==∆Φ 2
2
0 2exp)(
σγγ tPtPSPM
Where effAn
λπ
γ 22= is the fiber nonlinear parameter and then, the nonlinear frequency
shift is,
−=
∂∆Φ∂
=∆ 2
2
30
2exp
2 σπσγ
ω ttP
tSPM
SPM
The maximum value of this frequency shift happens at σ±=maxt ,
5.00max
−=∆ eP
SPM σγ
ω
Once this frequency modulation is created at position z = z’ in the fiber, it can be converted into an unwanted intensity fluctuation by chromatic dispersion from z’ to the end of the fiber.
In a dispersion compensated system, suppose the transmission fiber has the length of L1 and the dispersion D1 and the dispersion compensating fiber has the length of L2 and the dispersion D2. The total accumulated SPM intensity fluctuation at the end of system z = L1 + L2, can be expressed as,
[ ] [ ] 1212115.0
20
021211
'5.00
0 '
'5.00
)(')()'(
')(
21
21 1
DDLLLDeP
dzDLLDzLeeP
dzdzzDeeP
SPM
LLz
LL LL
z
z
−−+≈−+−=
=
∝
−+
−−
+ +−−
∫
∫ ∫
ασα
γσ
γ
σγ
α
α
Where we have assumed that the transmission fiber is long enough and 1)exp( 1 <<− Lα .
Since SPM is generated continuously along the fiber, a dispersion compensator at the end of the fiber system cannot eliminate its effect. For a linear system, 100% dispersion compensation requires that
0)( 21211 =−+ DLLLD
0 L1 L1+L2 D1 D2
P(z)
z’

In this case, the residual SPM is not zero, and it is,
15.0
20 De
PSPM −−∝
σαγ
Although this derivation is not rigorous, is does indicate that in dispersion compensated optical systems, the SPM penalty is proportional to the local dispersion of the transmission fiber and inversely proportional to the width of the optical pulse.
The effect of SPM can be mitigated by using phase modulation based optical transmission such as NRZ-DPSK. In fact, SMF-28 has the best performance among all fiber types using this modulation format. However, NRZ-DPSK does not necessarily provide the best performance overall compared to other modulation formats and using other fiber types. It would be very useful if we can find a method to actively compensate for the effect of SPM.
It is well known that SPM is created by the nonlinear phase modulation of a certain wavelength channel, which is converted into intensity perturbation and corrupts the signal waveform of the same wavelength channel. The entire process involves only one wavelength channel. In fact, the effect of SPM could be approximately treated as an additional chirp at the optical signal [29]. Although in high-speed dispersion compensated optical systems this analytical approximation is not accurate and the actual equivalent chirp should be wavelength dependent, it does provides a possible solution for the compensation of SPM using pre-chirping in the transmitter.
In order to find the optimum chirping to compensate for SPM, it is important to know that this optimum chirp has to be both signal waveform dependent as well as transmission system dependent. For a specific optical system configuration it is possible to find the optimum chirp through a split-step simulation.
In fiber transmission systems, wave propagation can be described by a nonlinear Schrodinger equation:
( )ANDTzAAjTzAT
TzAjz
TzA ))+=+−
∂∂
−=∂
∂ ),(),(2
),(2
),( 2
2
22 γαβ
Where T is the normalized time, β2 is the dispersion parameter, α is the fiber attenuation, γ is the fiber nonlinear parameter and
22 2
22 αβ
−∂∂
−=T
jD)
is the linear dispersion operator and 2AjN γ=
)
is the nonlinear phase modulation operator.
In a standard Split-Step Fourier Transform (SSFT) method, the fiber span is divided into short sections and the dispersion operator and the nonlinear operator are treated separately in each section. The evolution of the complex optical field along the fiber, from one section to the next section is described as:
( ) [ ] ( ) ),(,expexp,exp),( TzADhNhDhThzA nnnn
)))=+
Where hn is the length of the nth fiber section.

Since the linear dispersion operator can be easily treated in frequency domain, we can write:
( ) [ ] [ ] ),()(exp),(,exp 1 TzAFjDhFTzADh nn ω)) −= or,
( ) [ ] [ ]),()(exp),(,exp TzAFjDhTzADhF nn ω))
=
Where 22
)( 22 αωβ
ω −=j
jD)
is the dispersion operator in frequency domain and F
and F-1 are the operators for the Fourier and inverse Fourier transformations. Therefore, the equation for the optical field evolution can be written as a more straightforward form:
( ) [ ]),(22
exp),(exp),( 2212 TzAFhjFhYzAjThzA nnn ⋅
−⋅=+ − αω
βγ
In general, to predict a system performance, the simulation starts with the known waveform at the transmitter A(0,T). The SSFT algorithm finds the optical field of each consecutive fiber section until the end of the fiber.
It is interesting to notice that this SSFT can also be used in the backward direction [31]. That means, for a given output optical waveform, we can find the required input waveform through an inverse SSFT process. In this case, the SSFT equation should be reformulated as:
( ) [ ]),(22
exp),(exp),( 2212 TzAFhjFhYzAjThzA nnn ⋅
+−⋅−=− − αω
βγ
To obtain this equation, the fiber section length hn is simply switched to negative to represent a backward wave propagation. This method was proposed by a former student Dr. S. Song at KU Lightwave Communication Laboratory [31] in an attempt to compensate for all the nonlinear effects in the fiber, including XPM and FWM. It did not seem practical at that time for 10Gb/s based optical transmission. This was mainly because that inter-channel crosstalk was a random process and it was very impractical if not impossible to generate an input optical waveform that depends on the waveforms of the adjacent wavelength channels. In 40Gb/s optical systems, however, SPM has become a major concern for waveform distortion and this process is independent of other wavelength channels. In this case, inverse SSFT may become a practical method to find the optimum pre-chirping and pre-distortion for the transmitter to ensure a non-distorted waveform at the end of the fiber system.
Theoretically, this inverse SSFT method can provide a desired transmitter waveform and frequency chirp, which precisely results in an ideal waveform at the receiver. From a practical point of view, this depends on the complexity of the transmitter required to generate this complex input waveform. In order for this method to work, it will be important to find out if the input optical signal slightly deviates from the ideal waveform, what will be the impact in the output waveform. If the tolerance level is reasonable this method will be practical. In addition, if this method works, it is also possible to reduce the required optical dispersion compensators and put dispersion compensation to electrical domain.

Technical papers publications under the support of this project:
1. R. Hui, “Multi-tributary OFDM optical transmitter using carrier-suppressed optical single-sideband modulation” IEEE/OSA Optical Fiber Communication Conference; OFC’2003, paper MF74, Atlanta, GA, March 2003.
2. R. Hui, C. Demarest and K. Demarest, “PMD-insensitive SCM optical receiver using polarization diversity” IEEE Photonics Technol. Lett., Vol. 14, No. 11, Nov.2002
3. R. Hui, B. Zhu, R. Huang, C. Allen, K. Demarest and D. Richards, “Sub-carrier multiplexing for high-speed optical transmission,” IEEE Journal of Lightwave technology, Vol. 20, No. 3, March 2002.
4. Hui, R., B. Zhu, R. Huang, C. Allen, K. Demarest, and D. Richards, “10 Gb/s SCM system using optical single side-band modulation,” Technical Digest Optical Fiber Communications Conference 2001 (OFC’01), Anaheim, California, pp. MM4-1 - MM4-4, 2001.
5. Hui, R., B. Zhu, R. Huang, C. Allen, K. Demarest, and D. Richards, "10-Gb/s SCM fiber system using optical SSB modulation," IEEE Photonics Technology Letters, 13(8), pp. 896-898, 2001.
6. Hui, R., C. Allen, and K. Demarest, "Combating PMD-induced signal fading in SCM optical systems using polarization diversity optical receiver," to appear in Technical Digest Optical Fiber Communications Conference 2002 (OFC’02), Anaheim, California.
7. Hui, R., “High-Speed Optical Transmission using Sub-Carrier Multiplexing” in preparation for International Wireless and Optical Communications (WOC 2002), Banff, Canada.
8. R. Hui, “XPM and FWM in OFDM optical systems” Paper TuS3, Technical Digest, IEEE LEOS’2001 annual meeting, San Diego, CA, November 2001

Patents filed under the support of this project: 1. R. Hui, B. Zhu, C. Allen, K. Demarest, “Sub-carrier modulation optical system,”
patent application submitted to the U.S. Patent Office 2000.
This patent presents a novel technique for modulating wide-bandwidth, digital data over long distance optical networks while avoiding several of the signal degradation effects that plague conventional approaches. By modulating multiple binary data streams onto separate radio-frequency signals, which are then combined to form a composite signal used for single-sideband modulation of an optical carrier, the effects of chromatic dispersion and fiber non-linearities can be suppressed. The approach described in this patent provides a technique for increasing the throughput capacity of the existing long-distance fiber network.
2. R. Hui, C. Allen, and K. Demarest, "Combating PMD-induced signal fading in SCM optical systems with diversity detection," patent application submitted to the U.S. Patent Office December 20, 2001.
The methods presented in this patent address techniques for mitigating the effects of PMD on sub-carrier modulated (SCM) signals (described in the previous two patent application summaries). While SCM reduces the effects of chromatic dispersion and fiber non-linearities on long-haul optical signal transmission, PMD is found to still degrade signal quality. The approaches presented to mitigate the PMD effects for SCM systems are simpler than the approaches developed for PMD mitigation for conventional signals making them easier to implement.
References:
[1] M. R. Phillips and T. E. Darcie, “Lightwave video transmission” in Optical Fiber Telecommunications IIIA. Edited by I. P. Kaminon and T. L. Koch. Academic Press 1997.
[2] P. M. Hill and R. Olshansky, “A 20-channel optical communication using subcarrier multiplexing for the transmission of digital video signals,” IEEE J. Lightwave Technology, Vol. 8, No. 4, pp. 554-560, 1990.
[3] K. P. Ho, H. Dai, C. Lin, S-K Liaw, H. Gysel, and M. Ramachandran, “Hybrid wavelength-division-multiplexing systems for high-capacity digital and analog trunking applications,” IEEE Photonics Technology Letters, Vol. 10, No. 2, pp. 297-299, 1998.
[4] P. A. Greenhalgh, R. D. Abel, and P. A. Davies, “Optical prefiltering in subcarrier systems,” Electron. Lett., Vol. 28, No. 23, pp. 2054, 1992.
[5] R. Hui, B. Zhu, R. Huang, C. Allen, K. Demarest, and D. Richards, “10Gb/s SCM system using optical single side-band modulation” Paper MM4, Optical Fiber Communication Conference OFC’2001, Anaheim, CA, March 2001.
[6] M. E. Frerking, Digital signal processing in communication systems, Chapman & Hall, New York, 1994.
[7] J. Conradi, B. Davis, M. Sieben, D. Dodds, and S. Walklin, “Optical signal sideband (OSSB) transmission for dispersion avoidance and electrical dispersion compensation in microwave sub-carrier and baseband digital systems,” Electronics Letters, Vol. 33, pp. 971-973, 1997.
[8] G. H. Smith, D. Novak, and Z. Ahmed, “Overcoming chromatic dispersion effects in fiber-wireless systems incorporating external modulators,” IEEE Trans. Microwave Technology, Vol. 45, pp. 1410-1415, 1997.
[9] N. J. Frigo, “Clipping distortion in lightwave CATV systems: models, simulations and measurements,” IEEE J. Lightwave Technology, Vol. 11, pp. 138-146, 1993.
[10] K. Inoue, K. Nakanishi, K. Oda and H. Toba, “Crosstalk and power penalty due to fiber four-wave mixing in multichannel transmissions,” IEEE J. Lightwave Technology, Vol. 12, pp. 1423-1439, 1994.
[11] R. Hui, K. Demarest, and C. Allen, “Cross phase modulation in multi-span WDM optical fiber systems,” IEEE J. Lightwave Technology, Vol. 17, No. 7, pp. 1999
[12] M. Eiselt, “Limits on WDM systems due to four-wave mixing: a statistical approach,” IEEE J. Lightwave Technology, Vol. 17, No. 11, pp. 2261-2267, 1999
[13] S. Lanne, D. Penninckx, J-P Thiery, and J-P Hamaide, “Extension of polarization-mode dispersion limit using optical mitigation and phase-shaped binary transmission,” paper ThH3, Technical digest of Optical Fiber Communication Conference, OFC’2000, Baltimore, MD, March 7-10, 2000.
[14] D. Derickson, Editor, Fiber Optic Test and Measurement, Prentice Hall PTR, Upper Saddle River, New Jersey 1998.

[15] O. H. Adamczyk, A. B. Sahin, Q. Yu, S, Lee, and A. E. Willner, “Statistics of PMD-induced power fading for double sideband and single sideband subcarrier-multiplexed signals” paper MO5, Technical digest of Optical Fiber Communication Conference, OFC’2001, Anaheim CA, March 19-22, 2001.
[16] O. H. Adamczyk, A. B. Sahin, Q. Yu, S, Lee, and A. E. Willner, “Statistics of PMD-induced power fading for double sideband and single sideband subcarrier-multiplexed signals” paper MO5, Technical digest of Optical Fiber Communication Conference, OFC’2001, Anaheim CA, March 19-22, 2001
[17] T. Takahashi, T. Imai and M. Aiki, “Automatic compensation technique for time-wise fluctuating polarization mode dispersion in in-line amplifier systems,” Electronics Letters, Vol. 30, pp. 348 - 349, 1994.
[18] H. Y. Pua, K. Peddanarappagari, B. Zhu, C. Allen, K. Demarest and R. Hui, “An adaptive first-order polarization-mode dispersion compensation system aided by polarization scrambling: Theory and demonstration,” IEEE J. Lightwave Technology, Vol. 18, No. 6, pp. 832 – 841, 2000.
[19] K. Nosu, H. Toba and K. Iwashita, IEEE J. Lightwave Technol., Vol.5, p.1301, 1987
[20] M. Frankel and R. Esman, IEEE J. Lightwave Technol., Vol.16, p.859, 1998
[21] D. Penninckx, M. Chbat, L. Pierre and J.-P. Thiery, IEEE Photon. Technol. Lett., Vol.9, p.259, 1997
[22] K. Oda, N. Takato, T. Kominato and H. Toba, IEEE J. Lightwave Technol., Vol.8, p.1132, 1990
[23] J. P. Elbers, A. Farbert, C. Scheerer, C. Glingener and G. Fischer, “Reduced Model to Describe SPM-Limited Fiber Transmission in Dispersion Managed Lightwave Systems,” IEEE J. Selected Topics in Quantum Electronics, Vol. 6, No. 2, 2000
[24] T. Mizuochi, et,al., “A Comparative Study of DPSK and OOK WDM Transmission Over Transoceanic Distances and Their Performance Degradations Due to Nonlinear Phase Noise,” J. Lightwave Technology, Vol.21, No. 9, 2003
[25] A. Hodžić, B. Konrad and K. Petermann , “Alternative Modulation Formats in N×40 Gb/s WDM Standard Fiber RZ-Transmission Systems,” Journal of Lightwave Technology, VOL. 20, NO.4, April 2002
[26] T. Hoshida, et,al., “Optimal 40 Gb/s Modulation Formats for Spectrally Efficient Long-Haul DWDM Systems,” Journal of Lightwave Technology, VOL.20, NO. 12, December 2002
[27] A. Hirano, et,al., “320 Gbit/s (8×40 Gbit/s) WDM transmission over 367-km zero-dispersion-flattened line with 120-km repeater spacing using carrier-suppressed return-to-zero pulse format,” OSA TOPS Vol. 30 Optical Amplifiers and Their Applications Jeff C. Livas, Gerlas Van den Hoven and Susumu Kinoshita (eds.) 1999 Optical Society of America
[28] H. Kim, “Cross-Phase-Modulation-Induced Nonlinear Phase Noise in WDM Direct-Detection DPSK Systems,” IEEE J. Lightwave Technology, VOL. 21, NO. 8, August 2003

[29] N. Kikuchi and S. Sasaki, “Analytical evaluation technique of self-phase-modulation effect on the performance of cascaded optical amplifier systems,” IEEE J. Lightwave Technology, Vol. 21, No. 8, 2003
[30] C. Xu, X. Liu, L. F. Mollenauer and X. Wei, “Comparison of Return-to-Zero Differential Phase-Shift Keying and ON-OFF keying in Long-Haul Dispersion Managed Transmission,” IEEE Photonics Technology Letters, VOL. 15, NO.4, April 2003
[31] S. Song, K. Demarest, and C. Allen, “Numerically Reversing the Nonlinear Wave Propagation in Single-mode Optical Fiber,” IEEE Lasers and Electro-Optics Society 1999 Annual Meeting (LEOS ’99); San Francisco, California, Nov. 1999, pp. 611-612