ads team12 final_project_presentation
TRANSCRIPT

ADS Team 12 Final Project
Twitter Sentiment Streaming Analysis
Website: https://agarwal123.shinyapps.io/LiveAnalysisTwitter/
Our Team
Priti Yalin Zhi
Leader
Member
Member
Priti is the team leader, who use R collect data, build model and deploy on the server.Yalin use R to collect static and streaming data, and write back-end code by node.jsZhi,use python to collect streaming data, and design the architecture & framework of whole website.
Project Guide
Introduction
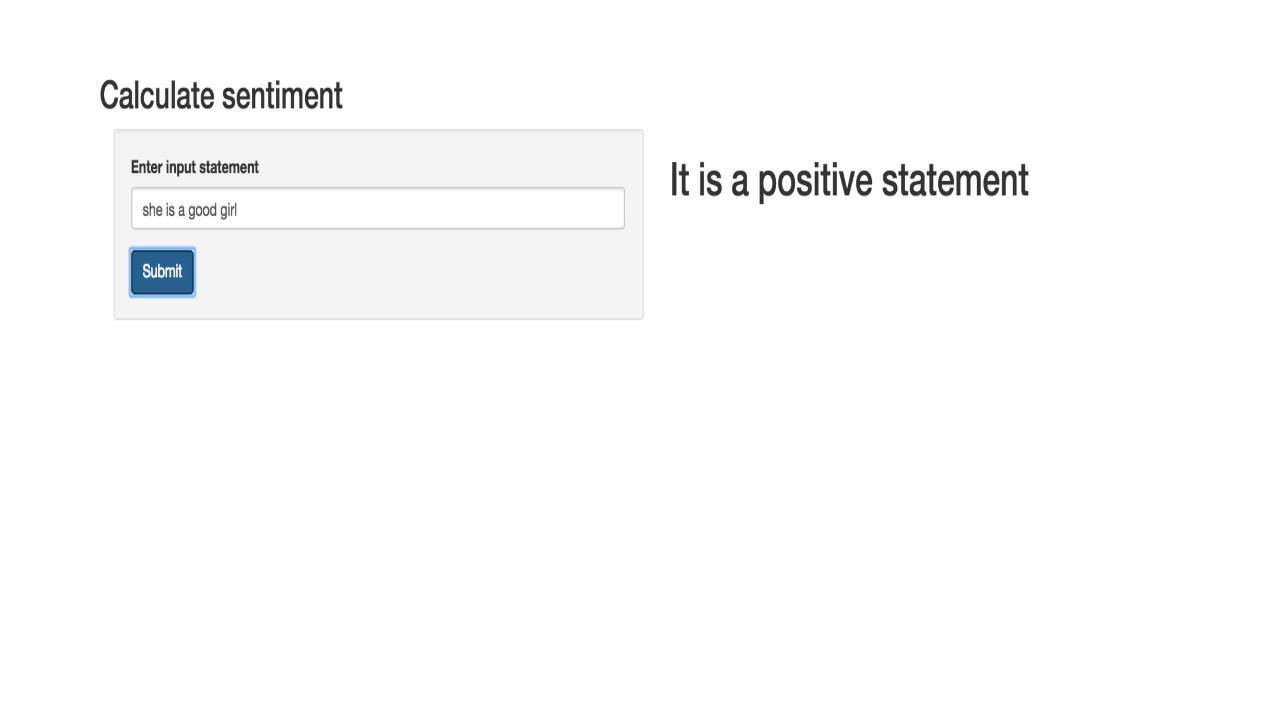
Model Part Deployed

PPT 模板下载: www.1ppt.com/moban/ 行业 PPT 模板: www.1ppt.com/hangye/ 节日 PPT 模板: www.1ppt.com/jieri/ PPT 素材下载: www.1ppt.com/sucai/PPT 背景图片: www.1ppt.com/beijing/ PPT 图表下载: www.1ppt.com/tubiao/ 优秀 PPT 下载: www.1ppt.com/xiazai/ PPT 教程: www.1ppt.com/powerpoint/ Word 教程: www.1ppt.com/word/ Excel 教程: www.1ppt.com/excel/ 资料下载: www.1ppt.com/ziliao/ PPT 课件下载: www.1ppt.com/kejian/ 范文下载: www.1ppt.com/fanwen/ 试卷下载: www.1ppt.com/shiti/ 教案下载: www.1ppt.com/jiaoan/ PPT 论坛: www.1ppt.cn
INTRODUCTION0 1
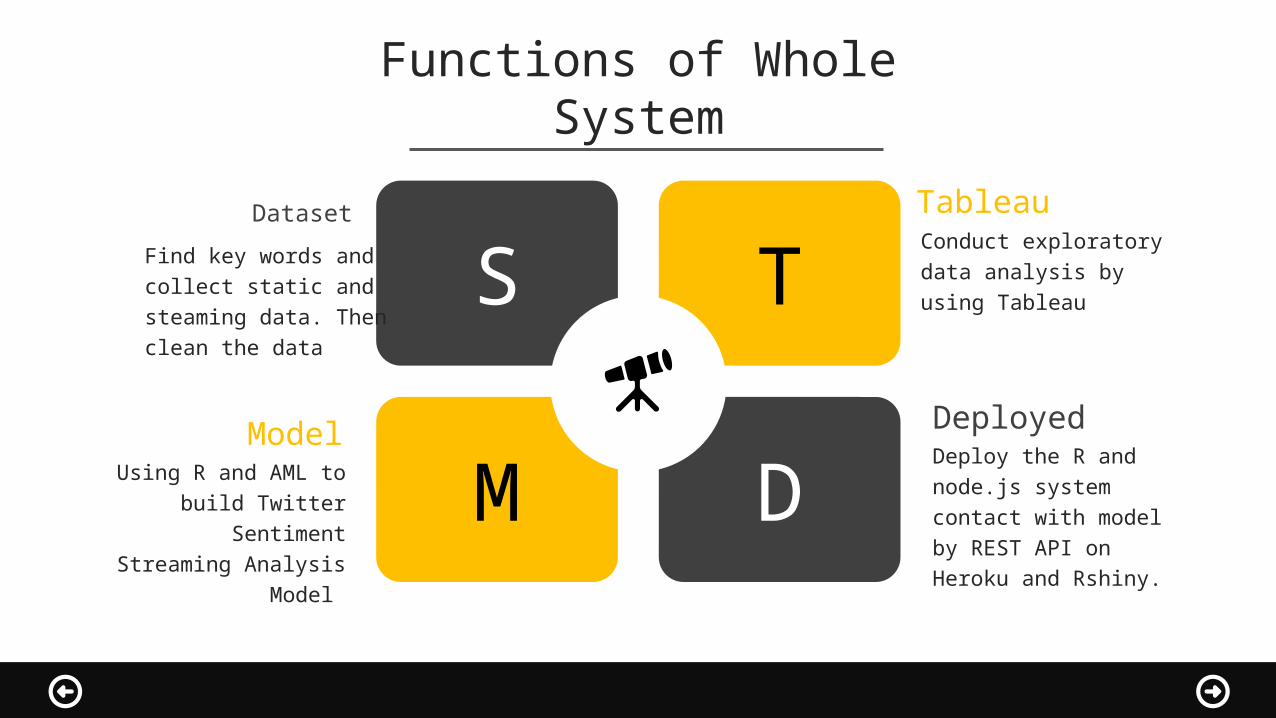
Functions of Whole System
S T
M D
Find key words and collect static and steaming data. Then clean the data
Dataset
Using R and AML to build Twitter
Sentiment Streaming Analysis Model
Model
Tableau
Deploy the R and node.js system contact with model by REST API on Heroku and Rshiny.
Deployed
Conduct exploratory data analysis by using Tableau

DATASET
KC
CS
Choosing key words for searching data ad use in the model
Key Words
Collect static data and streaming data by using R and Python.
Collect
Clean the data which delete mess data and symbol.
Clean
Calculate the score label, and make classification.Score
Label

PPT 模板下载: www.1ppt.com/moban/ 行业 PPT 模板: www.1ppt.com/hangye/ 节日 PPT 模板: www.1ppt.com/jieri/ PPT 素材下载: www.1ppt.com/sucai/PPT 背景图片: www.1ppt.com/beijing/ PPT 图表下载: www.1ppt.com/tubiao/ 优秀 PPT 下载: www.1ppt.com/xiazai/ PPT 教程: www.1ppt.com/powerpoint/ Word 教程: www.1ppt.com/word/ Excel 教程: www.1ppt.com/excel/ 资料下载: www.1ppt.com/ziliao/ PPT 课件下载: www.1ppt.com/kejian/ 范文下载: www.1ppt.com/fanwen/ 试卷下载: www.1ppt.com/shiti/ 教案下载: www.1ppt.com/jiaoan/ PPT 论坛: www.1ppt.cn
Tableau0 2

Tweets by Hours
9 PM824 tweets
3 AM234 tweets Your
Analysis
Everyday at 9pm, there are the most people use iPhone to write tweet.

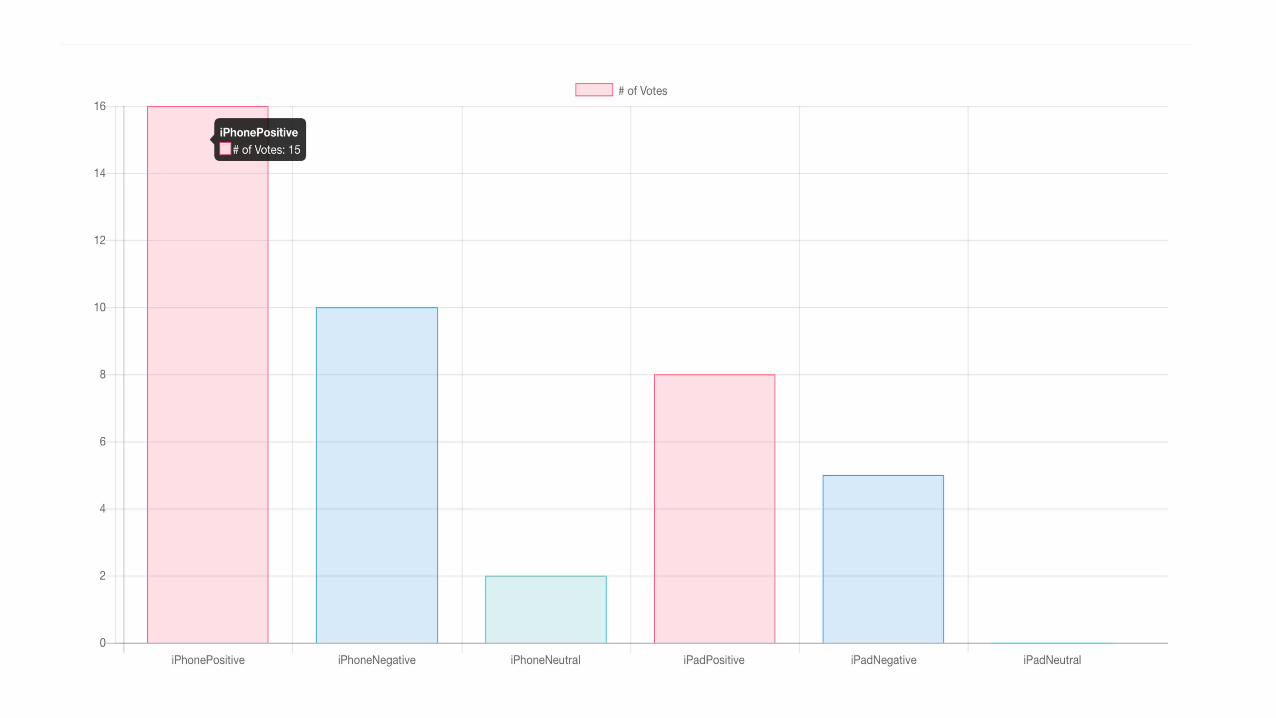
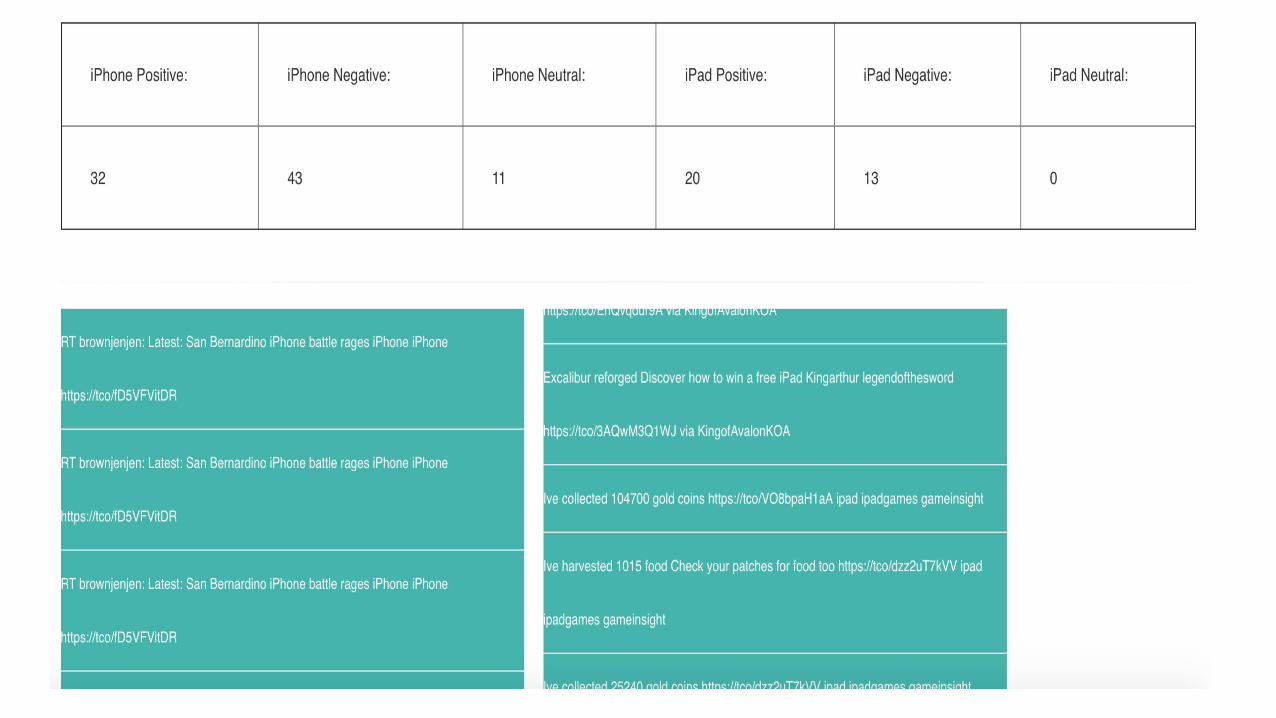
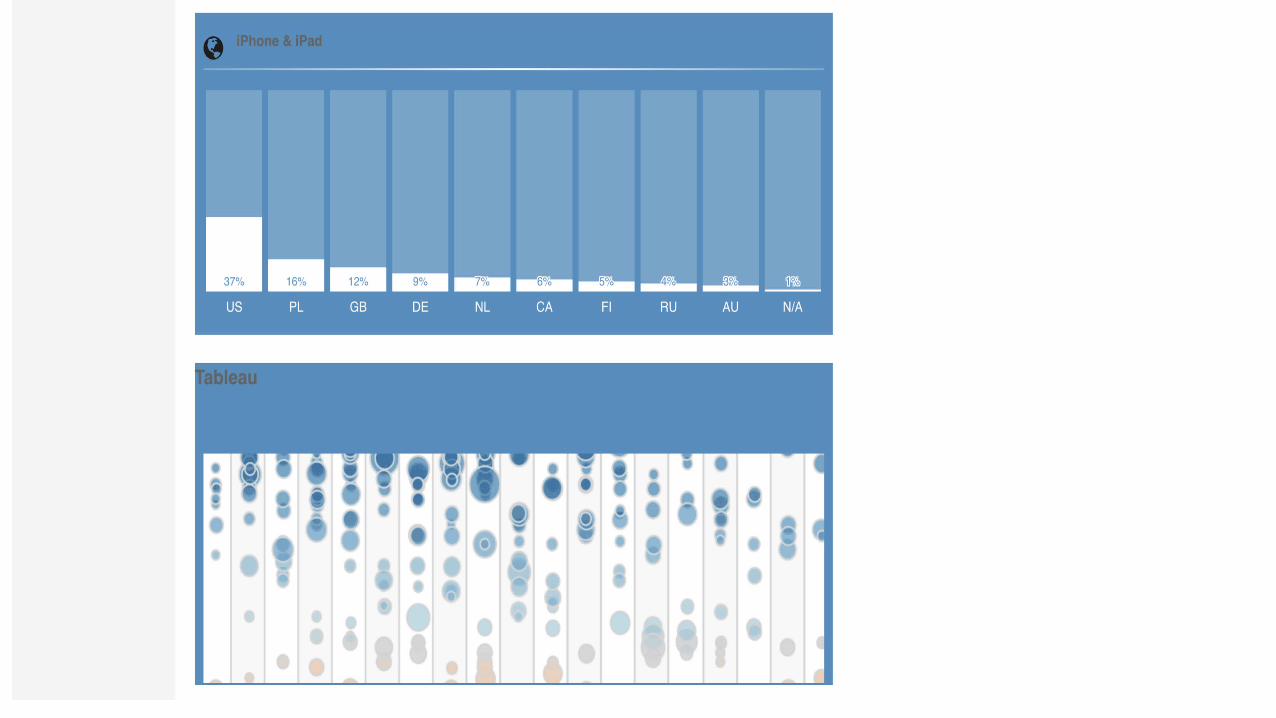
Tableau Dashboard:iPhone

Tableau Dashboard: iPad
0 3Model
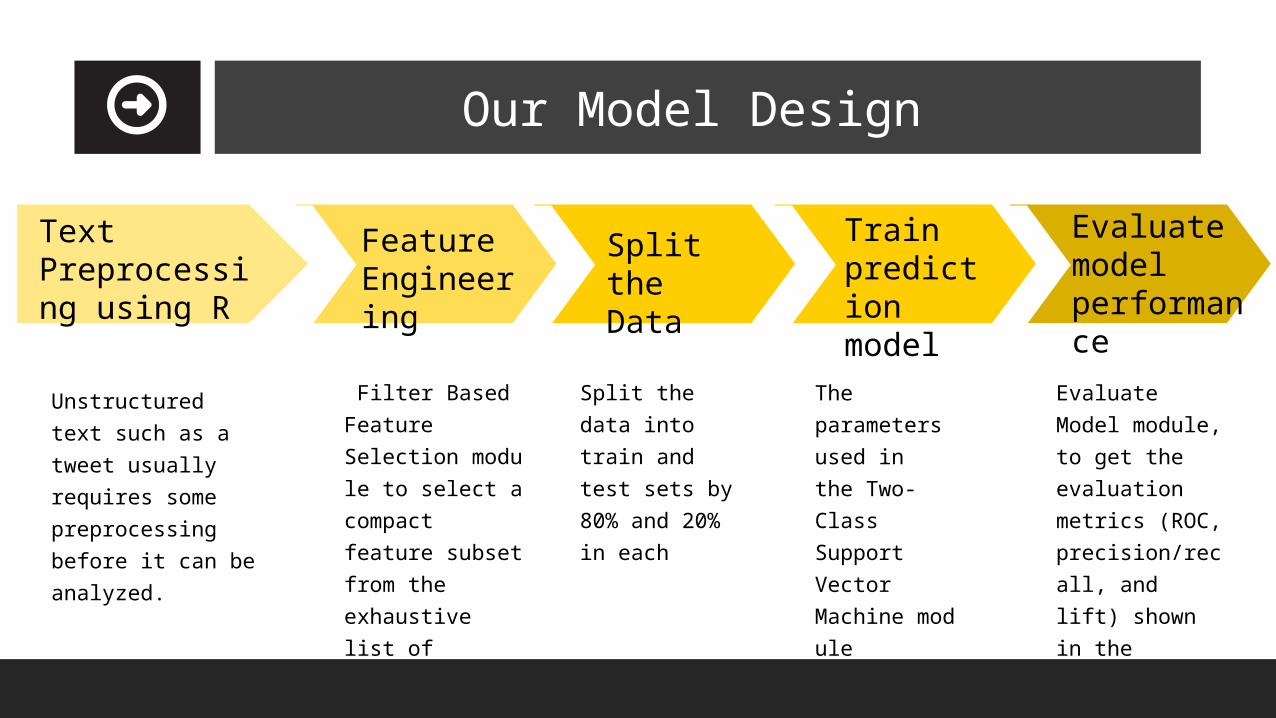
Our Model Design
Text Preprocessing using R
Feature Engineering
Split the Data
Train prediction model
Evaluate model performance
Unstructured text such as a tweet usually requires some preprocessing before it can be analyzed.
Filter Based Feature Selection module to select a compact feature subset from the exhaustive list of extracted hashing features.
Split the data into train and test sets by 80% and 20% in each
The parameters used in the Two-Class Support Vector Machine module
Evaluate Model module, to get the evaluation metrics (ROC, precision/recall, and lift) shown in the following charts.

Azure Machine Learning Model

Azure Machine Learning Model

Azure Machine Learning Model

Deployed0 4

Deployed Steps
Step 01 Step 05
Step 02
Step 03
Step 04Get output from Model
and Present on Webpage dynamicly
Using Twitter API to collect
streaming data.
Build environment
by using node.js
Create front-end webpage
Put streaming data into AML by using Mode
API
100% done

Web Page 0 4

Our Program Language
JavaScript HTML&CSS& Bootstrap
AngularJsjQuery&jQuery UI
Node js
Javascript supports many dynamic effects
HTML5, CSS and Bootstrap using for whole basic framework.
Framework and Supports Dynamic effects
Supports Dynamic effects
Node.js is the backend platform for create framework and connect with REST API.

Live Twitter Dashboards0 4

Live Twitter Stream Analysis

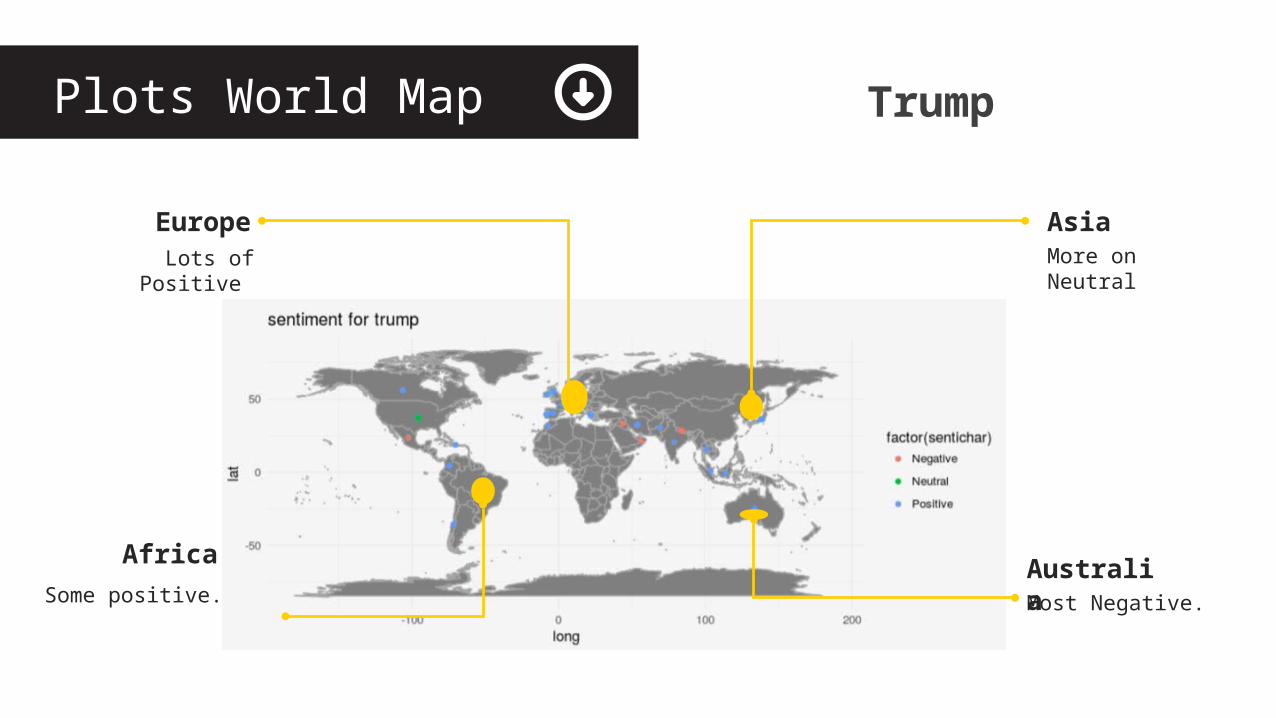
Plots World Map
Lots of Positive Europe
More on NeutralAsia
Most Negative.AustraliaSome positive.
Africa
Trump

Plots World Map
Lots of Positive Europe
More on Negative
Asia
Most Negative.AustraliaSome positive.
Africa
Hillary


Android Application

Final Website

Q & A?
Priti, Yalin, ZhiTeam12
THANK YOU