adiabatic compressed air energy storage with packed bed...
TRANSCRIPT
University of Birmingham
Adiabatic Compressed Air Energy Storage withpacked bed thermal energy storageBarbour, Edward; Mignard, Dimitri; Ding, Yulong; Li, Yongliang
DOI:10.1016/j.apenergy.2015.06.019
License:Creative Commons: Attribution (CC BY)
Document VersionPublisher's PDF, also known as Version of record
Citation for published version (Harvard):Barbour, E, Mignard, D, Ding, Y & Li, Y 2015, 'Adiabatic Compressed Air Energy Storage with packed bedthermal energy storage', Applied Energy, vol. 155, pp. 804-815. https://doi.org/10.1016/j.apenergy.2015.06.019
Link to publication on Research at Birmingham portal
Publisher Rights Statement:Published under a Creative Commons Attribution license
Checked October 2015
General rightsUnless a licence is specified above, all rights (including copyright and moral rights) in this document are retained by the authors and/or thecopyright holders. The express permission of the copyright holder must be obtained for any use of this material other than for purposespermitted by law.
•Users may freely distribute the URL that is used to identify this publication.•Users may download and/or print one copy of the publication from the University of Birmingham research portal for the purpose of privatestudy or non-commercial research.•User may use extracts from the document in line with the concept of ‘fair dealing’ under the Copyright, Designs and Patents Act 1988 (?)•Users may not further distribute the material nor use it for the purposes of commercial gain.
Where a licence is displayed above, please note the terms and conditions of the licence govern your use of this document.
When citing, please reference the published version.
Take down policyWhile the University of Birmingham exercises care and attention in making items available there are rare occasions when an item has beenuploaded in error or has been deemed to be commercially or otherwise sensitive.
If you believe that this is the case for this document, please contact [email protected] providing details and we will remove access tothe work immediately and investigate.
Download date: 21. Jan. 2020

Applied Energy 155 (2015) 804–815
Contents lists available at ScienceDirect
Applied Energy
journal homepage: www.elsevier .com/ locate/apenergy
Adiabatic Compressed Air Energy Storage with packed bed thermalenergy storage
http://dx.doi.org/10.1016/j.apenergy.2015.06.0190306-2619/� 2015 The Authors. Published by Elsevier Ltd.This is an open access article under the CC BY license (http://creativecommons.org/licenses/by/4.0/).
⇑ Corresponding authors.E-mail addresses: [email protected] (E. Barbour), [email protected]
(Y. Li).
Edward Barbour a,⇑, Dimitri Mignard b, Yulong Ding a, Yongliang Li a,⇑a School of Chemical Engineering, University of Birmingham, United Kingdomb Institute for Energy Systems, University of Edinburgh, United Kingdom
h i g h l i g h t s
� The paper presents a thermodynamic analysis of A-CAES using packed bed regenerators.� The packed beds are used to store the compression heat.� A numerical model is developed, validated and used to simulate system operation.� The simulated efficiencies are between 70.5% and 71.1% for continuous operation.� Heat build-up in the beds reduces continuous cycle efficiency slightly.
a r t i c l e i n f o
Article history:Received 13 November 2014Received in revised form 2 April 2015Accepted 14 June 2015
Keywords:Adiabatic Compressed Air Energy StoragePacked bedsThermal energy storageThermodynamic analysis
a b s t r a c t
The majority of articles on Adiabatic Compressed Air Energy Storage (A-CAES) so far have focussed on theuse of indirect-contact heat exchangers and a thermal fluid in which to store the compression heat. Whilepacked beds have been suggested, a detailed analysis of A-CAES with packed beds is lacking in the availableliterature. This paper presents such an analysis. We develop a numerical model of an A-CAES system withpacked beds and validate it against analytical solutions. Our results suggest that an efficiency in excess of70% should be achievable, which is higher than many of the previous estimates for A-CAES systems usingindirect-contact heat exchangers. We carry out an exergy analysis for a single charge–storage–dischargecycle to see where the main losses are likely to transpire and we find that the main losses occur in thecompressors and expanders (accounting for nearly 20% of the work input) rather than in the packed beds.The system is then simulated for continuous cycling and it is found that the build-up of leftover heat fromprevious cycles in the packed beds results in higher steady state temperature profiles of the packed beds.This leads to a small reduction (<0.5%) in efficiency for continuous operation.� 2015 The Authors. Published by Elsevier Ltd. This is an open access article under the CC BY license (http://
creativecommons.org/licenses/by/4.0/).
1. Introduction
If humanity is to continue to meet its energy needs in a sustain-able future, it is likely that the renewable energy era must trulycome of age. Although the last 20 years has seen a considerableincrease in the global installed capacity of renewable energy gener-ation, many renewable generators are intermittent and cannotcompletely replace conventional thermal generation. Effectiveenergy storage would provide one way to resolve this issue and sev-eral academic articles have been written on this topic, i.e. [1,2]. Itshould be noted that in addition to energy storage, future energysystems will need a mix of demand-side management and
interconnectivity [3,4]. Several articles suggest that there may besignificant benefits available from cost-effective small-scale energystorage devices; in distribution networks [5], to tidal current energy[6], and for applications in isolated island grids [7]. This article con-siders the construction of a 2 MW h A-CAES system with packedbed regenerators to act as the thermal stores.
Two conventional CAES plants have been in existence for morethan 20 years; Huntorf, Germany (since 1978) and McIntosh,Alabama (since 1991) [8,9]. Conventional CAES plants are hybridair-storage/gas-combustion plants, essentially using low-cost elec-tricity to run the compressor in a single cycle gas turbine. Typicalsingle cycle gas turbines (peaking plants) are 35–40% efficient, sorequire 2.5–2.86 kW h of gas for each kWh of peak electricity pro-duced. This can be compared to the McIntosh CAES plant whichuses 0.69 kW h of off-peak electricity and 1.17 kW h of gas to pro-duce 1 kW h of peak electricity [10]. There has been some recent

Nomenclature
c ratio of specific heats of air (–)e void fraction (–)g polytropic efficiency (–)k thermal conductivity (Wm�1 K�1)l dynamic viscosity (Pa s)q density (kg m�3)s thickness (m)v hoop stress (Pa)w shape factor (–)A area (m2)B exergy (J)c specific heat capacity (J kg�1 K�1)d diameter (m)G core mass velocity (kg m�2 s�1)g gravitational constant (ms�2)h enthalpy (J)
h heat transfer coefficient (Wm�2 K�1)hvol volumetric heat transfer coefficient (Wm�3 K�1)L length (m)m mass (kg)n moles (mol)p pressure (Pa)Q heat (J)R specific molar gas constant (J kg�1 K�1)Rth thermal resistance (KW�1)r radius (m)T temperature (K)t time (s)V volume (m3)v velocity (ms�1)W work (J)z height (m)
E. Barbour et al. / Applied Energy 155 (2015) 804–815 805
work regarding coupling conventional CAES with wind energy toprovide dispatchable utility-scale electricity generation [11–13].
The Adiabatic CAES (A-CAES) concept is different from conven-tional CAES because it functions without the combustion of naturalgas, and as such does not require the availability and storage of thisfossil fuel. In A-CAES surplus energy is used to power compressorswhich drive air into a high pressure store (this store could be arti-ficially manufactured or be a naturally occurring cavern). The ther-mal energy generated by the compression is stored in ThermalEnergy Stores (TES’s) and then used to reheat the air before it isexpanded again. To generate electricity the air is reheated andexpanded through turbines which drive generators. Although, tothe best of the authors’ knowledge, no A-CAES plant has ever beenbuilt, it is often cited as a storage option in articles comparingenergy storage technologies [14–16], usually with an expected effi-ciency of 70–75% [14,16]. Recent research in A-CAES includes theongoing EU based ‘‘Project ADELE’’ being undertaken by RWEPower, General Electric, Züblin and DLR, which quotes theexpected efficiency at 70% [17]. Garrison and Webber [18] presenta novel design for an integrated wind-solar-A-CAES system whichuses solar energy to re-heat the compressed air before expansion,with an overall energy efficiency of 46%. Pimm et al. [19] describea novel approach in which ‘‘bags’’ of compressed air are storedunder the sea; the air storage is essentially isobaric as the pressureis determined by the depth. Garvey [20] presents an analysis of alarge-scale integrated offshore-wind and A-CAES system usingthese energy bags. This approach is also being investigated byCheung et al. [21] in partnership with Hydrostor [22].Commercial companies Lightsail [23] and SustainX [24] are devel-oping near-isothermal CAES but their technologies are yet to reachthe market so details on the processes and performances arescarce.
Several articles have specifically analysed the A-CAES concept,but most consider using indirect-contact heat exchangers and aseparate thermal fluid to store the compression heat. Bulloughet al. estimates an efficiency greater than 70% [25], Grazzini andMilazzo model a 16,500 MJ (�4.6 MW h) system and suggest anefficiency of 72% [26], while Pickard et al. suggest a practical effi-ciency greater than 50% for a bulk A-CAES facility (1GWd) maybe hard to achieve [27]. This discrepancy is not easily explained,but seems at least in part to come from Pickard et al. modellingthe cooling stages as isochoric rather than isobaric. We suggest thisis inappropriate as one purpose of cooling is to reduce the volumeof the air. We also disagree with the statement in this paper that athermal effectiveness of 0.8 imposes a ceiling of 64% upon the cycle
efficiency. In A-CAES energy is stored in both the compression heatand the cool pressurised air – i.e. a thermal effectiveness of zerowould not lead to 0% efficiency, as work would still be extractablefrom the compressed air. Kim et al. calculate an efficiency of 68%without any external heat input [28]. Grazzini and Milazzo discussdesign criteria, emphasizing the importance of heat exchangerdesign [29]. Hartmann et al. [30] analyses a range of A-CAESconfigurations, concluding that an efficiency of 60% is realistic,however it should be noted that the configurations mostly involvemultiple compression stages and a single expansion stage. Sincethermodynamic work is path dependent these systems are intrin-sically inefficient; in order to minimise irreversibilities the expan-sion path should be a close match to the reverse of thecompression path. Their analysis of a system with a singlecompression stage and single expansion stage highlights that acombination of a fixed temperature TES and a sliding compression(in which the outlet temperature is constantly changing) leads to apoor efficiency (�52% in their analysis). Wolf and Budt [31] suggestthat with lower TES temperatures A-CAES may be more economi-cal despite having a lower efficiency (�56%), due to quickerstart-up times allowing it to participate in energy reserve markets.We believe that one aspect of previous A-CAES analyses that hasbeen largely overlooked is the effect of (or how to avoid) mixingof thermal storage at different temperatures (when usingindirect-contact heat exchangers) as the outlet temperatures ofthe compressors changes with the pressure of the stored air.
A related developing energy storage technology that uses ther-mal energy storage in packed beds is Pumped Thermal ElectricityStorage (PTES). Desrues et al. [32] analyses a PTES system whichuses electricity to pump heat between packed beds, before usinga heat engine to produce electricity at a later time. White et al.[33] undertakes a detailed theoretical analysis of thermal frontpropagation in packed beds for energy storage. Although the useof packed beds for heat storage in A-CAES has been suggested, adetailed analysis of this type of system is hard to find in the liter-ature. This article presents a thermodynamic analysis of an A-CAESsystem using packed bed regenerators for the TES’s.
2. Thermodynamics
2.1. Compression and expansion
Reversible isothermal compression and expansion would pro-vide the ideal for CAES, as heat could theoretically be exchangedwith the environment at ambient temperature and separate

806 E. Barbour et al. / Applied Energy 155 (2015) 804–815
thermal energy storage would not be required. However, althoughthere is significant research into near-isothermal compression forCAES (by companies like Lightsail and SustainX), it is not yet com-mercially available and any currently available compression thatapproaches reversible isothermal compression is too slow forindustrial use [27,28] due to the impractically small temperaturedifferences required. Therefore most commonly cited A-CAESdesigns opt for a series of adiabatic or polytropic compressions,after each of which the air is cooled back to the ambient tempera-ture in order to reduce the both the temperature and volume of theair.
The compressor work per unit mass can be estimated by consid-ering the conservation of energy for the compressor control vol-ume (neglecting changes in potential and kinetic energy frominlet to outlet):
_Wcv_m�
_Q cv_m¼ h1 � h2 ð1Þ
h is the specific enthalpy of the gas. A reasonable first approxima-tion for the compressor work is:
_W_m¼ cpT1
p2
p1
� � c�1gpolc
� 1
!ð2Þ
where the polytropic efficiency, gpol, is added to account for irre-versibilities and heat transfer. Similarly the work available per unitmass from an expansion is;
_W_m¼ cpT1
p2
p1
� �gpolðc�1Þc
� 1
0@
1A ð3Þ
The temperature of the gas is then given by;
T2 ¼ T1 �p2
p1
� � c�1gpolc
For a compression
¼ T1 �p2
p1
� �gpolðc�1Þc
For an expansion
ð4Þ
c is the ratio of specific heats (=cp/cv) and gpol is the polytropic effi-ciency of the compressor or turbine. Isentropic efficiency is a sim-pler way to account for irreversibilities, but it is dependent oncompression ratio [34]. Hence it is erroneous to use it to comparecompressions/expansions with different compression ratios. Thepolytropic (also known as infinitesimal stage or small-stage) effi-ciency does not depend on the compression ratio and thus allowsfor a better comparison between compressions with different pres-sure ratios. For example, a compression with p2/p1 = 3 and a poly-tropic efficiency of 85% would have an isentropic efficiency of�82.5%, whereas p2/p1 = 9 and the same polytropic efficiency yieldsan isentropic efficiency of �80%.
The exergy destruction associated with a compression orexpansion is calculated by considering Eq. (5) for the change inexergy in a flow stream.
_B_m¼ h2 � h1 � T0ðs2 � s1Þ þ
v22
2� v2
1
2þ gðz2 � z1Þ ð5Þ
Here, T0 is the ambient (dead state) temperature. Neglecting thechanges in potential and kinetic energy and noting that (h2–h1) isthe compression work, the exergy destruction in the compressoris given by the T0(s2–s1) term. Using dQ = Tds and integrating foran ideal gas the exergy destruction in the compressor and turbinecan be calculated as:
_B_m¼ T0 cp ln
T2
T1� R ln
p2
p1
� �ð6Þ
Unless the High Pressure (HP) air store is isobaric (kept at con-stant pressure), the states described in the Eqs. (2) and (3) will beconstantly changing. Each increment of air, Dm, must be com-pressed to a pressure just above the store pressure for air to flowinto the store. Therefore, the final pressure p2 of the compressionwill increase as the pressure in the store increases from the initialstorage pressure to the maximum storage pressure pstore,max, andduring expansion the initial pressure p1 will fall as the pressureinside the store decreases.
In order to model the compression phase we use a finite stepapproach. The model considers an increment of air, Dm, which iscompressed from the ambient pressure to a pressure above thestorage pressure (so that air flows into the store). The store pres-sure is a function of the mass of air contained within the store,hence pstore = pstore(m). The work required to compress this finiteamount of air, Dm, depends on how many compressions it mustundergo, with the work required for the last compression given by:
WDm ¼ DmcpT1pstoreðmþ DmÞ þ ploss
p1
� � c�1gpol;compc
� 1
!ð7Þ
Here, p1 and T1 are the respective compressor inlet pressure andtemperature, ploss is any pressure loss introduced before the airreaches the HP air store (by the after-cooling heat exchanger forexample) and pstore(m + Dm) is the storage pressure after Dm hasbeen added to the HP store, pstore(m + Dm) > pstore(m). If Dm passesthrough more than one compression, then the work required forany previous compressions where the inlet and outlet pressuresare constant is given by Eq. (2). After being compressed and cooledthe air Dm is then added to the air store at temperature Tstore (= T0).
Similarly during the expansion process an amount of air, Dm, isexpanded from the store pressure to the ambient pressure. Thework available depends on the number of expansions undergone;with the work available from the first expansion given by:
WDm ¼ DmcpT1p2
pstoreðm� DmÞ � ploss
� �gpol;turb ðc�1Þc
� 1
0@
1A ð8Þ
Now, T1 is temperature before the expansion, p2 is the pressure afterthe expansion, ploss is the pressure loss through the previous heatexchanger and pstore(m� Dm) is the pressure when Dm has beenextracted from the HP air store. To validate the numerical modeland as an interesting aside the analytical solution for the workrequired to fill a fixed volume constant temperature air store inwhich the pressure depends on the mass of air contained withinthe store is derived for the case in which there are nointer-cooling pressure losses in the Appendix A. As seen in theAppendix the model result matches the analytical solution.
2.2. Heat storage in packed beds
In order to avoid very high temperatures the compression isstaged, with inter-cooling between each compression andafter-cooling before the air enters the store to reduce the volumerequired for the HP air store.
There are two distinct classes of heat exchangers that could beused in an A-CAES system: These are direct-contact andindirect-contact exchangers. In indirect-contact exchangers theheat transfer occurs through a wall that separates the fluidstreams, whereas in direct-contact exchangers the heat transferoccurs via direct contact between two fluid streams or between afluid and a solid in a packed bed regenerator. Direct-contactexchangers are less common than their indirect-contact counter-parts, and this is perhaps why information concerning their appli-cation in A-CAES thus far remains scarce in available literature.

E. Barbour et al. / Applied Energy 155 (2015) 804–815 807
Packed bed regenerators are columns of porous solid (or packedsolid particulate matter with some space between the particles-this space is called void fraction, voidage or porosity). They areextensively used for many processes in the chemical and foodindustries, i.e. adsorption, desorption, and rectification. They canoffer very high rates of heat transfer, have very good pressureand temperature tolerances and offer relatively inexpensive con-struction. There has been significant recent research analysingpacked beds for high temperature thermal energy storage for solarapplications (i.e. [35,36]). Using packed beds in an A-CAES systemwould replace both the indirect-contact exchangers and the sepa-rate thermal energy stores, forgoing the need for a separate ther-mal fluid.
Fig. 1 depicts an incremental slice of the packed bed regenera-tor. Equations for the temperature of the fluid and solid phasesin an incremental slice of the packed bed can be expressed usingthe conservation of energy.
Eq. (9) shows the energy rate balance for the fluid phase in aslice of height Dz of the packed bed. The thermal power exchangedbetween the fluid and the solid phase is given by the termhvol(Tf–Ts)D zA while the net heat input due to the flow of the fluidis given by vfAqfcf(Tf(z,t)–Tf(z + Dz,t)) = �vfAqfcf dTf/dz Dz.
eADzqf cfdTf
dt¼ �v f Aqf cf
dTf
dzDz� hvolADzðTf � TsÞ ð9Þ
The energy rate balance for the solid phase is given by Eq. (10),where the term A(d/dz)ks(dTs/dz) is due to the lengthwise (in thez-direction) conduction of heat through the solid in the packed bed.
ð1� eÞqscsdTs
dt¼ �hvolðTs � Tf Þ � A
ddz
ksdTs
dz
� �ð10Þ
In Eqs. (9) and (10) cf and cs are the fluid and solid specific heatcapacities (J kg�1 K�1), vf is the superficial velocity of the fluid mov-ing through the bed (= volumetric flow rate/bed cross sectionalarea, ms�1) and hvol is the volumetric heat transfer coefficient(Wm�3 K�1). The void fraction is denoted e, hence the mass ofthe fluid and the solid in a slice Dz are given by Eqs. (11) and (12).
mf ¼ qf eADz ð11Þ
ms ¼ qsð1� eÞADz ð12Þ
Conservation of mass means the rate of change of fluid densityin a slice is equal to the difference between mass flow rate acrossthe slice.
dqf
dt¼
dðv f qf Þdz
ð13Þ
Fig. 1. A depiction of a slice of height Dz in a packed bed regenerator.
Eqs. (9) and (10) are the standard 1-d equations for the temper-ature profile of a packed bed exchanger. The case in which the con-duction in the solid is neglected (ks = 0) was first solvedanalytically by Schumann [37] in 1929, who solved for tempera-ture under the assumptions that; any given solid particle has a uni-form temperature at any given time; there is negligible heatconduction between the solid particles; there is negligible heatconduction among the fluid particles; the fluid motion is uniformand only in the axial direction of the solid; and the solid has a con-stant void fraction (porosity) and negligible radial temperaturegradient. More sophisticated analytical treatments of packed bedsystems can be also be found, i.e. Villatoro et al. [38].
The volumetric heat transfer coefficient, hvol, depends on theflow properties of the fluid (air), the surface area to volume ratioof the gravel and the packing geometry of the bed. Several empir-ical relationships to determine hvol exist, as outlined in Adeyanjuand Manohar [39]. We use the empirical relationship suggestedby Coutier and Farber [40] when investigating the heat transferbetween gravel and air:
hvol ¼ 700ðG=dpÞ0:76 ð14Þ
G is the core mass velocity (kg m�2 s�1) of the fluid and dp is theaverage particle size (m). This correlation is also used byZanganeh et al. [41] to analyse a packed bed system for heat stor-age. The Biot number, Bi, gives a measure of the ratio of resistanceto heat transfer via conduction to the resistance of heat transfer viaconvection:
Bi ¼ hLc
ks¼ hvoldp
2kpapð15Þ
Lc is the characteristic length scale for heat transfer, dp is the particlediameter, ks (=kp) is the solid particle thermal conductivity(Wm�1 K�1) and ap is the ratio of surface area to volume. IfBi << 1, then the temperature of the particle can be approximatedas uniform, for example a gravel particle diameter of 10 mm leadsto a Biot number around 0.01. Hence we assume that the tempera-ture within the solid gravel particulate is constant.
3. Details of the numerical A-CAES model with packed beds
The model adopts a finite step approach, considering a massincrement, Dm, of air passed through the compressors and packedbeds and added to the HP air store. The inlet temperatures to thepacked beds are calculated from Eq. (4), and discretised Eqs. 9,10 and 13 are solved for each slice of the packed beds. It shouldbe noted that Dm changes between the compressors as the pres-sure and temperature profile of each packed bed changes.
Fig. 2. A schematic of an A-CAES system with packed bed heat exchangers. PB1
provides cooling between the compressions while PB2 cools the air entering thestore. This reduces the required volume of the store.

808 E. Barbour et al. / Applied Energy 155 (2015) 804–815
A schematic of the model system is shown in Fig. 2. The maxi-mum storage pressure is 80 atm (8.106 MPa) and the minimumstorage pressure is 20 atm (2.027 MPa). These pressures are chosenas a trade-off between minimising the range of pressures encoun-tered and minimising the volume of the HP air store, as well asallowing the HP air store to be either a HP tank or a rock cavern.The maximum storage pressure at the McIntosh CAES facility(which uses a solution mined salt cavern) is 7.93 MPa [42].
In the model the maximum pressure ratio, r, is the same foreach compression. To calculate r an estimate of the pressure lossthat each cooling stage introduces is used; the pressure after thenth cooling stage is given by:
pn ¼ rnp0 �Xn
1
rn�1ploss ð16Þ
With a final pressure of 8.106 MPa, an initial pressure of101.3 kPa, 2 compression stages (therefore p2 = 8.106 MPa) andassuming each packed bed introduces a pressure drop of 5 kPa,the pressure ratio r is 8.97. With 3 stages this decreases to 4.33.In this first analysis the intermediate expansion pressures are thesame as those for the respective compression stage.
In the finite step model the solid conductivity in the lengthwisedirection of the packed beds is accounted for as well as thermalpower losses due to imperfect insulation of the regenerators. Theinsulation losses are approximated by calculating the thermalresistance of a slice of insulating cylindrical layer.
To calculate the thermal resistance we model each slice (asshown in Fig. 1) of the packed bed as a cylinder at Thot with radiusri, contained within a hollow insulation cylinder of inner radius ri
and outer radius ro (ro–ri is the insulation thickness). If the heattransfer rate is slow then temperature within the insulation layer(ri < r < ro) approximately satisfies Laplace’s equation. Solving thisyields:
T ¼ Thot þThot � T0
lnðri=roÞlnðr=riÞ ð17Þ
Applying Fourier’s heat law in integral form gives the thermalpower loss and allows the thermal resistance (Q_= (Thot–T0)/Rth) tobe calculated, where Dz is the height of the slice and k is the ther-mal conductivity of the insulation material.
Rth ¼lnðro=riÞ2pDzk
ð18Þ
The thermal resistance of the cylinder ends are also approxi-mated for the end slices of the packed beds. In this way the thermalpower loss is calculated for each slice of the bed in the model.
We also estimate the exergy loss associated with heat flow outof the packed bed. We assume that all of the available work(exergy) lost from the bed is transferred to the environment, attemperature T0, and moreover we assume that work could havebeen generated from this heat reversibly. A more involved treat-ment recognises that work can only be generated irreversibly;therefore during the work generation process heat will be trans-ferred to parts of the system other than the environment, havingtemperatures other than T0. In this manner not all the exergy mustbe lost to the environment. A detailed explanation is available inAppendix A of [43]. Under our assumptions in which all the avail-able work is lost to the environment, the exergy loss associatedwith a flow of heat from temperature T to the ambient environ-ment (with temperature T0) is given by:
_Bheat loss ¼ 1� T0
T
� �_Q ð19Þ
As heat flows out of the bed its temperature decreases, so Eq.(19) becomes:
dBheat loss ¼ 1� T0
T
� �dQ ð20Þ
Assuming that the packed bed has a constant specific heatcapacity, dQ can be written as mcdT where c is the specific heatcapacity of the packed bed. Integrating this to get the exergy lossassociated with heat flow as the bed cools from T1 to T2 yields:
Bheat loss ¼ mcT0T1
T0� T2
T0� ln
T1
T2
� �ð21Þ
Pressure losses in the packed beds are accounted for using theErgun equation. The Ergun equation [44] provides one method ofestimating the pressure drop through a packed bed and is generallyregarded as suitable for a first estimate, providing the void fractionis in the range 0.33 < e < 0.55, the bed is made up of similar sizedparticles and the flow rates are moderate [45]. It is an empiricalrelationship, although du Plessis and Woudberg [46] has providedsome theoretical validation. The Ergun equation states:
DPL¼ 150l
w2d2p
ð1� eÞ2
e3 v f þ1:75qf
wdp
ð1� eÞe3 v2
f ð22Þ
dp is the particle diameter, qf is the fluid density, vf is the superficialbed velocity (the velocity that the fluid would have through anequivalent empty tube, given by volumetric flowrate divided bycross sectional area), l is the dynamic viscosity of the fluid and eis the void fraction of the packed bed. w is the shape factor tocorrect for the granitic gravel pieces not being spherical. The shapefactor is defined in Eq. (23). Vp is the volume of a single particle andAp its surface area. The product (wdp) is the equivalent sphericalparticle diameter:
w ¼ 6Vp
Apdpð23Þ
The overall efficiency of a single cycle is given by:
g ¼Wdischarge
Wchargeð24Þ
where Wcharge is the total work input required to run the compres-sion and Wdischarge is the total useful work released by the expan-sion. The exergy balance for the system is given by:
Wcharge ¼Wdischarge þ Bd;comp þ Bd;exp þ Blost;exit þ Blost;PB þ Bd;PB ð25Þ
Bd,comp is the exergy destroyed in the compressor and Bd,exp is theexergy destroyed in the expanders, which are estimated by themodel using Eq. (6). Blost,exit is the exergy remaining in the exhaustgas exiting the final expansion stage and is estimated using Eq. (5)in the model. Blost,PB is the exergy lost from the packed beds as heat,including heat remaining in the beds after the cycle has finished,estimated using Eq. (21). Finally Bd,PB is the exergy destroyed inthe packed from pressure losses and lengthwise conduction of heatalong the bed and accounts for the remainder of the charge work.
3.1. Model specifics
� The polytropic efficiencies of the expanders and compressorsare assumed at 85%. The turbines at the McIntosh CAES facilityhave isentropic efficiencies of 87.4–89.1% [18], which given thatthe plant has 4 stages, and a high pressure between 60 and80 bar, suggests a polytropic efficiency of �86%.� Heat losses from the packed beds and the air store to the envi-
ronment depend on the driving temperature difference and theinsulation properties. A thermal conductivity of 0.3 Wm�1 K�1
is assumed for the packed bed insulation layer, as insulationmaterials with this thermal conductivity are easily available(fibreglass typically has a thermal conductivity less than0.1 Wm�1 K�1), and the insulation is assigned a thickness of0.2 m.

E. Barbour et al. / Applied Energy 155 (2015) 804–815 809
� The PBHE is a cylinder containing uniformly sized graniticgravel particles. The gravel particles in the packed beds have adiameter of 0.01 m, a specific heat capacity of 1 kJ kg�1 K�1
and the effective thermal conductivity through the bed is4 Wm�1 K�1 (the solid thermal conductivity of gravel is around2 Wm�1 K�1).� It is assumed that the specific heat capacity of the air is constant
and equal to 1.01 kJ K�1. In the temperature range encounteredthe specific heat varies by <5%. We also assume that the specificheat of the gravel is constant in the encountered temperaturerange.� Fluid flow is assumed uniform throughout the regenerators.� The thermal inertia of the packed bed container is neglected.� There is no change in volume of the solid with temperature and
the fluid and solid heat capacities are constant.� The rate of heat transfer between the fluid and the solid bed is
proportional to the temperature difference between them.� Each of the individual solid particulates have uniform tempera-
ture, i.e. Bi << 1.� Leakage of compressed air has been neglected.
For interest and for validation the full MATLAB code for thenumerical A-CAES model is available at www.energystorage-sense.com/downloads [47].
4. Results
Results for the simulated 2 MW h 500 kW A-CAES system arepresented. Firstly consideration is given as to the effect of thenumber of compression/expansion stages. Secondly a singlecharge/discharge cycle is analysed to see where the main lossesoccur. Finally continuous charging and discharging is simulatedto predict how the system may operate under continuous cycling.
4.1. Number of compression stages
The system depicted in Fig. 2 (based on the usual A-CAES design– see [25,26] – but replacing the indirect-contact exchangers withdirect-contact regenerators) has 2 compression and expansionstages. Fig. 3 shows how the volume of the high pressure air storevaries as the number of compression stages is varied, for onecharge/discharge cycle in which the temperature of the packed
Fig. 3. Graph showing how the HP (80 atm) storage volume and maximumtemperature achieved in the compression depends on the number of compressionstages. These results represent the initial cycle, with the regenerators starting atambient temperature.
bed regenerators is initially at the ambient throughout the wholelength of the bed. Although no system is anticipated to use 100stages the extrapolation serves as a useful check to compareagainst isothermal operation.
The energy density is decreased as the number of compressionstages is increased and the HP air store must be larger to store thesame amount of energy, as heat is stored in the packed beds at alower temperature. The model is further validated by noting thatas the number of stages gets very large the compression workrequired (and hence the volume required to store the desiredamount of work) tends towards the isothermal value. This is calcu-lated by replacing Eq. (7) in the model with Eq. (23) below.
WDm ¼ DmRT1 lnpðmþ DmÞ
p1ð26Þ
The system temperatures achieved are of course lower withmore compression stages. Packed bed regenerators will allow forhigher system temperatures than conventional heat exchangersas there is no requirement for a thermal fluid which must remainliquid and stable throughout the range of temperatures encoun-tered (as in the indirect-contact designs). However, it is unlikelythat a final pressure of 80 atm will be practical in one compressionstage. Hence we present results for modelled systems with 2, 3 and4 compression stages to reach the final storage pressure, with themain focus on a 2-stage A-CAES system.
4.2. Single cycle exergy analysis
In this subsection we use the model developed to perform anexergy analysis of a single charge/discharge cycle of the 2-stagesystem in order to illustrate where the main exergy destructionin the system occurs. The system takes 4 h to charge, remains idlefor 10 h and then is discharged for 4 h. The exergy balance is givenby Eq. (25). Initially the temperature in both the packed beds isuniform and ambient. Fig. 4 shows the results of the exergyanalysis.
The simulated efficiency is 71.3% (obtained from Eq. (24)). Theresults show that the biggest loss (nearly 20% of the work input)occurs in the compressors and expanders. Thermal losses fromthe packed beds account for a further 7% of the exergy loss. Exitlosses from the turbine, heat left in the packed beds, conductionlosses in the packed beds and pressure losses through the packedbeds make up the rest (�2%). This illustrates that maintaining high
Fig. 4. Results of the exergy analysis performed on the 2-stage system. Losses areordered from largest to smallest. ‘‘Packed Beds’’ is abbreviated to ‘‘PBs’’ in the figure.
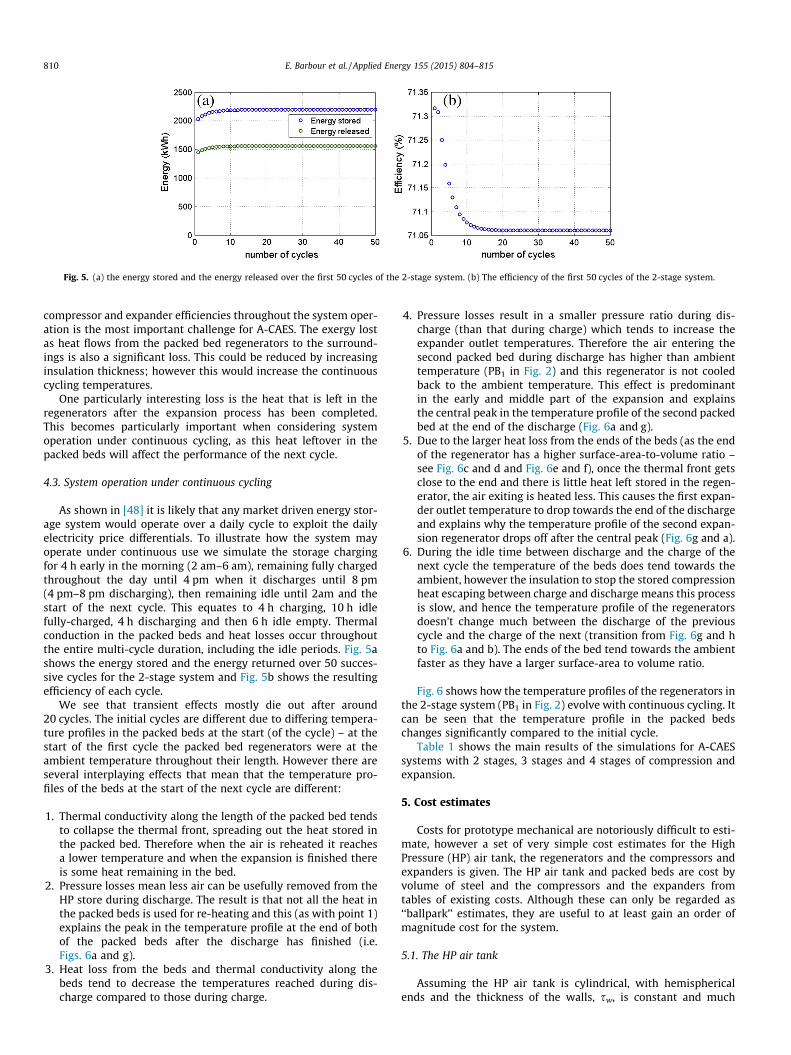
Fig. 5. (a) the energy stored and the energy released over the first 50 cycles of the 2-stage system. (b) The efficiency of the first 50 cycles of the 2-stage system.
810 E. Barbour et al. / Applied Energy 155 (2015) 804–815
compressor and expander efficiencies throughout the system oper-ation is the most important challenge for A-CAES. The exergy lostas heat flows from the packed bed regenerators to the surround-ings is also a significant loss. This could be reduced by increasinginsulation thickness; however this would increase the continuouscycling temperatures.
One particularly interesting loss is the heat that is left in theregenerators after the expansion process has been completed.This becomes particularly important when considering systemoperation under continuous cycling, as this heat leftover in thepacked beds will affect the performance of the next cycle.
4.3. System operation under continuous cycling
As shown in [48] it is likely that any market driven energy stor-age system would operate over a daily cycle to exploit the dailyelectricity price differentials. To illustrate how the system mayoperate under continuous use we simulate the storage chargingfor 4 h early in the morning (2 am–6 am), remaining fully chargedthroughout the day until 4 pm when it discharges until 8 pm(4 pm–8 pm discharging), then remaining idle until 2am and thestart of the next cycle. This equates to 4 h charging, 10 h idlefully-charged, 4 h discharging and then 6 h idle empty. Thermalconduction in the packed beds and heat losses occur throughoutthe entire multi-cycle duration, including the idle periods. Fig. 5ashows the energy stored and the energy returned over 50 succes-sive cycles for the 2-stage system and Fig. 5b shows the resultingefficiency of each cycle.
We see that transient effects mostly die out after around20 cycles. The initial cycles are different due to differing tempera-ture profiles in the packed beds at the start (of the cycle) – at thestart of the first cycle the packed bed regenerators were at theambient temperature throughout their length. However there areseveral interplaying effects that mean that the temperature pro-files of the beds at the start of the next cycle are different:
1. Thermal conductivity along the length of the packed bed tendsto collapse the thermal front, spreading out the heat stored inthe packed bed. Therefore when the air is reheated it reachesa lower temperature and when the expansion is finished thereis some heat remaining in the bed.
2. Pressure losses mean less air can be usefully removed from theHP store during discharge. The result is that not all the heat inthe packed beds is used for re-heating and this (as with point 1)explains the peak in the temperature profile at the end of bothof the packed beds after the discharge has finished (i.e.Figs. 6a and g).
3. Heat loss from the beds and thermal conductivity along thebeds tend to decrease the temperatures reached during dis-charge compared to those during charge.
4. Pressure losses result in a smaller pressure ratio during dis-charge (than that during charge) which tends to increase theexpander outlet temperatures. Therefore the air entering thesecond packed bed during discharge has higher than ambienttemperature (PB1 in Fig. 2) and this regenerator is not cooledback to the ambient temperature. This effect is predominantin the early and middle part of the expansion and explainsthe central peak in the temperature profile of the second packedbed at the end of the discharge (Fig. 6a and g).
5. Due to the larger heat loss from the ends of the beds (as the endof the regenerator has a higher surface-area-to-volume ratio –see Fig. 6c and d and Fig. 6e and f), once the thermal front getsclose to the end and there is little heat left stored in the regen-erator, the air exiting is heated less. This causes the first expan-der outlet temperature to drop towards the end of the dischargeand explains why the temperature profile of the second expan-sion regenerator drops off after the central peak (Fig. 6g and a).
6. During the idle time between discharge and the charge of thenext cycle the temperature of the beds does tend towards theambient, however the insulation to stop the stored compressionheat escaping between charge and discharge means this processis slow, and hence the temperature profile of the regeneratorsdoesn’t change much between the discharge of the previouscycle and the charge of the next (transition from Fig. 6g and hto Fig. 6a and b). The ends of the bed tend towards the ambientfaster as they have a larger surface-area to volume ratio.
Fig. 6 shows how the temperature profiles of the regenerators inthe 2-stage system (PB1 in Fig. 2) evolve with continuous cycling. Itcan be seen that the temperature profile in the packed bedschanges significantly compared to the initial cycle.
Table 1 shows the main results of the simulations for A-CAESsystems with 2 stages, 3 stages and 4 stages of compression andexpansion.
5. Cost estimates
Costs for prototype mechanical are notoriously difficult to esti-mate, however a set of very simple cost estimates for the HighPressure (HP) air tank, the regenerators and the compressors andexpanders is given. The HP air tank and packed beds are cost byvolume of steel and the compressors and the expanders fromtables of existing costs. Although these can only be regarded as‘‘ballpark’’ estimates, they are useful to at least gain an order ofmagnitude cost for the system.
5.1. The HP air tank
Assuming the HP air tank is cylindrical, with hemisphericalends and the thickness of the walls, sw, is constant and much

Fig. 6. The figure shows the evolution of temperature profiles of the packed beds for the 2-stage system when the system is used continuously on a daily cycle with 4 hcharge, 10 h idle, 4 h discharge, 6 h idle as described. (a) First packed bed at the beginning of each cycle (b) second bed at the beginning of each cycle (c) first packed bed at theend of the charge (d) second packed bed at the end of the charge (e) first packed bed at the beginning of the discharge (f) second packed bed at the beginning of the discharge(g) first packed bed at the end of the discharge (f) second packed bed at the end of the discharge.
E. Barbour et al. / Applied Energy 155 (2015) 804–815 811

Table 1Simulations results for continuous cycling.
2-stage system 3-stage system 4-stage system
Charging energy (first cycle) 2034 kW h 2033 kW h 2031 kW hDischarging energy (first cycle) 1451 kW h 1446 kW h 1440 kW hCharging energy (steady state) 2193 kW h 2186 kW h 2156 kW hDischarging energy (steady state) 1559 kW h 1547 kW h 1520 kW hEfficiency (first cycle) 71.3% 71.1% 70.9%Efficiency (steady state) 71.1% 70.8% 70.5%HP air store volume 182 m3 204 m3 216 m3
Compressor/expander polytropic efficiency (isentropicefficiency will vary)
85 % 85% 85%
Max. operating pressure 80 atm (= 8.106 MPa) 80 atm (= 8.106 MPa) 80 atm (= 8.106 MPa)Min. operating pressure 20 atm (= 2.027 MPa) 20 atm (= 2.027 MPa) 20 atm (= 2.027 MPa)Regenerator dimensions 3 Regenerators with radius 0.6 m,
length 12 m3 Regenerators with radius 0.6 m,length 12 m
4 regenerators with radius 0.6 m,length 12 m
Max packed bed temperature (first cycle) 605 K 474 K 419 KMax packed bed temperature (steady state) 713 K 556 K 469 K
812 E. Barbour et al. / Applied Energy 155 (2015) 804–815
smaller than the radius (r >> sw), the volume of material requiredcan be approximated as:
Vmat ¼ 2prswLþ 4pr2sw ð27Þ
where r is the internal radius and L is the length of the cylinder. Thehoop stress on the cylinder walls is:
v ¼ prsw
ð28Þ
The ratio of the material volume to internal volume of the tankis:
Vmat
V¼ 2swLþ 4rsw
rLþ 4r2=3ð29Þ
Assuming a HP air store geometry in which the length is 5 timesthe radius (L = 5r), then:
Vmat ¼42pV19v ð30Þ
Allowing a maximum steel stress of 100 MPa, the 182 m3 HP airstore (max pressure 8.106 MPa) would require �310 tonnes ofsteel, assuming a density of 7800 kg m�3. At $800/tonne this wouldcost �$250,000.
5.2. The packed beds
The main cost in the PBHE’s will be the pressure vessel housing.We again use Eq. (29) and apply the geometry specified in Table 1to calculate the volume of material. In the 2-stage system werequire that the low pressure regenerator must be able to with-stand pressures up to 1 MPa, while the high pressure regeneratormust withstand pressures up to 10 MPa. The LP regenerator thenrequires �3 tonnes of steel while the HP requires �25 tonnes,yielding costs of $2400 and $20,000 respectively.
5.3. Compressors
The compression train is required to produce air at 80 atm, at apower of around 500 kW. Referring to page 77 of [49], deliveringair at 80 atm could just be achieved using a horizontal compressorat a cost of 34.7 £/m3 h�1. In terms of Free Air Delivery (FAD), thesystem would require about 4000 m3 h�1. The total cost of thecompression is then estimated at �£140,000.
5.4. Turbines
Without the ability to attain manufacturer quotes it is simplyassumed that the air turbines cost will be broadly similar to thecost of the compressors. A cost of £140,000 for 500 kW equatesto �440 $/kW. This is not dissimilar to costs per kW for large gasturbines (see [50]). Air turbines should also be easier to manufac-ture in the long term as they have only to withstand temperaturesless than 1000 K, as opposed to gas turbines which work with hightemperatures around 2200 K, and the air turbines will not have towork simultaneously with the compressors (unlike a modern gasturbine).
Summing these costs comes to �$720 k. This is anticipated toconstitute the majority of the capital costs, but does not includecosts for pipes, valves, the packed bed particulates, filters, pumpsand insulation. Another recent article [53] by Mignard has alsoattempted to estimate A-CAES costs.
An A-CAES system on the scale considered here will have tocompete with the other storage technologies; one notable technol-ogy in the capacity and power range modelled here (2 MW h500 kW) being NaS (Sodium Sulphur) battery systems. Thesesystems have efficiencies in excess of 80% over the time rangemodelled [51]. However, with current cost estimates at 1000–1400 $/kW h [52] equating to $2–2.8 million for a 2 MW h NaSsystem, with significant operating cost and a limited cycle life itmay not be unreasonable to expect that a similar size A-CAES plantwill be significantly cheaper in the long term.
6. Discussions
The paper has presented a first analysis of an A-CAES systemusing packed bed regenerators. Despite some limitations theauthors believe that the work is a useful contribution to the fieldsof A-CAES and energy storage. Using packed bed regeneratorsappears to have a number of advantages over conventionalindirect-contact heat exchangers for A-CAES. Compared to a sys-tem with indirect-contact heat exchangers, the packed bed regen-erator based system has no thermal fluid requirements, and henceoffers a simple solution for maintaining a large degree of the tem-perature stratification of the thermal energy stores. This is not sim-ply achievable using indirect-contact exchangers and a thermalfluid, as mixing of the thermal fluid would destroy stratificationand results in a significantly lower efficiency, as demonstrated bythe analysis of Hartmann et al. [30]. Packed beds should also offerhigher heat transfer coefficients, have good temperature and pres-sure tolerances and offer simpler construction. A cost comparisonbetween the two systems is an area of future work. The packed

E. Barbour et al. / Applied Energy 155 (2015) 804–815 813
bed system not only removes the need for indirect-contactexchangers, thermal energy stores and a suitable thermal fluidbut also is likely to require fewer compression and expansionsstages as the beds will tolerate much higher temperatures.Furthermore as there is no liquid coolant required, there is nopump required to move the thermal fluid around the system.
The simulations described in the present analysis are a simpli-fied representation of how the real system may operate.However, even in this simple model the many different interac-tions lead to some complicated results – as shown by the evolutionof the temperature profiles of the packed beds through successivecharge/discharge cycles. Loss estimates have attempted to be con-servative and it may be possible to increase performance slightlyvia optimisation (i.e. by optimisation of the intermediate expan-sion pressures). However some losses have also been omitted, i.e.leakages, pipe losses and span-wise conduction in the regenera-tors. Fouling and flow channelling in the regenerators may requireadditional filtration and a specially designed nozzle manifold forthe injection of air respectively, introducing additional pressurelosses. Hence the losses in the real system may also turn out tobe more costly. On balance these effects are likely to have somecancellation effect.
Conventionally, compressions are designed close to isothermalto minimise the work required for a desired output pressure.However for an A-CAES system this is not necessarily the case asminimising the compression work reduces the energy density. InA-CAES the expansion process should be the exact reverse of thecompression process in order to make the cycle as reversible aspossible. Therefore regarding the number of stages we suggest thatfewer is better, to maximise energy density, reduce pressure losses,reduce the number of components required and allow the airexpanders to work with higher inlet temperatures and higher pres-sure ratios. It is important to realise that the systems outlined herestore energy in two parts – partly in compressed gas and partly asheat; it is only the effective recombination of these parts that willlead to a successful A-CAES system. Hence another important dif-ference with conventional compressors and those used forA-CAES is the need to store the heat of compression, so theA-CAES compressors should minimise cooling during compressionallowing the maximum possible heat to be stored.
Accordingly it is likely that the progression of A-CAES will beaided by the development of specialised compressors designed tominimise any heat loss and output high temperature air whilemaximising reversibility. This equipment should be simple in thatno inter-cooling will be required – however it will also need to beable to withstand higher temperatures. These compressors shouldprovide a far better match to the reverse of modern gas turbineswhich operate with high pressure ratios.
7. Conclusions
We conclude that an A-CAES system based on direct-contactheat exchangers (packed beds) is a better preliminary design thana system based on indirect-contact heat exchangers. We anticipatethat a continuous cycling efficiency in excess of 70% should beachievable using packed beds, as stratification of heat stored atdifferent temperatures can be effectively preserved. In terms ofefficiency the most important aspect is maintaining high compres-sor and expander efficiencies throughout the cycle.
A-CAES has potential as an energy storage medium. Althoughthe work here suggests that it may struggle to match emergingbattery technologies in terms of efficiency, the current high costsfor battery storage, its problems with cycle life and depth of dis-charge, and the fact that an A-CAES system should not require
any exotic materials, suggest that further investigation isworthwhile.
Future detailed analysis of both packed bed and conventionalheat exchanger based systems with sophisticated compressionand expansion modelling would be of value, accounting for thevariations in specific heat capacity and including a very rigorouspacked bed model. However, should funding be available, the mostinformative next step may be the construction of a small-scale pro-totype system, developing the necessary air compression andexpansion technology and comparing the use of packed bedsagainst conventional heat exchangers.
On a final note, A-CAES is a thermo-mechanical storage systemand this paper has studied its mechanical–mechanical turnaroundefficiency. An alternative strategy for using A-CAES would be to usethe compression heat and the cold compressed air separately, forexample by using the stored heat for hot water and the cool com-pressed air for simultaneous power and cooling. Investigation intothis type of use is worthwhile and may turn out to have morefavourable economics.
Acknowledgements
This work was supported by the Engineering and PhysicalSciences Research Council under the grants EP/K002252/1(Energy Storage for Low Carbon Grids) and EP/L014211/1 (NextGeneration Grid Scale Thermal Energy Storage Technologies).
Appendix A. Validation of numerical compressor model
This appendix derives the analytical solution for the workrequired to change the pressure in a constant volume constanttemperature store from some initial pressure to a final pressurepstore,max when there are no pressure losses in the after-cooling heatexchanger. The after cooling heat exchanger cools the air from theexit temperature of the compressor to the storage (= ambient)temperature. The results match the numerical model outlined byEqs. (7) and (8) and so serve to provide some validation. Thederivation is as follows:
Consider compressing an infinitesimal amount of gas, dm, fromthe ambient pressure p0 to the storage pressure pstore, then coolingit back to the ambient temperature with no pressure loss, and thenadding it to a store at the same temperature. Eq. (2) becomes Eq.(A1) for an infinitesimal amount of gas.
dW ¼ dmcpT0pstore
p0
� � c�1gpolc
� 1
!ðA1Þ
We now substitute dm = Mg dn, where n is the amount of molescompressed and Mg is the molar mass of the gas. To simplify wealso substitute x = (c–1)/(cgpol), and Eq. (A1) can be written as:
dW ¼ dnMgcpT0pstore
p0
� � x
� 1� �
ðA2Þ
Using the ideal gas law pV ¼ nRT (where R is the universal gasconstant) and substituting dnT0 ¼ dp0V0=R yields:
dW ¼ dp0MgcpV0
R
pstore
p0
� � x
� 1� �
ðA3Þ
The store temperature Tstore is constant and equal to the ambi-ent temperature T0 (which is the initial temperature of the gas)and the gas is isobarically cooled back to ambient after it iscompressed. Therefore, p0V0 = pstoreVstore and hencedp0 = dpstore(Vstore/V0). Therefore it is possible to write:

814 E. Barbour et al. / Applied Energy 155 (2015) 804–815
dW ¼ dpstorecpVstore
Rpstore
p0
� � x
� 1� �
ðA4Þ
where R is replaced by the specific gas constant R ¼ R=Mg . Now thetotal work required to change the storage pressure pstore from theambient pressure p0 to some maximum storage pressure pstore,max
can then be found by integrating Eq. (A4):ZdW ¼ cpVstore
R
Z pstore;max
p0
pstore
p0
� � x
� 1� �
dpstore ðA5Þ
Putting in limits of p0 and pstore,max, and re-substituting back inx = (c–1)/(cgpol) leads to the expression for the work required toadd gas at an initial pressure p0 and temperature Tstore to a gasstore, which is also at temperature Tstore, in which the pressure isincreased from p0 to pstore,max:
W ¼pstore;maxVstorecp
Rp0
pstore;max�1þ
gpol;ccc�1þgpol;cc
pstore;max
p0
� �c�1=gpol;cc"
�gpol;cc
c�1þgpol;ccp0
pstore;max
!#ðA6Þ
Eq. (A6) agrees with the numerical prediction (Eq. (7)) as shown inFig. A1. The work available upon expanding the air from anever-decreasing initial storage pressure pstore with a maximumvalue pstore,max to a constant final ambient pressure p0 can be foundin a similar manner and is given by:
W ¼pstore;maxVstorecp
Rc
gpol;tðc� 1Þ � cp0
pstore;max
!� 1þ p0
pstore;max
"
� cgpol;tðc� 1Þ � c
p0
pstore;max
!gpol;tðc�1Þ=c35 ðA7Þ
Fig. A1 shows illustrates how the work required to fill a 10 m3
container with air at 3 atm (303.975 kPa) is different when thepressure in the container varies from 1 atm to 3 atm(101.325 kPa to 303.75 kPa) (calculated by Eq. (A6) and shown bythe lower dotted line) compared to when the pressure remainsconstant at 3 atm (calculated by Eq. (2) and shown by the upperdotted line). It also shows the work calculated by the finite step
Fig. A1. Illustrating the difference in the required work when the HP gas storagetank is at a constant high pressure (isobaric storage) compared to when thepressure increases as more air is added to the store (variable high pressure storage)– dotted lines. The blue line shows the numerical estimate for the variable pressurework for different mass increment sizes. A mass increment of 0.01 is usedthroughout for the numerical model.
model (Eq. (7)) using different mass increments of air (blue line).It can be seen that the finite step method becomes a very goodapproximation for the work required when using mass incrementsequal to or less than 10�2 kg. Hence a mass increment of 10�2 kg isused throughout for the numerical model.
Appendix B. Supplementary material
Supplementary data associated with this article can be found, inthe online version, at http://dx.doi.org/10.1016/j.apenergy.2015.06.019.
References
[1] Barton JP, Infield DG. Energy storage and its use with intermittent renewableenergy. IEEE T Energy Conver 2004;19:441–8.
[2] Carrasco JM, Franquelo LG, Bialasiewicz JT, Galvan E, Guisado RCP, Prats AM,et al. Power-electronic systems for the grid integration of renewable energysources: a survey. IEEE T Ind Electron 2006;53:1002–16.
[3] Connolly D, Lund H, Mathiesen BV, Leahy M. The first step towards a 100%renewable energy-system for Ireland. Appl Energy 2011;88:502–7.
[4] Lund H, Ostergaard PA, Stadler I. Towards 100% renewable energy systems.Appl Energy 2011;88:419–21.
[5] Dell RM, Rand DAJ. Energy storage – a key technology for global energysustainability. J Power Sources 2001;100:2–17.
[6] Barbour E, Bryden IG. Energy storage in association with tidal currentgeneration systems. P I Mech Eng a-J Pow 2011;225:443–55.
[7] Duic N, Carvalho MD. Increasing renewable energy sources in island energysupply: case study Porto Santo. Renew Sust Energy Rev 2004;8:383–99.
[8] Crotogino F, Mohmeyer K-U, Scharf R. Huntorf caes: more than 20 years ofsuccessful operation. Spring 2001 Meeting, Orlando, Florida, USA; 15–18 April2001.
[9] Nakhamkin M, Chiruvolu M. Available Compressed Air Energy Storage (CAES)Plant Concepts; 2007.
[10] B.I.N.E. B.I.N.E. Informationsdienst. Projekt info 05/07; 2007. <http://www.bine.info/en/publications/publikation/druckluftspeicher-kraftwerke/>
[11] Cavallo A. Controllable and affordable utility-scale electricity fromintermittent wind resources and compressed air energy storage (CAES).Energy 2007;32:120–7.
[12] Greenblatt JB, Succar S, Denkenberger DC, Williams RH, Socolow RH. Baseloadwind energy: modeling the competition between gas turbines and compressedair energy storage for supplemental generation. Energy Policy 2007;35:1474–92.
[13] Lund H, Salgi G. The role of compressed air energy storage (CAES) in futuresustainable energy systems. Energy Convers Manage 2009;50:1172–9.
[14] Ibrahim H, Ilinca A, Perron J. Energy storage systems – characteristics andcomparisons. Renew Sust Energ Rev 2008;12:1221–50.
[15] Schainker RB. Executive overview: Energy storage options for a sustainableenergy future. 2004 IEEE Power Engineering Society General Meeting, Vols 1and 2; 2004: 2309–14.
[16] Schoenung SM, Eyer JM, Iannucci JJ, Horgan SA. Energy storage for acompetitive power market. Annu Rev Energy Env 1996;21:347–70.
[17] RWE power. ADELE – Adiabatic compressed air energy storage for electricitysupply.http://www.rwe.com/web/cms/mediablob/en/391748/data/364260/1/rwe-power-ag/innovations/adele/Brochure-ADELE.pdf.
[18] Garrison JB, Webber ME. An integrated energy storage scheme for adispatchable solar and wind powered energy system. J Renew SustainEnergy 2011;3.
[19] Pimm AJ, Garvey SD, de Jong M. Design and testing of Energy Bags forunderwater compressed air energy storage. Energy 2014;66:496–508.
[20] Garvey SD. The dynamics of integrated compressed air renewable energysystems. Renew Energy 2012;39:271–92.
[21] Cheung BC, Carriveau R, Ting DSK. Parameters affecting scalable underwatercompressed air energy storage. Appl Energy 2014;134:239–47.
[22] Hydrostor.http://hydrostor.ca/home/.[23] Lightsail Energy.http://www.lightsail.com/.[24] SustainX smarter energy storage.http://www.sustainx.com/.[25] Bullough C, Gatzen C, Jakiel C, Koller M, Nowi A, Zunft S. Advanced adiabatic
compressed air energy storage for the integration of wind energy. In:Proceedings of the European Wind Energy Conference. London; 2004.
[26] Grazzini G, Milazzo A. Thermodynamic analysis of CAES/TES systems forrenewable energy plants. Renew Energy 2008;33:1998–2006.
[27] Pickard WF, Hansing NJ, Shen AQ. Can large-scale advanced-adiabaticcompressed air energy storage be justified economically in an age ofsustainable energy? J Renew Sustain Energy 2009;1.
[28] Kim YM, Lee JH, Kim SJ, Favrat D. Potential and evolution of compressed airenergy storage: energy and exergy analyses. Entropy-Switz 2012;14:1501–21.
[29] Grazzini G, Milazzo A. A thermodynamic analysis of multistage adiabatic CAES.P IEEE 2012;100:461–72.
[30] Hartmann N, Vohringer O, Kruck C, Eltrop L. Simulation and analysis ofdifferent adiabatic compressed air energy storage plant configurations. ApplEnergy 2012;93:541–8.

E. Barbour et al. / Applied Energy 155 (2015) 804–815 815
[31] Wolf D, Budt M. LTA-CAES – a low-temperature approach to adiabaticcompressed air energy storage. Appl Energy 2014;125:158–64.
[32] Desrues T, Ruer J, Marty P, Fourmigue JF. A thermal energy storage process forlarge scale electric applications. Appl Therm Eng 2010;30:425–32.
[33] White A, McTigue J, Markides C. Wave propagation and thermodynamic lossesin packed-bed thermal reservoirs for energy storage. Appl Energy2014;130:648–57.
[34] Thomas PJ. Simulation of industrial processes for control engineers.Butterworth-Heinemann; 1999.
[35] Hanchen M, Bruckner S, Steinfeld A. High-temperature thermal storage using apacked bed of rocks – heat transfer analysis and experimental validation. ApplTherm Eng 2011;31:1798–806.
[36] Villatoro FR, Pérez J, Domínguez-Muñoz F, Cejudo-López JM. Approximateanalytical solution for the heat transfer in packed beds for solar thermalstorage in building simulators. In: Eleventh International IBPSA Conference2009. p. 709–15.
[37] Schumann TEW. Heat transfer: a liquid flowing through a porous prism. JFrankl Inst 1929;208:405–16.
[38] Villatoro FR, Perez J, Santander JLG, Borovsky MA, Ratis YL, Izzheurov EA, et al.Perturbation analysis of the heat transfer in porous media with small thermalconductivity. J Math Anal Appl 2011;374:57–70.
[39] Adeyanju AA, Manohar K. Theoretical and experimental investigation of heattransfer in packed beds. Res J Appl Sci 2009;4:166–7.
[40] Coutier JP, Farber EA. 2 Applications of a numerical approach of heat-transferprocess within rock beds. Sol Energy 1982;29:451–62.
[41] Zanganeh G, Pedretti A, Haselbacher A, Steinfeld A. Design of packed bedthermal energy storage systems for high-temperature industrial process heat.Appl Energy 2015;137:812–22.
[42] Nakhamkin M, Andersson L, Swensen E, Howard J, Meyer R, Schainker R, et al.Aec 110 Mw Caes plant – status of project. J Eng Gas Turb Power.1992;114:695–700.
[43] Badescu V. Optimal paths for minimizing lost available work during usualfinite-time heat transfer processes. J Non-Equil Thermody 2004;29:53–73.
[44] Ergun S. Fluid flow through packed columns. Chem Eng Prog 1952;48:89–94.[45] Nemec D, Levec J. Flow through packed bed reactors: 1. Single-phase flow.
Chem Eng Sci 2005;60:6947–57.[46] Du Plessis JP, Woudberg S. Pore-scale derivation of the Ergun equation to
enhance its adaptability and generalization. Chem Eng Sci 2008;63:2576–86.[47] Barbour E.http://energystoragesense.com.[48] Barbour E, Wilson IAG, Bryden IG, McGregor PG, Mulheran PA, Hall PJ. Towards
an objective method to compare energy storage technologies: developmentand validation of a model to determine the upper boundary of revenueavailable from electrical price arbitrage. Energy Environ Sci 2012;5:5425–36.
[49] IChemE. A Guide to Capital Cost Estimating, 3rd Edition: The Institution ofChemical Engineers, The Association of Cost Engineers.
[50] NYE Thermodynamics Corporation. Gas turbine prices.http://www.gas-turbines.com/trader/prices.htm.
[51] Wen ZY, Cao JD, Gu ZH, Xu XH, Zhang FL, Lin ZX. Research on sodium sulfurbattery for energy storage. Solid State Ionics 2008;179:1697–701.
[52] Divya KC, Ostergaard J. Battery energy storage technology for power systems-An overview. Electr Pow Syst Res 2009;79:511–20.
[53] Mignard D. Estimating the capital costs of energy storage technologies forlevelling the output of renewable energy sources. Int J Environ Stud2014;71(6):796–803.