adhesive dynamics simulations of the shear threshold
TRANSCRIPT

University of Pennsylvania University of Pennsylvania
ScholarlyCommons ScholarlyCommons
Departmental Papers (BE) Department of Bioengineering
February 2008
Adhesive Dynamics Simulations of the Shear Threshold Effect for Adhesive Dynamics Simulations of the Shear Threshold Effect for
Leukocytes Leukocytes
Kelly Kaputo University of Pennsylvania
Dooyoung Lee University of Rochester
Michael R. King University of Rochester
Daniel A. Hammer University of Pennsylvania, [email protected]
Follow this and additional works at: https://repository.upenn.edu/be_papers
Recommended Citation Recommended Citation Kaputo, K., Lee, D., King, M. R., & Hammer, D. A. (2008). Adhesive Dynamics Simulations of the Shear Threshold Effect for Leukocytes. Retrieved from https://repository.upenn.edu/be_papers/108
Reprinted from Biophysical Journal, Volume 92, February 2007, pages 787-797. Publisher URL: http://dx.doi.org/http://www.biophysj.org/cgi/content/abstract/biophysj.105.070706v1
This paper is posted at ScholarlyCommons. https://repository.upenn.edu/be_papers/108 For more information, please contact [email protected].

Adhesive Dynamics Simulations of the Shear Threshold Effect for Leukocytes Adhesive Dynamics Simulations of the Shear Threshold Effect for Leukocytes
Abstract Abstract Many experiments have measured the effect of force on the dissociation of single selectin bonds, but it is not yet clear how the force dependence of molecular dissociation can influence the rolling of cells expressing selectin molecules. Recent experiments using constant-force atomic force microscopy or high-resolution microscopic observations of pause-time distributions of cells in a flow chamber show that for some bonds, the dissociation rate is high at low force and initially decreases with force, indicating a catch bond. As the force continues to increase, the dissociation rate increases again, like a slip bond. It has been proposed that this catch-slip bond leads to the shear threshold effect, in which a certain level of shear rate is required to achieve rolling. We have incorporated a catch-slip dissociation rate into adhesive dynamics simulations of cell rolling. Using a relatively simple model for the shear-controlled association rate for selectin bonds, we were able to recreate characteristics of the shear threshold effect seen most prominently for rolling through L-selectin. The rolling velocity as a function of shear rate showed a
minimum near 100 s–1. Furthermore, cells were observed to roll at a shear rate near the threshold, but detach and move more quickly when the shear rate was dropped below the threshold. Finally, using adhesive dynamics, we were able to determine ranges of parameters necessary to see the shear threshold effect in the rolling velocity. In summary, we found through simulation that the catch-slip behavior of selectin bonds can be responsible for the shear threshold effect.
Comments Comments Reprinted from Biophysical Journal, Volume 92, February 2007, pages 787-797. Publisher URL: http://dx.doi.org/http://www.biophysj.org/cgi/content/abstract/biophysj.105.070706v1
This journal article is available at ScholarlyCommons: https://repository.upenn.edu/be_papers/108

Adhesive Dynamics Simulations of the Shear Threshold Effectfor Leukocytes
Kelly E. Caputo,* Dooyoung Lee,y Michael R. King,z and Daniel A. Hammer*§
*Department of Chemical and Biomolecular Engineering, University of Pennsylvania, Philadelphia, Pennsylvania;yDepartment of Chemical Engineering, and zDepartment of Biomedical Engineering, University of Rochester, Rochester, New York;and §Department of Bioengineering, University of Pennsylvania, Philadelphia, Pennsylvania
ABSTRACT Many experiments have measured the effect of force on the dissociation of single selectin bonds, but it is not yetclear how the force dependence of molecular dissociation can influence the rolling of cells expressing selectin molecules. Recentexperiments using constant-force atomic force microscopy or high-resolution microscopic observations of pause-time distribu-tions of cells in a flow chamber show that for some bonds, the dissociation rate is high at low force and initially decreases withforce, indicating a catch bond. As the force continues to increase, the dissociation rate increases again, like a slip bond. It hasbeen proposed that this catch-slip bond leads to the shear threshold effect, in which a certain level of shear rate is required toachieve rolling. We have incorporated a catch-slip dissociation rate into adhesive dynamics simulations of cell rolling. Using arelatively simple model for the shear-controlled association rate for selectin bonds, we were able to recreate characteristics ofthe shear threshold effect seen most prominently for rolling through L-selectin. The rolling velocity as a function of shear rateshowed a minimum near 100 s�1. Furthermore, cells were observed to roll at a shear rate near the threshold, but detach and movemore quickly when the shear rate was dropped below the threshold. Finally, using adhesive dynamics, we were able to de-termine ranges of parameters necessary to see the shear threshold effect in the rolling velocity. In summary, we found throughsimulation that the catch-slip behavior of selectin bonds can be responsible for the shear threshold effect.
INTRODUCTION
Neutrophils are the most abundant of the leukocytes, found
in quantities of ;5 3 106/mL of blood (1). At sites of inflam-
mation, several types of adhesion molecules, including selec-
tins, are expressed on the blood vessel walls. Neutrophils
possess the appropriate counterreceptors and are captured
from the blood stream upon bond formation. A captured neu-
trophil then rolls on the vessel wall as bonds form at the lead-
ing edge of the cell and break at the rear. This slow rolling
allows signaling events to occur that activate the cell (2,3).
Once b2-integrin molecules on the neutrophil are in their
active, high-affinity state, the neutrophil firmly adheres to the
vessel wall and extravasates between endothelial cells to the
tissue where it can eliminate foreign invaders.
The rolling step of the adhesion process has been carefully
examined in vitro by allowing cells to flow over and interact
with a surface coated in adhesion molecules (either selectins
or their ligands). Rolling behavior is characterized by motion
of the cells at velocities significantly below that of the free
stream. On some molecular surfaces, however, studies at low
shear rates have observed that these cells do not readily
form adhesive interactions with the surface and do not roll,
whereas at higher shear rates, cells are able to roll (2,4–10).
This requirement of a high enough level of shear for the cell
to roll has been termed the shear threshold effect. Such a
requirement may help prevent the undesired accumulation of
cells at low-flow sections of the vasculature and aggregation
of neutrophils within the blood stream (11,12).
Both P- and L-selectin-mediated rolling have revealed
the shear threshold effect (5); however, the effect is most
prominent for rolling via L-selectin. A commonly reported
trademark of the shear threshold effect is a maximum in the
number of rolling cells at an intermediate value of shear
stress (4,7,8). For neutrophils rolling via L-selectin bonds on
peripheral-node addressin (PNAd), for instance, the number
of tethered and rolling cells was zero at low shear stresses,
increased to a maximum around 1 dyn/cm2, then decreased
again as the shear stress became large (4). There are, how-
ever, other interesting manifestations of the shear threshold
effect. For example, the average rolling velocity of neutro-
phils on a low density of soluble P-selectin glycoprotein
ligand-1 (sPSGL-1) has been observed to decrease with
shear rate to a minimum at ;100 s�1 before increasing again
(10). Also, when stable rolling of a single neutrophil on PNAd
was initiated near the optimum shear stress, a sudden drop in
flow rate to below the threshold resulted in detachment of the
cell after a brief period of continued rolling (2). Another
noteworthy observation is that neutrophils did not readily
initiate rolling on the CD34 component of PNAd at a high
shear stress. However, if rolling was initiated near the opti-
mum shear stress, cells remained bound and rolling even when
the flow was suddenly increased (7).
There are two prevailing theories as to the cause of the shear
threshold effect: a receptor-ligand on rate that is influenced by
shear rate and an off rate that displays catch-bond behavior at
low shear rates and slip-bond behavior at high shear rates.
Submitted January 30, 2006, and accepted for publication October 6, 2006.
Address reprint requests to Daniel A. Hammer, 240 Skirkanich Hall, 210 S.
33rd St., Dept. of Bioengineering, University of Pennsylvania, Philadelphia,
PA 19104-6321. Tel.: 215-573-6761; E-mail: [email protected].
� 2007 by the Biophysical Society
0006-3495/07/02/787/11 $2.00 doi: 10.1529/biophysj.106.082321
Biophysical Journal Volume 92 February 2007 787–797 787

Chang and Hammer (13) theorized that the on rate for cell
adhesion molecules increases with relative velocity between
the cell and substrate surfaces. As the surfaces pass by each
other more rapidly, the rate of encounter between adhesion
molecules increases, leading to an on rate that increases with
shear rate. At the same time, the probability of reaction
decreases as the molecules spend less time in proximity of
each other, so the on rate plateaus at large relative velocities.
In support of this theory of a shear dependent on rate, Dwir
and co-workers (14) found that by altering medium viscosity
a threshold level of shear rate, not shear stress, was required
to initiate stable L-selectin tethers for pre-B lymphocytes on
PNAd. It is possible that at low shear rates, and therefore low
relative velocity between binding surfaces, the on rate is too
low to initiate binding.
Alternatively, a unique off rate could lead to the shear
threshold effect. Several flow chamber and atomic force
microscopy (AFM) constant-force dissociation experiments
have detected a catch-slip bond for selectin molecules in which
the off rate initially decreases, then increases with force
(9,10,14,15). Measuring the lifetimes of P-selectin/PSGL-1
bonds over a range of forces applied by AFM, Marshall and
co-workers (15) found that the off rate of the bonds went
through a dramatic minimum at a pulling force of ;30 pN.
However, P-selectin bonds with the antibody G1 revealed an
off rate that increased exponentially with force according to
the Bell model (16). In another experiment (10), neutrophils
were allowed to bind to a sparsely coated surface of sPSGL-1
in a flow chamber. Lifetimes of the transient binding events
were measured and a constant force on the bonds was
estimated based on the experimental conditions. The off rate
of the L-selectin/sPSGL-1 bonds was a function of the force
on the bond and showed a minimum at ;80 pN. Evans and
co-workers (17) were able to deduce a possible mechanism
for the experimentally detected catch-slip-bond behavior,
specifically for the P-selectin/PSGL-1 bond. They postulated
that the bond exists in equilibrium between two states. Bond
failure can occur via either state, with pathway 1 being fast
and pathway 2 being slow. At low forces, state 1 is more
populated, so bond dissociation is fast. As the force on the
bond increases, state 2 becomes more populated so bond
dissociation slows, leading to a catch-bond behavior. Barsegov
and Thirumalai suggested a similar two-state model for
P-selectin/PSGL-1 bond dissociation (18). Though it has
been detected for both, the catch-slip behavior is more prom-
inent for L-selectin than it is for P-selectin bonds, which
corresponds to the more prominent shear threshold effect for
L-selectin.
Adhesive dynamics is a computational tool developed in
our lab to simulate cell adhesion (19). In adhesive dynamics,
a model cell is placed in a shear flow and bonds with the
surface stochastically form and break in accordance with the
association and dissociation rates of the binding molecules.
Previous models were able to recreate cell-free rolling be-
havior using the Bell model for the off rate and a constant on
rate (20–25). More recently, deformable microvilli, which
greatly improved adhesiveness and rolling, were added to the
model (26). Also, activation of model integrins on the cell by
selectin ligation recreated the transition from rolling to firm
adhesion (27). Although adhesive dynamics has modeled
several aspects of cell adhesion, simulations have not yet
recreated the shear threshold effect.
By using new kinetic rates in an adhesive dynamics
model, we investigate in this work whether the catch-slip
bond or shear-induced on rate, or both, is necessary for the
shear threshold effect in rolling via L-selectin. We found that
though the shear threshold effect was recreated best when
both new kinetic rates were used, it was attainable using just
the catch-slip off rate with a constant on rate. Later, we
explore parameter space to understand how sensitive the
shear threshold effect is to parameter values that control the
molecular behavior of the system, particularly the catch-slip
off rate.
MODEL
The physics of this model is similar to previous adhesive
dynamics models of cell rolling, the details of which can be
found elsewhere (19,26,28). Briefly, a hard sphere represents
the cell in a shear flow over a planar surface coated with
PSGL-1 molecules. Protruding from the sphere are randomly
distributed microvilli with L-selectin molecules on their tips.
Bonds between the cell and surface stochastically form and
break based on the bond kinetics, causing the cell to roll.
Under the pulling force of a bond, the microvilli stretch
according to the rheology described by Shao and co-workers
(29). The difference in this model is in the bond kinetics. In-
stead of the Bell model for the off rate and a simple assumed
on rate, a catch-slip bond is used for the off rate with a shear-
controlled on rate.
Off rate
Instead of the Bell model, in which the off rate increases
exponentially with force, Evans’ two-state catch-slip model
is used (17). Evans and co-workers deduced the two-state
model from a series of dynamic force spectroscopy (DFS)
experiments using a biomembrane force probe. When pulled
on at a constant loading rate that was slow, all P-selectin/
PSGL-1 bonds ruptured at low forces. At an intermediate
loading rate, many bonds broke at low forces, but there was
also another peak of bond breakage events at a higher force.
Finally, at fast loading rates, only a few bonds broke at low
forces and the peak of bond breakage events occurred at an
even higher force. The peak at high force appeared to follow
behavior expected of a single dissociation pathway defined
by the Bell model. Enlightening results were obtained from a
modification of the simple steady-ramp loading experiments.
When the force applied to the bonds was suddenly increased
to a value of ;30 pN, then ramped up at a constant rate, there
788 Caputo et al.
Biophysical Journal 92(3) 787–797

was no longer evidence of bond breakage at low forces. These
jump/ramp experiments suggested that there are two path-
ways for dissociation. Pathway 1 is very fast and dominates
at low forces, which is why bonds broke at low force under
slow steady ramps. This pathway was avoided in the jump/
ramp experiments because the force was jumped up to a level
where the fast pathway was no longer dominant. Pathway 2,
as mentioned, is a slower pathway that follows the Bell
model and dominates at high forces.
To model this two-pathway dissociation, as depicted in
Fig. 1 A, Evans and co-workers (17) assumed that the path-
ways come from two possible bound states. Dissociation via
the two pathways occurs with rates k1rup and k2rup. It was
assumed that the off rate for the fast pathway is constant at
k1rup. For the slow pathway, on the other hand, dissociation
was assumed to follow the Bell model for an exponential
increase in off rate with force, so k2rup ¼ k02expðf =fbÞ. The
unstressed off rate of the slow pathway is given by k02 and
the force scale for the increase in off rate with force, f, is fb.
The dominant dissociation pathway is determined by the
occupancy ratio of the two states. The states were assumed to
be in equilibrium at all times (fast equilibration) with a small
difference in energy between state 2 and state 1, DE21. Ac-
cording to the Boltzmann distribution, this energy difference
sets the equilibrium occupancy ratio, F0, of state 1 to state 2
at zero force. However, force applied to the bond causes a
shift in the energy of each state, resulting in a change in the
energy difference between the states. The occupancy ratio of
the two states, then, changes exponentially with applied
force with a scale of f12. So, although pathway 1 may domi-
nate at low forces where equilibrium favors occupancy of
state 1, at higher forces, pathway 2 dominates as equilibrium
shifts to favor occupancy of state 2. For bonds exhibiting this
type of catch-slip behavior, the off rate is given by (17)
kr ¼F0k1rup 1 exp
f
f12
� �k
0
2expf
fb
� �� �
F0 1 expf
f12
� � ; (1)
where F0 ¼ expðDE21=kBTÞ is the equilibrium constant
between the two states at zero force.
In Evans’ model, there are five parameters that describe the
catch-slip behavior of bonds. The equilibration parameters,
DE21 and f12, control the force at which the change of
dominant pathway occurs and the range of force required to
complete the switch. The dissociation rate parameters, k1rup
and k02, determine the extremes in the off rate. The constant
rate of the fast pathway controls how fast the off rate is at zero
force, whereas the unstressed rate of the slow pathway sets
the minimum in off rate at an intermediate value of the force.
Finally, the force scale for the Bell model, fb, sets the degree
of rate increase with force at high forces. A larger value of fbcorresponds to a more gradual increase in off rate with force.
Though Evans’ model was derived for the P-selectin/
PSGL-1 bond, experiments have shown similar catch-slip be-
havior for L-selectin bonds. Therefore, in this work, Evans’
catch-slip model was used to express the off rate as a function
FIGURE 1 Receptor-ligand reaction rates. (A) Depiction
of Evans’ two-state model for bond dissociation. Bonds can
exist in two states. At low forces, state 1 is likely populated
and breakage via this state is fast with constant rate k1rup. As
the force on the bond increases, state 2 becomes more
likely. Breakage via state 2 is slower with rate k2rup, which
increases with force according to the Bell model. (B) Base-
case and best-case (dashed line) catch-slip off rates as a
function of force. Evans’ model parameters were chosen as
given in Table 1 to correspond to experimental L-selectin
off-rate data. The parameters k1rup and k02 strongly influence
the high off rate at low forces and the low off rate at
intermediate forces, respectively. Experimental off rates are
for L-selectin/PSGL-1 bonds measured by AFM (n) (9),
neutrophils on sparse sPSGL-1 in a flow chamber (:) (10),
and L-selectin-expressing lymphocytes on PSGL-1-
derived peptides in a flow chamber (¤) (14). (C) Schematic
for shear-controlled on-rate derivation. A molecule of
interest is shown with its reactive circle of radius a. A
uniform distribution of molecules on the apposing surface
approaches the circle with relative velocity |V|. The time T
spent in the reactive circle depends on the angle of the entry
point, u. At angles u # uc, the molecules are in binding
proximity less than the required amount of time, 1/n, so the
probability of those molecules binding is zero. (D) Base-
case shear-controlled on rate with parameters given in
Table 1. The unstressed on rate increases with relative
velocity between surfaces, but then drops to zero when
molecules pass by each other too quickly to bind.
Shear Threshold Effect 789
Biophysical Journal 92(3) 787–797
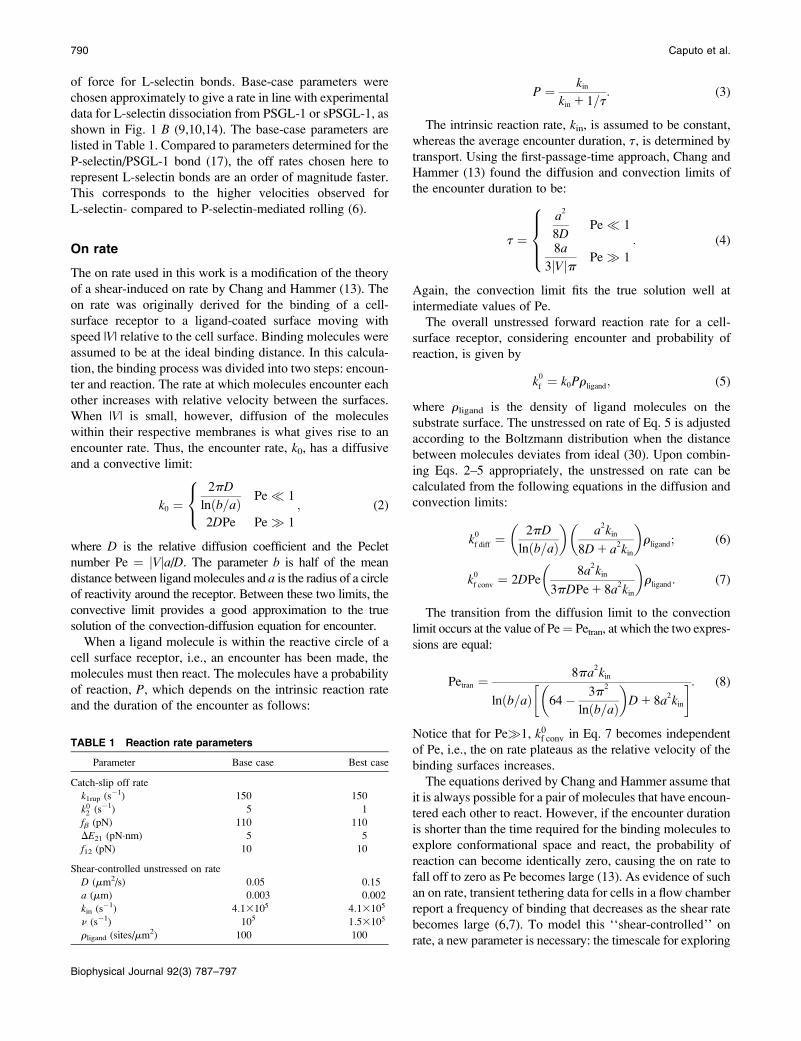
of force for L-selectin bonds. Base-case parameters were
chosen approximately to give a rate in line with experimental
data for L-selectin dissociation from PSGL-1 or sPSGL-1, as
shown in Fig. 1 B (9,10,14). The base-case parameters are
listed in Table 1. Compared to parameters determined for the
P-selectin/PSGL-1 bond (17), the off rates chosen here to
represent L-selectin bonds are an order of magnitude faster.
This corresponds to the higher velocities observed for
L-selectin- compared to P-selectin-mediated rolling (6).
On rate
The on rate used in this work is a modification of the theory
of a shear-induced on rate by Chang and Hammer (13). The
on rate was originally derived for the binding of a cell-
surface receptor to a ligand-coated surface moving with
speed |V| relative to the cell surface. Binding molecules were
assumed to be at the ideal binding distance. In this calcula-
tion, the binding process was divided into two steps: encoun-
ter and reaction. The rate at which molecules encounter each
other increases with relative velocity between the surfaces.
When |V| is small, however, diffusion of the molecules
within their respective membranes is what gives rise to an
encounter rate. Thus, the encounter rate, k0, has a diffusive
and a convective limit:
k0 ¼2pD
lnðb=aÞ Pe� 1
2DPe Pe� 1
;
8<: (2)
where D is the relative diffusion coefficient and the Peclet
number Pe ¼ jVja/D. The parameter b is half of the mean
distance between ligand molecules and a is the radius of a circle
of reactivity around the receptor. Between these two limits, the
convective limit provides a good approximation to the true
solution of the convection-diffusion equation for encounter.
When a ligand molecule is within the reactive circle of a
cell surface receptor, i.e., an encounter has been made, the
molecules must then react. The molecules have a probability
of reaction, P, which depends on the intrinsic reaction rate
and the duration of the encounter as follows:
P ¼ kin
kin 1 1=t: (3)
The intrinsic reaction rate, kin, is assumed to be constant,
whereas the average encounter duration, t, is determined by
transport. Using the first-passage-time approach, Chang and
Hammer (13) found the diffusion and convection limits of
the encounter duration to be:
t ¼
a2
8DPe� 1
8a
3jVjp Pe� 1
:
8>><>>:
(4)
Again, the convection limit fits the true solution well at
intermediate values of Pe.
The overall unstressed forward reaction rate for a cell-
surface receptor, considering encounter and probability of
reaction, is given by
k0
f ¼ k0Prligand; (5)
where rligand is the density of ligand molecules on the
substrate surface. The unstressed on rate of Eq. 5 is adjusted
according to the Boltzmann distribution when the distance
between molecules deviates from ideal (30). Upon combin-
ing Eqs. 2–5 appropriately, the unstressed on rate can be
calculated from the following equations in the diffusion and
convection limits:
k0
f diff ¼2pD
lnðb=aÞ
� �a2kin
8D 1 a2kin
� �rligand; (6)
k0
f conv ¼ 2DPe8a
2kin
3pDPe 1 8a2kin
� �rligand: (7)
The transition from the diffusion limit to the convection
limit occurs at the value of Pe¼ Petran, at which the two expres-
sions are equal:
Petran ¼8pa
2kin
lnðb=aÞ 64� 3p2
lnðb=aÞ
� �D 1 8a
2kin
� �: (8)
Notice that for Pe�1, k0f conv in Eq. 7 becomes independent
of Pe, i.e., the on rate plateaus as the relative velocity of the
binding surfaces increases.
The equations derived by Chang and Hammer assume that
it is always possible for a pair of molecules that have encoun-
tered each other to react. However, if the encounter duration
is shorter than the time required for the binding molecules to
explore conformational space and react, the probability of
reaction can become identically zero, causing the on rate to
fall off to zero as Pe becomes large (13). As evidence of such
an on rate, transient tethering data for cells in a flow chamber
report a frequency of binding that decreases as the shear rate
becomes large (6,7). To model this ‘‘shear-controlled’’ on
rate, a new parameter is necessary: the timescale for exploring
TABLE 1 Reaction rate parameters
Parameter Base case Best case
Catch-slip off rate
k1rup (s�1) 150 150
k02 (s�1) 5 1
fb (pN) 110 110
DE21 (pN�nm) 5 5
f12 (pN) 10 10
Shear-controlled unstressed on rate
D (mm2/s) 0.05 0.15
a (mm) 0.003 0.002
kin (s�1) 4:13105 4:13105
n (s�1) 105 1:53105
rligand (sites/mm2) 100 100
790 Caputo et al.
Biophysical Journal 92(3) 787–797

conformational space, 1/n. If a molecule is in the reactive
circle for a time too brief compared to 1/n, its probability
of reaction is set to zero. The probability of reaction from
Chang and Hammer must be reformulated to account for this
new consideration.
It is assumed that the probability of reaction will be
significantly affected only in the convective limit, when
molecules are passing by each other more quickly. In the
convective limit, we can easily calculate the amount of time,
T, a molecule will spend in the reactive circle based on only
the point (u) at which the molecule enters the reactive circle,
the reactive radius, and the relative velocity with which it is
traveling. A schematic of the simplified system is shown in
Fig. 1 C. If the time in the reactive circle is less than the
timescale for exploration of conformational space, the prob-
ability of reaction for that molecule is set to zero. Therefore,
the cutoff condition is Tðu ¼ ucÞ ¼ 2asinuc=jVj ¼ 1=n. To
calculate an average probability of reaction for molecules pas-
sing through the reactive circle at all possible positions, Eq. 3
for the probability is integrated over the appropriate uniform
distribution of molecules from u ¼ ½uc;p=2� as follows:
P ¼
Z p=2
uc
kin
kin 1jVj
2asinu
sinudu2a
jVj.1
n
02a
jVj#1
n
:
8>>>><>>>>:
(9)
With this probability in the convective limit that decreases
to identically zero, the corresponding on rate initially
increases with velocity as the encounter rate increases, but
then decreases to zero as the probability of reaction decreases
to zero faster. A graph of this shear-controlled on rate for the
base-case parameters is shown in Fig. 1 D, and the pa-
rameters, selected to be in line with experimentally deter-
mined typical values (13), are listed in Table 1. The on rate
starts at a constant small value at small velocities while the
system is in the diffusion limit. As convection takes over, the
on rate increases to a maximum before decreasing to zero
when jVj ¼ 2an.
RESULTS
Adhesive dynamics simulations were used with updated ki-
netic rates, namely, a catch-slip off rate and a shear-controlled
on rate, to recreate the shear threshold effect for L-selectin
and to better understand its possible origins. Based on the
experimental observations of rolling via L-selectin, there are
several properties to look for in simulations of the shear
threshold effect. Because heterogeneity of cells is not in-
cluded in the model, flux measurements are not as meaningful
in the simulations, so results will focus on velocity measure-
ments. The characteristics of cell rolling sought in this work
are 1), a minimum in average rolling velocity as a function of
shear rate; 2), a brief continuation of rolling followed by
detachment at shear rates below the threshold when initiated
at the optimum shear rate; and 3), continuation of rolling at a
high shear rate when initiated at an optimum shear rate, but
not when initiated at the high shear rate.
Simulations were started at the given shear rate with the
model cell at close apposition to the binding surface. At each
set of conditions, five cells were simulated for 10 s each.
Average velocities were calculated based on the average dis-
tance traveled by the five cells over the last 9 s of the sim-
ulation.
Base case
With the initially chosen base-case on rate and off rate dis-
cussed in the Model section and given in Table 1, simula-
tions of cell rolling via L-selectin bonds showed a slight
minimum in average rolling velocity as a function of shear
rate. At very low shear rates (10 s�1), the velocity is small
simply because hydrodynamic velocity is small; there is
actually no rolling. At very high shear rates (.300 s�1), cells
never bind because the on rate drops to zero at these high
relative velocities. However, at intermediate shear rates, cells
bind to and roll along the surface at velocities significantly
below that of the free stream. The minimum in velocity
occurs at a shear rate of ;100 s�1, consistent with experi-
mental results as seen in Fig. 2 A (4,5,7,10).
It is interesting that over the range of shear rates tested, the
average number of bonds and bound microvilli per cell,
shown in Fig. 2 B, increases with shear rate. This observation
corresponds to the experimental results of Chen and Springer
(2), from which they deduce that an increase in bond number
with shear rate acts as an automatic braking system and could
lead to the shear threshold effect. Related to the increase in
bond number, Fig. 2 B also shows that the model predicts
that dimensionless velocity normalized by hydrodynamic
velocity significantly decreases with shear rate.
Besides performing the base-case simulations, we ex-
plored how different parameters in the rate expressions could
affect the appearance of the shear threshold effect. Of par-
ticular interest is the effect of the unstressed off rate for
pathway 2 of the catch-slip rate, k02, which gives the mini-
mum in off rate. Fig. 3 A shows that k02 can tune the velocity
of the cell when it is rolling at intermediate shear rates;
decreasing values of k02 lead to decreases in the minimum in
rolling velocity. An additional case to make note of is the
modification of the on-rate parameters D, a, and n to increase
the unstressed on rate in the diffusion limit, but decrease it in
the convective limit. With these changes in parameters given
as the best-case on rate in Table 1, and keeping the base-case
off rate, cells depicted in Fig. 3 B rolled at velocities similar
to the base case, but at a higher level of bonding to the surface.
Best-case comparison to experiments
The minimum in velocity that is indicative of the shear
threshold effect is apparent in the base case. The minimum
Shear Threshold Effect 791
Biophysical Journal 92(3) 787–797

occurs near the correct value of shear rate, but the simulated
velocities are higher than experimental velocities at inter-
mediate shear rates (see Fig. 2 A). Based on the parameter
exploration demonstrated in Fig. 3 A, lowering the value of
k02, which lowers the off rate at higher forces, should lead to a
better match with experimental data for rolling via L-selectin
bonds. This led to the formulation of a ‘‘best-case’’ set of
parameters, in which k02 was lowered by a factor of 5. Fig. 4
shows the best-case simulation (best-case parameters are
given in Table 1 and the best-case off rate is shown as a
dashed line in Fig. 1 B) along with experimental results and
the base case for comparison. The minimum in velocity for
the best case occurs near the correct value of shear rate, as it
does for the base case. The best-case simulation also pro-
vides an excellent match to experimental velocities, whereas
the base case was less successful.
Paralleling several experiments, simulations were per-
formed in which the shear rate was suddenly switched from
the optimum of 100 s�1 to above or below that rate. Again,
the best-case parameters for the kinetic rates were used.
Switching the shear rate from below the threshold (30 s�1) to
FIGURE 3 Average velocity and number of bonds versus shear rate for
explorations of rate parameters. (A) Various values of the unstressed off rate
(k02 ¼ 1; 5; and 15 s�1). The remaining parameters are from the base case.
This parameter, k02 , influences the velocity at intermediate values of shear
rate. (B) Different on rates. Results for the base-case on rate are compared to
results for the best-case on-rate parameter values D¼ 0.15 mm/s2, a¼ 0.002
mm, and n ¼ 1.5 3 105 s�1, which give a larger rate in the diffusion limit but
a smaller rate in the convective limit. The remaining parameters are from the
base case. The modified on rate generates more intimate binding to the
surface while maintaining rolling velocities similar to the base case.
FIGURE 2 Base-case results for L-selectin-mediated rolling. (A) Average
velocity as a function of shear rate. The base-case simulation shows a mini-
mum in velocity near 100 s�1, similar to experimental results. Experiments
are from Puri et al. (7), lymphocytes on CD34 at 50 or 300 sites/mm2; Yago
et al. (10), neutrophils on sPSGL-1 at 140 sites/mm2; Lawrence et al. (5) and
Finger et al. (4), T-cells on PNAd. (B) Number of bonds and bound
microvilli. Also, average velocity normalized by hydrodynamic velocity.
The dimensionless velocity decreases with shear rate whereas the number of
bonds increases.
792 Caputo et al.
Biophysical Journal 92(3) 787–797

the optimum and back produced clear changes in velocity.
As seen in Fig. 5 A, the simulated cells traveled at an average
velocity of ;60 mm/s when the shear rate was below the
threshold for rolling, but when the shear rate was increased to
the optimum, the cells slowed down and rolled at an average
velocity of ;20 mm/s. The instantaneous velocity of a single
representative cell is also shown in Fig. 5 A. The cell travels
near hydrodynamic velocity with a few brief attachments at
30 s�1. At 100 s�1, though, the cell typically travels slowly,
with a few spikes in velocity as bonds break during rolling.
Finger and co-workers (4) saw similar results in an experi-
ment in which T-cells rolled over a PNAd-coated surface at
an average velocity of 16.2 mm/s when the shear rate was at
180 s�1. After a sudden switch to 18 s�1, the cells detached
and traveled at the hydrodynamic velocity of 41.3 mm/s.
Rolling was restored when the shear rate returned to 180 s�1.
In a similar type of simulation, again using best-case pa-
rameters, cells were allowed to roll at the optimum shear rate
and then the shear rate was increased to 400 s�1. If initiated
at 400 s�1, cells would not form bonds and roll in the
simulation because the on rate drops to zero at that shear rate.
However, because a significant number of bonds had formed
at 100 s�1, some cells continued to roll briefly upon increas-
ing the shear rate to 400 s�1 as illustrated by the instanta-
neous velocity of a sample cell in Fig. 5 B. This type of result
has been demonstrated experimentally for L-selectin-mediated
rolling of lymphocytes on CD34 by Puri and co-workers (7).
They observed that the number of rolling cells per area
peaked at ;100 s�1, but was nearly zero at a shear rate ;250
s�1. However, when they initiated rolling at an optimum
shear rate, nearly 100% of the rolling cells remained bound
as the shear rate was increased up to ;1000 s�1.
Kinetic-rate sensitivity of theshear threshold effect
Clearly, the combination of a catch-slip off rate and a shear-
controlled on rate can reproduce some hallmarks of the shear
threshold effect, but which is more important to achieving the
characteristic phenomena? To further investigate the impor-
tance of the kinetic rates, we explored the sensitivity of the
shear threshold effect to each rate systematically.
FIGURE 4 Average velocity versus shear rate. For the best case, k02 ¼
1 s�1 so the off rate is smaller at higher forces. As described in the text, the
best-case parameters involve lowering k02 by a factor of 5 relative to the base
case, but provide a better match to experimental results (listed in Fig. 2) than
the base case does.
FIGURE 5 Average and instantaneous velocities during jumps in shear
rate. Average velocities were calculated over each 2-s period of constant
shear rate and are shown as horizontal lines with the standard error. The
instantaneous velocity of a representative cell is also shown over the course
of an entire 8-s simulation. (A) The shear rate is changed every 2 s between
30 s�1 and 100 s�1 as indicated in the figure. At 30 s�1, below the threshold
shear rate, cells travel near hydrodynamic velocity with only a few brief
attachments for an average velocity of ;61 mm/s. On the other hand, cells
roll slowly (;20 mm/s) at 100 s�1 with only a few spikes in velocity. (B) The
shear rate is changed every 2 s between 100 s�1 and 400 s�1 as indicated in
the figure. Cells bind and travel slowly with a few spikes in velocity as they
roll at 100 s�1. Upon the increase in shear rate to 400 s�1, some cells
momentarily maintain bonds and a slow rolling velocity before detaching to
the free stream. Therefore, the average velocity at 400 s�1 is below hydro-
dynamic velocity.
Shear Threshold Effect 793
Biophysical Journal 92(3) 787–797

First, as in Fig. 6 A, when the base-case catch-slip off rate
was used with an unstressed on rate that was constant at any
relative velocity, no minimum in average rolling velocity
was apparent when tested over a range of constant on rates
(k0on ¼ 10–100 s�1). As a hint of the shear threshold effect,
however, the dimensionless velocity did show a significant
decrease as the shear rate increased. When the best-case
parameters for the catch-slip bond were used (k02 ¼ 1 s�1), a
minimum appeared in the velocity as a function of shear rate,
even with a constant on rate.
Alternatively, the base-case shear-controlled on rate was
tested with a constant off rate that is not affected by force for
a range of off rates (koff ¼ 25�40 s�1). As demonstrated in
Fig. 6 B, there was no apparent minimum in velocity under
these conditions, nor was the dimensionless velocity indic-
ative of the shear threshold effect as it did not sharply
decrease with shear rate. We also tested for a minimum in
velocity with a constant off rate while varying each param-
eter of the shear-controlled on rate. Even when the on-rate
parameters were adjusted, there was no observable minimum
in velocity. In summary, these results suggest that catch-slip
bonds are necessary for the shear threshold effect, but the
effect is enhanced by a shear-controlled on rate.
State diagrams
Because of the apparent importance of the catch-slip off
rate to the shear threshold effect, we explored some of the
interesting parameters of the off rate in the form of state
diagrams. Remaining parameters were from the base case.
For each set of parameters, simulations were run over a range
of shear rates from 10 s�1 to 300 s�1, and the presence or
absence of the shear threshold effect was noted. For the
purpose of the state diagrams, the shear threshold effect was
identified by the following two conditions: 1), the average
velocity is .90% of the free-stream hydrodynamic velocity,
Vh, at the smallest shear rate of 10 s�1; and 2), there is a local
minimum in the average velocity over the range of shear
rates tested.
As seen in Fig. 7 A, the first pair of parameters explored
was k1rup and k02, since these parameters set the difference
between the high off rate at low force and the minimum in off
rate at intermediate force. At any value of k02, the lowest
possible value of k1rup that permitted the shear threshold
effect was ;125 s�1. For values smaller than this, cells
traveled too slowly (,90% Vh) at the lowest shear rate since
the unstressed off rate was too small. When either k02 or k1rup
was higher than the upper boundary, the dip in velocity
disappeared. The larger the minimum off rate (k02), the
smaller the unstressed off rate (k1rup) had to be in order for
the cells to roll slowly enough to produce the minimum in
velocity, hence the negative slope for the upper boundary.
No shear threshold effect was seen if k02 exceeded a critical
value. Fig. 7 B exemplifies the average rolling velocity
versus shear rate for parameter sets within each region of the
state diagram.
Fig. 7 C shows the shear threshold state diagram for the pa-
rameters DE21 and f12. These parameters affect the transition
between states 1 and 2 for bond dissociation. Because DE21
gives the difference in energy between states, in combination
with the distance between states, Dx12 ¼ kBT/f12, it deter-
mines the value of force at which the transition occurs. The
FIGURE 6 Alternative rate combina-
tions. In each panel, the best case, with a
catch-slip off rate and shear-controlled on
rate, is shown in gray as a reference. (A)
Catch-slip off rate with a constant on rate.
Average velocities versus shear rate for
representative parameters are shown in
the upper panel. With the base-case off-
rate parameters, there is no dip in velocity,
but when the best-case off-rate is used, a
minimum becomes apparent. The corre-
sponding dimensionless velocities are
shown in the lower panel. There is a
significant decrease in dimensionless ve-
locity even with a constant on rate. (B)
Shear-controlled on rate with a constant
off rate. Average velocities versus shear
rate for representative parameters are
shown in the upper panel. Neither the
base-case on-rate parameters nor an ad-
justed on rate with half of the base-case
ligand density gives a minimum in veloc-
ity. The corresponding dimensionless
velocities are given in the lower panel.
The dimensionless velocity does not monotonically decrease with shear rate for the base-case on rate. With an adjusted on rate, however, the dimensionless
velocity does decrease with shear rate, though not sharply, and there is no minimum in velocity.
794 Caputo et al.
Biophysical Journal 92(3) 787–797

two states are occupied equally when the force on the bond is
equal to DE21/Dx12. The sharpness of this switch is governed
by the force scale f12. As seen in the state diagram in Fig. 7 C,
the larger the difference in energy, the faster the switch can
be and still achieve the shear threshold effect, hence the
negatively sloped lines for both boundaries. Below the lower
line, the switch is too fast, so the off rate does not stay high
and cells travel too slowly at low shear rates. Above the
upper line, the switch is too slow and cells cannot roll slowly
enough to reach a minimum in velocity. Again, sample ve-
locities as a function of shear rate are shown in Fig. 7 D for
each region of the state diagram.
DISCUSSION
In this work, the adhesive dynamics model of cell rolling was
updated by the inclusion of revised expressions for the as-
sociation and dissociation rates of selectin bonds. With a
catch-slip bond for the off rate and a shear-controlled un-
stressed on rate, the essential characteristics of the shear
threshold effect for rolling via L-selectin were recreated. The
average rolling velocity measured over a range of shear rates
reached a minimum value at an intermediate shear rate near
the experimentally observed value of ;100 s�1. This dip in
velocity matched experimental measurements well when the
best-case rate parameters were used. In addition, a sudden
decrease in shear rate to below the shear threshold resulted in
detachment of a cell that was previously rolling near the
optimum shear rate, as has been observed in experiments.
Because the shear-controlled on rate decreases to zero when
the relative velocity is very high, cells would not initiate
rolling at high shear rates. On the other hand, if a cell was
already rolling near the optimum shear rate and the rate was
suddenly increased during the simulation, the cell continued
rolling briefly before detaching. This observation is also
consistent with experiments (7).
In this adhesive dynamics model, the microvilli were
allowed to deform according to the rheology measured by
Shao and co-workers (29) and described for use in a previous
adhesive dynamics model (26). Macroscopic deformation of
the whole cell body, on the other hand, was not allowed. We
believe that such a simplification is justified because, near
the threshold value of shear rate, cell deformation is not
expected to significantly affect rolling velocity (31,32). Fur-
thermore, the shear threshold effect has been detected in cell-
free systems in which there is no bead deformation. Greenberg
and co-workers found a maximum in the flux of sialyl Lewis-
coated beads rolling on L-selectin substrates (33). Also,
FIGURE 7 State diagrams for the
shear threshold effect in the space of
selected catch-slip bond parameters.
Other parameters are base case. In
region (i), cells travel at ,90% Vh at
low shear rates. In region (ii), cells do
not achieve a minimum in velocity.
(A) State-wise off rate parameter space.
When k1rup is too small, cells bind and
roll even at very low shear rates. When
k1rup is too large, cells do not reach a
minimum in velocity. The smaller k02 is,
however, the larger k1rup can be and still
achieve the minimum in velocity. The
shear threshold effect can never occur
when k02 is too large because cells will
not bind well enough to achieve a min-
imum in velocity. (B) Average velocity
as a function of shear rate. An example
from each region of the state diagram is
shown, with parameters given by the
corresponding symbols in A. (C) Tran-
sition parameter space. When f12 is too
small, cells roll at low shear rates since
the system quickly switches to the slow
pathway. When f12 is too large, on the
other hand, the switch to the slow
pathway occurs at too high a force, so
that cells cannot roll slowly enough to
achieve a minimum in velocity. (D)
Average velocity as a function of shear
rate. An example from each region of
the state diagram is shown with param-
eters given by the corresponding sym-
bols in C.
Shear Threshold Effect 795
Biophysical Journal 92(3) 787–797

measurements of the rolling velocities of L-selectin-coated
beads on sPSGL-1 substrates showed a distinct minimum as
a function of the force on the bead due to shear flow (10).
These experiments suggest that it is the adhesion molecules
that possess a unique property that can give rise to the shear
threshold effect.
Based on the simulation results from this model, both a
catch-slip bond and a shear-controlled on rate appear to con-
tribute to the minimum in rolling velocity that is distinctive
of the shear threshold effect. However, studies that isolate a
particular rate showed that a catch-slip off rate seems to
make the most important contribution to the shear threshold
effect. An exploration of parameter spaces within the context
of the catch-slip off rate led to state diagrams for the shear
threshold effect. Generally, for this adhesive dynamics model
for cell rolling, the shear threshold effect is best achieved by
a catch-slip bond with a significant difference between the
zero-force and minimum off rates. With such a rate, any bonds
that form at low shear rates do not persist long enough for the
cells to roll. However, bonds that form at an intermediate
shear rate feel a force such that the off rate is low and cells
roll. Also, to recreate the shear threshold effect, the switch
from the fast to slow dissociation state should not be slow
and should occur at an intermediate force within the range of
forces felt by a rolling cell. This ensures that the off rate is
high when the cells are in low flow and near its minimum
when the flow is near the optimum shear rate.
To select parameter values for the dissociation rate used
in these simulations, Evans’ catch-slip off rate model for
P-selectin/PSGL-1 bond dissociation (17) was fit to experi-
mental data for the off rate of L-selectin/PSGL-1 bonds as a
function of force (9,10,14). Ideally, Evans’ model, which
was derived from dynamic force spectroscopy, would have
been fit to similar data for L-selectin bonds, but such data
showing a catch-slip bond was not available. Instead, the
data came from experiments in which the L-selectin bonds
were held at a constant force. Based on the distribution of
breakage events, the off rate was deduced for each particular
force. Such constant-force experiments have revealed catch-
slip bond behavior for both L- and P-selectin bonds (9,10,14,
15). However, DFS generally gives very different results for
both selectin bonds (34–37). The different off rates measured
in constant-force and DFS single-bond experiments could be
due to a dependence on force history (35). It is also possible
that the resolution in DFS is not great enough to definitively
detect bonds that break very quickly at low forces on the
order of the thermal energy when the loading rate is slow
(38,39). Interestingly, the binding frequency has been shown
to increase as the loading rate increases, signifying that
bonds may be breaking quickly at low loading rates and
being counted as nonadhesion events (17,36). To better
represent the off-rate kinetics of L-selectin/PSGL-1 bonds
according to Evans’ model, DFS of the style that detected the
catch-slip bond for P-selectin/PSGL-1 should be performed
with L-selectin bonds.
The state diagrams for the shear threshold effect in catch-
slip bond parameter spaces showed a large region in which
the shear threshold effect was detected. At the same time,
there are large areas where the shear threshold effect was not
achievable. To map out such a state diagram experimentally,
L-selectin and its ligand could undergo a series of mutations
to create a library of molecular pairs with varying catch-slip
bond parameters that would have to be measured experi-
mentally for each mutant. By performing cell-free rolling
experiments with molecularly coated beads on an adhesive
substrate, a state diagram for the shear threshold effect could
be created. It would be interesting to learn experimentally the
characteristics of bond kinetics required for the shear
threshold effect.
REFERENCES
1. Alberts, B. 2002. Molecular Biology of the Cell. Garland Science,New York.
2. Chen, S., and T. A. Springer. 1999. An automatic braking system thatstabilizes leukocyte rolling by an increase in selectin bond number withshear. J. Cell Biol. 144:185–200.
3. Simon, S. I., and C. E. Green. 2005. Molecular mechanics anddynamics of leukocyte recruitment during inflammation. Annu. Rev.Biomed. Eng. 7:151–185.
4. Finger, E. B., K. D. Puri, R. Alon, M. B. Lawrence, U. H. von Andrian,and T. A. Springer. 1996. Adhesion through L-selectin requires athreshold hydrodynamic shear. Nature. 379:266–269.
5. Lawrence, M. B., G. S. Kansas, E. J. Kunkel, and K. Ley. 1997.Threshold levels of fluid shear promote leukocyte adhesion throughselectins (CD62L,P,E). J. Cell Biol. 136:717–727.
6. Alon, R., S. Chen, K. D. Puri, E. B. Finger, and T. A. Springer. 1997.The kinetics of L-selectin tethers and the mechanics of selectin-mediated rolling. J. Cell Biol. 138:1169–1180.
7. Puri, K. D., S. Chen, and T. A. Springer. 1998. Modifying the me-chanical property and shear threshold of L-selectin adhesion indepen-dently of equilibrium properties. Nature. 392:930–933.
8. Alon, R., S. Chen, R. Fuhlbrigge, K. D. Puri, and T. A. Springer. 1998.The kinetics and shear threshold of transient and rolling interactions ofL-selectin with its ligand on leukocytes. Proc. Natl. Acad. Sci. USA. 95:11631–11636.
9. Sarangapani, K. K., T. Yago, A. G. Klopocki, M. B. Lawrence, C. B.Fieger, S. D. Rosen, R. P. McEver, and C. Zhu. 2004. Low forcedecelerates L-selectin dissociation from P-selectin glycoprotein ligand-1 and endoglycan. J. Biol. Chem. 279:2291–2298.
10. Yago, T., J. Wu, C. D. Wey, A. G. Klopocki, C. Zhu, and R. P.McEver. 2004. Catch bonds govern adhesion through L-selectin atthreshold shear. J. Cell Biol. 166:913–923.
11. Alon, R., R. C. Fuhlbrigge, E. B. Finger, and T. A. Springer. 1996.Interactions through L-selectin between leukocytes and adherent leuko-cytes nucleate rolling adhesions on selectins and VCAM-1 in shearflow. J. Cell Biol. 135:849–865.
12. Smith, M. J., E. L. Berg, and M. B. Lawrence. 1999. A directcomparison of selectin-mediated transient, adhesive events using hightemporal resolution. Biophys. J. 77:3371–3383.
13. Chang, K. C., and D. A. Hammer. 1999. The forward rate of binding ofsurface-tethered reactants: effect of relative motion between two sur-faces. Biophys. J. 76:1280–1292.
14. Dwir, O., A. Solomon, S. Mangan, G. S. Kansas, U. S. Schwarz, andR. Alon. 2003. Avidity enhancement of L-selectin bonds by flow:shear-promoted rotation of leukocytes turn labile bonds into func-tional tethers. J. Cell Biol. 163:649–659.
796 Caputo et al.
Biophysical Journal 92(3) 787–797

15. Marshall, B. T., M. Long, J. W. Piper, T. Yago, R. P. McEver, and C.Zhu. 2003. Direct observation of catch bonds involving cell-adhesionmolecules. Nature. 423:190–193.
16. Bell, G. I. 1978. Models for the specific adhesion of cells to cells.Science. 200:618–627.
17. Evans, E., A. Leung, V. Heinrich, and C. Zhu. 2004. Mechanicalswitching and coupling between two dissociation pathways in a P-selectin adhesion bond. Proc. Natl. Acad. Sci. USA. 101:11281–11286.
18. Barsegov, V., and D. Thirumalai. 2005. Dynamics of unbinding of celladhesion molecules: transition from catch to slip bonds. Proc. Natl.Acad. Sci. USA. 102:1835–1839.
19. Hammer, D. A., and S. M. Apte. 1992. Simulation of cell rollingand adhesion on surfaces in shear flow: general results and analysis ofselectin-mediated neutrophil adhesion. Biophys. J. 63:35–57.
20. Bhatia, S. K., M. R. King, and D. A. Hammer. 2003. The state diagramfor cell adhesion mediated by two receptors. Biophys. J. 84:2671–2690.
21. Chang, K. C., and D. A. Hammer. 2000. Adhesive dynamics simula-tions of sialyl-Lewis(x)/E-selectin-mediated rolling in a cell-free system.Biophys. J. 79:1891–1902.
22. Chang, K. C., D. F. Tees, and D. A. Hammer. 2000. The state diagramfor cell adhesion under flow: leukocyte rolling and firm adhesion. Proc.Natl. Acad. Sci. USA. 97:11262–11267.
23. King, M. R., and D. A. Hammer. 2001. Multiparticle adhesive dynamics.Interactions between stably rolling cells. Biophys. J. 81:799–813.
24. King, M. R., and D. A. Hammer. 2001. Multiparticle adhesivedynamics: hydrodynamic recruitment of rolling leukocytes. Proc. Natl.Acad. Sci. USA. 98:14919–14924.
25. King, M. R., S. D. Rodgers, and D. A. Hammer. 2001. Hydrodynamiccollisions suppress fluctuations in the rolling velocity of adhesive bloodcells. Langmuir. 17:4139–4143.
26. Caputo, K. E., and D. A. Hammer. 2005. Effect of microvillus defor-mability on leukocyte adhesion explored using adhesive dynamics sim-ulations. Biophys. J. 89:187–200.
27. Krasik, E. F., K. L. Yee, and D. A. Hammer. 2006. Adhesive dynamicssimulation of neutrophil arrest with deterministic activation. Biophys. J.91:1145–1155.
28. Chang, K. C., and D. A. Hammer. 1996. Influence of direction and typeof applied force on the detachment of macromolecularly-bound particlesfrom surfaces. Langmuir. 12:2271–2282.
29. Shao, J. Y., H. P. Ting-Beall, and R. M. Hochmuth. 1998. Static anddynamic lengths of neutrophil microvilli. Proc. Natl. Acad. Sci. USA.95:6797–6802.
30. Dembo, M., D. C. Torney, K. Saxman, and D. Hammer. 1988. Thereaction-limited kinetics of membrane-to-surface adhesion and detach-ment. Proc. R. Soc. Lond. B Biol. Sci. 234:55–83.
31. Jadhav, S., C. D. Eggleton, and K. Konstantopoulos. 2005. A 3-Dcomputational model predicts that cell deformation affects selectin-mediated leukocyte rolling. Biophys. J. 88:96–104.
32. Yago, T., A. Leppanen, H. Qiu, W. D. Marcus, M. U. Nollert, C. Zhu,R. D. Cummings, and R. P. McEver. 2002. Distinct molecular andcellular contributions to stabilizing selectin-mediated rolling underflow. J. Cell Biol. 158:787–799.
33. Greenberg, A. W., D. K. Brunk, and D. A. Hammer. 2000. Cell-freerolling mediated by L-selectin and sialyl Lewis(x) reveals the shearthreshold effect. Biophys. J. 79:2391–2402.
34. Evans, E., A. Leung, D. Hammer, and S. Simon. 2001. Chemicallydistinct transition states govern rapid dissociation of single L-selectinbonds under force. Proc. Natl. Acad. Sci. USA. 98:3784–3789.
35. Marshall, B. T., K. K. Sarangapani, J. Lou, R. P. McEver, and C. Zhu.2005. Force history dependence of receptor-ligand dissociation.Biophys. J. 88:1458–1466.
36. Fritz, J., A. G. Katopodis, F. Kolbinger, and D. Anselmetti. 1998. Force-mediated kinetics of single P-selectin/ligand complexes observed byatomic force microscopy. Proc. Natl. Acad. Sci. USA. 95:12283–12288.
37. Hanley, W., O. McCarty, S. Jadhav, Y. Tseng, D. Wirtz, and K.Konstantopoulos. 2003. Single molecule characterization of P-selectin/ligand binding. J. Biol. Chem. 278:10556–10561.
38. Evans, E., and K. Ritchie. 1997. Dynamic strength of molecular adhe-sion bonds. Biophys. J. 72:1541–1555.
39. Lo, Y. S., Y. J. Zhu, and T. P. Beebe. 2001. Loading-rate dependenceof individual ligand-receptor bond-rupture forces studied by atomicforce microscopy. Langmuir. 17:3741–3748.
Shear Threshold Effect 797
Biophysical Journal 92(3) 787–797