adelaide, south australia
TRANSCRIPT
BR01886 - Permeable and Impermeable Ground Surface Classification Adelaide, South Australia
Project Report & Accuracy Assessment
S.J. Holt, Aerometrex Ltd.

GLOSSARY
Above-ground – in this study, Above-ground is defined as any surface that is above 0.25 m above ground.
AOI – Area of Interest
Error Matrix – “An error matrix is a square array of numbers organized in rows and columns which express the number of sample units (i.e. pixels, clusters of pixels, or polygons) assigned to a particular category relative to the actual category as indicated by the reference data” – Con-galton (2001). In this case, the columns represent the validation dataset and the rows represent the automatic ground classification. All accuracy values (Producer’s User’s and Overall) are calculated from the values within the error matrix.
Error of Commission – correspond to pixels of Class A within the validation dataset that the classifier has incorrectly classified as Class B.
Error of Omission – correspond to pixels of Class A within the validation dataset that the clas-sifier has failed to classify as Class A correctly.
Feature Pyramid Network (FPN) – “A top-down architecture with lateral connections specifi-cally developed for building high-level semantic feature maps at all scales” Lin et al, (2017). FPNs are designed optimise feature extraction from single input image across multiple scales.
Ground – In this study, ‘ground’ refers to any surface that is between 0-0.25 m above ground.
Image Object – An image object refers to a group of pixels that are spectrally, spatially and texturally similar and are generated through image segmentation.
Impermeable – ground surfaces that do not allow water to pass through.
KIA – Kappa Index of Agreement : measure of the performance of the Feature Pyramid Net-work that is free of biases resulting from chance agreement between the validation dataset and the classifier output i.e. takes into account the potential for the classifier being correct purely by chance (Richards, 1999).
KIA (κ) Classifier performanceBelow 0.4 Poor0.41 - 0.60 Moderate0.61 - 0.75 Good0.76 - 0.80 Excellent0.81 and above Almost perfect
(Richards, 1999)
Overall Accuracy – the proportion of pixels correctly classified, independent of class.
Permeable – ground surfaces that do allow water to pass through
Producer’s Accuracy – Measure of the error of omission. Indicates how well the classifier per-formed, i.e. what proportion of the total number of pixels in Class A in the validation dataset are correctly classified by the classifier (Congalton, 2007).
User’s Accuracy – Measure of the error of commission. Indicates the probability that a pixel classified as Class A by the classifier actually belong to Class A (Congalton, 2007).

1. PROJECT SUMMARY & DELIVERABLES
Aerometrex has carried out an automatic, semantic classification of permeable and impermeable surfaces across Adelaide within the survey area of the 2018/19 LIDAR capture (Fig 1). The analysis utilised two key datasets, firstly, high-resolution four band (R:G:B:NIR) aerial imagery captured on the 25th of September 2018 with a spatial resolution of 7.5cm, subsequently down-sampled to 50cm. The aerial imagery is combined with a merged LIDAR dataset, captured in two separate surveys between the 21st to the 24th of April 2019 and the 30th of October to the 3rd of November 2019 (Fig. 1). Both LIDAR captures have a minimum point density of 8 pts.m-2 and are classified to Aerometrex’s Type 2 standard. The project area of interest is, in total, 1305 km2. Project deliverables consist of a thematic raster, with a spatial resolution of 50cm. Classification codes are defined as the following five classes:
1) Impermeable – impermeable ground surfaces such as pavement, concrete and roads.2) Permeable – permeable ground surfaces including bare soil and grass.3) Impermeable Above-ground Object – Above ground features that are deemed to
be impermeable in nature including buildings, tree canopy overhanging roads and other infrastructure between 0.25-3m in height with a relative NDVI below 0.15.
4) Permeable Above Ground Object – Above ground features that are deemed to be permeable in nature including trees and vegetation between 0.25-3m in height with a relative NDVI above 0.15.
5) Water body – Including the ocean, lakes, rivers, dams and large pools.
Figure 1: Left - The location of the study area within South Australia. Right - The total area of interest for this project. Blue areas represent LIDAR data captured in 2018 and Green areas represent LIDAR data captured in
2019. Ground classification is carried out the combined 2018/19 survey area.

Figure 2: Flow chart showing the workflow used to generate the Permeable and Impermeable semantic classifi-cation.
2.2 SUMMARY OF STAGE 2 RULE SET The following rules were used to classify above ground features as either Permeable or Impermeable following consultation with DEW.
1. Buildings were classified as Impermeable; this includes tree canopy overhanging build-ings.
2. Vegetation above 3m in height is classified as Permeable.3. Tree canopy overhanging sealed roads is classified as Impermeable, utilizing Aerome-
trex’s proprietary Fully Convolution Neural Network road classifier.4. Major water bodies are classified as water using water body and mean high tide vector
datasets supplied by the DEW. In order to extract all major water bodies within the AOI,
2. METHODS
2.1 CLASSIFICATION WORKFLOW The semantic classification was carried out in two stages, outlined in Figure 2. Stage One utilised both four band aerial imagery (R:G:B:NIR) and LIDAR-derived raster datasets to classify ground surfaces as either Permeable or Impermeable using an end-to-end trained Feature Pyramid Network (FPN) (Fig. 3A). At this stage all features above ground level are classified simply as ‘above ground feature’. It is at Stage 1 that the accuracy of the classification was assessed (see section 3). Stage 2 of the classification further classified above ground fea-tures as either Permeable or Impermeable (Fig. 3B), using a rule-based classification approach. Stage Two incorporated vector datasets both derived automatically (in-house) by Aerometrex (e.g. road extents and building footprints) and supplied by the Department for Environment and Water (DEW) including major water bodies and mean high tide level. Following Stage Two, manual quality control was used to remove any large, systematic misclassification.

3. ACCURACY ASSESSMENT
3.1 ASSESSMENT SUMMARYThe accuracy assessment results reported here apply to the Stage One two class ground
classification (Permeable and Impermeable ground) derived from Aerometrex’s FPN classifi-cation method. It does not consider the subsequent rule-based classification of above ground objects In Stage Two or quality assurance post-processing.
The performance and accuracy of the FPN classifier was assessed using a manually la-beled validation dataset which consisted of 10 separate tiles, each with an area of 1 km2 (Fig. 4). Ground and above ground objects within each validation tile were manually classified using an Object Based Image Analysis workflow, using our high-resolution imagery as a reference (spa-tial resolution of 7.5cm). In total, over 27 million pixels were manually labeled, corresponding to an approximate area of 7km2. A direct comparison between the classification of each pixel in the validation dataset and classified dataset was used to assess the performance of the FPN classifier. It is important to note that the data used for validation was not part of the data used to train the FPN classifier.
Figure 3: Left - A single 1km by 1km tile showing the results of Stage One classification. White areas represent above ground features that are as yet unclassified. Right - The same tile fully classified following Stage Two Clas-
sification.
additional water bodies missing from the DEW dataset were classified using water bod-ies automatically extracted from the LIDAR point cloud.
5. Above ground features between 0.25m and 3m above ground were classified as ei-ther Impermeable or Permeable using an object based relative NDVI threshold of 0.15 (above is permeable, below impermeable).
Note: the rule-based classification steps within Stage Two of the workflow are not included within the accuracy assessment in Section 3, which refers only to the FPN-based ground clas-sification. As such, the accuracies reported in Section 3 are not representative of the overall classification, just the ground classes (1 & 2).

3.2 ACCURACY ASSESSMENT RESULTS
Table 1 shows the Error Matrix that summarises the performance and accuracy of the FPN classifier across the AOI using the manually labeled validation dataset as reference. Defi-nitions for each term can be found in the glossary. The FPN-derived ground classification has an overall accuracy of 89.45% and an overall Kappa Index of Agreement of 0.78 (Excellent).
Figure 4: Left - The distribution of the ten validation tiles across the pilot project AOI. Right - Three exam-ples of representative tiles that were used as validation.

Table 1: Permeable vs. Impermeable ground classification pixel-level error matrix.
4. RESULTS Figure 5 shows a statistical breakdown of the proportion of each class within the overall study area as well as within the LIDAR survey extent. Figures 6-9 show example images of the full semantic classification of areas across Adelaide. Each image shows the combined clas-sification of Stage 1 and Stage 2.
Figure 5: Statistical breakdown of the areas and proportion of each class within the Stage 2 classification. Top: Class distribution for the combined LIDAR survey area (both 2018 and 2019 captures). Bottom: Class distri-bution for just the 2018 capture area of interest corresponding to the densest urban areas within the project AOI.

Figure 6: Permeable vs Impermeable surface classification at Mawson Lakes, Adelaide. Red: Impermeable ground, Dark Green: Permeable ground, Yellow: Above ground impermeable, Light Green: Above ground Perme-
able, Blue: Water
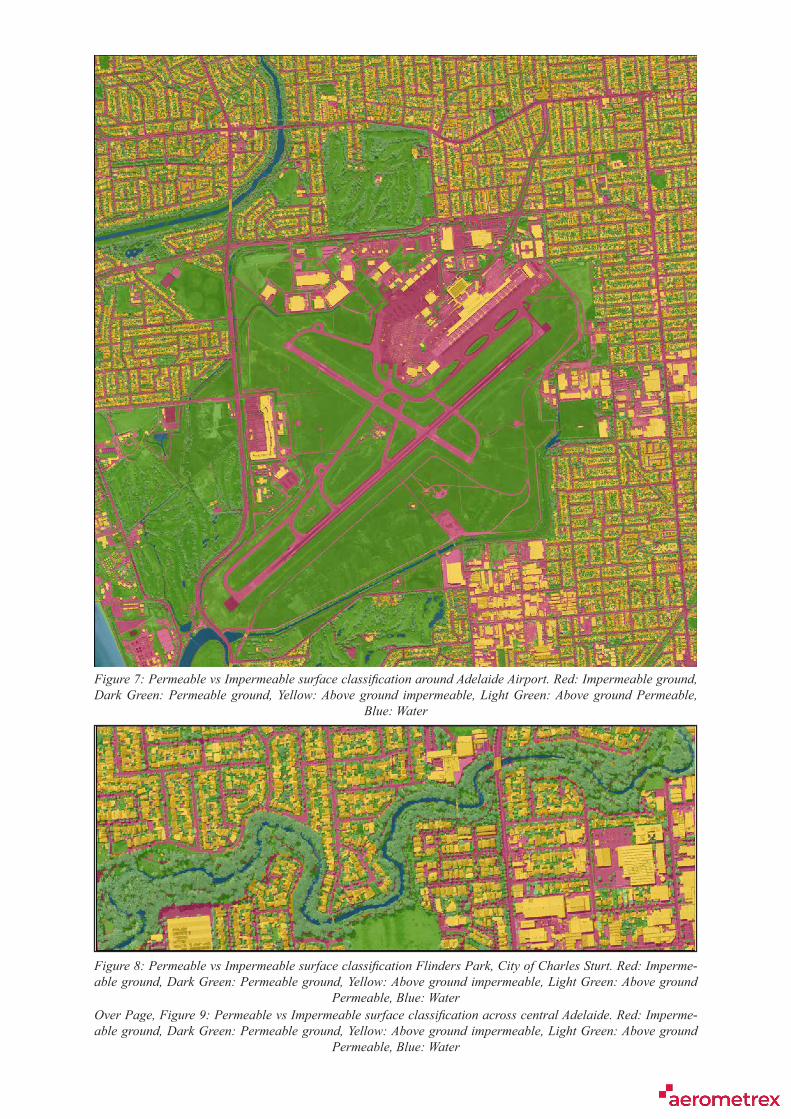
Over Page, Figure 9: Permeable vs Impermeable surface classification across central Adelaide. Red: Imperme-able ground, Dark Green: Permeable ground, Yellow: Above ground impermeable, Light Green: Above ground
Permeable, Blue: Water
Figure 7: Permeable vs Impermeable surface classification around Adelaide Airport. Red: Impermeable ground, Dark Green: Permeable ground, Yellow: Above ground impermeable, Light Green: Above ground Permeable,
Blue: Water
Figure 8: Permeable vs Impermeable surface classification Flinders Park, City of Charles Sturt. Red: Imperme-able ground, Dark Green: Permeable ground, Yellow: Above ground impermeable, Light Green: Above ground
Permeable, Blue: Water


5. LIMITATIONS
5.1 TEMPORAL RESOLUTION The dataset used in this study is a merged dataset of LIDAR surveys flown in 2018 and 2019 (Fig. 1). As a result of this, the FPN classifier needed to be optmised in order to produce accurate results across data sourced from both surveys with differing properties (i.e. LIDAR in-tensity variations). Figure 10 shows three examples of small systematic errors that are present within the final product that are the result of processing merged datasets. 1) Small Impermeable ‘noise’ pixels around trees, 2) some edge effects present across tile boundaries and 3) a drop in the accuracy of the ground classification along the boundary between the two captures (see Figure 1 for reference), which results in an over classification of permeable surfaces. These limitations are small and are unlikely to affect any subsequent analysis of the dataset. Further-more, the time period between the capture of four-band imagery and LIDAR means that there are some discrepancies between the two datasets. For example, at the property scale, there are some cases where houses that appear in the imagery are classified as ground surfaces as they were demolished between captures. Errors such as these are not common and should not affect large-scale analyses.
5.2 SPATIAL RESOLUTION The spatial resolution of all datasets used within this study is 50cm, as such, there is a fundamental limitation on the size of features that can be extracted, as they need to be spectral-ly and geometrically separable at this scale. This dataset is best suited for use at the block to suburb level. Care should be taken when using these results for single property assessments as features that are at the metre-scale may be less distinguishable given the spatial resolution of the dataset. However, larger scale features such as drive ways and paved outdoor areas can often be effectively identified at the property scale, especially in areas with sparse tree canopy coverage (e.g. Fig. 6).
Figure 10: Examples of limitations within the Permeable vs Impermeable classification due to the source dataset consisting of two separate merged captures.
5.3 SPECTRAL RESOLUTION & FEATURE OCCLUSION The FPN classifier fundamentally relies on the spectral separability (across all six raster stack bands) of ground cover types in order to accurately classify them as permeable or imper-meable. Some specific cover types, such as engineered permeable paving, may be spectrally very similar to impermeable concrete paving resulting in misclassification. Without field-de-rived ground truths and validation samples for each specific type of ground cover, we are un-able to calibrate the classifier for optimal performance for specific cover types. As well as this, because we are using near-nadir imagery, some above-ground features may obscure the ground surface below. For example, tree canopy may obscure an impermeable footpath or the awning of a building may obscure adjacent permeable grass.

REFERENCESCongalton, R.G., 2001, Accuracy assessment and validation of remotely sensed and other
spatial information: International Journal of Wildland Fire, v. 10, p. 321–328.
Congalton, R.G., 2007, Thematic and positional accuracy assessment of digital remotely sensed data, in In: McRoberts, Ronald E.; Reams, Gregory A.; Van Deusen, Paul C.; McWilliams, William H., eds. Proceedings of the seventh annual forest inventory and analysis symposium; October 3-6, 2005; Portland, ME. Gen. Tech. Rep. WO-77. Wash-ington, DC: US Department, v. 77.
Lin, T.-Y., Dollár, P., Girshick, R., He, K., Hariharan, B., and Belongie, S., 2017, Feature pyr-amid networks for object detection, in Proceedings of the IEEE conference on computer vision and pattern recognition, p. 2117–2125.
Richards, J.A., 1999, Image Classification in Practice, in Remote sensing digital image analy-sis, Springer, p. 381–433.