adding complexity to an already difficult task monitoring the impact of the affordable care act...
TRANSCRIPT

Brett Fried Minnesota Health Services Research Conference March 1, 2016
ADDING COMPLEXITY TO AN ALREADY DIFFICULT TASK: MONITORING THE
IMPACT OF THE AFFORDABLE CARE ACT (ACA) ON THE MISREPORTING OF
MEDICAID COVERAGE
3/2/2016

Acknowledgments
3/2/2016 2
Funding for this work is supported by the Robert Wood Johnson Foundation. Other Contributors: Michel Boudreaux (University of Maryland), Kathleen Call, Elizabeth Lukanen & Giovann Alarcon (SHADAC)

Background
3/2/2016 3
Administrative data on public assistance programs are not sufficient for policy making • Often not timely • No population denominator • Incomplete, lower quality or no covariates Population surveys fill these gaps • Yet they universally undercount Medicaid enrollment
(Call et al 2008, 2012, Boudreaux 2015)

Research focus
Compare Medicaid counts pre and post ACA • Use accessible timely data that is used by state
analysts, policymakers and the public • Check for levels of differences across states • Check for patterns of differences in states
3/2/2016 4

Research Question
Has there been an increase in differences between survey data and administrative data of Medicaid enrollment data in some states?
3/2/2016 5

Survey Data Source: American Community Survey (ACS) • Large, continuous, multi-mode survey (mail, telephone, in-
person and internet) of the US population residing in housing units and group quarters
• Added health insurance question in 2008 • One simple multi-part question on health insurance type • Unique data source due to its size • Subgroup analysis (small demographic groups and low
levels of geography) • Chose this source because so commonly used for state-
level analysis • Previous research shows false negative error rate
compares favorably with the NHIS and CPS (Boudreaux 2015)
3/2/2016 6

ACS Health Insurance Question
3/2/2016 7
“Is this person CURRENTLY covered by any of the following types of health insurance or health coverage plans?
d. Medicaid, Medical Assistance, or any kind of government-assistance plan for those with low incomes or a disability?”

Data used from ACS
From prepopulated publicly available tables from the Census. Universe: Civilian Non-Institutional Population
3/2/2016 8

Administrative Data Source: Centers for Medicare and Medicaid Services Enrollment Definition • A point-in-time count (like ACS) • Medicaid and CHIP (like ACS) • Only those eligible for comprehensive benefits (like
ACS) • Includes those with retroactive eligibility (not like ACS) • Universe: All individuals in the population (not like
ACS)
3/2/2016 9

Compare ACS and CMS Medicaid enrollment estimates Change between 2013 and 2014
• National • Top and Bottom Ten States • Expansion and Non-Expansion
3/2/2016 10

Table 1. ACS & CMS Medicaid Enrollment Increase in the TOP Ten States from 2013 to 2014
Top ten states with the largest increases in enrollment according to CMS
3/2/2016 11
Source: CMS, Medicaid & CHIP Monthly Applications, Eligibility Determinations, and Enrollment Reports: July 2014 and July- September 2013 available from Kaiser at http://kff.org/health-reform/state-indicator/total-monthly-medicaid-and-chip-enrollment. ACS, American Factfinder, Table S2701, 1 year estimates Note: Excludes both Connecticut and Maine enrollment from totals because no data was available from CMS for the 2013 time period.
ACS CMS
2014 2013 % diff Rank ACS 2014 2013 % diff
Rank CMS
U.S. 59,390,221 54,761,806 8% NA 66,102,081 57,794,096 14% NA Minnesota 894,631 779,201 15% 11 1,068,305 873,040 22% 12 Top Ten 7,589,644 6,192,146 23% NA 8,642,487 5,882,920 47% NA 1. Kentucky 1,030,312 790,497 30% 3 1,048,285 606,805 73% 1 2. Oregon 897,812 662,038 36% 1 997,762 626,356 59% 2 3. Nevada 460,893 350,778 31% 2 527,929 332,560 59% 3 4. New Mexico 569,340 504,346 13% 13 705,128 457,678 54% 4 5. West Virginia 455,637 357,427 27% 4 519,672 354,544 47% 5 6. Colorado 923,438 749,060 23% 5 1,106,134 783,420 41% 6 7. Arkansas 698,344 626,626 11% 15 784,335 556,851 41% 7 8. Washington 1,301,760 1,075,157 21% 7 1,542,789 1,117,576 38% 8 9. Rhode Island 225,341 183,978 22% 6 259,183 190,833 36% 9 10. Maryland 1,026,767 892,239 15% 10 1,151,270 856,297 34% 10
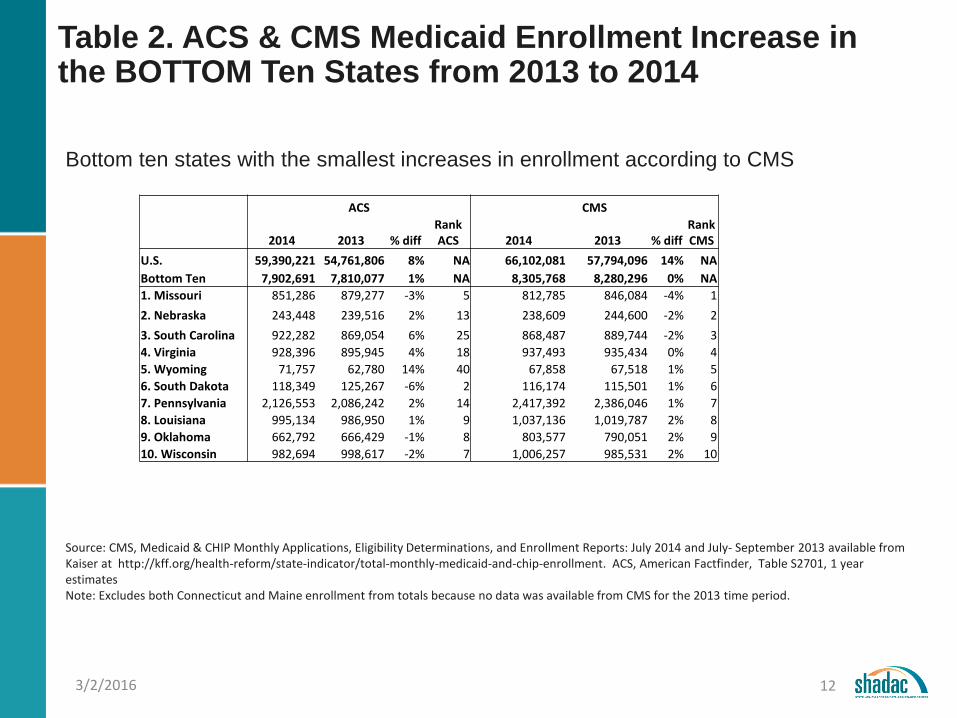
Table 2. ACS & CMS Medicaid Enrollment Increase in the BOTTOM Ten States from 2013 to 2014
Bottom ten states with the smallest increases in enrollment according to CMS
3/2/2016 12
Source: CMS, Medicaid & CHIP Monthly Applications, Eligibility Determinations, and Enrollment Reports: July 2014 and July- September 2013 available from Kaiser at http://kff.org/health-reform/state-indicator/total-monthly-medicaid-and-chip-enrollment. ACS, American Factfinder, Table S2701, 1 year estimates Note: Excludes both Connecticut and Maine enrollment from totals because no data was available from CMS for the 2013 time period.
ACS CMS
2014 2013 % diff Rank ACS 2014 2013 % diff
Rank CMS
U.S. 59,390,221 54,761,806 8% NA 66,102,081 57,794,096 14% NA Bottom Ten 7,902,691 7,810,077 1% NA 8,305,768 8,280,296 0% NA 1. Missouri 851,286 879,277 -3% 5 812,785 846,084 -4% 1 2. Nebraska 243,448 239,516 2% 13 238,609 244,600 -2% 2 3. South Carolina 922,282 869,054 6% 25 868,487 889,744 -2% 3 4. Virginia 928,396 895,945 4% 18 937,493 935,434 0% 4 5. Wyoming 71,757 62,780 14% 40 67,858 67,518 1% 5 6. South Dakota 118,349 125,267 -6% 2 116,174 115,501 1% 6 7. Pennsylvania 2,126,553 2,086,242 2% 14 2,417,392 2,386,046 1% 7 8. Louisiana 995,134 986,950 1% 9 1,037,136 1,019,787 2% 8 9. Oklahoma 662,792 666,429 -1% 8 803,577 790,051 2% 9 10. Wisconsin 982,694 998,617 -2% 7 1,006,257 985,531 2% 10

Table 3. ACS & CMS Medicaid Enrollment Differences in the TOP Ten States in 2013 & 2014
Top ten states with the largest increases in enrollment according to CMS
3/2/2016 13
Source: CMS, Medicaid & CHIP Monthly Applications, Eligibility Determinations, and Enrollment Reports: July 2014 and July- September 2013 available from Kaiser at http://kff.org/health-reform/state-indicator/total-monthly-medicaid-and-chip-enrollment. ACS, American Factfinder, Table S2701, 1 year estimates Note: Excludes both Connecticut and Maine enrollment from totals because no data was available from CMS for the 2013 time period for these two states.
2014 2013
ACS CMS diff % diff ACS CMS diff % diff
U.S. 59,390,221 66,102,081 -6,711,860 -10% 54,761,806 57,794,096 -3,032,290 -5% Minnesota 894,631 1,068,305 -173,674 -16% 779,201 873,040 -93,839 -11% Top Ten 7,589,644 8,642,487 -1,052,843 -12% 6,192,146 5,882,920 309,226 5% 1. Kentucky 1,030,312 1,048,285 -17,973 -2% 790,497 606,805 183,692 30% 2. Oregon 897,812 997,762 -99,950 -10% 662,038 626,356 35,682 6% 3. Nevada 460,893 527,929 -67,036 -13% 350,778 332,560 18,218 5% 4. New Mexico 569,340 705,128 -135,788 -19% 504,346 457,678 46,668 10% 5. West Virginia 455,637 519,672 -64,035 -12% 357,427 354,544 2,883 1% 6. Colorado 923,438 1,106,134 -182,696 -17% 749,060 783,420 -34,360 -4% 7. Arkansas 698,344 784,335 -85,991 -11% 626,626 556,851 69,775 13% 8. Washington 1,301,760 1,542,789 -241,029 -16% 1,075,157 1,117,576 -42,419 -4% 9. Rhode Island 225,341 259,183 -33,842 -13% 183,978 190,833 -6,855 -4% 10. Maryland 1,026,767 1,151,270 -124,503 -11% 892,239 856,297 35,942 4%

Table 4. CMS & ACS Medicaid Enrollment Differences in the BOTTOM Ten States in 2013 & 2014 Bottom ten states with the smallest increases in enrollment according to CMS
3/2/2016 14
Source: CMS, Medicaid & CHIP Monthly Applications, Eligibility Determinations, and Enrollment Reports: July 2014 and July- September 2013 available from Kaiser at http://kff.org/health-reform/state-indicator/total-monthly-medicaid-and-chip-enrollment. ACS, American Factfinder, Table S2701, 1 year estimates Note: Excludes both Connecticut and Maine enrollment from totals because no data was available from CMS for the 2013 time period.
2014 2013 ACS CMS diff % diff ACS CMS diff % diff
U.S. 59,390,221 66,102,081 -6,711,860 -10% 54,761,806 57,794,096 -3,032,290 -5% Bottom Ten 7,902,691 8,305,768 -403,077 -5% 7,810,077 8,280,296 -470,219 -6% 1. Missouri 851,286 812,785 38,501 5% 879,277 846,084 33,193 4% 2. Nebraska 243,448 238,609 4,839 2% 239,516 244,600 -5,084 -2% 3. South Carolina 922,282 868,487 53,795 6% 869,054 889,744 -20,690 -2% 4. Virginia 928,396 937,493 -9,097 -1% 895,945 935,434 -39,489 -4% 5. Wyoming 71,757 67,858 3,899 6% 62,780 67,518 -4,738 -7% 6. South Dakota 118,349 116,174 2,175 2% 125,267 115,501 9,766 8% 7. Pennsylvania 2,126,553 2,417,392 -290,839 -12% 2,086,242 2,386,046 -299,804 -13% 8. Louisiana 995,134 1,037,136 -42,002 -4% 986,950 1,019,787 -32,837 -3% 9. Oklahoma 662,792 803,577 -140,785 -18% 666,429 790,051 -123,622 -16% 10. Wisconsin 982,694 1,006,257 -23,563 -2% 998,617 985,531 13,086 1%

Table 5. CMS & ACS Medicaid Enrollment in Expansion & Non-Expansion states in 2013 & 2014
States only included as expansion states if the Medicaid expansion occurred before 2015
3/2/2016 15
Source: CMS, Medicaid & CHIP Monthly Applications, Eligibility Determinations, and Enrollment Reports: July 2014 and July- September 2013 available from Kaiser at http://kff.org/health-reform/state-indicator/total-monthly-medicaid-and-chip-enrollment. ACS, American Factfinder, Table S2701, 1 year estimates Note: Excludes both Connecticut and Maine enrollment from totals because no data was available from CMS for the 2013 time period.
2014 2013
ACS CMS diff %diff ACS CMS diff % diff U.S. 59,390,221 66,102,081 -6,711,860 -10% 54,761,806 57,794,096 -3,032,290 -5% Expansion 34,566,180 40,999,907 -6,433,727 -16% 30,613,383 33,852,915 -3,239,532 -10% Non-Expansion 24,824,041 25,102,174 -278,133 -1% 24,148,423 23,941,181 207,242 1%
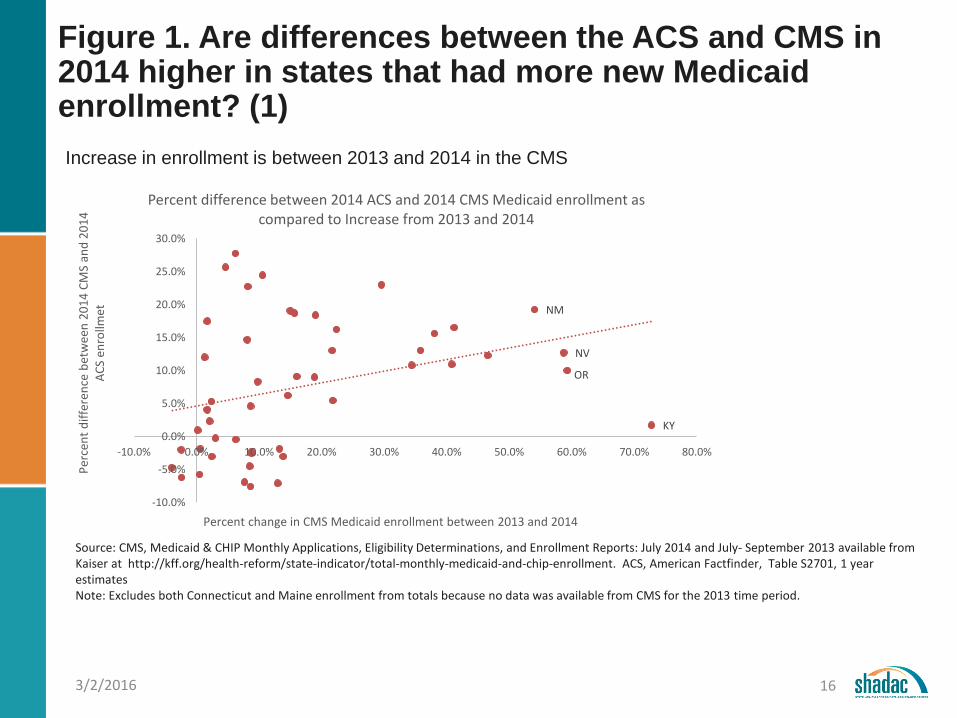
Figure 1. Are differences between the ACS and CMS in 2014 higher in states that had more new Medicaid enrollment? (1) Increase in enrollment is between 2013 and 2014 in the CMS
3/2/2016 16
Source: CMS, Medicaid & CHIP Monthly Applications, Eligibility Determinations, and Enrollment Reports: July 2014 and July- September 2013 available from Kaiser at http://kff.org/health-reform/state-indicator/total-monthly-medicaid-and-chip-enrollment. ACS, American Factfinder, Table S2701, 1 year estimates Note: Excludes both Connecticut and Maine enrollment from totals because no data was available from CMS for the 2013 time period.
KY
NV
NM
OR
-10.0%
-5.0%
0.0%
5.0%
10.0%
15.0%
20.0%
25.0%
30.0%
-10.0% 0.0% 10.0% 20.0% 30.0% 40.0% 50.0% 60.0% 70.0% 80.0%
Perc
ent d
iffer
ence
bet
wee
n 20
14 C
MS
and
2014
AC
S en
rollm
et
Percent change in CMS Medicaid enrollment between 2013 and 2014
Percent difference between 2014 ACS and 2014 CMS Medicaid enrollment as compared to Increase from 2013 and 2014

FIGURE2. Are differences between the Adjusted ACS and CMS in 2014 higher in states that had more new Medicaid enrollment? (2) Adjustment made to 2014 ACS to account for difference between 2013 CMS and 2013 ACS Medicaid enrollment
3/2/2016 17
Source: CMS, Medicaid & CHIP Monthly Applications, Eligibility Determinations, and Enrollment Reports: July 2014 and July- September 2013 available from Kaiser at http://kff.org/health-reform/state-indicator/total-monthly-medicaid-and-chip-enrollment. ACS, American Factfinder, Table S2701, 1 year estimates Note: Excludes both Connecticut and Maine enrollment from totals because no data was available from CMS for the 2013 time period. Adjustment is the difference between the CMS and ACS 2013 enrollment by state subtracted this from 2014 ACS enrollment.
NM
NV OR
KY
-20.0%
-10.0%
0.0%
10.0%
20.0%
30.0%
40.0%
50.0%
-10.0% 0.0% 10.0% 20.0% 30.0% 40.0% 50.0% 60.0% 70.0% 80.0%Perc
ent d
iffer
ence
bet
wee
n 20
14 C
MS
and
adju
sted
201
4 AC
S en
rollm
et
Percent change in CMS Medicaid enrollment between 2013 and 2014
Percent difference between 2014 Adjusted ACS and 2014 CMS Medicaid enrollment as compared to increase between 2013 and 2014

SUMMARY
In general, states with the largest percent increases in enrollment also have the largest differences between ACS and CMS This could be because • New Medicaid enrollees are less likely to know they are
enrolled than people who have been enrolled for a longer period
• New Medicaid enrollees have different characteristics that are more associated with reporting error
• Retroactive enrollment could be higher in 2014
3/2/2016 18

Policy implications
• Potentially overstating uninsurance rates particularly in states with large changes in enrollment but by how much? • Past research has shown that most misreports
are other types of coverage, not uninsurance • “No wrong door” could mean these errors are
also mostly between coverage types • Research comparing coverage in states may
be biased because of potential for larger error associated with states with larger increases in enrollment
3/2/2016 19

Future research
• Run the same analysis for the NHIS and CPS • Add more years of data going back at least
five years • Include institutional and active military
population in the ACS using the PUMS file. • Check differences in characteristics between
new and “old” enrollees using the PUMS file • Link the administrative and survey data when
linkable data becomes available
3/2/2016 20