the political economy of medicaid expansion › system › files › sutter... · the political...
TRANSCRIPT

The Political Economy of Medicaid Expansion
Federalism, Interest Groups, and the ACA
Daniel Sutter
June 2016
MERCATUS WORKING PAPER

Daniel Sutter. “The Political Economy of Medicaid Expansion: Federalism, Interest Groups, and the ACA.” Mercatus Working Paper, Mercatus Center at George Mason University, Arlington, VA, June 2016. Abstract Medicaid was established in 1965 as a joint state and federal program to provide medical insurance to Americans who are poor and have disabilities, and it has grown from 1 percent to 3 percent of GDP. The source of Medicaid’s growth over the past 50 years must inform efforts to reform the program and slow spending. The literature on the political economy of Medicaid provides strong evidence of interest group and political ideological influence, enabled by the open-ended federal match for state spending. The strongest support for political influence, interest group influence, and matching grants as drivers of growth emerges from studies on Medicaid’s discretionary coverages and populations in contrast to the program’s mandatory components. Evidence also exists that increases in populations that are already eligible may lead to offsetting reductions in reimbursement rates, thus suggesting that increased medical need (the cost of adequate care for the poor) has not been a primary driver of growth. JEL codes: D72, D78, I13, H51 Keywords: Medicaid, policy analysis, Medicaid expansion, entitlements, public health Insurance, interest groups, legislators, positive political economy, block grants, matching grants, flypaper effect, Patient Protection and Affordable Care Act Author Affiliation and Contact Information Daniel Sutter Affiliated Senior Scholar Mercatus Center at George Mason University Charles G. Koch Professor of Economics Manuel H. Johnson Center for Political Economy, Troy University [email protected] All studies in the Mercatus Working Paper series have followed a rigorous process of academic evaluation, including (except where otherwise noted) at least one double-blind peer review. Working Papers present an author’s provisional findings, which, upon further consideration and revision, are likely to be republished in an academic journal. The opinions expressed in Mercatus Working Papers are the authors’ and do not represent official positions of the Mercatus Center or George Mason University.

3
The Political Economy of Medicaid Expansion:
Federalism, Interest Groups, and the ACA
Daniel Sutter
1. Introduction
The Social Security Act of 1965 created Medicaid to provide health insurance to poor
Americans, including children. The act also created Medicare, the health insurance program for
people age 65 and older, and Medicaid was at least initially viewed as Medicare’s junior partner.
In contrast to Medicare, which is exclusively a federal government program, Medicaid is a joint
state and federal program, modeled on Aid to Families with Dependent Children (AFDC), a cash
assistance program for the poor. Each state operates a Medicaid program under rules laid down
by the federal government, and states receive federal grants to cover much of the program’s cost.
From modest beginnings, Medicaid has grown enormously—from $5.3 billion in 1970 to
$449 billion in 2013 (both figures in current dollars; 1970 spending was $32 billion in 2013
dollars), as illustrated in table 1 (page 37). The federal government has provided between 55
percent and 60 percent of Medicaid funding for more than 30 years, except for a temporary jump
of 10 percentage points in the federal share caused by the American Recovery and Reinvestment
Act (ARRA, reflected by the 2010 figures in table 1). Medicaid has grown to more than 75
percent of the expenditures of Medicare, and its share of national health expenditures has more
than doubled since 1970. More than 72 million Americans were enrolled in Medicaid and
Children’s Health Insurance Program (CHIP) as of January 2016, making Medicaid the largest
health insurance provider in the nation (CMS 2016). Medicaid was the largest category of state
budgets in 2011 (Owcharenko 2014), thanks to a surge in spending caused by the 2008 recession.
Nonetheless, Medicaid has become an enormous driver of state government budgets since the
4
late 1980s and has been credited with significantly reducing state spending on higher education
(Kane, Orszag, and Apostolov 2005). Medicaid is in the midst of a period of further growth as a
consequence of the Patient Protection and Affordable Care Act (ACA), and spending is projected
to continue growing at 5.9 percent a year between 2015 and 2024 (CMS n.d.).
What forces have driven the expansion of Medicaid over its 50 years of existence? This
paper reviews findings from the positive political economy literature on this subject. Positive
political economy refers to an integration of economic and political variables through a public
choice or interest group viewpoint. The review provides an evidentiary foundation for evaluating
the need for or potential of various proposed reforms to slow the trajectory of Medicaid
spending. Specific options for reform are not detailed or evaluated here. But because the review
seeks to inform a case for reform, it will be shaped by the following questions:
• Do explicit policy decisions or factors outside of the control of politicians drive the
growth of Medicaid?
• Is the matching grant structure of Medicaid an important driver of growth?
• Is there evidence of inefficient spending?
Section 2 of this paper categorizes factors perceived to have contributed to the growth
of Medicaid. Four categories are identified: (a) the medical need, or the size of the eligible
population and cost of acceptable medical care; (b) the price effect of Medicaid’s matching
grant formula and the incentive of state policymakers to attempt to take advantage of the
federal structure of the program; (c) the effects of the grant structure that are not tied to
rational choice (e.g., the flypaper effect); and (d) the interest group and public choice
considerations. This paper focuses on efforts to use variation in state programs to identify the
political economy of Medicaid, and thus section 3 discusses the advantages and challenges of
5
that approach. Section 4 reviews evidence from published studies of the political economy
literature, with a focus on the discretionary aspects of state programs. Section 5 examines
correlates of state expansions of Medicaid under the ACA as a means of testing the ability of
the political economy findings to help explain ongoing changes in the program. Section 6
provides an evaluative discussion of the evidence, and section 7 concludes by returning to the
three motivating questions that shaped the review.
2. Factors Driving Medicaid Spending Growth
This section reviews arguments made in the economics and public choice literature that have
been or could be applied to explain the growth of Medicaid over its 50 years of existence. Four
sets of arguments are considered: medical need, incentive effects of federal grants, behavioral
effects of grants, and public choice or interest groups.
Medical Need
Medicaid was initially proposed as a program of assistance for Americans who are poor,
especially children. Medicaid is an entitlement program, meaning that all persons who meet the
statutory criteria can receive all of the covered medical services without explicit legislative
appropriation of funds. Medical need constitutes the group of factors related to the number of
Americans meriting assistance (people who are poor, children in poverty, and people unable to
afford adequate care) and to the cost of providing acceptable medical care.1 An important
1 Persons eligible for Medicaid are not required to sign up (except as modified by the ACA “mandate”). The percentage of eligible persons enrolled today ranges from 74 percent in Nevada to almost 97 percent in Massachusetts and 98 percent in the District of Columbia. A 90 percent penetration or take-up rate will typically never be achieved in the first year of a program or following an expansion to a new set of eligible persons. Because adjustment to changes in the program rules will not be instantaneous, growth attributable to a change in the rules will occur for some period after the change. Enrollment figures are from the Centers for Medicare and Medicaid (CMS 2015).

6
consideration in assessing growth is the potential for growth to occur because of changes in
medical need without any change in the underlying scope or structure of the program. Growth
attributed to medical need would not necessarily require a subsequent expansion of Medicaid by
lawmakers.
The proportion of Americans in medical need can vary over time and depends on
economic and demographic factors. In the short term, macroeconomic fluctuations can cause
joblessness and increases in eligibility for Medicaid (and other means-tested government
assistance). A rising standard of living suggests that economic factors should be less relevant
over the longer run. For example, the overall poverty rate and the poverty rate for persons under
age 18 stood at 17.3 percent and 21.0 percent, respectively, in 1965, versus 14.8 percent and 21.1
percent in 2014.2 Increases in the poverty rate are unlikely to have driven Medicaid growth in
recent decades. Other trends could be contributing to growth. An aging population increases the
number of medically needy elderly—the Medicare–Medicaid dual enrollees. Societal changes
such as the decline of marriage and an increase in the proportion of children born outside of
marriage could increase the likelihood of children living in poverty.
The other component of medical need is the cost of providing adequate medical care.
Health care as a share of GDP has increased from 5.0 percent in 1960 to 17.4 percent in 2013.3
This growth is driven by a number of factors. One factor could be a relative price increase for
labor-intensive services, or what has been labeled as “cost disease” (Baumol 2012). Many
medical services and procedures use a relatively fixed amount of labor. They will tend to become
2 See US Census Bureau, Historical Poverty Tables (tables 2 and 3, respectively), https://www.census.gov/hhes /www/poverty/data/historical/people.html. 3 National Health Expenditures: Table 1, Aggregate and Per Capital Amounts, https://www.cms.gov/Research -Statistics-Data-and-Systems/Statistics-Trends-and-Reports/NationalHealthExpendData/NationalHealthAccounts Historical.html.
7
more expensive compared with goods or services that use labor-saving technology more readily.
Health and safety are usually considered luxury goods, for which purchases increase more than
proportionally with income and for which demand is less responsive to changes in price. Finally,
with increasing medical knowledge and technology, medicine has witnessed tremendous
progress in treating illnesses, diseases, and ailments. The consumer price index (CPI) for medical
care, which attempts to measure the price change component of medical spending, stands at
446.8 in May 2015 versus 237.0 for the overall CPI. Thus, the price index for medical care has
risen almost twice as fast as prices overall since 1982–1984 (the CPI base years). All those
factors will affect the cost of medical care for a given definition of the eligible population.4
Government health care policies, particularly Medicare and Medicaid, could be
contributing to the rising cost of medical care in the United States. Both programs increase the
demand for health care, which will increase the equilibrium price. Most medical services in the
United States are provided through what is called third-party payment.5 This system of third-
party payment generally makes demand less sensitive to price. A third-party payer is a party
other than the consumer and supplier (the first two parties in a market). Both private insurance
and government payment qualify as forms of third-party payment. Even if a patient pays
premiums for health insurance, the bulk of the cost of most medical services is covered by the
insurance, and premiums are independent of the amount paid. Consequently, a patient has a
reduced incentive to choose lower-priced health services, such as generic alternatives for
prescriptions, than if paying the full price out of pocket.
4 Coverage for procedures that did not exist in the 1960s would need to be added. Hence, by the letter of the law, this coverage might be an expansion of Medicaid. But growth to keep up with a changing standard of acceptable care could be considered within the spirit of the initial legislation. 5 Out-of-pocket expenditures amounted to 12 percent of health consumption expenditures in 2013; see table 3, National Health Expenditures; Levels and Annual Percent Change, by Source of Funds: Selected Calendar Years 1960–2014, https://www.cms.gov/Research-Statistics-Data-and-Systems/Statistics-Trends-and-Reports/National HealthExpendData/NationalHealthAccountsHistorical.html.

8
But the government, as third-party payer, may be less diligent in reviewing covered
services than a private insurer would be. Private health insurance is ultimately subject to
market constraints, meaning that insurers must be able to pay for covered services. Premiums
and coverage levels must be attractive to consumers or to businesses providing health
insurance as an employer-provided benefit. By contrast, Medicaid and Medicare as government
programs have access to the federal treasury, and politicians might prefer to appropriate more
dollars to the programs than to limit coverage for recipients. Consequently, the increase in
demand for health services under Medicare and Medicaid is likely to be more inelastic with
respect to price, even relative to a similar increase in demand through private insurance. If
these charges are valid, medical cost inflation would not be an exogenous factor but would be
endogenous to Medicaid.
Nevertheless, several elements of Medicaid likely limit its contribution to medical care
inflation. For example, Medicaid’s reimbursement rates for physician and hospital services are
recognized to be significantly below rates paid by Medicare and private insurance (Owcharenko
2014). Many doctors are unwilling to accept Medicaid patients, which is hardly consistent with
price-insensitive demand driving up health care costs. Furthermore, the Omnibus Budget
Reconciliation Act of 1981 authorized states to use managed care for the delivery of Medicaid
services. In 2012, more than 64 million Medicaid patients were enrolled in managed care
programs (CMS 2012). Medicaid spending is spread across the entire spectrum of health
services, from physician and hospital services to prescription drugs and dental care.6 With the
exception of nursing home care (Camobreco 1996), the contribution of Medicaid to increased
demand for services of any one type is relatively modest.
6 Dental care is not federally supported by Medicaid, but some states offer it.

9
Incentive Effects of Matching Grants
The federal structure of Medicaid and the form of the grants through which Washington provides
dollars to the states provide potential sources of growth for Medicaid. The federal government
historically provides close to 60 percent of the funding (table 1), and federal funds flow to the
states in the form of matching grants. In a matching grant, the receiving government entity must
contribute a given amount of funding (a match) for each dollar received. The main alternative to
matching grants are block grants, where the amount of the grant is independent of the exact
actions of taken by the recipient. Medicaid uses Federal Medical Assistance Percentages
(FMAPs) to determine the match for each state. FMAPs are based on state income. Table 2
(page 38) reports state FMAPs for fiscal year 2016, and they range from 50.00 percent to 74.17
percent. With an FMAP of 50 percent, each dollar of federal spending would be matched with a
dollar from state funds. As discussed subsequently, newly eligible individuals attract a 100
percent FMAP, which declines to 90 percent in 2020. FMAPs are adjusted annually, and higher
percentages apply to children’s health programs (state CHIPs), which table 2 also reports under
the heading eFMAP (enhanced Federal Medical Assistance Percentage).
Matching grants lower the price of Medicaid program activities for the states. Given
the range of FMAPs, states receive between $1 and $3 for each dollar they spend on
Medicaid. The law of demand suggests that spending will increase under matching grants
relative to the level chosen by a state facing the full cost of additional spending. Medicaid will
also be larger under matching grants than if the same federal funding flowed to states through
block grants. The matching grant effect applies for both spending increases and waste-cutting
efforts, because a state would realize only $0.25 to $0.50 in savings for each dollar of waste
cut from the program.

10
In addition, the Medicaid matching grant is open ended. The more that states choose to
spend on covered services, the more federal dollars they receive. The open-ended nature of the
program is critical to the price effect of matching grants. If the match has a preset cap, then state
expenditures will not be matched on the margin (presuming a state were to spend beyond the
cap), and the price effect will not drive extra spending. States receive the match only for eligible
services (both mandatory and optional) and for eligible populations; they must pay full price for
unapproved coverage.
The price effect of a matching grant affects the calculations of state legislators. Suppose
legislators decide to allocate a pool of state budget dollars to different programs as a means of
maximizing political support or their probability of reelection, as modeled by McCormick and
Tollison (1981), Grogan (1994), and Grossman (1994). The legislators will trade off the support
generated by the extra spending by different state programs. In other words, they will assess
whether allocating an extra $1 million to Medicaid, state parks, or education generates the most
political support. The amount of support generated will depend in part on the amount of
services delivered.
The matching grant structure allows state legislators to direct $2 million to $4 million in
services to health care by appropriating $1 million to Medicaid. This structure provides a
systematic advantage relative to programs funded entirely out of own funds and, thus, creates a
long-term source of growth for Medicaid. Kane, Orszag, and Apostolov (2005, p. 104) discuss
how this dynamic affects appropriations over time. Although they are most concerned about the
alternative of higher education, the effect is general: “Because of the availability of federal
matching funds, the economics of the Medicaid program are quite different from other state
spending programs from the point of view of state legislatures. . . . If a state were to cut its own

11
spending on Medicaid by $1, it would forgo . . . federal matching funds. In contrast, when a state
reduces its subsidies to higher education and raises tuition, the residents of the state usually
receive additional federal funds in the form of greater eligibility for subsidized federal financial
aid and tax credits.” The price effect described here is only one factor affecting legislators’
decisions. Factors that affect the relative ability of Medicaid beneficiaries to generate support,
such as voting rates and the distribution of beneficiaries across legislative districts, also matter.
And Medicaid is not the only program for which federal matching grants are available. Thus the
availability of the federal match does not trump all other types of state spending.
Different FMAPs across states and changes over time provide a source of secondary
predictions; namely, states with higher FMAPs should experience more Medicaid growth, and
growth should occur when FMAPs have been highest. These predictions assume that all else is
equal and therefore may not be testable. For example, FMAPs vary across states on the basis of
income. States with a lower price for Medicaid are also poorer. Also, the ARRA temporarily
increased FMAPs, thereby potentially creating a natural experiment. But the boost to FMAPs
coincided with the Great Recession’s shocks to Medicaid demand and state tax revenues.
State policymakers who make decisions about their Medicaid program can shift some of
the cost to other governments. Politicians who wish to maximize support from their constituents
can be expected to take full advantage of any and all opportunities beyond the match to make
other governments pay the cost of their program. The Medicaid funding rules allow states to use
a variety of tricks to increase federal dollars received, such as counting dollars from outside of
the state appropriations toward the state match (Antos 2014). The most prominent example of
this practice is the disproportionate shares paid to compensate hospitals serving large numbers
of uninsured and Medicaid patients. States have increased Medicaid reimbursement payments to

12
such hospitals and passed part of the cost on to the federal government. Special taxes on
facilities were imposed on hospitals that were paid disproportionate shares, and those taxes
counted toward a state’s match. As Antos (2014) demonstrates, states could end up making
money from the arrangement. Donations from hospitals and providers and shifting of revenues
to facilities owned and operated by local governments have also allowed states to game the
system (O’Neill 2014).
States have managed not merely to share costs with the federal government through the
FMAP but to leverage state appropriations to Medicaid. Furthermore, such efforts to game the
system are the typical and not the exceptional condition. Once an opportunity to game the system
is discovered, other states imitate the system, as occurred with disproportionate share payments
in the early 1990s. This leveraging of state appropriations is one reason Medicaid has absorbed
an increasing share of state budgets over the past 50 years.
Behavioral Effects of Grants
People sometimes misperceive and misinterpret government policies, a practice that leads to
anomalous results. These effects can occur in addition to the price effect of intergovernmental
grants. Behavioral economics has identified a number of systematic deviations of behavior from
rational choice models of traditional economics. Consequently, I will label the anomalous effects
of grants as behavioral effects to keep them distinct from the incentive effect of matching grants.
Historically, grants have increased government spending more than is explicable in the
microeconomics budget line–indifference curve framework. Such effects have been labeled the
flypaper effect, alluding to the tendency of money to stick where it hits (Courant, Gramlich, and
Rubinfeld 1979).

13
The flypaper effect works as follows. Consider an unrestricted block grant from the
federal government to a state. Such a grant for $100 million to a state is formally equivalent to a
$100 million increase in state income from the perspective of a representative citizen: both result
in the same parallel shifting of the budget line.7 The increase in income will increase the quantity
demanded of all normal goods, including services provided by the state government. The income
effect should boost state government spending by 5 percent to 10 percent of the increase in
income. So rational choice microeconomics suggests that a $100 million increase in state
income, from either economic growth or intergovernmental grants, should increase state
government spending by perhaps $10 million. If a grant is received, it should result in a
reduction in state taxes of $90 million to $95 million. Instead, a wide range of empirical studies
show that state spending might rise between 30 percent and 70 percent of the grant amount
(Hines and Thaler 1995; Sobel and Crowley 2014).
Several explanations have been advanced for the flypaper effect. Courant, Gramlich, and
Rubinfeld (1979) contend that citizens might confuse the average and marginal cost of local
services, in which case the flypaper effect would be similar to fiscal illusion. A block grant
appears to reduce the average cost of government services, and if voters think the cost of
additional government services is also lower, a block grant would also produce a substitution
effect. Hines and Thaler (1995) argue that people systematically treat out-of-pocket costs
differently from opportunity costs, even though a rational choice approach implies their
7 The concept of a representative citizen attempts to abstract from obvious distributional considerations involving who receives each increase in income; see Brennan and Buchanan (1985) for more on the role of uncertainty and a proper perspective for normative evaluations.

14
equivalence. Choi, Laibson, and Madrian (2009) contend that mental accounts that people
create—and the reluctance to shift funds across those accounts—can explain flypaper effects.
The flypaper effect could be one source of growth in Medicaid. Of course, Medicaid uses
open-ended matching grants, so the description given does not apply directly. A matching grant
produces the substitution effect described in the previous subsection in addition to the income
effect. Nonetheless, the magnitude of the increase in spending resulting from matching grants
still appears excessive relative to the plausible magnitude of the substitution effect. Furthermore,
tests of the flypaper effect generally examine overall state or local government spending. A
narrower flypaper effect would need to be invoked to explain how Medicaid grants stick in
Medicaid budgets. The issue would be whether Medicaid matching grants might cause state
governments to reduce appropriations already made for medical services for the poor.
The flypaper effect could be a natural product of grants when state governments are not
perfect agents of citizens. This explanation might be subsumed by the public choice factors to be
discussed shortly. Flypaper effects might also emerge from deviations from traditional rational
choice and their interaction with the political process in what is emerging as behavioral public
choice (Tasić 2011; Viscusi and Gayer 2015). For the purposes of this paper, the exact cause of
flypaper effects is not important. In generating a useful categorization of causes for the growth of
Medicaid, flypaper effects can refer broadly to any effects of grants stemming from deviations from
rational choice in an effort to distinguish such effects from the substitution effect of the FMAPs.
Interest Groups, Ideology, and Information
Decisions in representative democracy do not occur by magic. Many people interact in elections,
legislatures, and policy implementation, and together they combine to shape public policies.

15
Each participant has resources, goals, and preferences; possesses certain decision rights; and has
access to certain information. Public choice pioneered the systematic application of
methodological individualism to understand how interaction produces outcomes in politics and,
most typically, representative democracy.8 Interest groups, the ideology of public office holders,
and information asymmetries offer public choice explanations for the growth of Medicaid.
Interest groups provide an important potential cause of Medicaid expansion. They also
provide the means of filtering citizen preferences in representative democracy. Interest groups
aggregate citizens with similar opinions on given issues, and those groups economize on the
transactions costs of interacting with representatives. Yet citizen preferences do not
automatically aggregate and translate into equivalent interest group representations. Olson
(1965) pioneered the analysis of how and why some interests will organize more effectively than
others. Groups able to credibly deliver more votes or provide more volunteers or campaign
contributions will have more influence, and public policies will reflect organizational capability
and not the underlying distribution of citizen preferences. Factors affecting interest group
formation include size, the stake per person, and a concentration of benefits on a subset of broad
interest group members. Also, an interest group organized for one purpose can always apply the
organization to lobby for other issues, including perhaps Medicaid.
For interest groups to explain the growth of Medicaid, the relative political resources and
influence of beneficiary groups would need to be increasing over time.9 Beneficiaries would
need to be getting better organized than taxpayers or other groups competing for funds in the
8 For an overview of the public choice perspective, see Leighton and López (2013). For detailed discussions of the literature, see Mueller (2003) and Mitchell and Simmons (1994). Grogan (1994) applies a model of self-interested politicians and Medicaid policy choice. 9 If the program had been shrinking over time, an explanation based on interest groups would then naturally focus on the organization of program opponents or a decline in the organization of beneficiaries.

16
state budget. At first glance, interest groups appear to be a poor way to explain Medicaid growth
because the poor and children in poverty are recognized as relatively weak interests (Grogan
1994; Kousser 2002). Also, reimbursement rates for covered procedures have been so low as to
lead to shortage of doctors willing to accept Medicaid patients (Antos 2014, 21), which suggests
that physicians must not be driving program growth either. But other groups are affected by
Medicaid, such as hospitals, and the program provides assistance to people who are disabled and
to people who are age 65 and older, particularly through coverage of the medically needy.
Consequently, the AARP (formerly the American Association of Retired Persons) and nursing
homes could also be relevant in an interest group calculus.
Ideology (meaning general attitudes toward the role of the state in society) complements
economic interests as an important element of political economy. Medicaid, a component of
President Lyndon Johnson’s Great Society, has been associated with left-liberal values and
ideology. Recently, many Republicans have opposed expansion of Medicaid under the ACA on
ideological grounds (Sobel 2014). Ideology as a factor in the growth of Medicaid, distinct from
interest groups, would focus on the politicians who control the levers of government. Politicians
might reflect the interests or political views of citizens, or on occasion they may take actions
reflecting their personal political beliefs when the political costs are not high. As a factor,
ideology typically identifies with the party identity of politicians. That factor would predict that
growth in Medicaid would result from a more favorable political balance for Democrats.
The methodological approach of public choice emphasizes that the government does not
act alone and that the interests of different government officials often conflict. Principal–agent
problems arise between citizens and government and between different government officials.
Information is costly. Information asymmetries can exist between government officials, and
17
intergovernmental grants can be a source of asymmetric information. Filimon, Romer, and
Rosenthal (1982) argue that agencies can often hide the existence of grants from voters, thereby
allowing the agencies to retain control over resources and providing a public choice explanation
of the flypaper effect. Although overall the Medicaid program cannot fly under the radar, various
elements of the program will be less salient and may allow some politicians to exploit an
advantage of information in this manner.
3. Examining the Growth of Medicaid: The Role of the States
How can one determine the contribution of the factors described in the previous section to the
growth of Medicaid observed over the past 50 years? One approach would focus on decision
making in Washington and would attempt to link Medicaid spending growth to changes in such
factors at the national level. Such an approach has been attempted, and Klemm (2000) provides a
brief macrohistorical perspective on Medicaid growth. But identifying correlations or causal
relationships at the national level seems daunting given the various factors involved and only one
50-year span of Medicaid spending.
The state side of Medicaid’s partnership offers a much more promising approach to
examining the political economy factors driving program growth. The states have different
FMAPs, different partisan politics, and different balances of interest groups, and they experience
changes in the vector of political economy variables at different times. Variation in state
programs offers a much more promising venue to assess the political economy of Medicaid.
The federal structure of Medicaid, however, must inform any empirical analysis of state
programs and spending. The federal government mandates that state programs must cover certain
individuals and treatments to be eligible for funding, and it also limits other program dimensions,

18
such as charging the participants copayments. Still, numerous dimensions of discretion exist for
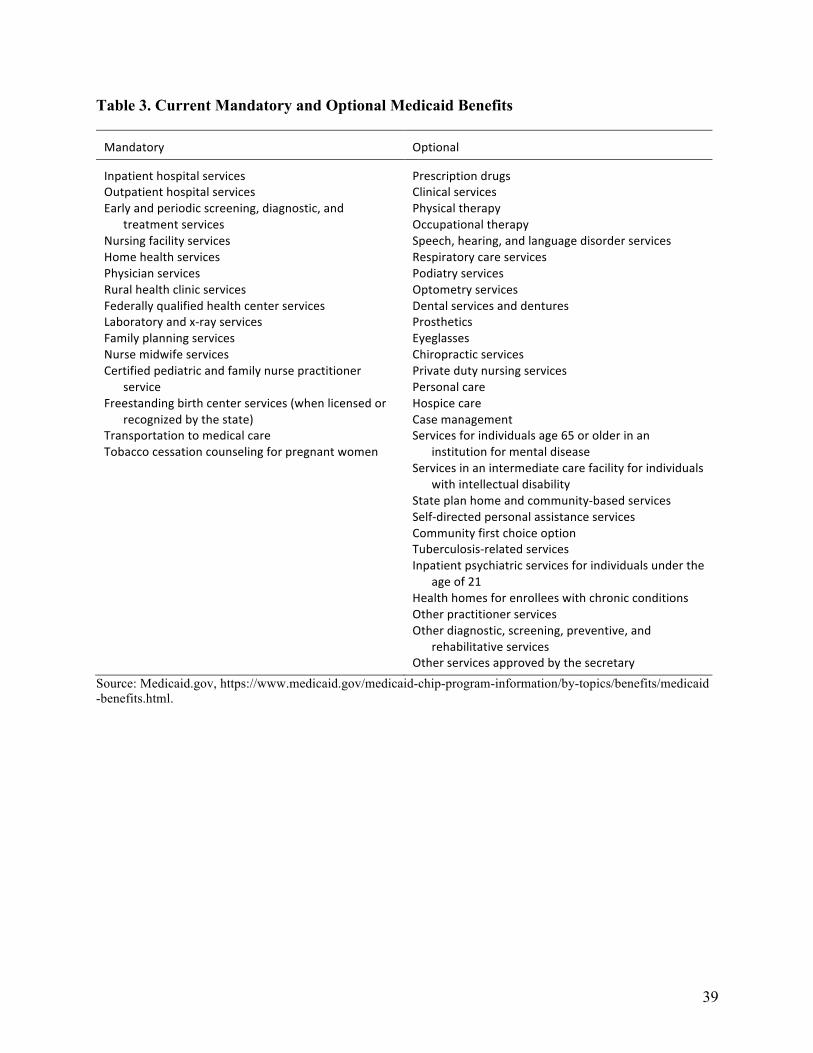
state policymakers. Table 3 (page 39) lists the current mandatory and optional benefits for
Medicaid. For example, state programs must cover inpatient and outpatient hospital services,
physician services, and transportation services to medical care, but they have discretion
concerning prescription drug coverage, dental services, and hospice care.
The number of states offering the different optional services varies considerably
depending on the service. Table 4 (page 40) shows the number of states offering optional
services as of 2005. State officials can also determine the extent of coverage for optional
services. All states cover prescription drugs, but they can restrict which Medicaid enrollees have
this coverage, can impose a formulary (Moore and Newman 1993), and can vary required
copays. States can also choose whether to cover optional populations. The most important
optional coverage group for contribution to overall expenditures has been the medically needy—
individuals with incomes above Medicaid cutoffs but with particularly expensive medical
conditions. States also vary in their coverage for children, pregnant women, parents, and adults
who are not disabled. Many experiments with the delivery of mandatory services, such as
managed care, have been conducted under Medicaid waivers. Waiver requests are voluntary and
provide extra dimensions of discretionary policy.
Political economy factors at the state level affect only the optional or discretionary
elements of state Medicaid programs and expenditures, as Grogan (1994) and Kousser (2002)
emphasize. A proper test of the political economy determinants of Medicaid growth must focus
on discretionary elements of policy. An econometric analysis of total state Medicaid spending,
which lumps together mandated and discretionary expenditures, could obscure the effect of state-
specific factors on the true dimensions of choice.
19
Furthermore, the interests of provider groups are not always obvious, as Kousser (2002)
discusses. One might expect hospitals and doctors to support expansions of Medicaid, but
hospital and physician services are mandatory for state programs (table 3). Thus, hospitals and
physicians will likely not support optional coverage of eyeglasses and dentists. Indeed,
mandatory service providers may oppose optional programs that could compete for state dollars
and could result in lower reimbursement rates for covered procedures.
Any empirical examination of Medicaid expenditures must also control for the
entitlement element of the program. All individuals who meet the eligibility criteria of a state
program can enroll and receive benefits without an explicit appropriation. To a large extent,
year-to-year fluctuations in Medicaid spending will be affected by the number of eligible persons
in a state; hence spending may rise or fall with no change in the underlying structure of the
program. Also, individuals eligible for Medicaid coverage must enroll in the program. The
existence of numerous eligible but unenrolled people creates the potential for increases in
spending following enrollment drives regardless of the underlying political economy factors.
4. A Review of the Evidence on State Medicaid Policy and Spending
Empirical studies generally confirm the effect of medical need, meaning that variables such as
low-income children, elderly, and a medical price index generally affect spending significantly
and in the expected directions, particularly when the measure of spending is more narrowly
focused. Specific studies and their findings of interest will be discussed subsequently. Evidence
does emerge of tradeoffs between the breadth of coverage and the generosity of benefits
(specifically in Barrilleaux and Miller 1988, Pracht and Moore 2003, and Grogan 1994), which is
relevant for two reasons. First, the impact of spending growth linked to medical need may be

20
moderated. If an increase in the potentially eligible population results in reductions in
reimbursement rates, for example, changes in medical need will be a less important driver of
overall program growth. Second, interest groups benefiting from one component of expenditures
may strongly oppose expansion to cover discretionary services from other providers. Little
evidence directly bearing on flypaper effects emerges from studies on Medicaid, perhaps because
of the challenge of documenting misinterpretation or mistakes.
One of the first studies to apply the political economy framework to Medicaid is by
Barrilleaux and Miller (1988), who estimate a joint model of the demand and supply of Medicaid
plus state spending (as a percentage of all state government expenditures) using cross-sectional
data from 1982. They find strong support of political economy factors driving state Medicaid
spending, including (a) political ideology (as measured by a state congressional delegation’s
Americans for Democratic Action voting score), (b) strength of interest groups in a state, and (c)
size of the state Medicaid bureaucracy. The price of medical care (cost of inpatient hospital care)
and the number of total Medicaid recipients do not affect overall Medicaid spending, providing
little support for need as a driver of spending. Barrilleaux and Miller, however, examine only total
state spending as opposed to optional spending, and thus their results must be treated with caution.
Camobreco (1996) offers an important contribution by focusing his analysis on interest
group lobbying. Although Medicaid is popularly perceived as an insurance program for low-
income children and parents, the majority of its dollars go to recipients who are disabled and
elderly (Grannemann and Pauly 2010; O’Neill 2014). Camobreco breaks down Medicaid
expenditures connected to (a) low-income recipients (whose eligibility is linked to AFDC) and
(b) recipients whose eligibility is based on Supplemental Security Income (SSI). Nursing homes
receive half of their revenue from SSI-eligible Medicaid patients, but their interest concerning

21
Medicaid should focus on SSI-eligible expenditures. Camobreco separates state expenditures
into those two categories, and he finds that the number of nursing home beds is a significant and
quantitatively important determinant of SSI expenditures, but one that is only marginally
significant, with a much smaller marginal effect for AFDC expenditures. Furthermore, number
of hospital beds and number of AARP members significantly increase SSI expenditures, but they
do not affect AFDC expenditures. Note that Camobreco does not distinguish mandatory from
discretionary expenditures in the two categories.
The best tests of the political economy of Medicaid focus exclusively on the program
elements under the control of state policymakers. Kousser (2002) estimates regressions of
discretionary and total spending using a panel dataset. He finds a strong influence of partisan
political variables on discretionary spending. Republican control of a state legislature
significantly reduces discretionary spending but is insignificant for total state spending. A line-
item veto, often extolled as a means of controlling spending, also significantly reduces
discretionary spending but not total spending. State public opinion and divided party control of
state government are not significant determinants of discretionary or total spending. Overall,
Kousser finds that political factors have a large (and not merely statistically significant) effect on
spending: a change in all political variables from the 25th to the 75th percentile increases
discretionary spending by 23 percent but overall spending by only 4 percent. The FMAP
increases both total and discretionary spending but has a much larger effect on discretionary
spending. The marginal effect of the FMAP is also large: moving a state from the lowest (50
percent) to the highest FMAP increases discretionary spending by 22 percent.
Grogan (1994) conducts a panel data examination of the determinants of state Medicaid
policy on four different discretionary margins: (a) the income threshold for a state’s AFDC
22
program (receipt of AFDC created eligibility for Medicaid), (b) a measure of optional
categories of beneficiaries covered, (c) the income level for eligibility for coverage under the
Medically Needy program, and (d) a measure of optional program benefits (e.g., dental care).
She finds a strong but targeted interest group influence; nursing homes and interest groups
lobbying for senior citizens affect the income eligibility threshold of the Medically Needy
program, whereas health care providers increase the number of optional benefits. Both political
culture and party control of state government significantly influence each dimension of policy.
Republicans and a more traditionalist political culture correlate with less generous state
Medicaid programs. Income is positively related to three of the dimensions of Medicaid policy,
whereas the FMAP is negatively related to financial eligibility but positively related to
coverage of optional beneficiary categories.10 The AFDC income threshold in surrounding
states is positively related to the thresholds of the AFDC and the Medically Needy programs,
consistent with the potential for migration (a Medicaid magnet) affecting the generosity of
state benefits.
Interest groups also significantly affect prescription drug coverage. All states offer
optional drug coverage, but coverage varies on a range of dimensions that can affect cost, such as
state formularies (Moore and Newman 1993). Pracht and Moore (2003) examine the
determinants of pharmacy profits, the number of Medicaid drug recipients, and drug
expenditures per recipient using a panel dataset. The number of pharmacists is a consistently
significant and important determinant of the generosity of coverage, in the expected direction. A
larger number of physicians, however, increases the number of recipients but not the
10 Income is negatively correlated with the income threshold for the medically needy, but this regression is estimated only for states with this eligibility. The lowest-income states tend not to offer this eligibility.

23
expenditures per recipient or the pharmacy profits.11 The location of pharmaceutical
manufacturers does not affect state Medicaid policies, which may seem surprising but may
suggest that drug manufacturers find greater value in trying to influence other dimensions of
health care policy. Pracht and Moore find evidence of a tradeoff between the number of
beneficiaries and expenditures per beneficiary. In addition, political ideology—but not partisan
control—has some influence over prescription drug policies, and states with higher FMAPs
cover more recipients.
Congress authorized home- and community-based service waivers in 1981 to allow states
to provide alternatives to institutionalized (nursing home) care for Medicaid patients. Harrington
et al. (2000) examine the effect of state-level variables on the number of participants and
expenditures on home-based health.12 The authors find that (a) higher state income significantly
increases both the number of participants and the amount of spending and (b) states with
Democratic governors spend more than states with Republican governors. States with more
nursing homes have fewer participants in home- and community-based services and lower
spending, whereas states with more home health care agencies and more Medicare home health
users have more participants and expenditures. The study found both the number of AARP
members in a state and the political ideology of a state’s congressional delegation to be
insignificant.
The structure of intergovernmental grants interacts with interest groups to affect spending
over time. Sobel and Crowley (2014) extend a test of the flypaper effect over time and find that
11 Pracht and Moore (2003) contend that doctors have a weak interest in prescription drug coverage (freedom to prescribe a first-choice drug to a patient) and interpret the significant result for recipients as related to greater access of potential Medicaid patients to doctors. 12 Home health care can offer significant savings relative to nursing home care, and thus the results may not really reflect the generosity of state Medicaid. Increased spending on home health care may be a sign of fiscal prudence and not profligacy, because each dollar spent on home care may save more than one dollar in nursing home care costs.

24
grants received today affect future spending and taxes. Thus, grant dollars not only stick where
they hit today, but also persist, perhaps even after the initial grant disappears. The plausible
mechanism for persistence is that grants today help create the interest groups to lobby for the
program’s continuation if the initial grant disappears. Sobel and Crowley do not explicitly control
for the type of grant (matching or block), and they do not consider Medicaid specifically. But the
strongest evidence of persistence that they find is in grants by the US Department of Health and
Human Services, which includes the Medicaid program. The persistence of grant spending has
significant implications for Medicaid growth. Optional types of coverage, for example, will likely
prove relatively permanent once established, and the potential for states to retrench the ACA
expansion after the 100 percent payment by the federal government expires will likely be limited.
5. A Natural Test: Expansion of Medicaid under the Affordable Care Act
Even though politics does not follow laws of mechanics, a sound positive political economy of
Medicaid spending should illuminate the ongoing and future evolution of the program. The
expansion of Medicaid under the ACA provides a type of “out-of-sample” test of the political
economy of Medicaid growth. Do the factors discussed in this paper correlate at all with the
expansion of Medicaid by the states?
The ACA was designed to use Medicaid programs to expand health insurance coverage
for Americans. The ACA required states to increase eligibility to 138 percent of the poverty line,
but the US Supreme Court ruled this provision unconstitutional in National Federation of
Independent Business v. Sebelius, which was decided in June 2012.13 Essentially, Sebelius made
expansion optional, and to date 19 states have refused to expand coverage.
13 National Federation of Independent Business v. Sebelius, 567 U.S. __ (2012).
25
Sobel (2014) offers an econometric examination of the ACA Medicaid expansion,
focusing on partisan politics and expansion cost estimates by state from Holahan et al. (2012).
Mean comparisons reveal that states that have not expanded Medicaid have significantly higher
costs estimates and are more likely to have Republican-controlled state governments. But probit
or logit regressions of the expansion decision find that only Republican control of the lower
chamber of the state legislature attains statistical significance.
Jacobs and Callaghan (2013) have examined the correlates of state Medicaid expansion.
Conducted shortly after the Supreme Court ruling, their study uses an index of factors that might
indicate whether a state would eventually expand Medicaid, including the receipt of planning
grants and other ACA-related changes to their Medicaid programs. Democratic control of state
government, income, the generosity of Medicaid benefits prior to the ACA, and state Medicaid
administrative capacity are positively and significantly correlated with expansion. Jacobs and
Callaghan present only correlations and not any multivariate regressions; therefore, no
conclusions about the significance of variables given the others can be offered. They interpret the
generosity of Medicaid to date as reflecting path dependence in policy, but it might also be
interpreted as reflecting preferences of state voters toward health care assistance.
I consider here the correlation of a wider range of political economy variables with state
decisions to expand Medicaid. States that have expanded coverage to the ACA-designated
population (as of March 2015) are classified as expanding, and all other states are classified as
not expanding.14 Table 5 (page 41) reports the means of variables previously used in the political
economy of Medicaid spending for expanding and nonexpanding states, grouped into five
categories: (a) need or cost of expansion, (b) price, (c) interest groups, (d) partisan politics, and
14 I count states expanding Medicaid through a waiver as expanding states and those in the “considering” category as not expanding. Sobel (2014) omitted states in the “considering” category from his analysis.

26
(e) ideology. The ability to tease out causation with a single cross-section of state decisions (50
data points) with a large number of potentially relevant factors is extremely limited.
Consequently, the differences in means in table 5 should not be interpreted as providing
definitive evidence, and they only indicate potential correlations.
Table 5 includes three measures of the cost of expansion, taken from Holahan et al.
(2012): (a) the increase in state expenditures over the period 2013–19 as a percentage of state
expenditures, (b) the increase in total Medicaid expenditures over this period as a percentage of
combined state and federal spending, and (c) the increase in the number of enrollees as a
percentage of projected enrollment had the ACA not passed. The states not expanding
Medicaid have higher estimated costs by all three measures—a finding that is consistent with
that of Sobel (2014)—with the eligible population more than 10 percentage points larger (41
percent vs. 29 percent). The overall cost of expansion under the ACA depends on the previous
generosity of a state’s program and attitudes toward Medicaid, thus making its exact
interpretation ambiguous.
The price variables are the FMAP and the eFMAP, which applies to state CHIP
programs. The federal government will pay 100 percent of the cost of the expansion for three
years, with this rate then falling to 90 percent by 2019. Eventually, states might face a regular
match for coverage for these populations and could use either the current FMAP to project future
cost. Table 5 shows that the states that have not expanded Medicaid have slightly higher
matching rates on average. The temporary 100 percent coverage of costs the federal government
offered to states that expand Medicaid may help explain why current FMAPs do not correlate
with the expansion. Although the FMAPs could easily reflect the eventual price to states of the

27
Medicaid expansion, the relatively short political time horizon (Brennan and Buchanan 1985)
may result in excessive focus on the immediate budgetary cost.15
Five measures of interest groups are examined: (a) number of hospitals (b) number of
hospital beds, (c) total hospital revenue, (d) number of nursing homes, and (e) number of
physicians, all scaled by state population. Although hospitals and nursing homes have favored
expansion, those interest group variables do not correlate with expansion as expected. The states
that have not expanded Medicaid have 40 percent more hospitals per million residents and
slightly more hospital beds, although hospital revenue per capita is 5 percent higher in expanding
states. States that have not expanded have more nursing homes as well. Expanding states have
more physicians per capita. This finding is in contrast with earlier studies discussed in section 4
that often found little explanatory power for physicians as an interest group driving Medicaid.
Five partisan political variables are also examined: (a) Republican control of the
governorship, (b) the proportion of seats held by Republicans in the state house, (c) the
proportion of seats held by Republicans in the state senate, and (d) the two dummy variables for
unified control of all three branches by either Republicans or Democrats (all tabulated in 2014).
All partisan politics variables correlate with Medicaid expansion in the direction reported by
Sobel (2014) and Jacobs and Callaghan (2013), with Republicans less likely to have expanded
Medicaid. The unified Republican and unified Democratic government variables best illustrate
the partisan divide over Medicaid expansion: (a) 81 percent of states not expanding had unified
Republican state government versus 21 percent of states expanding Medicaid, whereas (b) 54
percent of states expanding Medicaid had unified Democratic state government versus 0 percent
15 Recall that differences in FMAPs across states constituted a secondary prediction from the effect of matching grants on the growth of Medicaid. All states have a lower price on the margin because of the structure of Medicaid matching grants. This structure could still be affecting decisions even if differences in the FMAP across states do not have discernible effects.

28
of states not expanding. As a different way of viewing the partisan divide, 17 of the 23 states
with unified Republican control have not expanded Medicaid, whereas all 15 states with unified
Democratic control have expanded. However, some unified Republican state governments have
expanded Medicaid, so factors other than partisanship clearly have affected expansion, as Jacobs
and Callaghan (2013) observe.
Finally, table 5 includes two measures of presidential voting to attempt to control for
ideology. Partisan labels do not necessarily identify the same policy positions across states: a blue
state Republican governor probably pursues a more moderate agenda than a red state Republican
governor. Voters in all states face the same choice in presidential contests. I examine the
percentage of the general election popular vote won by President Barack Obama in 2012 as well
as the average state vote percentage for the Democratic candidate in the past four presidential
elections (2000 through 2012). The two measures each reveal the same 13 percentage point
difference (in the Democrat’s favor) between expanding and nonexpanding states.
In summary, the expansion of Medicaid by states under the ACA correlates with the
estimated costs of expansion and partisan control, as Sobel (2014) shows, and also with
general political views as reflected in presidential voting. But the price of Medicaid to states,
as reflected by differences in the FMAP and in interest groups (particularly hospitals and
nursing homes), does not correlate in the expected manner. Conceivably, differences in the
desired size and scope of government could drive the differences in table 5 regarding
presidential voting, party control of state government, and generosity of state Medicaid
programs before the ACA.

29
6. Discussion
The evidence from the published studies discussed in section 4 supports a political economy
(meaning demographic, economic, and interest group factors interacting in a political market
brokered by politicians trying to maximize their support) explanation for differences in Medicaid
spending across states. This finding is generally valid even though interest group measures did
not correlate closely with the ACA expansion of Medicaid. Almost all of the factors identified in
section 2 as potential drivers of Medicaid growth—medical need, interest groups, ideology, and
the price of Medicaid to the state (the FMAP)—receive support in different tests on different
elements of the program. One lesson is the wide range of policy choices contained in Medicaid
(Grogan 1994; Camobreco 1996) and the consequent need for careful consideration of the exact
alignment of interests on a particular element of policy. The ability of state policymakers to
adjust reimbursement rates even for mandatory coverage and several studies (Barrilleaux and
Miller 1988; Grogan 1994; Pracht and Moore 2003) provide evidence that reimbursement may
well adjust in response to expansions in coverage. Consequently, interests benefiting from
different parts of Medicaid may frequently clash, because offering optional service (e.g.,
prescription drugs) may reduce dollars available for mandatory coverage. Medicaid’s low
reimbursement rates are widely known (Fitchner 2014). Those low rates might be a result of
politicians who are trying maximize their support by securing credit for expanding coverage and
then using the less publicly visible mechanism of reimbursement rate cuts to limit total spending.
The interest group perspective provides insight on the balance of Medicaid spending
between children and the poor versus the elderly and persons who are disabled. As many
observers note, poor people—especially children—are politically marginalized. Perhaps it is not
surprising then that almost two-thirds of Medicaid dollars go to the elderly and to persons who
30
are disabled (the SSI eligible population) even though Medicaid is commonly described as
providing health insurance for poor people and children.16 The program has grown from 1
percent to 3 percent of GDP, but spending on children and the poor remains (before the ACA
expansion, at least) at perhaps 1 percent of GDP. Although Medicaid has long provided this care,
the program’s budgetary impact today results from long-term care for the elderly and for persons
who are disabled.
The main policy-relevant determinants are the FMAP and the role of the open-ended
grant structure on program growth. Kousser (2002) provides the best study to identify the overall
effect of differences in the FMAP across states on spending, and his estimate was that shifting a
state from the lowest to highest FMAP increases discretionary expenditures by 22 percent.
Matching grants have undoubtedly contributed to Medicaid growth.
The analysis of policy and expenditures across states can provide evidence on the effect
of differences in the FMAPs across states. But it cannot fully identify the effects of the matching
structure because all states receive matching funds. Another way of viewing the problem is that
the distribution of FMAPs across states is truncated at 50 percent.17 To assess the full effect of
the matching structure, one needs to look beyond the FMAP in cross-sectional analysis.
Although the intention of income-based FMAPs seems to have been to equalize spending across
states, high-income states have continually received a large share of federal Medicaid dollars
(Camobreco 1996; Grannemann and Pauly 2010). The frequent significance of state per capita
income as a determinant of Medicaid spending in the state-level analysis (e.g., Grogan 1994;
16 See the 2013 Medicaid Trustees Report, table 2, p. 15, http://medicaid.gov/Medicaid-CHIP-Program-Information /By-Topics/Financing-and-Reimbursement/Downloads/medicaid-actuarial-report-2013.pdf. Only 14.8 million of 57.6 million Medicaid enrollees were elderly or disabled as of 2012. 17 This percentage is due to the floor on the FMAPs; the formula would result in FMAPs of less than 30 percent in the highest income states.
31
Harrington et al. 2000; Jacobs and Callaghan 2013) provides the evidence. High-income states
have secured more federal dollars by expanding Medicaid to cover optional populations not
covered by low-income states. The highest-income states effectively harness the federal match to
fund optional types of coverage that lower-income states simply cannot afford, despite their
higher FMAPs.
Although cross-state analysis is limited in its ability to identify the portion of optional
spending by high-income states because of Medicaid’s open-ended match, the effect may well be
large. State lawmakers in high-income states still get to pass on half of the cost of their
generosity to federal taxpayers. High-income Massachusetts, for example, experimented with
providing universal health insurance coverage through its Medicaid program and a federal
waiver. States can expand their Medicaid programs to cover populations or services not
authorized by the federal government, but they will not be eligible for any federal matching
dollars unless a waiver is obtained. The paucity of programs undertaken by states under such
conditions provides additional evidence on the influence of the availability of federal dollars on
expansion. Grannemann and Pauly (2010) argue that the matching grant structure has diverted
federal dollars into optional coverage in high-income states, thereby compromising the adequacy
of the coverage for low-income enrollees in low-income states.
7. Conclusion
The purpose of this review is to evaluate the evidence found by researchers on the determinants
of Medicaid spending and growth, because this knowledge must inform any effort at reforming
the program. The motivating questions for this review are as follows:

32
• Do explicit policy decisions or factors outside of the control of politicians drive the
growth of Medicaid?
• Is the matching grant structure of Medicaid an important driver of growth?
• Is there evidence of inefficient spending?
An interest group explanation for the growth of Medicaid, for example, leaves limited options
for reform, because interest groups cannot be expected to act against their economic interest
and permit reform. If medical need is the primary cost driver, growth may be driven by factors
outside of the control of politicians, and curtailing spending growth would require reductions
in benefits.
Studies of the political economy of Medicaid provide strong evidence of the effect of the
matching grant structure on program growth. Notably, the FMAP is a consistently significant
determinant of optional coverage and spending levels. High-income states have captured a large
share of federal Medicaid spending despite the obvious intent of income-based FMAPs to help
low-income states meet their greater need for coverage for the poor. Almost surely, high-income
states have significantly expanded their programs to optional populations and expanded their
coverage because of the ability to pass on half of the cost to federal taxpayers (and for state
policymakers to bear an even smaller portion of the cost). The open-ended nature of the federal
match is particularly relevant here, because it has maintained the cost share for the generosity of
high-income states. The dissipation of Medicaid dollars on optional coverage also seems to be a
factor in the program’s low reimbursement rates for doctors and hospitals. These low rates then
limit the access of Medicaid patients to nonemergency medical care. Furthermore, matching
grants are known to be inefficient, because state decision makers pay only a part of the cost of
the expansion and keep only a share of cost savings. Thus, evidence on the incentive effect of

33
matching grants immediately establishes inefficiency in the existing structure of Medicaid.
Certainly the accumulated evidence supports the potential for block grants—the primary
alternative means of structuring intergovernmental grants—to limit program growth without
necessarily compromising the availability of appropriate care for low-income Americans.

34
References
Antos, Joseph. 2014. “The Structure of Medicaid.” In The Economics of Medicaid: Assessing the Costs and Consequences, edited by Jason J. Fitchner, 9–30. Arlington, VA: Mercatus Center at George Mason University.
Barrilleaux, Charles J., and Mark E. Miller. 1988. “The Political Economy of State Medicaid Policy.” American Political Science Review 82 (4): 1089–107.
Baumol, William J. 2012. The Cost Disease: Why Computers Get Cheaper and Health Care Doesn’t. New Haven, CT: Yale University Press.
Brennan, Geoffrey, and James M. Buchanan. 1985. The Reason of Rules. Cambridge, UK: Cambridge University Press.
Camobreco, John F. 1996. “Medicaid and Collective Action.” Social Science Quarterly 77 (4): 860–76.
Choi, James J., David Laibson, and Brigitte C. Madrian. 2009. “Mental Accounting in Portfolio Choice: Evidence from a Flypaper Effect.” American Economic Review 99 (5): 2085–95.
CMS (Centers for Medicare and Medicaid Services). 2005. Medicaid at a Glance 2005: A Medicaid Information Source. http://downloads.cms.gov/cmsgov/archived-downloads /MedicaidGenInfo/downloads/MedicaidAtAGlance2005.pdf.
———. 2012. Medicaid Managed Care Enrollment Report: Summary Statistics, July 2012. http://www.medicaid.gov/medicaid-chip-program-information/by-topics/data-and -systems/medicaid-managed-care/downloads/2012-medicaid-managed-care-enrollment -report.pdf.
———. N.d. National Health Expenditure Projections 2014–2024, Forecast Summary. https://www.cms.gov/Research-Statistics-Data-and-Systems/Statistics-Trends-and -Reports/NationalHealthExpendData/Downloads/proj2014.pdf.
———. 2016. Medicaid and CHIP: January 2016 Monthly Applications, Eligibility Determinations, and Enrollment Report. https://www.medicaid.gov/medicaid-chip -program-information/program-information/downloads/january-2016-enrollment -report.pdf.
Courant, Paul N., Edward M. Gramlich, and Daniel L. Rubinfeld. 1979. “The Stimulative Effects of Intergovernmental Grants: Or Why Money Sticks Where It Hits.” In Fiscal Federalism and Grants-in-Aid, edited by Peter Mieszkowski and William Oakland, 5–21. Washington, DC: Urban Institute.
Filimon, Radu, Thomas Romer, and Howard Rosenthal. 1982. “Asymmetric Information and Agenda Control: The Bases of Monopoly Power in Public Spending.” Journal of Public Economics 17 (1): 51–70.

35
Fitchner, Jason J. 2014. “The Federal Side of the Budget Equation.” In The Economics of Medicaid: Assessing the Costs and Consequences, edited by Jason J. Fitchner, 49–63. Arlington, VA: Mercatus Center.
Grannemann, Thomas W., and Mark V. Pauly. 2010. Medicaid Everyone Can Count On: Public Choices for Equity and Efficiency. Washington, DC: AEI Press.
Grogan, Colleen M. 1994. “Political-Economic Factors Influencing State Medicaid Policy.” Political Research Quarterly 47 (3): 589–622.
Grossman, Philip J. 1994. “A Political Theory of Intergovernmental Grants.” Public Choice 78 (3–4): 295–303.
Harrington, Charlene, Helen Carrillo, Valerie Wellin, Nancy Miller, and Allen LeBlanc. 2000. “Predicting State Medicaid Home and Community Based Waiver Participants and Expenditures, 1992–1997.” Gerontologist 40 (6): 673–86.
Hines, James R. Jr., and Richard Thaler. 1995. “The Flypaper Effect.” Journal of Economic Perspectives 9 (4): 217–26.
Holahan, John, Matthew Buettgens, Caitlin Carroll, and Stan Dorn. 2012. The Cost and Coverage Implications of the ACA Medicaid Expansion: National and State-by-State Analysis. Washington, DC: Kaiser Commission on Medicaid and the Uninsured.
Jacobs, Lawrence R., and Timothy Callaghan. 2013. “Why States Expand Medicaid: Party, Resources, and History.” Journal of Health Politics, Policy and Law 38 (5): 1023–50.
Kane, Thomas J., Peter R. Orszag, and Emil Apostolov. 2005. “Higher Education Appropriations and Public Universities: The Role of Medicaid and the Business Cycle.” In Brookings-Wharton Papers on Urban Affairs 2005, edited by Gary Burtless and Janet Rothenberg Pack, 99–148. Washington, DC: Brookings Institution Press.
Klemm, John D. 2000. “Medicaid Spending: A Brief History.” Health Care Financing Review 22 (1): 105–12.
Kousser, Thad. 2002. “The Politics of Discretionary Medicaid Spending, 1980–1993.” Journal of Health Politics, Policy, and Law 27 (4): 639–71.
Leighton, Wayne A., and Edward J. López. 2013. Madmen, Intellectuals, and Academic Scribblers: The Economic Engine of Political Change. Palo Alto, CA: Stanford University Press.
McCormick, Robert E., and Robert D. Tollison. 1981. Politicians, Legislation, and the Economy: An Inquiry into the Interest-Group Theory of Government. Dordrecht, Netherlands: Martinus Nijhoff.
Mitchell, William J., and Randy Simmons. 1994. Beyond Politics: Markets, Welfare, and the Failure of Bureaucracy. Oakland CA: Independent Institute.

36
Moore, William J., and Robert J. Newman. 1993. “Drug Formulary Restrictions as a Cost-Containment Policy in Medicaid Programs.” Journal of Law and Economics 36 (1): 143–62.
Mueller, Dennis C. 2003. Public Choice III. Cambridge, UK: Cambridge University Press.
Olson, Mancur. 1965. The Logic of Collective Action. Cambridge, MA: Harvard University Press.
O’Neill, June. 2014. “Medicaid’s Cost Drivers.” In The Economics of Medicaid: Assessing the Costs and Consequences, edited by Jason J. Fitchner, 31–45. Arlington, VA: Mercatus Center.
Owcharenko, Nina. 2014. “The State Side of the Budget Equation.” In The Economics of Medicaid: Assessing the Costs and Consequences, edited by Jason J. Fitchner, 65–79. Alexandria, VA: Mercatus Center.
Pracht, Etienne E., and William J. Moore. 2003. “Interest Groups and State Medicaid Drug Programs.” Journal of Health Politics, Policy, and Law 28 (1): 9–39.
Sobel, Russell S. 2014. “The Elephant in the Room: Why Some States Are Refusing to Expand Medicaid.” Applied Economics Letters 21 (17): 1226–29.
Sobel, Russell S., and George R. Crowley. 2014. “Do Intergovernmental Grants Create Ratchets in State and Local Taxes?” Public Choice 158 (1): 167–87.
Tasić, Slaviša. 2011. “Are Regulators Rational?” Journal des Économistes et des Études Humaines 17 (1): 1–21.
Viscusi, W. Kip, and Ted Gayer. 2015. “Behavioral Public Choice: The Behavioral Paradox of Government Policy.” Harvard Journal of Law and Public Policy 38 (3): 973–1007.

37
Table 1. The Growth of Medicaid
Year TotalMedicaidspending($billions)
FederalspendingasashareofMedicaid
total(%)
MedicaidspendingasashareofMedicare
(%)
Medicaidspendingasashareofnationalhealthexpenditures
(%)
1970 5.3 52.8 69.0 7.1
1980 26.0 55.8 69.6 10.2
1990 73.7 57.8 66.9 10.2
2000 200.3 58.3 89.1 14.6
2010 397.2 67.1 76.3 15.3
2014 495.8 61.5 80.1 16.4Source: Table 3, National Health Expenditures; Levels and Annual Percent Change, by Source of Funds: Selected Calendar Years 1960–2014, https://www.cms.gov/Research-Statistics-Data-and-Systems/Statistics-Trends-and -Reports/NationalHealthExpendData/NationalHealthAccountsHistorical.html.

38
Table 2. Federal Medical Assistance Percentages by State
State FMAP eFMAP State FMAP eFMAP
Alabama 69.87 78.91 Montana 65.24 75.67
Alaska 50.00 65.00 Nebraska 51.16 65.81
Arizona 68.92 78.24 Nevada 64.93 75.45
Arkansas 70.00 79.00 NewHampshire 50.00 65.00
California 50.00 65.00 NewJersey 50.00 65.00
Colorado 50.72 65.50 NewMexico 70.37 79.26
Connecticut 50.00 65.00 NewYork 50.00 65.00
Delaware 54.83 68.38 NorthCarolina 66.24 76.37
Florida 60.67 72.47 NorthDakota 50.00 65.00
Georgia 67.55 77.29 Ohio 62.47 73.73
Hawaii 53.98 67.79 Oklahoma 60.99 72.69
Idaho 71.24 79.87 Oregon 64.38 75.07
Illinois 50.89 65.62 Pennsylvania 52.01 66.41
Indiana 66.60 76.62 RhodeIsland 50.42 65.29
Iowa 54.91 68.44 SouthCarolina 71.08 79.76
Kansas 55.96 69.17 SouthDakota 51.61 66.13
Kentucky 70.32 79.22 Tennessee 65.05 75.54
Louisiana 62.21 73.55 Texas 57.13 69.99
Maine 62.67 73.87 Utah 70.24 79.17
Maryland 50.00 65.00 Vermont 53.90 67.73
Massachusetts 50.00 65.00 Virginia 50.00 65.00
Michigan 65.60 75.92 Washington 50.00 65.00
Minnesota 50.00 65.00 WestVirginia 71.42 79.99
Mississippi 74.17 81.92 Wisconsin 58.23 70.76
Missouri 63.28 74.30 Wyoming 50.00 65.00Note: eFMAP = enhanced Federal Medical Assistance Percentage; FMAP = Federal Medical Assistance Percentage; Children’s health programs, or CHIPS, are reported under the eFMAP heading. Source: Notice, 79 Fed. Reg. 231 (Dec. 2, 2014), https://www.gpo.gov/fdsys/pkg/FR-2014-12-02/pdf/2014-28398.pdf.
39
Table 3. Current Mandatory and Optional Medicaid Benefits
Mandatory Optional
InpatienthospitalservicesOutpatienthospitalservicesEarlyandperiodicscreening,diagnostic,and
treatmentservicesNursingfacilityservicesHomehealthservicesPhysicianservicesRuralhealthclinicservicesFederallyqualifiedhealthcenterservicesLaboratoryandx-rayservicesFamilyplanningservicesNursemidwifeservicesCertifiedpediatricandfamilynursepractitioner
serviceFreestandingbirthcenterservices(whenlicensedor
recognizedbythestate)TransportationtomedicalcareTobaccocessationcounselingforpregnantwomen
PrescriptiondrugsClinicalservicesPhysicaltherapyOccupationaltherapySpeech,hearing,andlanguagedisorderservicesRespiratorycareservicesPodiatryservicesOptometryservicesDentalservicesanddenturesProstheticsEyeglassesChiropracticservicesPrivatedutynursingservicesPersonalcareHospicecareCasemanagementServicesforindividualsage65orolderinan
institutionformentaldiseaseServicesinanintermediatecarefacilityforindividuals
withintellectualdisabilityStateplanhomeandcommunity-basedservicesSelf-directedpersonalassistanceservicesCommunityfirstchoiceoptionTuberculosis-relatedservicesInpatientpsychiatricservicesforindividualsunderthe
ageof21HealthhomesforenrolleeswithchronicconditionsOtherpractitionerservicesOtherdiagnostic,screening,preventive,and
rehabilitativeservicesOtherservicesapprovedbythesecretary
Source: Medicaid.gov, https://www.medicaid.gov/medicaid-chip-program-information/by-topics/benefits/medicaid -benefits.html.

40
Table 4. States Providing Optional Medicaid Coverage, 2005
Service Numberofstates Service Numberof
states
Chiropractors 27 Diagnosticservices 33
Podiatrists 44 Screeningservices 33
Optometrists 49 Preventiveservices 36
Psychologists 34 Medicalhealthrehabilitationandstabilization 46
Nurseanesthetist 31 Otherrehabilitativeservices 33
Private-dutynurse 27Inpatienthospital,nursingfacility,orcarefacilityservicesinaninstitutionformentaldisease,age65andolder
43
Physician-directedclinicalservices 49 Intermediatecarefacilityservicesformentalretardation 51
Physicaltherapy,home 49 Inpatientpsychiatricservices,underage21 46
Speechandlanguage 48 Personalcareservices 36
Occupationaltherapy,home 49 Targetedcasemanagement 48
Audiologyservices 44 Primarycarecasemanagement 25
Dental 44 Hospice 48
Physicaltherapy 43 Respiratorycareforventilatordependent 16
Occupationaltherapy 40 PACEcareforelderly 22
Therapiesforspeech,hearing,andlanguagedisorders 40 Religioushealthcareinstitution 12
Prescriptiondrugs 51 Transportationservices 49
Dentures 35 Nursingfacility,underage21 50
Prostheticdevices 49 Emergencyhospitalservicesinnon-Medicareparticipatingfacilities 35
Eyeglasses 43 Criticalaccesshospitalservices 25Note: PACE = Program of All-Inclusive Care for the Elderly. Source: Centers for Medicare and Medicaid Services, Medicaid at a Glance 2005: A Medicaid Information Source (2005), http://downloads.cms.gov/cmsgov/archived-downloads/MedicaidGenInfo/downloads/MedicaidAtAGlance 2005.pdf.
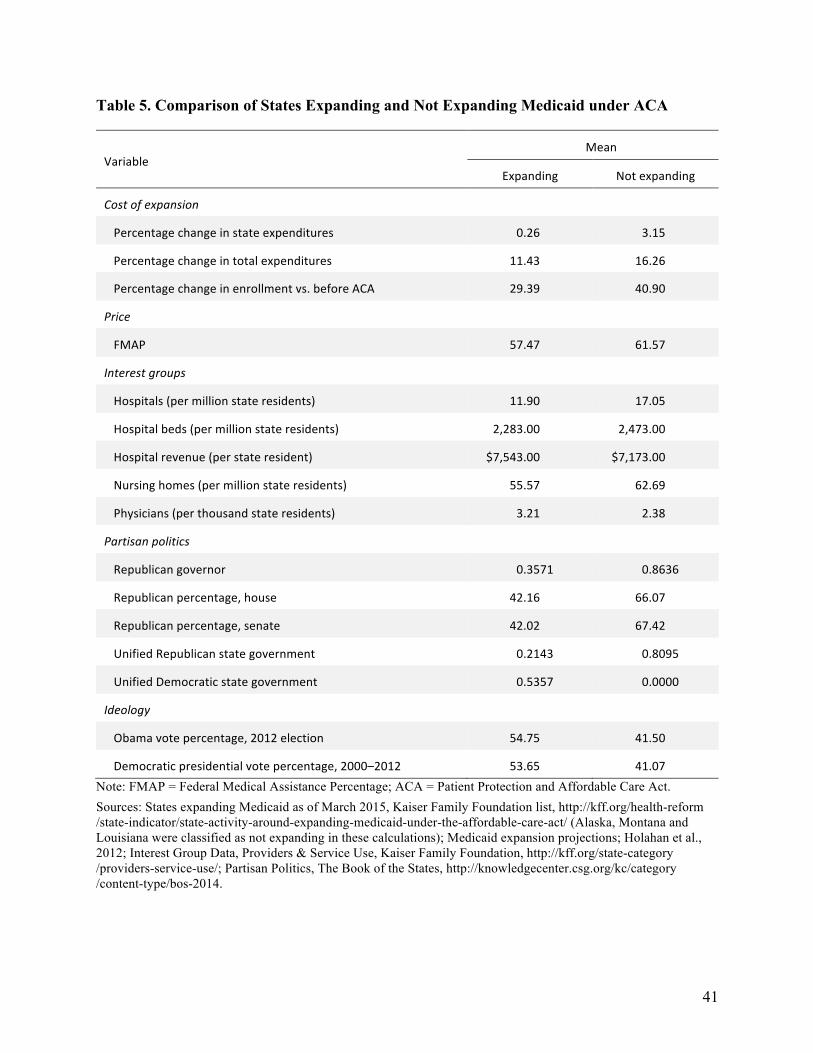
41
Table 5. Comparison of States Expanding and Not Expanding Medicaid under ACA
VariableMean
Expanding Notexpanding
Costofexpansion
Percentagechangeinstateexpenditures 0.26 3.15
Percentagechangeintotalexpenditures 11.43 16.26
Percentagechangeinenrollmentvs.beforeACA 29.39 40.90
Price
FMAP 57.47 61.57
Interestgroups
Hospitals(permillionstateresidents) 11.90 17.05
Hospitalbeds(permillionstateresidents) 2,283.00 2,473.00
Hospitalrevenue(perstateresident) $7,543.00 $7,173.00
Nursinghomes(permillionstateresidents) 55.57 62.69
Physicians(perthousandstateresidents) 3.21 2.38
Partisanpolitics
Republicangovernor 0.3571 0.8636
Republicanpercentage,house 42.16 66.07
Republicanpercentage,senate 42.02 67.42
UnifiedRepublicanstategovernment 0.2143 0.8095
UnifiedDemocraticstategovernment 0.5357 0.0000
Ideology
Obamavotepercentage,2012election 54.75 41.50
Democraticpresidentialvotepercentage,2000–2012 53.65 41.07Note: FMAP = Federal Medical Assistance Percentage; ACA = Patient Protection and Affordable Care Act.Sources: States expanding Medicaid as of March 2015, Kaiser Family Foundation list, http://kff.org/health-reform /state-indicator/state-activity-around-expanding-medicaid-under-the-affordable-care-act/ (Alaska, Montana and Louisiana were classified as not expanding in these calculations); Medicaid expansion projections; Holahan et al., 2012; Interest Group Data, Providers & Service Use, Kaiser Family Foundation, http://kff.org/state-category /providers-service-use/; Partisan Politics, The Book of the States, http://knowledgecenter.csg.org/kc/category /content-type/bos-2014.