addendum 3 final design report environmental components ... · final addendum 3 final design report...
TRANSCRIPT
FINAL
Addendum 3 Final Design Report Environmental Components for Globeville Landing Outfall Project
Vasquez Boulevard/Interstate 70 Site, Operable Unit #2 Removal Action
Prepared for:
City and County of Denver Environmental Quality Division 200 West 14th Ave, Suite 310 Denver, Colorado 80204
Prepared by:
Engineering Management Support, Inc.
25923 Gateway Drive
Golden, CO 80401
April 12, 2018
FINAL
TABLE OF CONTENTS
1 INTRODUCTION ............................................................................................................ 1
1.1 Background .................................................................................................................. 1
1.2 Addendum Organization.............................................................................................. 2
2 COMPLIANCE WITH DESIGN OBJECTIVE ................................................................ 3
2.1 Hydraulic Pressures on Base of Liner ......................................................................... 4
2.2 Groundwater System Recovery Time.......................................................................... 5
2.3 Effectiveness of Check Dam ....................................................................................... 5
3 PROTECTION OF HUMAN HEALTH AND ENVIRONMENT ................................... 6
3.1 Groundwater Potentiometric Surface and Flow Directions......................................... 6
3.2 Groundwater Flux Through Fill in Coliseum Parking Lot .......................................... 7
3.3 Water Quality Impacts................................................................................................. 8
4 CONCLUSIONS.............................................................................................................. 10
LIST OF TABLES
Table 1 – Simulated Groundwater Flow From Fill in Coliseum Parking Lot
LIST OF FIGURES
Figure 1 – Sheet Piling Alignment
Figure 2 – Dissolved Lead in Groundwater
Figure 3 – Potentially Dissolved Arsenic in Groundwater
LIST OF APPENDICES
Appendix A – Itasca-Denver Technical Memorandum – Groundwater Flow Modeling Update
and Re-Evaluation of Post-Construction Conditions, Globeville Landing
Outfall Project
Addendum 3 to Final Design Report
April 12, 2018 Page i
FINAL
LIST OF ACRONYMS
CDPHE Colorado Department of Public Health and Environment
EMSI Engineering Management Support, Inc.
FOS Factor of Safety
Ft feet
GLO Globeville Landing Outfall
gpm gallons per minute
Itasca Itasca-Denver, Inc.
OU-2 Operable Unit 2
Respondent City and County of Denver
TM Technical Memorandum
USEPA United States Environmental Protection Agency
Addendum 3 to Final Design Report
April 12, 2018 Page ii
1
FINAL
INTRODUCTION
1.1 Background
Final Design of the “environmental components” of the Globeville Landing Outfall (GLO) Project that was presented in the Final Design Report, Environmental
Components for Globeville Landing Outfall Project (EMSI et al, 2016a) relied in part on
geologic and hydrogeologic conditions that were known at the time the designs were
prepared. An understanding of these conditions was based on background information
reported in Appendix B (Historical Environmental Data) of the Removal Action Work
Plan (EMSI, 2015a), on hydrogeologic and waste characteristic information reported in
the Data Summary Report (EMSI, 2015b) and Addendum 1 to the Data Summary Report
(EMSI, 2016b), and on additional aquifer testing conducted on saturated material beneath
the Coliseum Parking Lot and Globeville Landing Park , as presented in Addendum 2 to
the Final Design Report (EMSI, 2016c).
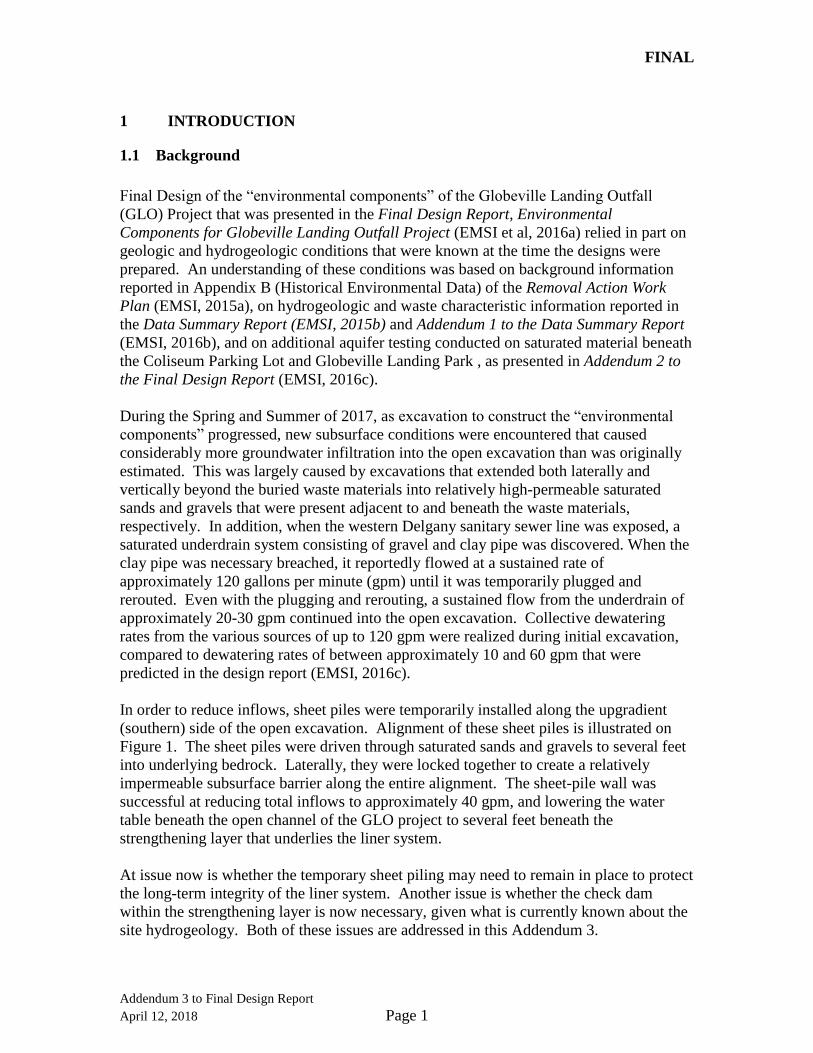
During the Spring and Summer of 2017, as excavation to construct the “environmental
components” progressed, new subsurface conditions were encountered that caused
considerably more groundwater infiltration into the open excavation than was originally
estimated. This was largely caused by excavations that extended both laterally and
vertically beyond the buried waste materials into relatively high-permeable saturated
sands and gravels that were present adjacent to and beneath the waste materials,
respectively. In addition, when the western Delgany sanitary sewer line was exposed, a
saturated underdrain system consisting of gravel and clay pipe was discovered. When the
clay pipe was necessary breached, it reportedly flowed at a sustained rate of
approximately 120 gallons per minute (gpm) until it was temporarily plugged and
rerouted. Even with the plugging and rerouting, a sustained flow from the underdrain of
approximately 20-30 gpm continued into the open excavation. Collective dewatering
rates from the various sources of up to 120 gpm were realized during initial excavation,
compared to dewatering rates of between approximately 10 and 60 gpm that were
predicted in the design report (EMSI, 2016c).
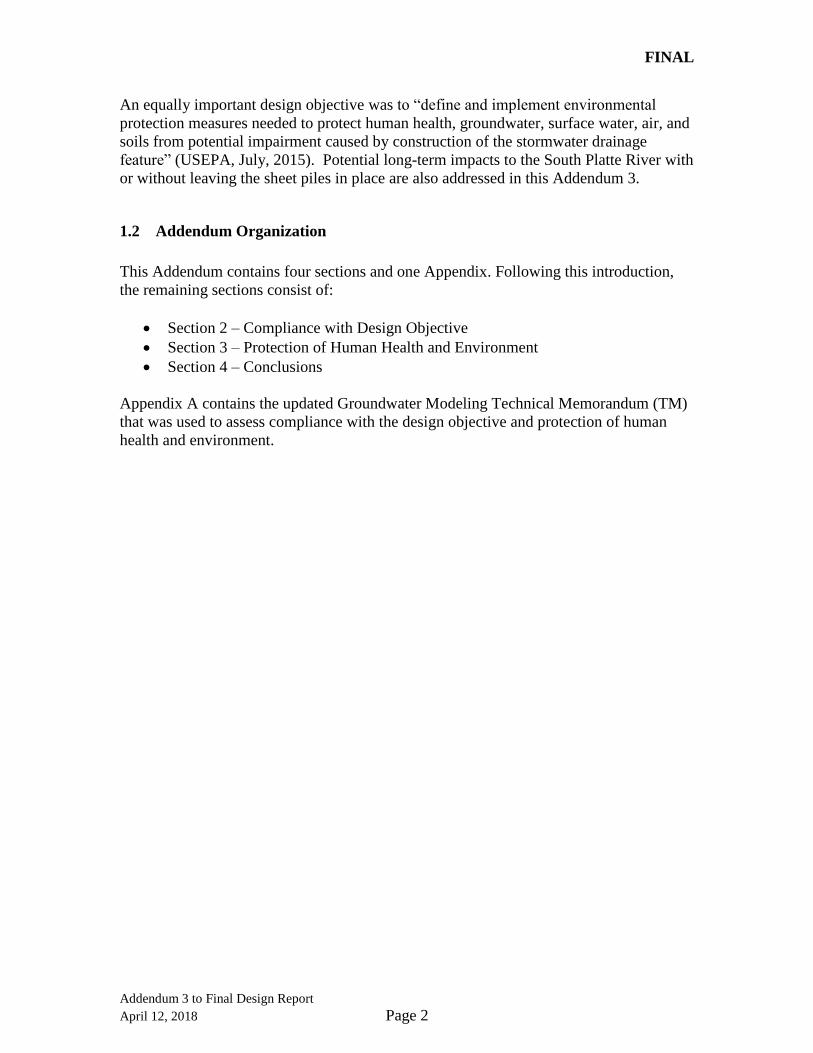
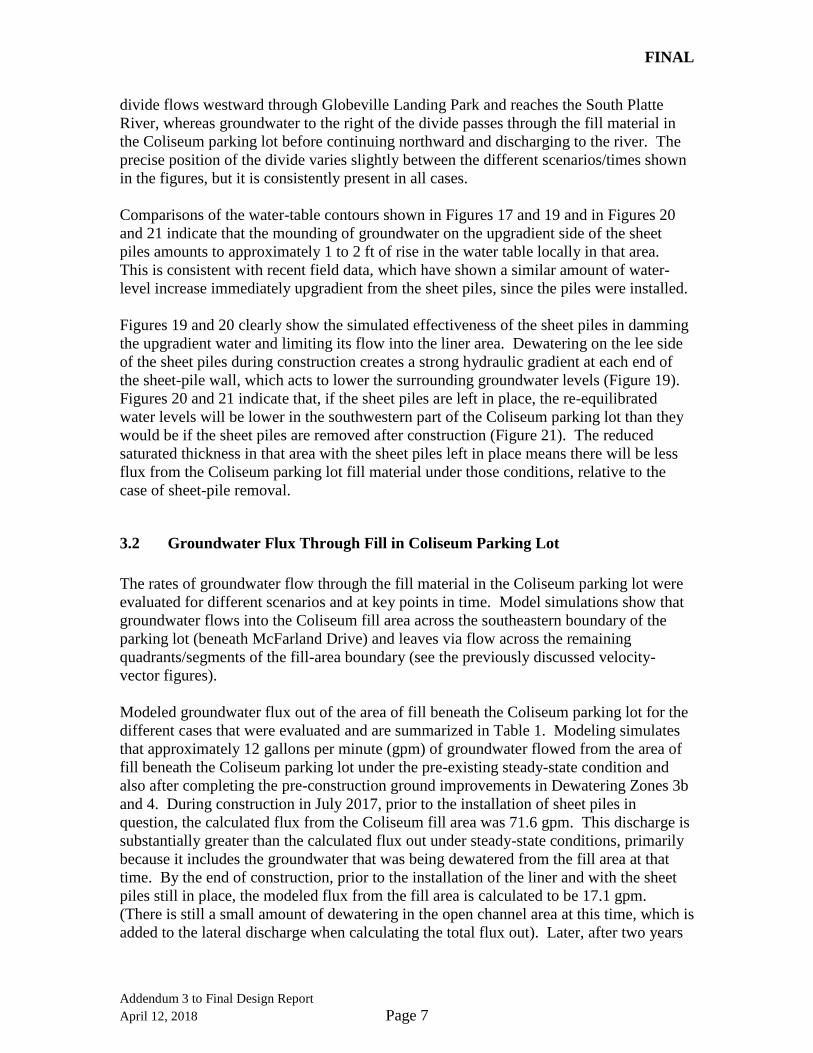
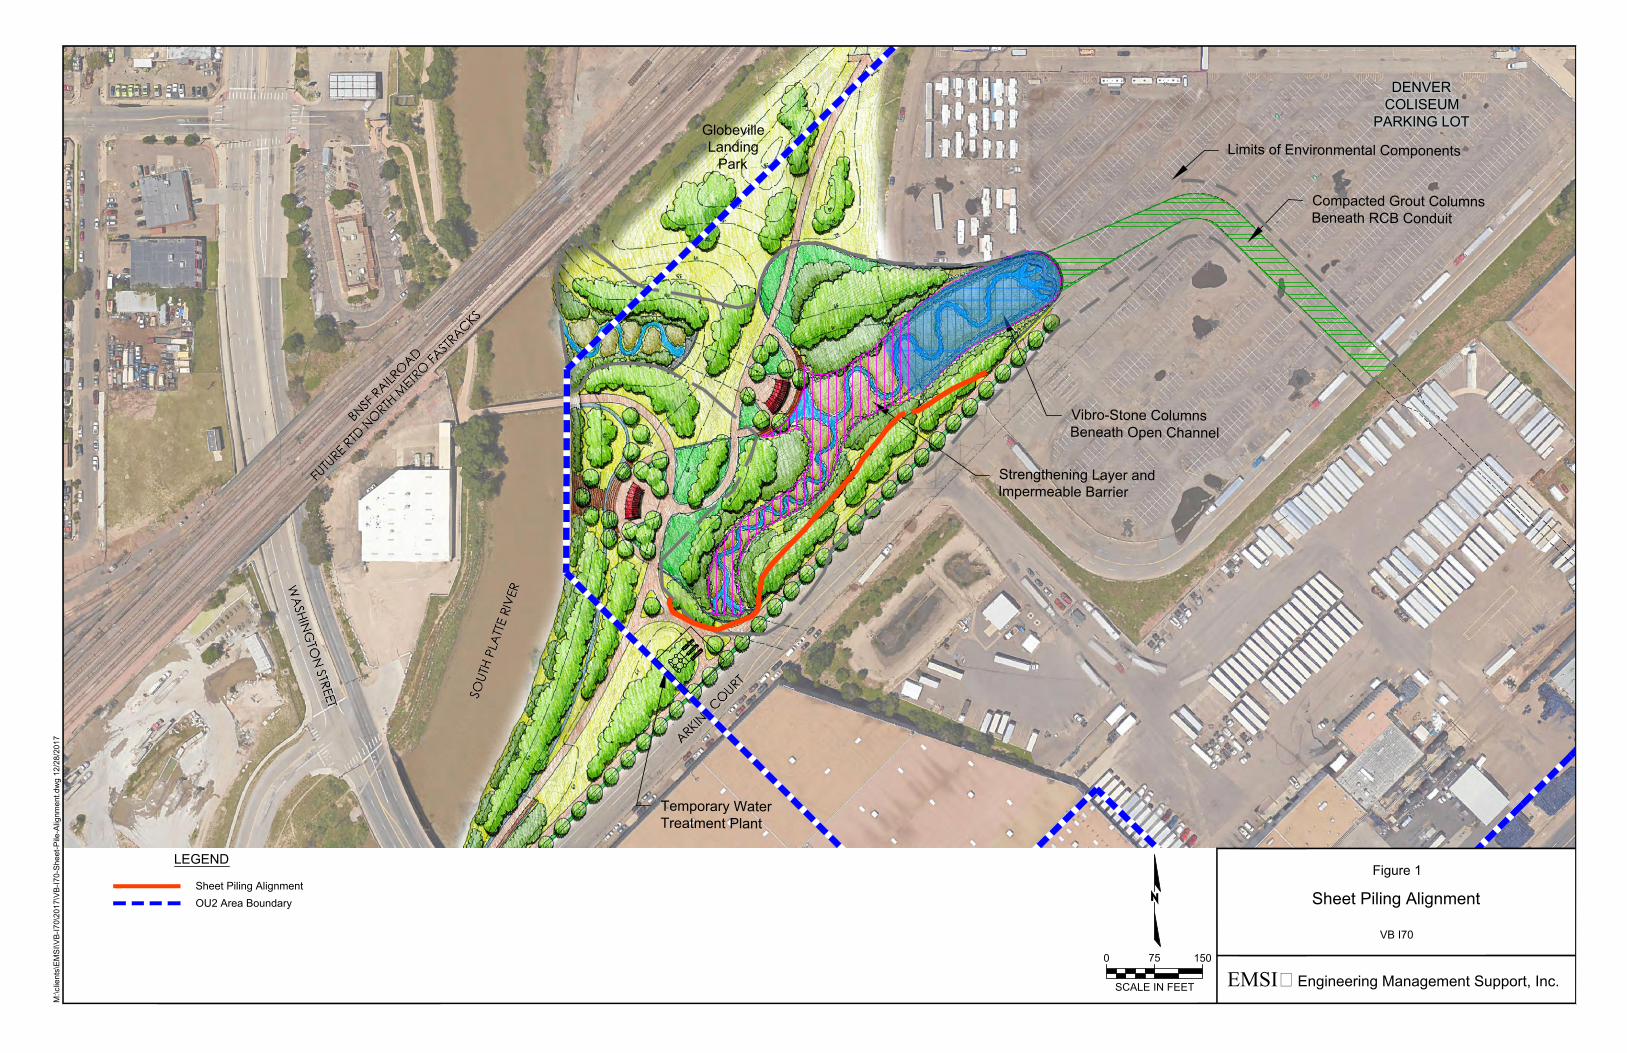
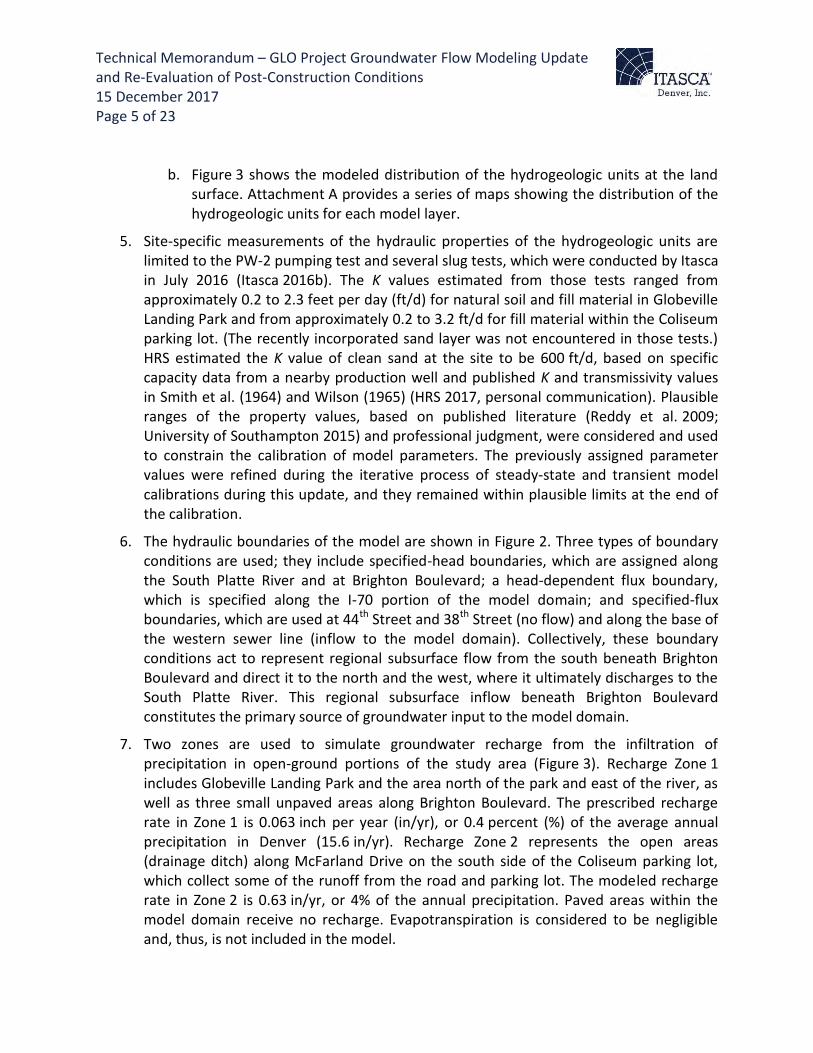
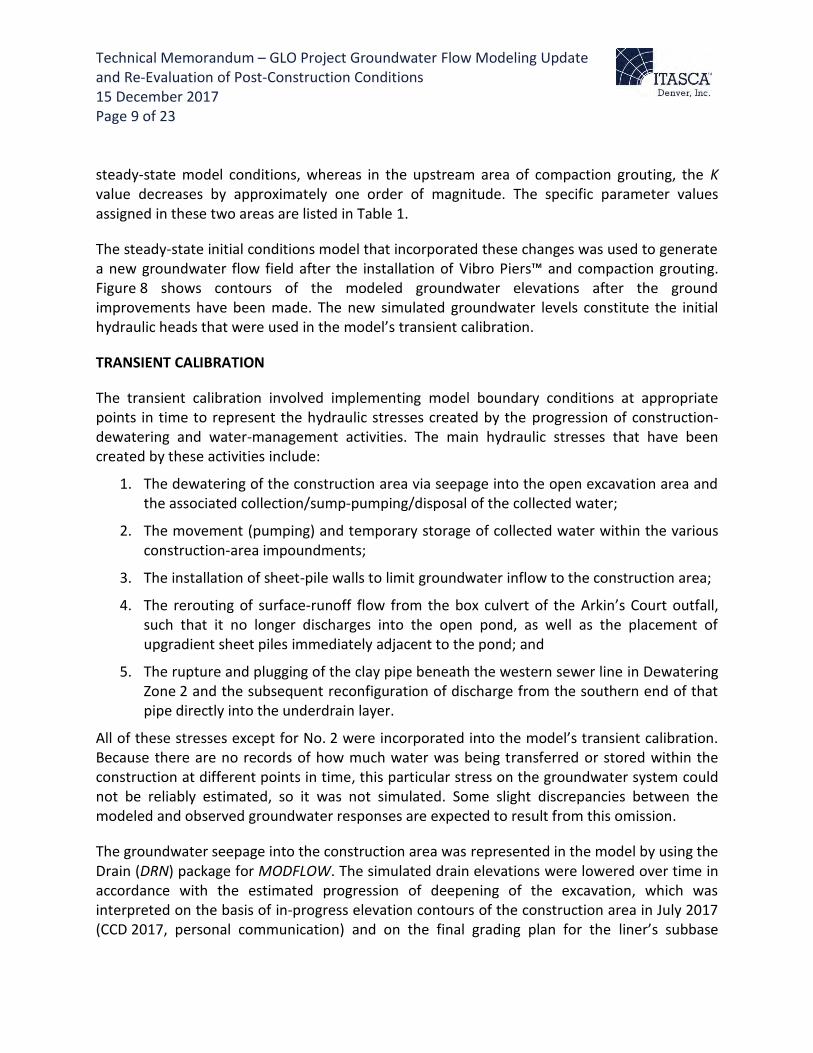
In order to reduce inflows, sheet piles were temporarily installed along the upgradient
(southern) side of the open excavation. Alignment of these sheet piles is illustrated on
Figure 1. The sheet piles were driven through saturated sands and gravels to several feet
into underlying bedrock. Laterally, they were locked together to create a relatively
impermeable subsurface barrier along the entire alignment. The sheet-pile wall was
successful at reducing total inflows to approximately 40 gpm, and lowering the water
table beneath the open channel of the GLO project to several feet beneath the
strengthening layer that underlies the liner system.
At issue now is whether the temporary sheet piling may need to remain in place to protect
the long-term integrity of the liner system. Another issue is whether the check dam
within the strengthening layer is now necessary, given what is currently known about the
site hydrogeology. Both of these issues are addressed in this Addendum 3.
Addendum 3 to Final Design Report
April 12, 2018 Page 1
FINAL
An equally important design objective was to “define and implement environmental
protection measures needed to protect human health, groundwater, surface water, air, and
soils from potential impairment caused by construction of the stormwater drainage
feature” (USEPA, July, 2015). Potential long-term impacts to the South Platte River with
or without leaving the sheet piles in place are also addressed in this Addendum 3.
1.2 Addendum Organization
This Addendum contains four sections and one Appendix. Following this introduction,
the remaining sections consist of:
Section 2 – Compliance with Design Objective
Section 3 – Protection of Human Health and Environment
Section 4 – Conclusions
Appendix A contains the updated Groundwater Modeling Technical Memorandum (TM)
that was used to assess compliance with the design objective and protection of human
health and environment.
Addendum 3 to Final Design Report
April 12, 2018 Page 2
2
FINAL
COMPLIANCE WITH DESIGN OBJECTIVE
One of the design objectives of the liner system consists of maintaining a factor of safety
(FOS) of sufficient magnitude that would assure the integrity of the liner system beneath
the open channel portion of the GLO project. This FOS is to minimize the potential for
buoyancy of the liner system from upward hydrostatic pressure caused by groundwater
levels beneath the liner. Specifically, the liner design included an FOS of 150% as the
lower limit. This FOS translates to an allowance of up to approximately 3.8 feet of
positive hydraulic head (upward pressure) against the base of the liner. A positive head
less than that would be acceptable, whereas a positive head greater than that would not.
As part of the Removal Action design team, Engineering Management Support, Inc.,
(EMSI) retained Itasca Denver, Inc. (Itasca) to update their 3-D flow numerical model
with new site conditions that became available during construction of the GLO project.
As discussed in the previous section, new geologic, hydrogeologic, potentiometric, and
seepage flow data became available while excavating through the Coliseum parking lot,
Globeville Landing Park, and beneath the Delgany sanitary sewers. Additional details of
these new conditions, and how they were factored into the new model setup and
calibrations, are presented in a Technical Memorandum (TM) in Appendix A.
Following successful recalibration of the numerical model, predictive simulations were
run that addressed the following design-related questions.
1. What are the anticipated upward hydraulic pressures on the base of the liner
following construction when dewatering ceases?
2. Will those pressures significantly reduce the FOS for buoyancy that was
incorporated into the liner design?
3. How will the anticipated hydraulic pressures change if the sheet piles shown on
Figure 1 are left in place following construction?
4. How long will it take the groundwater system to recover and re-equilibrate after
dewatering and construction activities cease?
5. Will the check dam within the strengthening layer below the liner serve its
intended purpose of limiting preferential flow with sheet piles left in place?
Three model scenarios were developed to address these questions, consisting of:
• Scenario A (Base Case) – The final design of the liner system, as previously
approved, including the check dam in the strengthening layer and without any
remaining sheet piles (i.e., assuming all of the sheet piles are removed at the end
of construction);
Addendum 3 to Final Design Report
April 12, 2018 Page 3
FINAL
• Scenario B – The final design of the liner system, as previously approved, but
without the check dam in the strengthening layer and with all of the currently
installed sheet piles removed at the end of construction; and
• Scenario C – The final design of the liner system, as previously approved, but
without the check dam in the strengthening layer and with the sheet piles
remaining in place.
Results from the modeling scenarios are discussed on pages 14 and 15 of the TM in
Appendix A, and are summarized below.
2.1 Hydraulic Pressures on Base of Liner
A section line along the center of the liner was used to evaluate the hydraulic pressures
on the base of the liner. The centerline was assigned longitudinal coordinates (in feet),
with the zero positioned at the lowest point of the liner, where it discharges into the
Dewatering Zone 2 drop structure, and negative numbers to the south and positive
numbers to the northeast (Appendix A - Figure 13).
Appendix A - Figure 14 shows the elevation of the base of the liner along the centerline
section, together with the simulated hydraulic heads for different scenarios, generally at
two years after the end of construction. (Note that one of the scenarios shown in Figure
14, “Prior to Liner Placement,” depicts the hydraulic heads during construction instead of
two years after construction ends; this particular result demonstrates that the excavation
was sufficiently dewatered in the model simulation to allow construction of the
strengthening layer and installation of the liner to proceed). The calibrated steady-state
model hydraulic heads along the centerline section are also shown in the figure for
reference. It is apparent in Figure 14 that the simulated steady- state water levels are a
maximum of approximately 5.0 ft above the base of the liner at a coordinate of +220 ft in
Dewatering Zone 3b. Thus, the modeled, pre-existing steady- state water levels along the
northernmost 200 ft of the liner would correspond to a FOS of approximately 114%; less
than the minimum design FOS of 150%.
Appendix A – Figure 14 also shows that, for Scenario A (with the check dam and
without sheet piles), the modeled water levels after two years of recovery reach a
maximum of approximately 4.4 ft above the base of the liner in Dewatering Zone 3b.
Meanwhile, the simulated water levels after two years of recovery in Scenario B (without
the check dam and without sheet piles) are generally slightly less than in Scenario A
along the length of the liner, reaching a maximum of approximately 4.0 ft above the base
of the liner in Dewatering Zone 3b. Lastly, for Scenario C (without the check dam and
with the sheet piles left in place), the modeled water levels are between approximately
2.1 to 4.1 ft below the base of the liner over its entire length. These results indicate that
for Scenario B, the designed FOS could be reduced to approximately 140% along the
northernmost segment of the liner. The presence of the check dam slightly further
reduces the FOS in that area to approximately 130% (Scenario A). For Scenario C, the
results indicate the FOS would increase (tending to infinity) if the sheet piles are left in
Addendum 3 to Final Design Report
April 12, 2018 Page 4
FINAL
place, because the simulated, re-equilibrated water levels remain below the base of the
liner along its entire length.
2.2 Groundwater System Recovery Time
Appendix A - Figure 15 illustrates the simulated change in groundwater levels over time
during the post- construction recovery period at three locations along the centerline of the
liner and for two different scenarios involving the sheet piles (Scenarios B and C). The
three locations (at coordinates of -100 ft, +120 ft, and +370 ft) are shown in Appendix A
- Figure 14. The modeled results indicate that most of the groundwater recovery beneath
the liner occurs within the first six months after the end of construction. Thereafter, the
simulated water levels asymptotically approach steady values. By two years after the end
of construction, the modeled groundwater system has effectively reached re-equilibrated
conditions.
2.3 Effectiveness of Check Dam
Itasca carefully examined the simulated groundwater flow paths in the modeled layer
containing the liner/strengthening layer/check dam for the two scenarios comparing the
effects of the check dam (Scenarios A and B). The examination revealed essentially no
difference in the patterns of groundwater flow at a distance of approximately 60 ft or
greater from the check dam (the width of two model grid cells). The only differences
were in the immediate vicinity of the check dam; the flow patterns below the liner in all
other areas were effectively the same in both cases. This finding is explained by the
controlling higher-permeability sand-layer unit that is modeled beneath and adjacent to
certain parts the constructed liner system. The relative ease of groundwater flow in the
sand-layer unit reduces the tendency for flow to be focused within the strengthening layer
and, therefore, also reduces the effectiveness of the check dam in limiting flow along the
axis of the liner. The simulated low effectiveness of the check dam indicates that it may
now be irrelevant and unnecessary, if the sheet piles are removed. If sheep piles are not
removed (Scenario 3), the modeled water levels will always be below the strengthening
layer, thereby negating the need for the check dam entirely.
Addendum 3 to Final Design Report
April 12, 2018 Page 5

3
FINAL
PROTECTION OF HUMAN HEALTH AND ENVIRONMENT
Additional modeling was performed to assess the following environmental-related
questions.
1. How will the groundwater flow paths change relative to the original steady-state
flow field, following construction of GLO project with and without the sheet piles
left in place?
2. How will the flux of groundwater through fill material in the Coliseum parking lot
area change relative to the original steady-state condition with and without the
sheet piles left in place?
The same three model scenarios discussed in the previous section were applied to address
these questions. Results are discussed in pages 15 through 18 of the TM in Appendix A,
and are summarized below.
A third question, not related to flow modeling, was considered: Might loading of lead or
arsenic in groundwater from the GLO site releasing to the South Platte River be
significant? Response to this question involved review of historical lead and arsenic
groundwater data from the GLO site relative to pertinent stream or drinking water
standards.
Responses to all three of these questions are addressed below:
3.1 Groundwater Potentiometric Surface and Flow Directions
The groundwater potentiometric surface and flow directions are illustrated in a series of
figures showing contours of the simulated water-table elevation and groundwater flow-
velocity vectors in the model layers of interest. Reference is made to Appendix A – Figures 16 through 21 and discussed below.
Each of the figures listed above consists of a plan view of the model grid with
superimposed groundwater velocity vectors (scaled logarithmically to simplify the
display) and water-table elevation contours, along with two perpendicular vertical cross
sections through the model grid, one along model row 33 and the other along model
column 36. The two cross sections intersect near the boundary between Dewatering
Zones 3a and 3b along the southwestern edge of the Coliseum parking lot. The extent of
the open-channel liner and the limits of fill material within the Coliseum parking lot are
included on the figures for reference. Figures 16 through 18 pertain to the model
calibration simulations, whereas Figures 19 through 21 represent predictive simulations
of potential future conditions.
Inspection of Figures 16 through 21 reveals a subtle divide in the groundwater flow
direction, which is roughly aligned with model column 36; groundwater to the left of the
Addendum 3 to Final Design Report
April 12, 2018 Page 6
FINAL
divide flows westward through Globeville Landing Park and reaches the South Platte
River, whereas groundwater to the right of the divide passes through the fill material in
the Coliseum parking lot before continuing northward and discharging to the river. The
precise position of the divide varies slightly between the different scenarios/times shown
in the figures, but it is consistently present in all cases.
Comparisons of the water-table contours shown in Figures 17 and 19 and in Figures 20
and 21 indicate that the mounding of groundwater on the upgradient side of the sheet
piles amounts to approximately 1 to 2 ft of rise in the water table locally in that area.
This is consistent with recent field data, which have shown a similar amount of water-
level increase immediately upgradient from the sheet piles, since the piles were installed.
Figures 19 and 20 clearly show the simulated effectiveness of the sheet piles in damming
the upgradient water and limiting its flow into the liner area. Dewatering on the lee side
of the sheet piles during construction creates a strong hydraulic gradient at each end of
the sheet-pile wall, which acts to lower the surrounding groundwater levels (Figure 19).
Figures 20 and 21 indicate that, if the sheet piles are left in place, the re-equilibrated
water levels will be lower in the southwestern part of the Coliseum parking lot than they
would be if the sheet piles are removed after construction (Figure 21). The reduced
saturated thickness in that area with the sheet piles left in place means there will be less
flux from the Coliseum parking lot fill material under those conditions, relative to the
case of sheet-pile removal.
3.2 Groundwater Flux Through Fill in Coliseum Parking Lot
The rates of groundwater flow through the fill material in the Coliseum parking lot were
evaluated for different scenarios and at key points in time. Model simulations show that
groundwater flows into the Coliseum fill area across the southeastern boundary of the
parking lot (beneath McFarland Drive) and leaves via flow across the remaining
quadrants/segments of the fill-area boundary (see the previously discussed velocity-
vector figures).
Modeled groundwater flux out of the area of fill beneath the Coliseum parking lot for the
different cases that were evaluated and are summarized in Table 1. Modeling simulates
that approximately 12 gallons per minute (gpm) of groundwater flowed from the area of
fill beneath the Coliseum parking lot under the pre-existing steady-state condition and
also after completing the pre-construction ground improvements in Dewatering Zones 3b
and 4. During construction in July 2017, prior to the installation of sheet piles in
question, the calculated flux from the Coliseum fill area was 71.6 gpm. This discharge is
substantially greater than the calculated flux out under steady-state conditions, primarily
because it includes the groundwater that was being dewatered from the fill area at that
time. By the end of construction, prior to the installation of the liner and with the sheet
piles still in place, the modeled flux from the fill area is calculated to be 17.1 gpm.
(There is still a small amount of dewatering in the open channel area at this time, which is
added to the lateral discharge when calculating the total flux out). Later, after two years
Addendum 3 to Final Design Report
April 12, 2018 Page 7
FINAL
of post-construction recovery, the re-equilibrated conditions generate a flux of 18.1 gpm
if the sheet piles are left in place, or 23.2 gpm if the sheet piles are removed.
These model findings indicate that the groundwater flux from the fill beneath the
Coliseum parking lot could increase following completion of the GLO project, regardless
of whether sheet piles are left in place. Part of this increase is due to the change in
recharge conditions associated with the northern segment of the clay pipe beneath the
Delgany sewer line. Relative to the pre-existing steady-state condition, the simulated
increase in discharge from the fill area is approximately 6 gpm if the sheet piles are left in
place or approximately 11 gpm if the sheet piles are removed. For comparison, the
predicted incremental increases in flux from the Coliseum parking lot correspond to
approximately 2% to 4% (respectively) of the simulated net groundwater discharge to the
South Platter River within the model domain for the Calibrated Steady-State Model.
These differences are considered negligible.
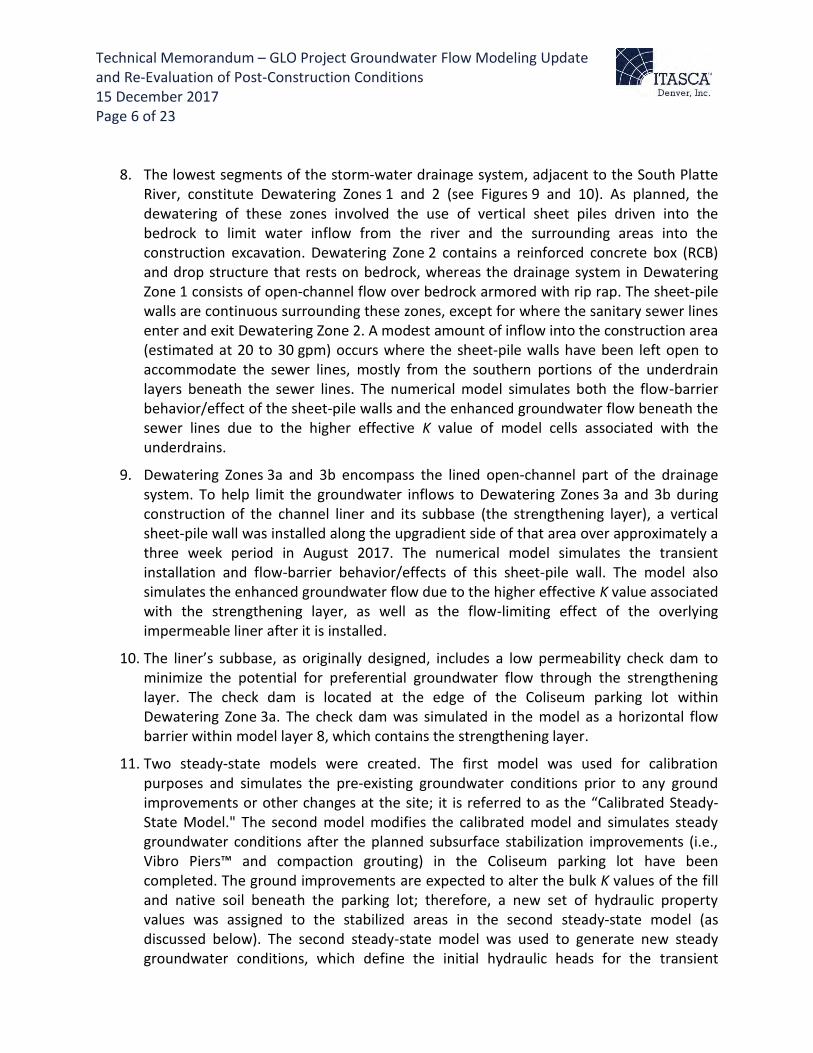
3.3 Water Quality Impacts
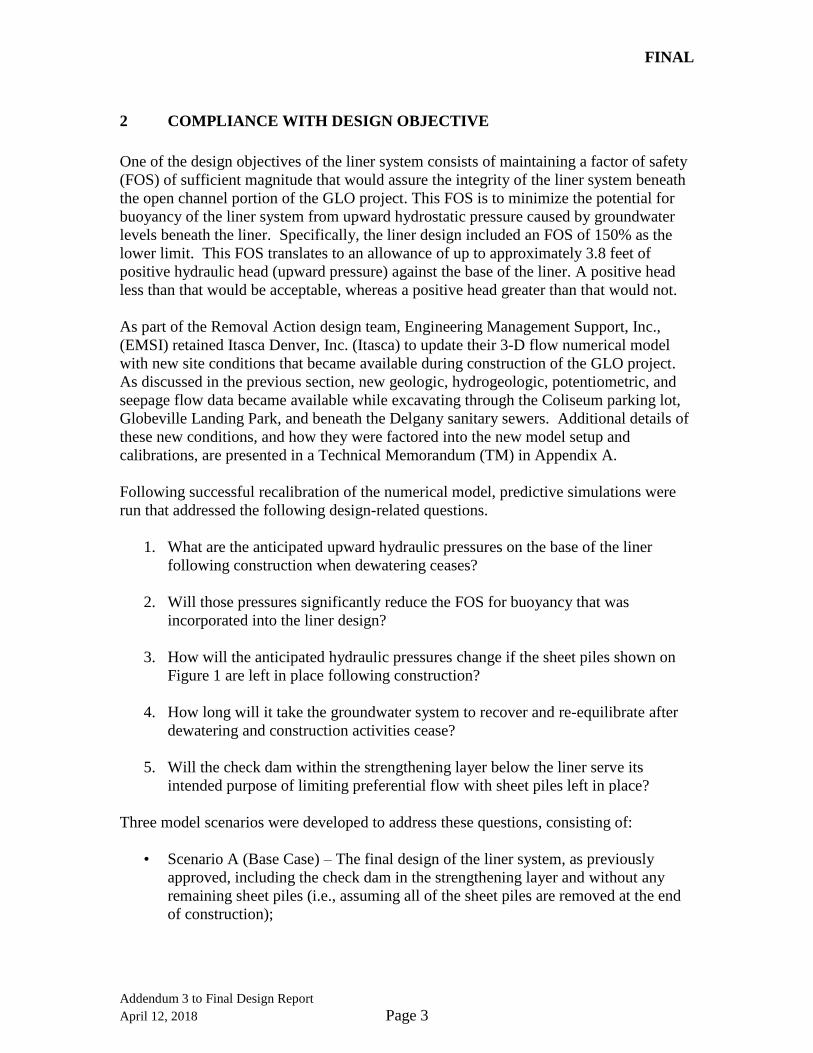
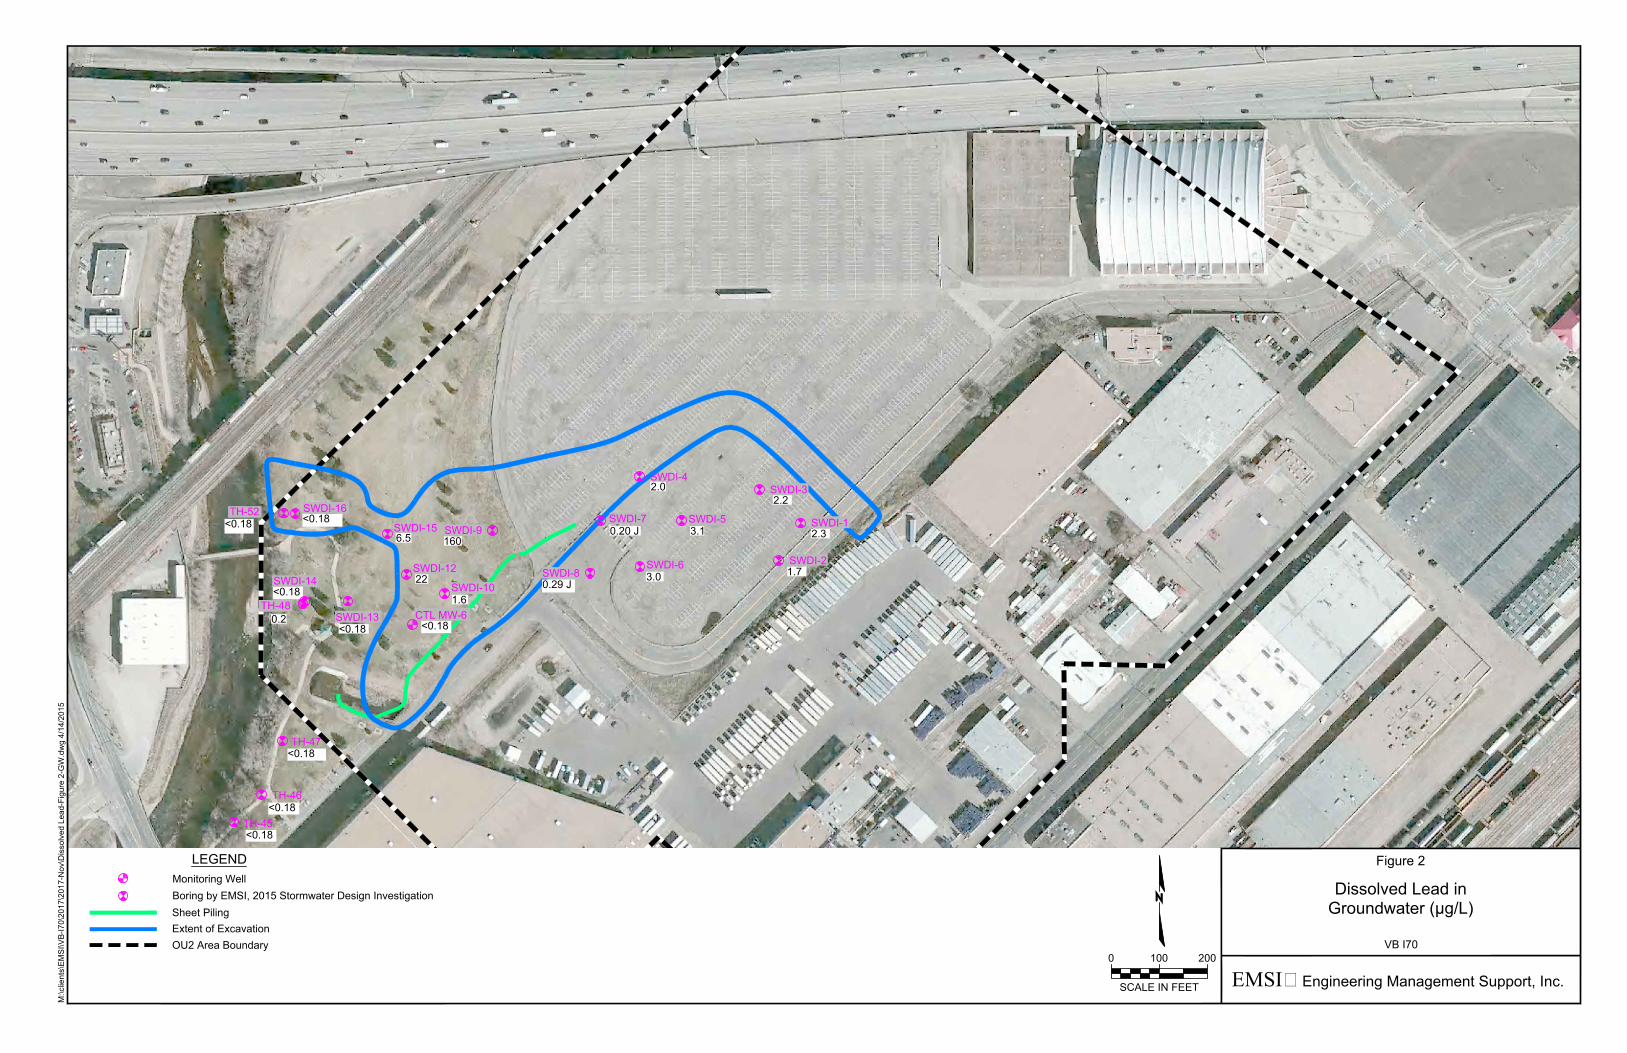
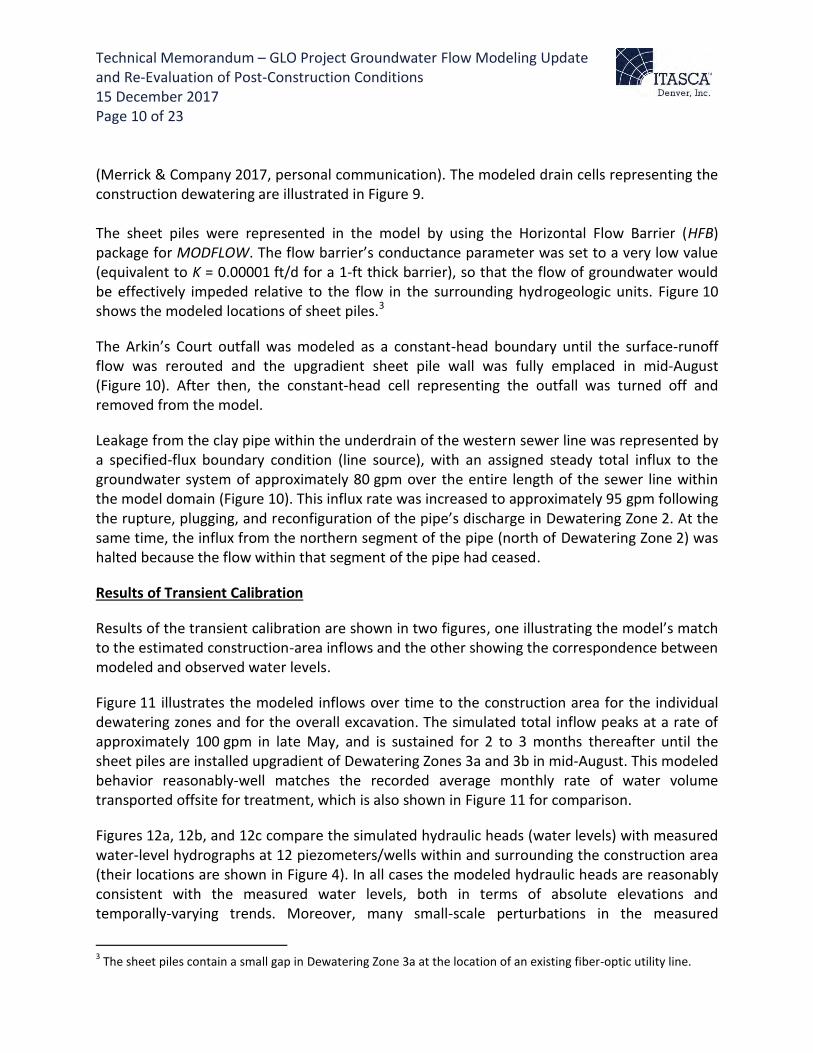
Compounds of concern at the GLO site have historically been limited to metals – specifically lead and arsenic. For this reason, historical concentrations of lead and
arsenic in groundwater beneath the GLO site were compared to relevant South Platte
River in-stream standards and/or drinking water standards. For lead, the only relevant
standard for which historical groundwater data are available is the USEPA action level
for drinking water of 15 ug/L, which is the dissolved fraction. There is no in-stream
standard for dissolved-phase lead. While a partially-dissolved in-stream standard is
available for lead and partially-dissolved lead data are available in the GLO database,
application of this standard to groundwater that has not been filtered prior to preservation
is not appropriate because the groundwater that will discharge to surface water will have
been naturally filtered by fine-grained soils, the natural pH of groundwater is near-
neutral, and the oxygen-reduction potential of groundwater beneath the Globeville
Landing Park is approximately zero, implying neither oxidative or reducing potential.
Collectively, these conditions will favor 1) elimination of the suspended fraction of lead
as groundwater migrates toward the South Platte River, and 2) minimal conversion of
suspended-phase to dissolved-phase lead into groundwater. Thus, only the dissolved-
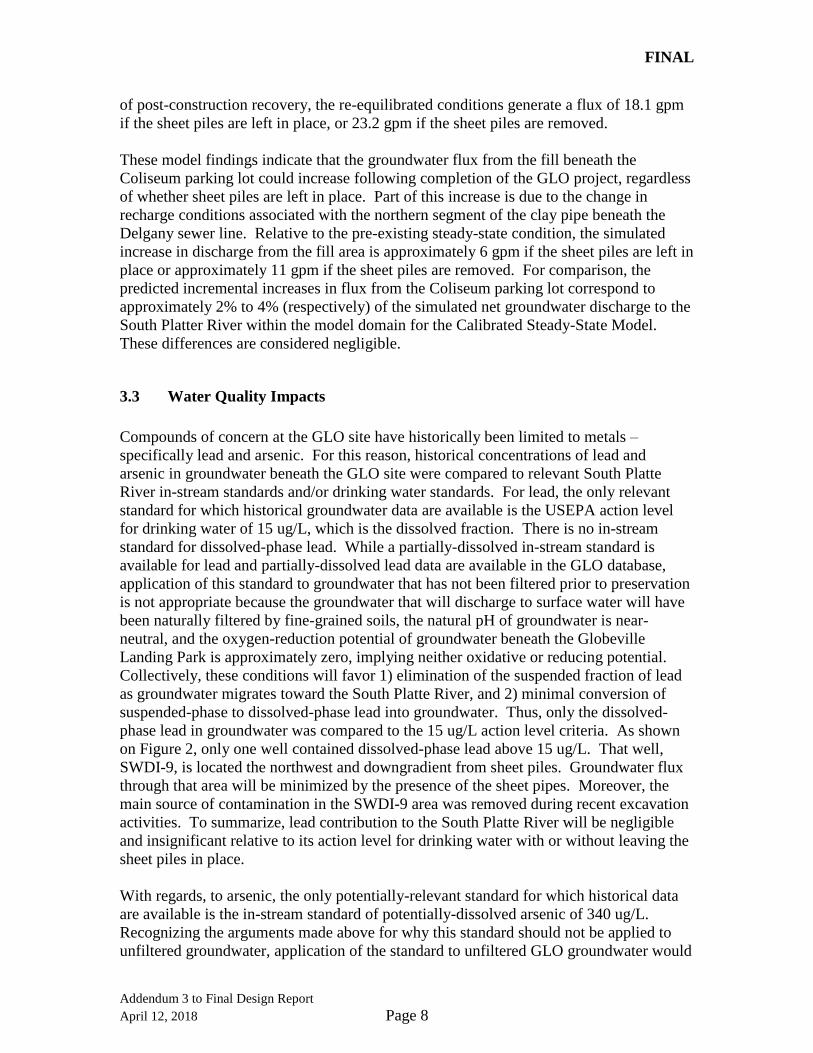
phase lead in groundwater was compared to the 15 ug/L action level criteria. As shown
on Figure 2, only one well contained dissolved-phase lead above 15 ug/L. That well,
SWDI-9, is located the northwest and downgradient from sheet piles. Groundwater flux
through that area will be minimized by the presence of the sheet pipes. Moreover, the
main source of contamination in the SWDI-9 area was removed during recent excavation
activities. To summarize, lead contribution to the South Platte River will be negligible
and insignificant relative to its action level for drinking water with or without leaving the
sheet piles in place.
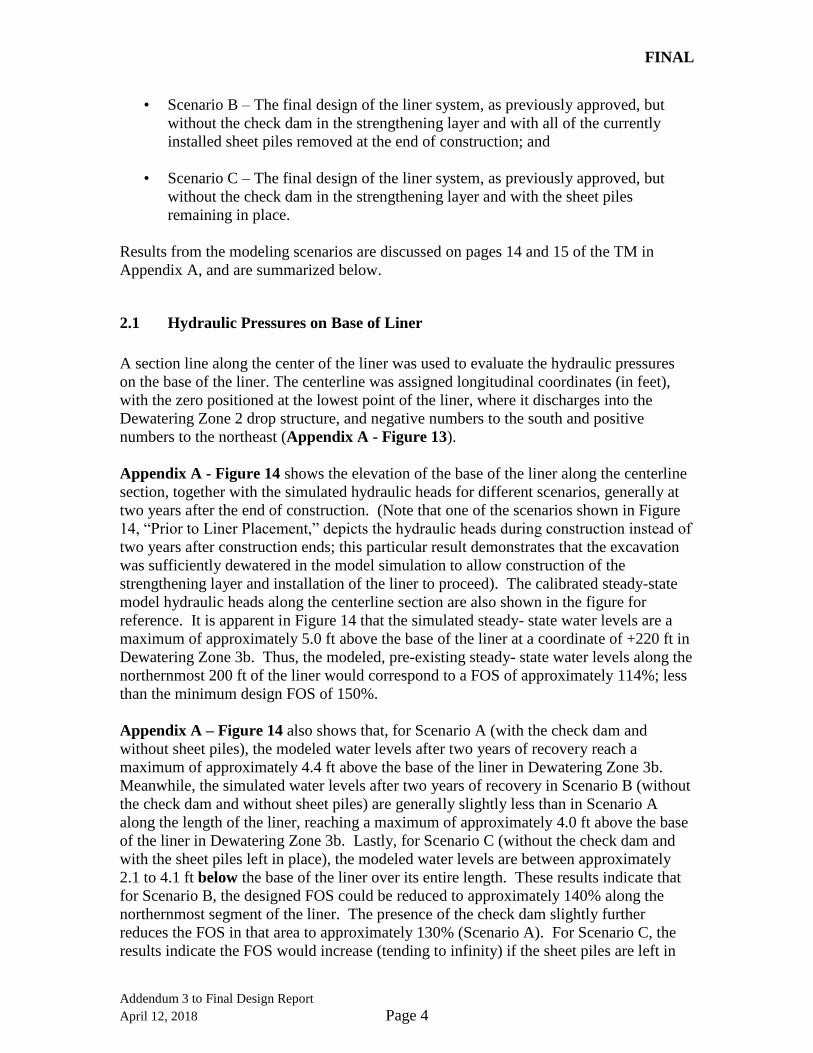
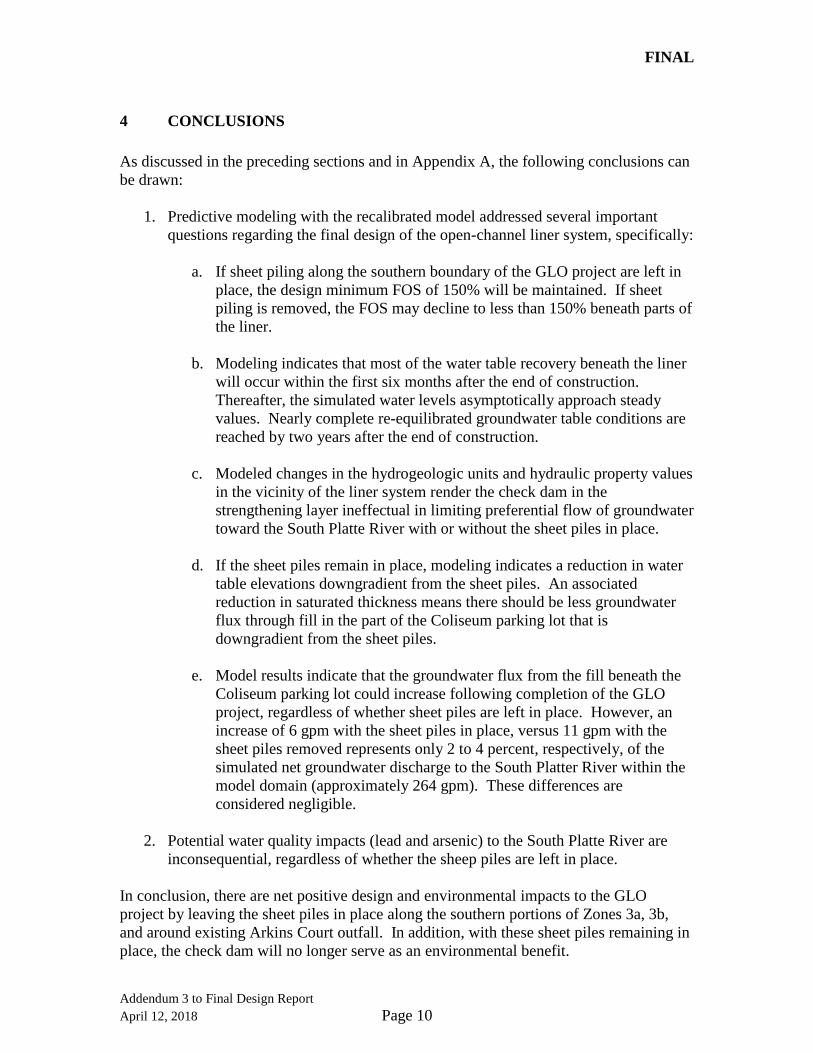
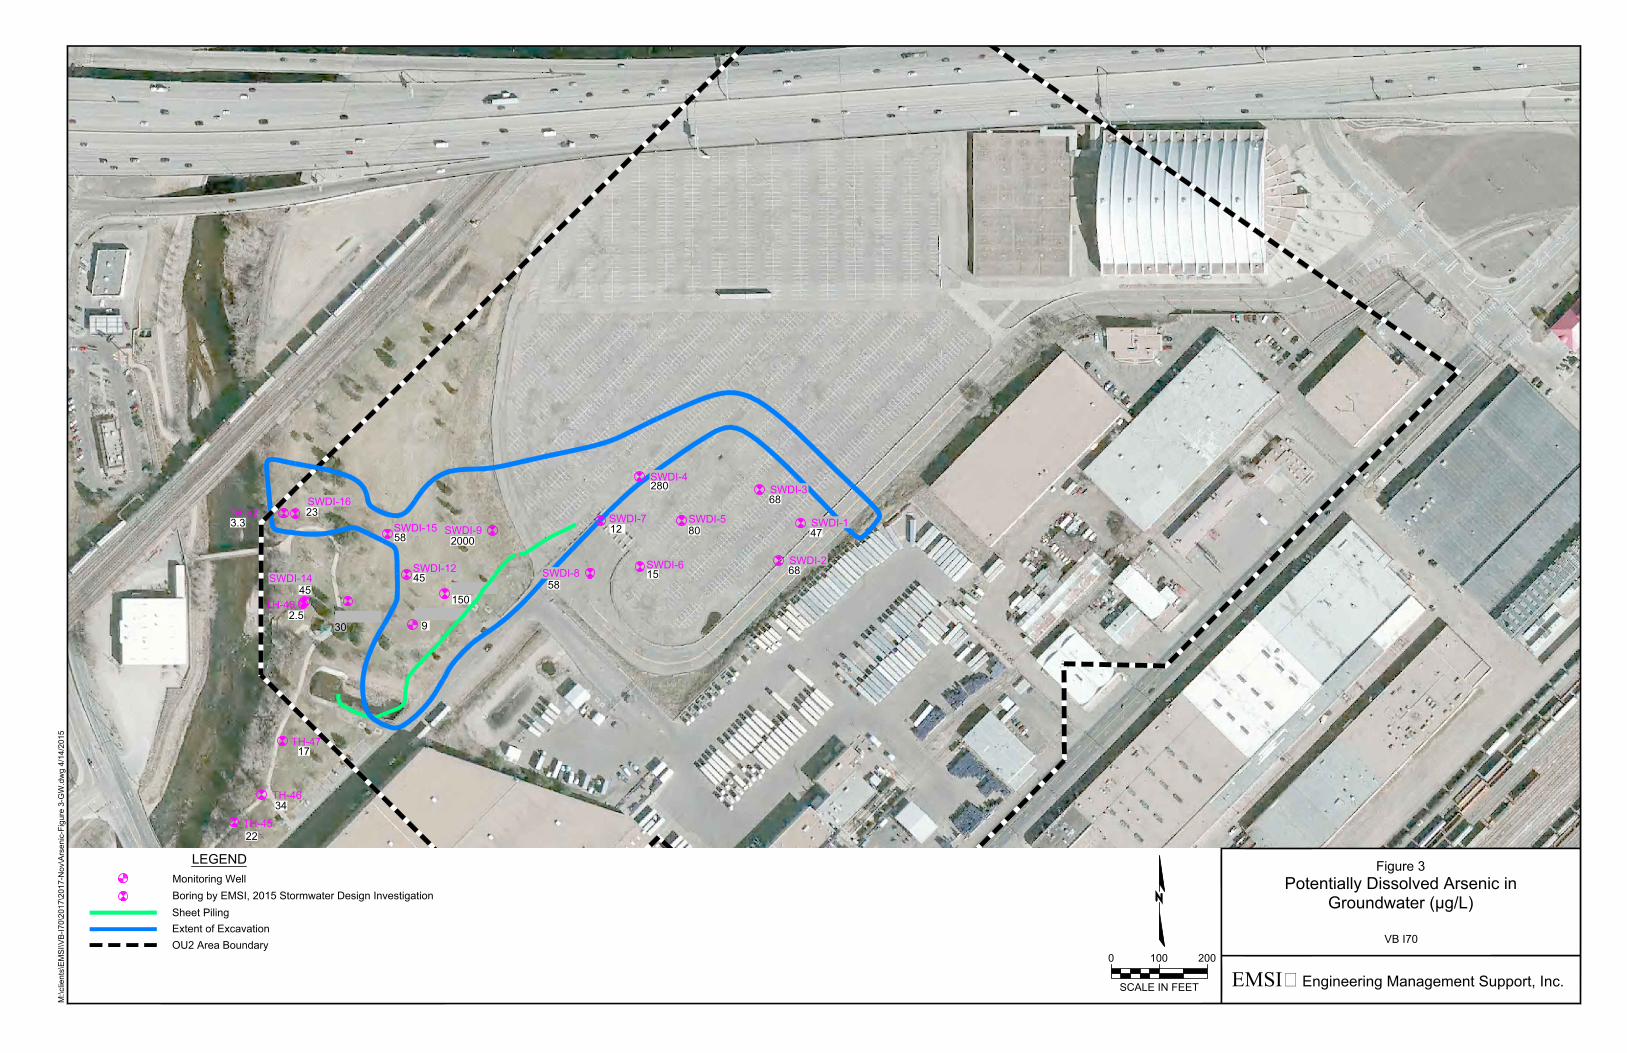
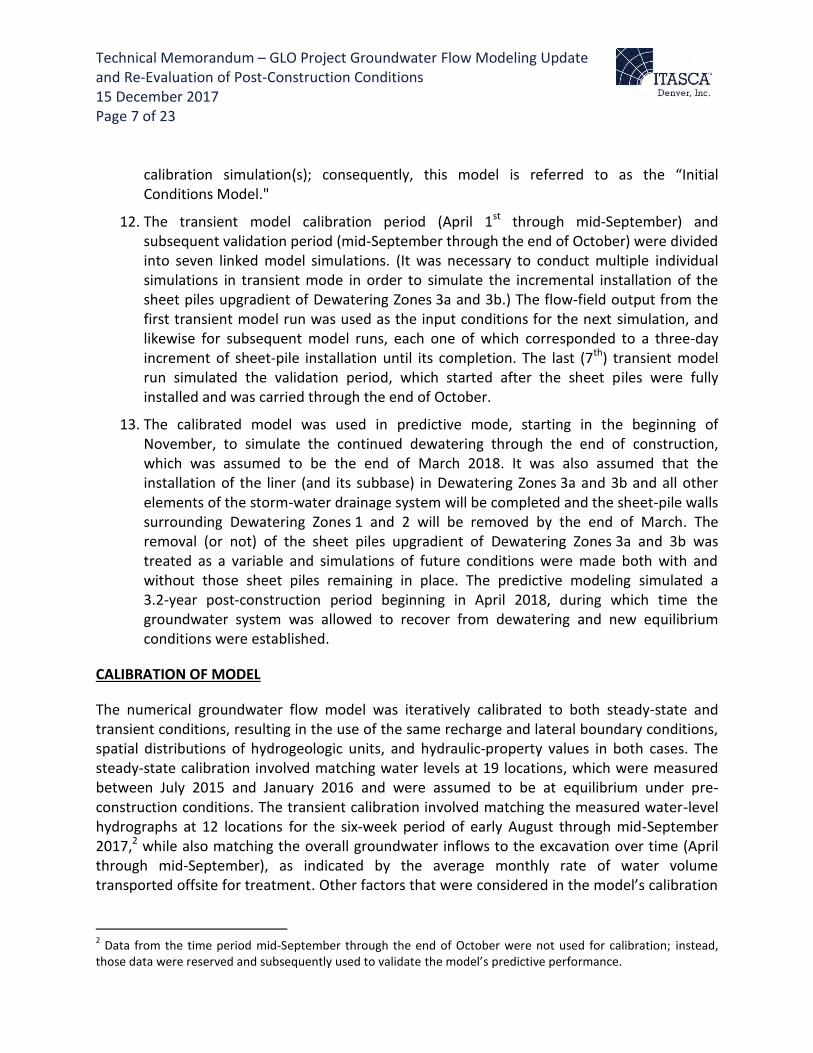
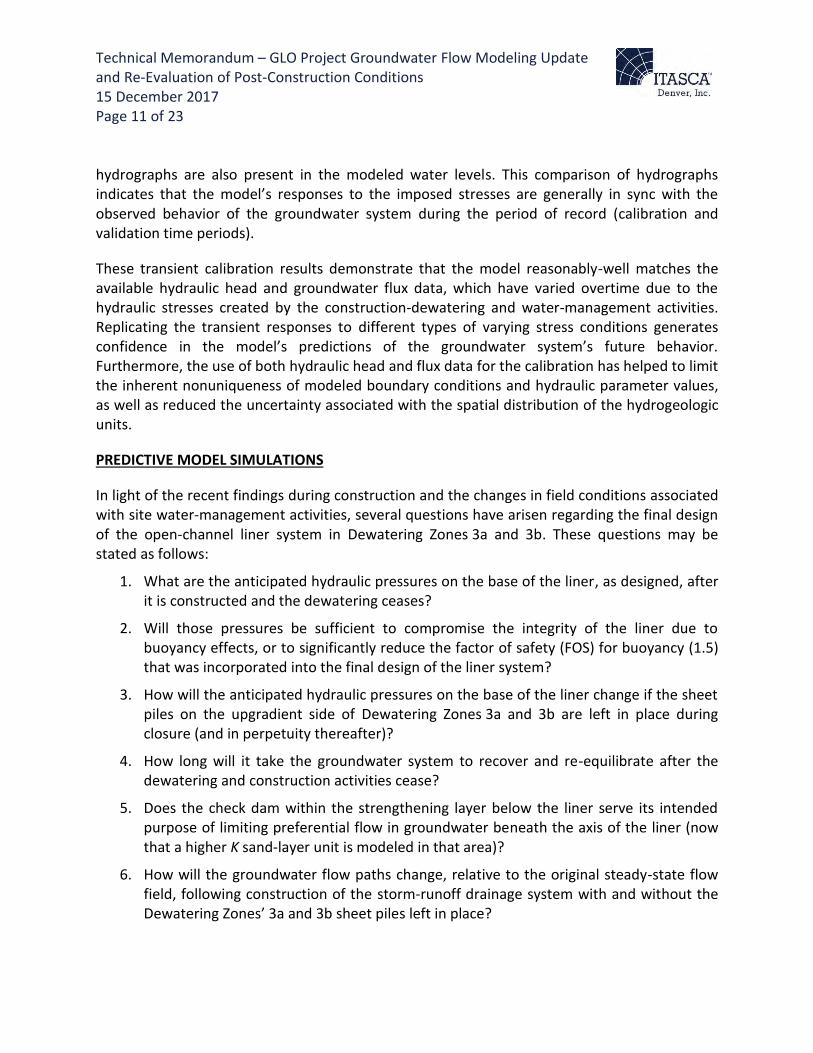
With regards, to arsenic, the only potentially-relevant standard for which historical data
are available is the in-stream standard of potentially-dissolved arsenic of 340 ug/L.
Recognizing the arguments made above for why this standard should not be applied to
unfiltered groundwater, application of the standard to unfiltered GLO groundwater would
Addendum 3 to Final Design Report
April 12, 2018 Page 8

FINAL
be extremely conservative (stringent). That said, and as shown on Figure 3, no well
water except that from SWDI-9 exceeded 340 ug/L. For the same reasons stated above,
the presence and mobility of arsenic from the SWDI-9 area are considered to be
inconsequential. To summarize, arsenic contribution to the South Platte River will be
negligible and insignificant relative to its in-stream standard with or without leaving the
sheet piles in place.
Addendum 3 to Final Design Report
April 12, 2018 Page 9
4
FINAL
CONCLUSIONS
As discussed in the preceding sections and in Appendix A, the following conclusions can
be drawn:
1. Predictive modeling with the recalibrated model addressed several important
questions regarding the final design of the open-channel liner system, specifically:
a. If sheet piling along the southern boundary of the GLO project are left in
place, the design minimum FOS of 150% will be maintained. If sheet
piling is removed, the FOS may decline to less than 150% beneath parts of
the liner.
b. Modeling indicates that most of the water table recovery beneath the liner
will occur within the first six months after the end of construction.
Thereafter, the simulated water levels asymptotically approach steady
values. Nearly complete re-equilibrated groundwater table conditions are
reached by two years after the end of construction.
c. Modeled changes in the hydrogeologic units and hydraulic property values
in the vicinity of the liner system render the check dam in the
strengthening layer ineffectual in limiting preferential flow of groundwater
toward the South Platte River with or without the sheet piles in place.
d. If the sheet piles remain in place, modeling indicates a reduction in water
table elevations downgradient from the sheet piles. An associated
reduction in saturated thickness means there should be less groundwater
flux through fill in the part of the Coliseum parking lot that is
downgradient from the sheet piles.
e. Model results indicate that the groundwater flux from the fill beneath the
Coliseum parking lot could increase following completion of the GLO
project, regardless of whether sheet piles are left in place. However, an
increase of 6 gpm with the sheet piles in place, versus 11 gpm with the
sheet piles removed represents only 2 to 4 percent, respectively, of the
simulated net groundwater discharge to the South Platter River within the
model domain (approximately 264 gpm). These differences are
considered negligible.
2. Potential water quality impacts (lead and arsenic) to the South Platte River are
inconsequential, regardless of whether the sheep piles are left in place.
In conclusion, there are net positive design and environmental impacts to the GLO
project by leaving the sheet piles in place along the southern portions of Zones 3a, 3b,
and around existing Arkins Court outfall. In addition, with these sheet piles remaining in
place, the check dam will no longer serve as an environmental benefit.
Addendum 3 to Final Design Report
April 12, 2018 Page 10
FINAL
REFERENCES
Engineering Management Support, Inc. (EMSI), R.K Frobel & Associates, and Itasca
Denver, Inc. 2016a. Final Design Report Environmental Components for Globeville
Landing Outfall Project, Vasquez Boulevard/Interstate 70 Site, Operable Unit #2
Removal Action. February 6, 2016.
EMSI, 2016b. Addendum 1, Data Summary Report, Environmental Conditions
Investigation, High Street Outfall and 40th Avenue Storm Sewer System, Vasquez
Boulevard/Interstate 70 Site, Operable Unit #2 Removal Action. March 15, 2016
EMSI, 2016c. Addendum 2, Final Design Report, Environmental Components for
Globeville Landing Outfall Project, Vasquez Boulevard/Interstate 70 Site, Operable Unit
#2 Removal Action. November 28, 2016
EMSI, 2015a. Removal Action Work Plan, High Street Outfall and 40th Avenue Storm
Sewer System, Vasquez Boulevard/Interstate 70 Site, Operable Unit #2. June 19, 2015.
EMSI, 2015b. Data Summary Report, Environmental Conditions Investigation, High
Street Outfall and 40th Avenue Storm Sewer System, Vasquez Boulevard/Interstate 70
Site, Operable Unit #2 Removal Action. September 18, 2015.
USEPA, 2015. Appendix C, Statement of Work attached to the Administrative
Settlement Agreement and Order on Consent for Removal Action, Vasquez
Boulevard/Interstate 70 Site, Operable Unit 2, USEPA Docket No. CERCLA-08-2015-
0006. July 1, 2015.
Addendum 3 to Final Design Report
April 12, 2018 Page 11

TABLES
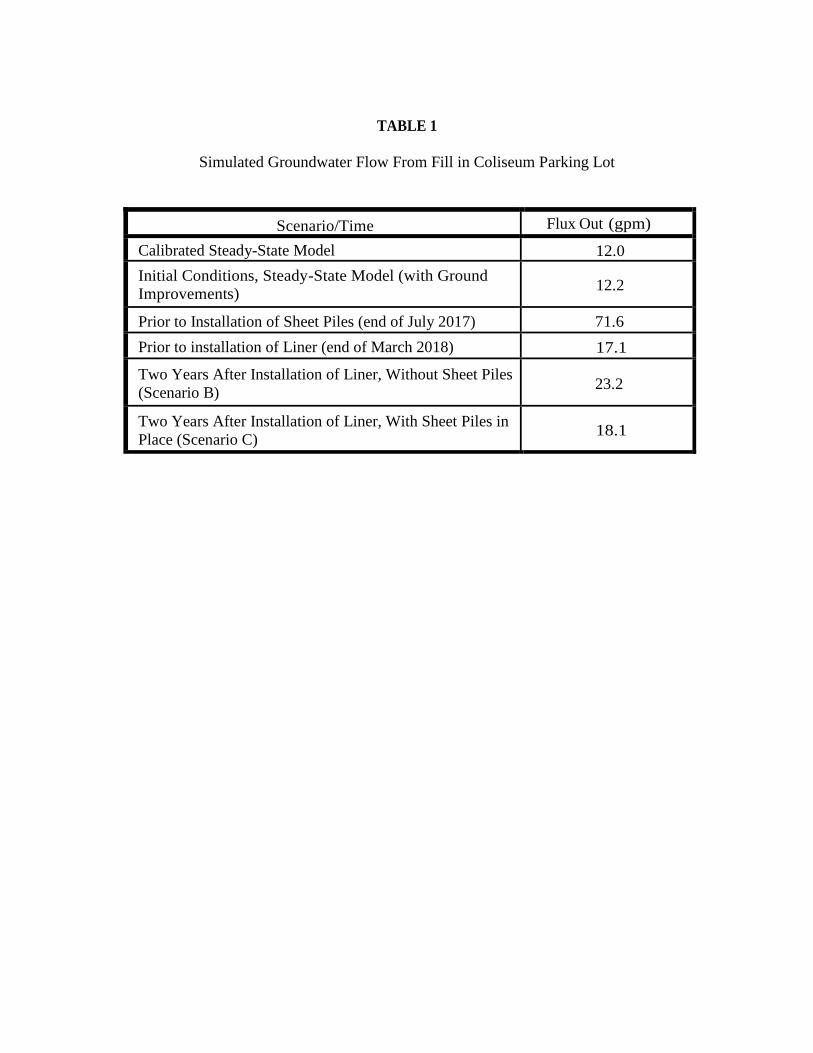
TABLE 1
Simulated Groundwater Flow From Fill in Coliseum Parking Lot
Scenario/Time Flux Out (gpm)
Calibrated Steady-State Model 12.0
Initial Conditions, Steady-State Model (with Ground
Improvements) 12.2
Prior to Installation of Sheet Piles (end of July 2017) 71.6
Prior to installation of Liner (end of March 2018) 17.1
Two Years After Installation of Liner, Without Sheet Piles
(Scenario B) 23.2
Two Years After Installation of Liner, With Sheet Piles in
Place (Scenario C) 18.1

FIGURES
DENVER
COLISEUM
PARKING LOT
Globeville
Landing
Limits of Environmental Components
Park
Compacted Grout Columns
Beneath RCB Conduit
Strengthening Layer and
Vibro-Stone Columns
Beneath Open Channel
Impermeable Barrier
M:\clie
nts\E
MS
I\V
B-I7
0\2
01
7\V
B-I7
0-S
he
et-P
ile
-A
lig
nm
en
t.d
wg
1
2/2
8/2
01
7
LEGEND
Sheet Piling Alignment
OU2 Area Boundary
Temporary Water
Treatment Plant
0 75 150
SCALE IN FEET
Figure 1
Sheet Piling Alignment
VB I70
EMSI Engineering Management Support, Inc.
<0.18
<0.18
SWDI-4
SWDI-3
SWDI-16
SWDI-7 SWDI-5
SWDI-1
SWDI-15
SWDI-9
SWDI-2
SWDI-6
SWDI-12
SWDI-8
SWDI-14
2.3
2.2
2.0
3.10.20 J
160
6.5
<0.18
3.0
0.29 J
22
0.2
<0.18
1.6
<0.18
1.7
SWDI-13
SWDI-10
M:\clie
nts\E
MS
I\V
B-I7
0\2
01
7\2
01
7-N
ov\D
isso
lve
d L
ea
d-F
ig
ure
2
-G
W.d
wg
4
/1
4/2
01
5
<0.18
<0.18
<0.18
LEGEND
Monitoring Well
Boring by EMSI, 2015 Stormwater Design Investigation
Sheet Piling
Extent of Excavation
OU2 Area Boundary
0 100 200
SCALE IN FEET
Figure 2
Dissolved Lead in
Groundwater (µg/L)
VB I70
EMSI Engineering Management Support, Inc.
SWDI-4
SWDI-3
SWDI-16
SWDI-7 SWDI-5
SWDI-1
SWDI-15
SWDI-9
SWDI-2
SWDI-6
SWDI-12
SWDI-8
SWDI-14
280
12
23
47
68
80
2000
58
3.3
SWDI-13
SWDI-10
150
68
58
15
45
30
45
9
2.5
M:\clie
nts\E
MS
I\V
B-I7
0\2
01
7\2
01
7-N
ov\A
rse
nic-F
ig
ure
3
-G
W.d
wg
4
/1
4/2
01
5
17
22
34
LEGEND
Monitoring Well
Boring by EMSI, 2015 Stormwater Design Investigation
Sheet Piling
Extent of Excavation
OU2 Area Boundary
0 100 200
SCALE IN FEET
Figure 3
Potentially Dissolved Arsenic in
Groundwater (µg/L)
VB I70
EMSI Engineering Management Support, Inc.

APPENDIX A
Itasca-Denver Modeling Report
Itasca Denver, Inc. 143 Union Blvd., Suite 525
Lakewood, Colorado 80228 USA tel: +1 303-969-8033 fax: +1 303-969-8357
e-mail: [email protected]/www.itascadenver.com
TECHNICAL MEMORANDUM
TO: Timothy Shangraw, P.E. – Engineering Management Support, Inc. 4029-12
FROM: Dan Stone, Ph.D. Dong Ding, Ph.D.
DATE: 15 December 2017
SUBJECT: Globeville Landing Outfall Project – Groundwater Flow Modeling Update and Re-Evaluation of Post-Construction Conditions
INTRODUCTION
This technical memorandum describes the fifth phase of a groundwater flow modeling study that is being performed by Itasca Denver, Inc. (Itasca) in conjunction with Engineering Management Support, Inc. (EMSI) for the Globeville Landing Outfall (GLO) project. Dewatering of a portion of the GLO site was necessary prior to the construction of a new storm-water drainage system. In Phases 1 and 2 of the modeling study, Itasca developed and calibrated a steady-state numerical groundwater flow model of the GLO site and then used the model to estimate dewatering rates and the timing of inflows to the construction site and to help design a prospective dewatering system (Itasca 2015a, 2015b). Phase 2 also included a preliminary evaluation of the post-construction, equilibrated groundwater potentiometric surface. In Phase 3, additional model simulations were performed to evaluate the effects of using subsurface hydraulic flow barriers to reduce the groundwater management/treatment requirements (Itasca 2016a). The Phase 4 study involved collecting site-specific data via a pumping test and slug tests to check previous assumptions regarding some of the parameter values used in the groundwater flow model simulations (Itasca 2016b). The present (5th) phase consists of updating and recalibrating the groundwater flow model based on the new information and data obtained during the first several months of construction (April through October 2017), and then using the revised model to evaluate the groundwater conditions associated with different water-management options and the final configuration of subsurface components of the drainage system.
Technical Memorandum – GLO Project Groundwater Flow Modeling Update and Re-Evaluation of Post-Construction Conditions 15 December 2017 Page 2 of 23
BACKGROUND
The modeled dewatering estimates obtained from the earlier phases of study were found to be low relative to the observed groundwater inflow rates after the construction excavation proceeded below the existing water table. Previously, a maximum average discharge rate of approximately 40 gallons per minute (gpm) was predicted to occur into the designed dewatering system during its operation prior to construction (Itasca 2015a). However, the designed dewatering system was not installed or operated as proposed (Itasca 2015b), and the uncontrolled inflows to the open excavation amounted to a maximum average rate of approximately 100 gpm. This rate of groundwater discharge was sustained for approximately three months until sheet piles were installed to bedrock in mid-August upgradient of Dewatering Zones 3a and 3b,1 which reduced the overall groundwater inflow to the construction area. The inflows observed during the initial months of dewatering of the construction area, together with the observed reduction of inflows after installation of the sheet piles, constitute important transient-flux data that can be used to constrain the groundwater flow model’s calibration. Such data were unavailable at the time the previous modeling was performed.
Construction activities near the upstream end of Dewatering Zone 3a (adjacent to an open pond connected to the Arkins Court outfall) exposed a layer of generally clean sand that was at least 10 feet (ft) thick. The freshly-exposed embankment generated a significant amount of groundwater discharge that was apparently derived from the Arkins Court outfall pond, which was acting as a constant-head source of local groundwater recharge. The embankment was quickly “sealed” with a clay cover to limit the discharge into the construction area. These features (the sand layer and the outfall acting as a constant source of recharge) were previously unnoticed until revealed by the construction activities. They constitute potentially important changes to the conceptual groundwater model of the GLO site, upon which the numerical groundwater flow model is based.
To help better-define the groundwater conditions during construction, HRS Water Consultants, Inc. (HRS) installed piezometers equipped with pressure transducers and dataloggers to collect time-series water-level data at a dozen new locations and at two previously existing locations surrounding the construction area. Water-level (hydraulic head) data have been regularly collected at the newly monitored locations since early August. These data sets provide nearly continuous records of the groundwater system’s responses at specific locations to the various stresses imposed by the construction dewatering and water management activities (sump pumping, creation of temporary water-storage ponds, installation of sheet piles, etc.).
Lastly, the base of the Delgany sanitary sewer lines were exposed during construction and a flowing underdrain layer consisting of gravel approximately 1.5 ft thick was discovered. A leaky
1 The different dewatering zones are illustrated in Figures 9 and 10.
Technical Memorandum – GLO Project Groundwater Flow Modeling Update and Re-Evaluation of Post-Construction Conditions 15 December 2017 Page 3 of 23
9-inch diameter clay pipe buried within the underdrain layer beneath the western sewer line was also discovered. When the pipe was breached, it reportedly flowed (from the south) at a sustained rate of approximately 120 gpm until it was temporarily plugged. The southern portion of the pipe was subsequently unplugged and returned to partial service by a sequence of gravel drains and bypass piping, which were intended to restore flow within the pipe and convey a portion of the pipe’s discharge to the underdrain layer north of Dewatering Zone 2. As a result, flow within the northern portion of the pipe (north of Dewatering Zone 2) ceased after the pipe was breached. The presence of the high hydraulic conductivity (K) underdrain layer and the groundwater recharge associated with the leaky clay pipe were previously unknown until revealed by the construction activities. These features represent potentially important components of the conceptual groundwater model of the site, upon which the numerical model is based.
All of these activities and new findings necessitated updating and recalibrating the previously developed groundwater flow model, so that the model closely matches the recently observed water levels (head data) and groundwater inflows (flux data) to the excavation. The availability of transient hydraulic head and flux data together provide a much stronger foundation for the model’s calibration, relative to the previously developed model. (Up to this point, the model was calibrated only to steady-state head data, as no flux data and no transient data of either kind were available.) This stronger foundation for the calibration provides greater confidence in the model’s predictive reliability.
DESIGN OF THIS DOCUMENT
The information and new data described in the preceding paragraphs, along with other minor changes, were incorporated into the numerical groundwater flow model. Rather than describing the details of every change that was made, relative to the previous version of the model, this technical memorandum presents a stand-alone, comprehensive description of the updated/recalibrated model along with its current predictions of future groundwater conditions for three different scenarios related to the final design of the storm-water drainage system. The detailed assumptions and results of the predictive modeling scenarios are presented in the latter part of the memorandum, following the discussion of the model’s update and recalibration.
DESCRIPTION OF NUMERICAL MODEL
A three-dimensional (3-D) numerical groundwater flow model was developed to simulate groundwater conditions in the vicinity of Denver Coliseum and Globeville Landing Park. The model domain includes the Denver Coliseum, its parking lot, the Globeville Landing Park, the Pepsi Bottling Group property, and other developed properties along Brighton Boulevard, north of the Pepsi property and south of the Denver Coliseum (Figure 1). The model domain coincides
Technical Memorandum – GLO Project Groundwater Flow Modeling Update and Re-Evaluation of Post-Construction Conditions 15 December 2017 Page 4 of 23
with the South Platte River to the west, I-70 and 44th Street to the north and east, and Brighton Boulevard and 38th Street to the east and south.
Pertinent aspects of the model are as follows:
1. The numerical modeling code used in this study is MODFLOW-SURFACT, version 4 (HGL 2011), which is an enhanced version of the U.S. Geological Survey’s 3-D finite-difference groundwater flow code, MODFLOW (McDonald and Harbaugh 1988).
2. The model simulates saturated groundwater flow in the natural soils and fill material above the bedrock surface. The claystone bedrock is assumed to be impermeable and forms the base of the model domain.
3. The model grid consists of 73 rows, 93 columns, and 11 layers, and it has 36,914 active cells (Figure 2). The size of each cell is 30 ft by 30 ft horizontally. Model layers are horizontal and are 5-ft thick, except for layers 7 and 8, which are 2.5-ft thick. Some cell thicknesses are less than the full layer thickness in certain areas due to variations in the land surface and top-of-bedrock elevations across the site.
4. The hydrogeologic units in the model represent the natural soils and fill materials that are present between the land surface and the top of bedrock. The hydrogeologic units were specified on the basis of historical land-use information (e.g., approximate landfill limits), site well logs (Merrick & Company 2015; EMSI 2016), measured groundwater levels, interpreted groundwater hydraulic gradients, and field observations made during the initial period of construction of the storm-water drainage system.
a. Conceptually, the hydrogeologic units are subdivided into six different types of natural soil, three different areas of fill material, and three groups of modified existing conditions. The soil units include the natural deposits in the Globeville Landing Park area, natural deposits adjacent to the Coliseum parking lot, small areas of top soil, sand overlying bedrock, clay (interbedded with sand and fill), and river-bank deposits along the eastern edge of the South Platte River. The three types of fill material were defined on the basis of their depositional locations and their inferred hydraulic characteristics. One unit was assigned to the fill in the Denver Coliseum parking lot, another was assigned to the areas of fill in Globeville Landing Park, and the third was assigned to the fill along Brighton Boulevard. The assumed thickness and distribution of fill were based on site boring logs (Merrick & Company 2015; EMSI 2016), where available. A separate hydrogeologic unit was assigned to the model cells corresponding to the sanitary sewer lines, which are expected to impede groundwater flow; thus, those cells were assigned a very low K value. Also, the two areas of ground improvements prior to construction (aggregate pillars or “Vibro Piers™” in Dewatering Zone 3b and compacted grout columns in Dewatering Zone 4) were modeled as distinct hydrogeologic units.
Technical Memorandum – GLO Project Groundwater Flow Modeling Update and Re-Evaluation of Post-Construction Conditions 15 December 2017 Page 5 of 23
b. Figure 3 shows the modeled distribution of the hydrogeologic units at the land surface. Attachment A provides a series of maps showing the distribution of the hydrogeologic units for each model layer.
5. Site-specific measurements of the hydraulic properties of the hydrogeologic units are limited to the PW-2 pumping test and several slug tests, which were conducted by Itasca in July 2016 (Itasca 2016b). The K values estimated from those tests ranged from approximately 0.2 to 2.3 feet per day (ft/d) for natural soil and fill material in Globeville Landing Park and from approximately 0.2 to 3.2 ft/d for fill material within the Coliseum parking lot. (The recently incorporated sand layer was not encountered in those tests.) HRS estimated the K value of clean sand at the site to be 600 ft/d, based on specific capacity data from a nearby production well and published K and transmissivity values in Smith et al. (1964) and Wilson (1965) (HRS 2017, personal communication). Plausible ranges of the property values, based on published literature (Reddy et al. 2009; University of Southampton 2015) and professional judgment, were considered and used to constrain the calibration of model parameters. The previously assigned parameter values were refined during the iterative process of steady-state and transient model calibrations during this update, and they remained within plausible limits at the end of the calibration.
6. The hydraulic boundaries of the model are shown in Figure 2. Three types of boundary conditions are used; they include specified-head boundaries, which are assigned along the South Platte River and at Brighton Boulevard; a head-dependent flux boundary, which is specified along the I-70 portion of the model domain; and specified-flux boundaries, which are used at 44th Street and 38th Street (no flow) and along the base of the western sewer line (inflow to the model domain). Collectively, these boundary conditions act to represent regional subsurface flow from the south beneath Brighton Boulevard and direct it to the north and the west, where it ultimately discharges to the South Platte River. This regional subsurface inflow beneath Brighton Boulevard constitutes the primary source of groundwater input to the model domain.
7. Two zones are used to simulate groundwater recharge from the infiltration of precipitation in open-ground portions of the study area (Figure 3). Recharge Zone 1 includes Globeville Landing Park and the area north of the park and east of the river, as well as three small unpaved areas along Brighton Boulevard. The prescribed recharge rate in Zone 1 is 0.063 inch per year (in/yr), or 0.4 percent (%) of the average annual precipitation in Denver (15.6 in/yr). Recharge Zone 2 represents the open areas (drainage ditch) along McFarland Drive on the south side of the Coliseum parking lot, which collect some of the runoff from the road and parking lot. The modeled recharge rate in Zone 2 is 0.63 in/yr, or 4% of the annual precipitation. Paved areas within the model domain receive no recharge. Evapotranspiration is considered to be negligible and, thus, is not included in the model.
Technical Memorandum – GLO Project Groundwater Flow Modeling Update and Re-Evaluation of Post-Construction Conditions 15 December 2017 Page 6 of 23
8. The lowest segments of the storm-water drainage system, adjacent to the South Platte River, constitute Dewatering Zones 1 and 2 (see Figures 9 and 10). As planned, the dewatering of these zones involved the use of vertical sheet piles driven into the bedrock to limit water inflow from the river and the surrounding areas into the construction excavation. Dewatering Zone 2 contains a reinforced concrete box (RCB) and drop structure that rests on bedrock, whereas the drainage system in Dewatering Zone 1 consists of open-channel flow over bedrock armored with rip rap. The sheet-pile walls are continuous surrounding these zones, except for where the sanitary sewer lines enter and exit Dewatering Zone 2. A modest amount of inflow into the construction area (estimated at 20 to 30 gpm) occurs where the sheet-pile walls have been left open to accommodate the sewer lines, mostly from the southern portions of the underdrain layers beneath the sewer lines. The numerical model simulates both the flow-barrier behavior/effect of the sheet-pile walls and the enhanced groundwater flow beneath the sewer lines due to the higher effective K value of model cells associated with the underdrains.
9. Dewatering Zones 3a and 3b encompass the lined open-channel part of the drainage system. To help limit the groundwater inflows to Dewatering Zones 3a and 3b during construction of the channel liner and its subbase (the strengthening layer), a vertical sheet-pile wall was installed along the upgradient side of that area over approximately a three week period in August 2017. The numerical model simulates the transient installation and flow-barrier behavior/effects of this sheet-pile wall. The model also simulates the enhanced groundwater flow due to the higher effective K value associated with the strengthening layer, as well as the flow-limiting effect of the overlying impermeable liner after it is installed.
10. The liner’s subbase, as originally designed, includes a low permeability check dam to minimize the potential for preferential groundwater flow through the strengthening layer. The check dam is located at the edge of the Coliseum parking lot within Dewatering Zone 3a. The check dam was simulated in the model as a horizontal flow barrier within model layer 8, which contains the strengthening layer.
11. Two steady-state models were created. The first model was used for calibration purposes and simulates the pre-existing groundwater conditions prior to any ground improvements or other changes at the site; it is referred to as the “Calibrated Steady-State Model." The second model modifies the calibrated model and simulates steady groundwater conditions after the planned subsurface stabilization improvements (i.e., Vibro Piers™ and compaction grouting) in the Coliseum parking lot have been completed. The ground improvements are expected to alter the bulk K values of the fill and native soil beneath the parking lot; therefore, a new set of hydraulic property values was assigned to the stabilized areas in the second steady-state model (as discussed below). The second steady-state model was used to generate new steady groundwater conditions, which define the initial hydraulic heads for the transient
Technical Memorandum – GLO Project Groundwater Flow Modeling Update and Re-Evaluation of Post-Construction Conditions 15 December 2017 Page 7 of 23
calibration simulation(s); consequently, this model is referred to as the “Initial Conditions Model."
1st12. The transient model calibration period (April through mid-September) and subsequent validation period (mid-September through the end of October) were divided into seven linked model simulations. (It was necessary to conduct multiple individual simulations in transient mode in order to simulate the incremental installation of the sheet piles upgradient of Dewatering Zones 3a and 3b.) The flow-field output from the first transient model run was used as the input conditions for the next simulation, and likewise for subsequent model runs, each one of which corresponded to a three-day increment of sheet-pile installation until its completion. The last (7th) transient model run simulated the validation period, which started after the sheet piles were fully installed and was carried through the end of October.
13. The calibrated model was used in predictive mode, starting in the beginning of November, to simulate the continued dewatering through the end of construction, which was assumed to be the end of March 2018. It was also assumed that the installation of the liner (and its subbase) in Dewatering Zones 3a and 3b and all other elements of the storm-water drainage system will be completed and the sheet-pile walls surrounding Dewatering Zones 1 and 2 will be removed by the end of March. The removal (or not) of the sheet piles upgradient of Dewatering Zones 3a and 3b was treated as a variable and simulations of future conditions were made both with and without those sheet piles remaining in place. The predictive modeling simulated a 3.2-year post-construction period beginning in April 2018, during which time the groundwater system was allowed to recover from dewatering and new equilibrium conditions were established.
CALIBRATION OF MODEL
The numerical groundwater flow model was iteratively calibrated to both steady-state and transient conditions, resulting in the use of the same recharge and lateral boundary conditions, spatial distributions of hydrogeologic units, and hydraulic-property values in both cases. The steady-state calibration involved matching water levels at 19 locations, which were measured between July 2015 and January 2016 and were assumed to be at equilibrium under pre-construction conditions. The transient calibration involved matching the measured water-level hydrographs at 12 locations for the six-week period of early August through mid-September 2017,2 while also matching the overall groundwater inflows to the excavation over time (April through mid-September), as indicated by the average monthly rate of water volume transported offsite for treatment. Other factors that were considered in the model’s calibration
2 Data from the time period mid-September through the end of October were not used for calibration; instead,
those data were reserved and subsequently used to validate the model’s predictive performance.
Technical Memorandum – GLO Project Groundwater Flow Modeling Update and Re-Evaluation of Post-Construction Conditions 15 December 2017 Page 8 of 23
included the overall directions/pattern of groundwater flow and the water budget for the model domain.
Figure 4 shows the locations of the piezometers and wells used as targets in the model’s calibration. The final hydraulic property values that were used in the model are listed in Table 1.
STEADY-STATE CALIBRATION
Results of Steady-State Calibration
The quality of a groundwater model calibration is typically judged by several statistical parameters, including the mean error (ME), mean absolute error (MAE), root-mean-squared error (RMSE), normalized RMSE (ratio of RMSE to the observed range of hydraulic heads), and the coefficient of determination (r2). For perfect calibrations, the RMSE, MAE, and ME tend to zero, whereas r2 tends to one. The coefficient of determination measures the linear relationship between simulated and measured hydraulic heads; the closer r2 is to 1.0, the better the fit between the measured and modeled data. The RMSE is a measure of the spread of residuals (differences between simulated and measured values). If the normalized RMSE is small, typically less than 10 to 15%, it is generally an indication of a “good” calibration.
Table 2 provides calibration statistics for the steady-state model, all of which are considered to be good and indicate that a satisfactory steady-state calibration was achieved. In particular, the normalized RMSE equals 0.03 (3%), which is less than the 10 to 15% threshold that is considered indicative of a good calibration, and the correlation between measured and simulated water levels is excellent (r2 = 0.98).
Results of the steady-state calibration are illustrated in three figures: Figure 5 illustrates the simulated groundwater elevations in the Calibrated Steady-State Model (pre-construction), Figure 6 compares simulated and measured water levels for all of the calibration targets, and Figure 7 shows the spatial distribution of calibration residuals.
Ground Improvements Before Commencement of Dewatering
Prior to dewatering, ground improvements were made in the part of the Denver Coliseum parking lot where the drainage system will be installed. The area directly beneath the open channel part of the system in Dewatering Zone 3b was stabilized using Vibro Piers™, whereas the upstream area beneath the box culverts in Dewatering Zone 4 was stabilized with compaction grouting to improve support conditions. Because the stabilization operations are expected to change the bulk hydraulic properties of the subsurface materials, the modeled property values were adjusted in the areas of ground improvements based on the anticipated changes. It was assumed that the installation of Vibro Piers™ increases the K value of the natural soil in that area by approximately one order of magnitude, relative to the calibrated
Technical Memorandum – GLO Project Groundwater Flow Modeling Update and Re-Evaluation of Post-Construction Conditions 15 December 2017 Page 9 of 23
steady-state model conditions, whereas in the upstream area of compaction grouting, the K value decreases by approximately one order of magnitude. The specific parameter values assigned in these two areas are listed in Table 1.
The steady-state initial conditions model that incorporated these changes was used to generate a new groundwater flow field after the installation of Vibro Piers™ and compaction grouting. Figure 8 shows contours of the modeled groundwater elevations after the ground improvements have been made. The new simulated groundwater levels constitute the initial hydraulic heads that were used in the model’s transient calibration.
TRANSIENT CALIBRATION
The transient calibration involved implementing model boundary conditions at appropriate points in time to represent the hydraulic stresses created by the progression of construction-dewatering and water-management activities. The main hydraulic stresses that have been created by these activities include:
1. The dewatering of the construction area via seepage into the open excavation area and the associated collection/sump-pumping/disposal of the collected water;
2. The movement (pumping) and temporary storage of collected water within the various construction-area impoundments;
3. The installation of sheet-pile walls to limit groundwater inflow to the construction area;
4. The rerouting of surface-runoff flow from the box culvert of the Arkin’s Court outfall, such that it no longer discharges into the open pond, as well as the placement of upgradient sheet piles immediately adjacent to the pond; and
5. The rupture and plugging of the clay pipe beneath the western sewer line in Dewatering Zone 2 and the subsequent reconfiguration of discharge from the southern end of that pipe directly into the underdrain layer.
All of these stresses except for No. 2 were incorporated into the model’s transient calibration. Because there are no records of how much water was being transferred or stored within the construction at different points in time, this particular stress on the groundwater system could not be reliably estimated, so it was not simulated. Some slight discrepancies between the modeled and observed groundwater responses are expected to result from this omission.
The groundwater seepage into the construction area was represented in the model by using the Drain (DRN) package for MODFLOW. The simulated drain elevations were lowered over time in accordance with the estimated progression of deepening of the excavation, which was interpreted on the basis of in-progress elevation contours of the construction area in July 2017 (CCD 2017, personal communication) and on the final grading plan for the liner’s subbase
Technical Memorandum – GLO Project Groundwater Flow Modeling Update and Re-Evaluation of Post-Construction Conditions 15 December 2017 Page 10 of 23
(Merrick & Company 2017, personal communication). The modeled drain cells representing the construction dewatering are illustrated in Figure 9.
The sheet piles were represented in the model by using the Horizontal Flow Barrier (HFB) package for MODFLOW. The flow barrier’s conductance parameter was set to a very low value (equivalent to K = 0.00001 ft/d for a 1-ft thick barrier), so that the flow of groundwater would be effectively impeded relative to the flow in the surrounding hydrogeologic units. Figure 10 shows the modeled locations of sheet piles.3
The Arkin’s Court outfall was modeled as a constant-head boundary until the surface-runoff flow was rerouted and the upgradient sheet pile wall was fully emplaced in mid-August (Figure 10). After then, the constant-head cell representing the outfall was turned off and removed from the model.
Leakage from the clay pipe within the underdrain of the western sewer line was represented by a specified-flux boundary condition (line source), with an assigned steady total influx to the groundwater system of approximately 80 gpm over the entire length of the sewer line within the model domain (Figure 10). This influx rate was increased to approximately 95 gpm following the rupture, plugging, and reconfiguration of the pipe’s discharge in Dewatering Zone 2. At the same time, the influx from the northern segment of the pipe (north of Dewatering Zone 2) was halted because the flow within that segment of the pipe had ceased.
Results of Transient Calibration
Results of the transient calibration are shown in two figures, one illustrating the model’s match to the estimated construction-area inflows and the other showing the correspondence between modeled and observed water levels.
Figure 11 illustrates the modeled inflows over time to the construction area for the individual dewatering zones and for the overall excavation. The simulated total inflow peaks at a rate of approximately 100 gpm in late May, and is sustained for 2 to 3 months thereafter until the sheet piles are installed upgradient of Dewatering Zones 3a and 3b in mid-August. This modeled behavior reasonably-well matches the recorded average monthly rate of water volume transported offsite for treatment, which is also shown in Figure 11 for comparison.
Figures 12a, 12b, and 12c compare the simulated hydraulic heads (water levels) with measured water-level hydrographs at 12 piezometers/wells within and surrounding the construction area (their locations are shown in Figure 4). In all cases the modeled hydraulic heads are reasonably consistent with the measured water levels, both in terms of absolute elevations and temporally-varying trends. Moreover, many small-scale perturbations in the measured
3 The sheet piles contain a small gap in Dewatering Zone 3a at the location of an existing fiber-optic utility line.
Technical Memorandum – GLO Project Groundwater Flow Modeling Update and Re-Evaluation of Post-Construction Conditions 15 December 2017 Page 11 of 23
hydrographs are also present in the modeled water levels. This comparison of hydrographs indicates that the model’s responses to the imposed stresses are generally in sync with the observed behavior of the groundwater system during the period of record (calibration and validation time periods).
These transient calibration results demonstrate that the model reasonably-well matches the available hydraulic head and groundwater flux data, which have varied overtime due to the hydraulic stresses created by the construction-dewatering and water-management activities. Replicating the transient responses to different types of varying stress conditions generates confidence in the model’s predictions of the groundwater system’s future behavior. Furthermore, the use of both hydraulic head and flux data for the calibration has helped to limit the inherent nonuniqueness of modeled boundary conditions and hydraulic parameter values, as well as reduced the uncertainty associated with the spatial distribution of the hydrogeologic units.
PREDICTIVE MODEL SIMULATIONS
In light of the recent findings during construction and the changes in field conditions associated with site water-management activities, several questions have arisen regarding the final design of the open-channel liner system in Dewatering Zones 3a and 3b. These questions may be stated as follows:
1. What are the anticipated hydraulic pressures on the base of the liner, as designed, after it is constructed and the dewatering ceases?
2. Will those pressures be sufficient to compromise the integrity of the liner due to buoyancy effects, or to significantly reduce the factor of safety (FOS) for buoyancy (1.5) that was incorporated into the final design of the liner system?
3. How will the anticipated hydraulic pressures on the base of the liner change if the sheet piles on the upgradient side of Dewatering Zones 3a and 3b are left in place during closure (and in perpetuity thereafter)?
4. How long will it take the groundwater system to recover and re-equilibrate after the dewatering and construction activities cease?
5. Does the check dam within the strengthening layer below the liner serve its intended purpose of limiting preferential flow in groundwater beneath the axis of the liner (now that a higher K sand-layer unit is modeled in that area)?
6. How will the groundwater flow paths change, relative to the original steady-state flow field, following construction of the storm-runoff drainage system with and without the Dewatering Zones’ 3a and 3b sheet piles left in place?
Technical Memorandum – GLO Project Groundwater Flow Modeling Update and Re-Evaluation of Post-Construction Conditions 15 December 2017 Page 12 of 23
7. How will the flux of groundwater through the fill in the Coliseum parking lot change relative to the original steady-state condition with and without the Dewatering Zones’ 3a and 3b sheet piles left in place?
A set of three model scenarios was developed to address these questions. The specific scenarios that were modeled to evaluate post-construction conditions are the following:
Scenario A (Base Case) – The final design of the open-channel liner system in Dewatering Zones 3a and 3b, as previously approved, including the check dam in the strengthening layer below the liner and without any remaining sheet piles (i.e., assuming all of the sheet piles are removed at the end of construction);
Scenario B – The final design of the open-channel liner system in Dewatering Zones 3a and 3b, as previously approved, but without the check dam in the strengthening layer below the liner and with all of the currently installed sheet piles removed at the end of construction; and
Scenario C – The final design of the open-channel liner system in Dewatering Zones 3a and 3b, as previously approved, but without the check dam in the strengthening layer below the liner and with the sheet piles currently installed immediately upgradient of Dewatering Zones 3a and 3b left in place in perpetuity.
The subsurface configuration of the post-construction storm-water drainage system is described in EMSI (2016) and is illustrated in Figure 13. Upon completion, the drainage system will consist of the following elements within the different dewatering zones:
Dewatering Zone 1 – an open channel on top of bedrock;
Dewatering Zone 2 – buried RCBs and a vertical drop inlet structure, which rest on bedrock;
Dewatering Zone 3a – an open channel, on top of an impermeable liner, on top of a gravel layer, on top of the geogrid, which rests on existing soil and debris;
Dewatering Zone 3b – an open channel, on top of an impermeable liner, on top of a gravel layer, on top of the geogrid, which rests on existing soil and fill supported by Vibro Piers™; and
Dewatering Zone 4 – buried RCBs resting on existing soil and fill supported by compaction grouting.
Technical Memorandum – GLO Project Groundwater Flow Modeling Update and Re-Evaluation of Post-Construction Conditions 15 December 2017 Page 13 of 23
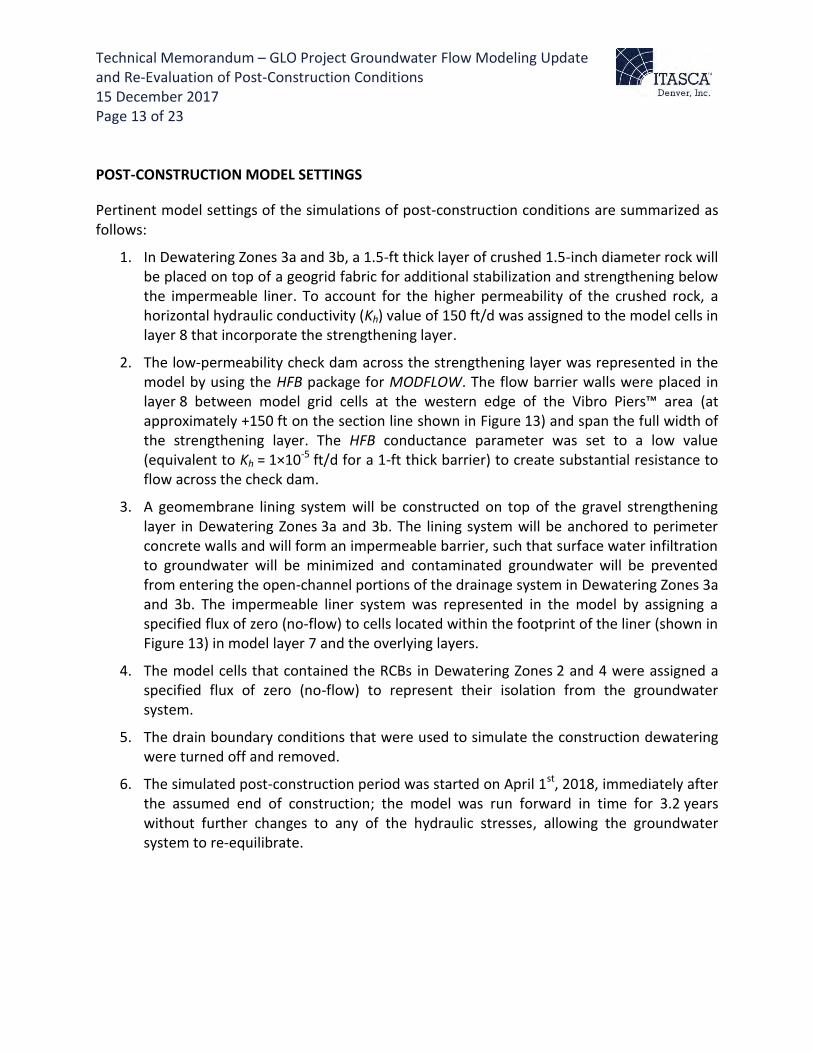
POST-CONSTRUCTION MODEL SETTINGS
Pertinent model settings of the simulations of post-construction conditions are summarized as follows:
1. In Dewatering Zones 3a and 3b, a 1.5-ft thick layer of crushed 1.5-inch diameter rock will be placed on top of a geogrid fabric for additional stabilization and strengthening below the impermeable liner. To account for the higher permeability of the crushed rock, a horizontal hydraulic conductivity (Kh) value of 150 ft/d was assigned to the model cells in layer 8 that incorporate the strengthening layer.
2. The low-permeability check dam across the strengthening layer was represented in the model by using the HFB package for MODFLOW. The flow barrier walls were placed in layer 8 between model grid cells at the western edge of the Vibro Piers™ area (at approximately +150 ft on the section line shown in Figure 13) and span the full width of the strengthening layer. The HFB conductance parameter was set to a low value (equivalent to Kh = 1×10⁻⁵ ft/d for a 1-ft thick barrier) to create substantial resistance to flow across the check dam.
3. A geomembrane lining system will be constructed on top of the gravel strengthening layer in Dewatering Zones 3a and 3b. The lining system will be anchored to perimeter concrete walls and will form an impermeable barrier, such that surface water infiltration to groundwater will be minimized and contaminated groundwater will be prevented from entering the open-channel portions of the drainage system in Dewatering Zones 3a and 3b. The impermeable liner system was represented in the model by assigning a specified flux of zero (no-flow) to cells located within the footprint of the liner (shown in Figure 13) in model layer 7 and the overlying layers.
4. The model cells that contained the RCBs in Dewatering Zones 2 and 4 were assigned a specified flux of zero (no-flow) to represent their isolation from the groundwater system.
5. The drain boundary conditions that were used to simulate the construction dewatering were turned off and removed.
6. The simulated post-construction period was started on April 1st, 2018, immediately after the assumed end of construction; the model was run forward in time for 3.2 years without further changes to any of the hydraulic stresses, allowing the groundwater system to re-equilibrate.
Technical Memorandum – GLO Project Groundwater Flow Modeling Update and Re-Evaluation of Post-Construction Conditions 15 December 2017 Page 14 of 23
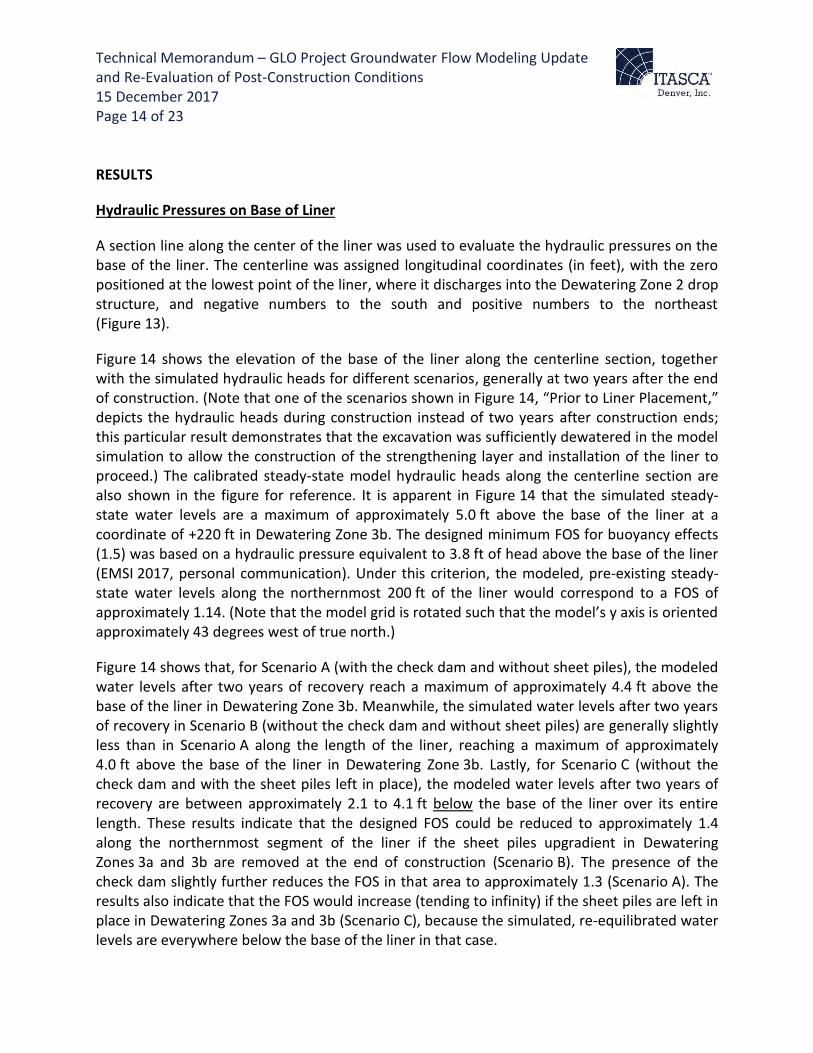
RESULTS
Hydraulic Pressures on Base of Liner
A section line along the center of the liner was used to evaluate the hydraulic pressures on the base of the liner. The centerline was assigned longitudinal coordinates (in feet), with the zero positioned at the lowest point of the liner, where it discharges into the Dewatering Zone 2 drop structure, and negative numbers to the south and positive numbers to the northeast (Figure 13).
Figure 14 shows the elevation of the base of the liner along the centerline section, together with the simulated hydraulic heads for different scenarios, generally at two years after the end of construction. (Note that one of the scenarios shown in Figure 14, “Prior to Liner Placement,” depicts the hydraulic heads during construction instead of two years after construction ends; this particular result demonstrates that the excavation was sufficiently dewatered in the model simulation to allow the construction of the strengthening layer and installation of the liner to proceed.) The calibrated steady-state model hydraulic heads along the centerline section are also shown in the figure for reference. It is apparent in Figure 14 that the simulated steady-state water levels are a maximum of approximately 5.0 ft above the base of the liner at a coordinate of +220 ft in Dewatering Zone 3b. The designed minimum FOS for buoyancy effects (1.5) was based on a hydraulic pressure equivalent to 3.8 ft of head above the base of the liner (EMSI 2017, personal communication). Under this criterion, the modeled, pre-existing steady-state water levels along the northernmost 200 ft of the liner would correspond to a FOS of approximately 1.14. (Note that the model grid is rotated such that the model’s y axis is oriented approximately 43 degrees west of true north.)
Figure 14 shows that, for Scenario A (with the check dam and without sheet piles), the modeled water levels after two years of recovery reach a maximum of approximately 4.4 ft above the base of the liner in Dewatering Zone 3b. Meanwhile, the simulated water levels after two years of recovery in Scenario B (without the check dam and without sheet piles) are generally slightly less than in Scenario A along the length of the liner, reaching a maximum of approximately 4.0 ft above the base of the liner in Dewatering Zone 3b. Lastly, for Scenario C (without the check dam and with the sheet piles left in place), the modeled water levels after two years of recovery are between approximately 2.1 to 4.1 ft below the base of the liner over its entire length. These results indicate that the designed FOS could be reduced to approximately 1.4 along the northernmost segment of the liner if the sheet piles upgradient in Dewatering Zones 3a and 3b are removed at the end of construction (Scenario B). The presence of the check dam slightly further reduces the FOS in that area to approximately 1.3 (Scenario A). The results also indicate that the FOS would increase (tending to infinity) if the sheet piles are left in place in Dewatering Zones 3a and 3b (Scenario C), because the simulated, re-equilibrated water levels are everywhere below the base of the liner in that case.
Technical Memorandum – GLO Project Groundwater Flow Modeling Update and Re-Evaluation of Post-Construction Conditions 15 December 2017 Page 15 of 23
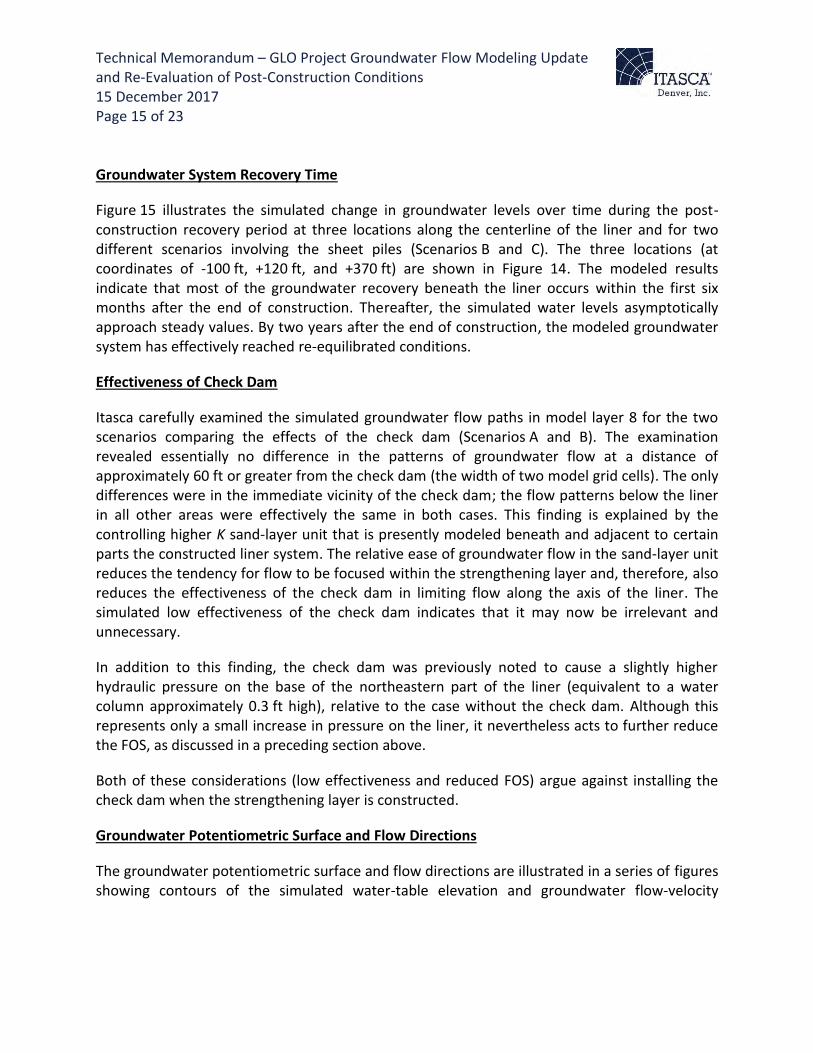
Groundwater System Recovery Time
Figure 15 illustrates the simulated change in groundwater levels over time during the post-construction recovery period at three locations along the centerline of the liner and for two different scenarios involving the sheet piles (Scenarios B and C). The three locations (at coordinates of -100 ft, +120 ft, and +370 ft) are shown in Figure 14. The modeled results indicate that most of the groundwater recovery beneath the liner occurs within the first six months after the end of construction. Thereafter, the simulated water levels asymptotically approach steady values. By two years after the end of construction, the modeled groundwater system has effectively reached re-equilibrated conditions.
Effectiveness of Check Dam
Itasca carefully examined the simulated groundwater flow paths in model layer 8 for the two scenarios comparing the effects of the check dam (Scenarios A and B). The examination revealed essentially no difference in the patterns of groundwater flow at a distance of approximately 60 ft or greater from the check dam (the width of two model grid cells). The only differences were in the immediate vicinity of the check dam; the flow patterns below the liner in all other areas were effectively the same in both cases. This finding is explained by the controlling higher K sand-layer unit that is presently modeled beneath and adjacent to certain parts the constructed liner system. The relative ease of groundwater flow in the sand-layer unit reduces the tendency for flow to be focused within the strengthening layer and, therefore, also reduces the effectiveness of the check dam in limiting flow along the axis of the liner. The simulated low effectiveness of the check dam indicates that it may now be irrelevant and unnecessary.
In addition to this finding, the check dam was previously noted to cause a slightly higher hydraulic pressure on the base of the northeastern part of the liner (equivalent to a water column approximately 0.3 ft high), relative to the case without the check dam. Although this represents only a small increase in pressure on the liner, it nevertheless acts to further reduce the FOS, as discussed in a preceding section above.
Both of these considerations (low effectiveness and reduced FOS) argue against installing the check dam when the strengthening layer is constructed.
Groundwater Potentiometric Surface and Flow Directions
The groundwater potentiometric surface and flow directions are illustrated in a series of figures showing contours of the simulated water-table elevation and groundwater flow-velocity
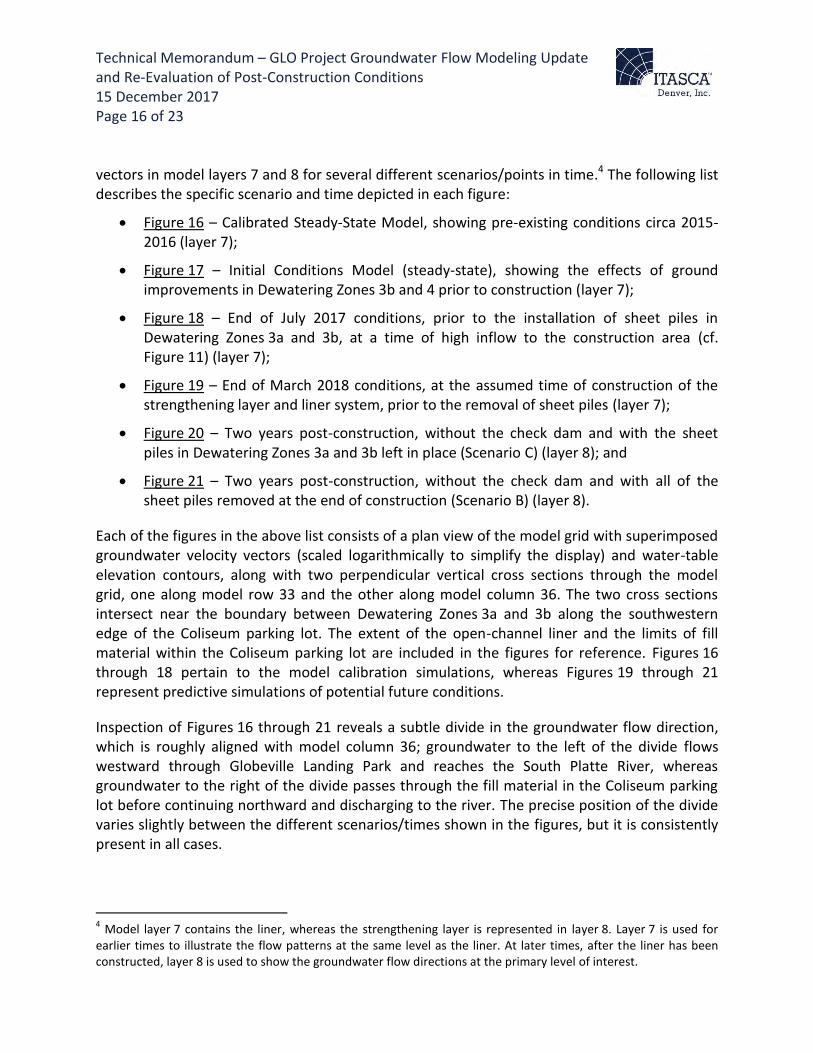
Technical Memorandum – GLO Project Groundwater Flow Modeling Update and Re-Evaluation of Post-Construction Conditions 15 December 2017 Page 16 of 23
vectors in model layers 7 and 8 for several different scenarios/points in time.4 The following list describes the specific scenario and time depicted in each figure:
Figure 16 – Calibrated Steady-State Model, showing pre-existing conditions circa 2015-2016 (layer 7);
Figure 17 – Initial Conditions Model (steady-state), showing the effects of ground improvements in Dewatering Zones 3b and 4 prior to construction (layer 7);
Figure 18 – End of July 2017 conditions, prior to the installation of sheet piles in Dewatering Zones 3a and 3b, at a time of high inflow to the construction area (cf. Figure 11) (layer 7);
Figure 19 – End of March 2018 conditions, at the assumed time of construction of the strengthening layer and liner system, prior to the removal of sheet piles (layer 7);
Figure 20 – Two years post-construction, without the check dam and with the sheet piles in Dewatering Zones 3a and 3b left in place (Scenario C) (layer 8); and
Figure 21 – Two years post-construction, without the check dam and with all of the sheet piles removed at the end of construction (Scenario B) (layer 8).
Each of the figures in the above list consists of a plan view of the model grid with superimposed groundwater velocity vectors (scaled logarithmically to simplify the display) and water-table elevation contours, along with two perpendicular vertical cross sections through the model grid, one along model row 33 and the other along model column 36. The two cross sections intersect near the boundary between Dewatering Zones 3a and 3b along the southwestern edge of the Coliseum parking lot. The extent of the open-channel liner and the limits of fill material within the Coliseum parking lot are included in the figures for reference. Figures 16 through 18 pertain to the model calibration simulations, whereas Figures 19 through 21 represent predictive simulations of potential future conditions.
Inspection of Figures 16 through 21 reveals a subtle divide in the groundwater flow direction, which is roughly aligned with model column 36; groundwater to the left of the divide flows westward through Globeville Landing Park and reaches the South Platte River, whereas groundwater to the right of the divide passes through the fill material in the Coliseum parking lot before continuing northward and discharging to the river. The precise position of the divide varies slightly between the different scenarios/times shown in the figures, but it is consistently present in all cases.
4 Model layer 7 contains the liner, whereas the strengthening layer is represented in layer 8. Layer 7 is used for
earlier times to illustrate the flow patterns at the same level as the liner. At later times, after the liner has been constructed, layer 8 is used to show the groundwater flow directions at the primary level of interest.
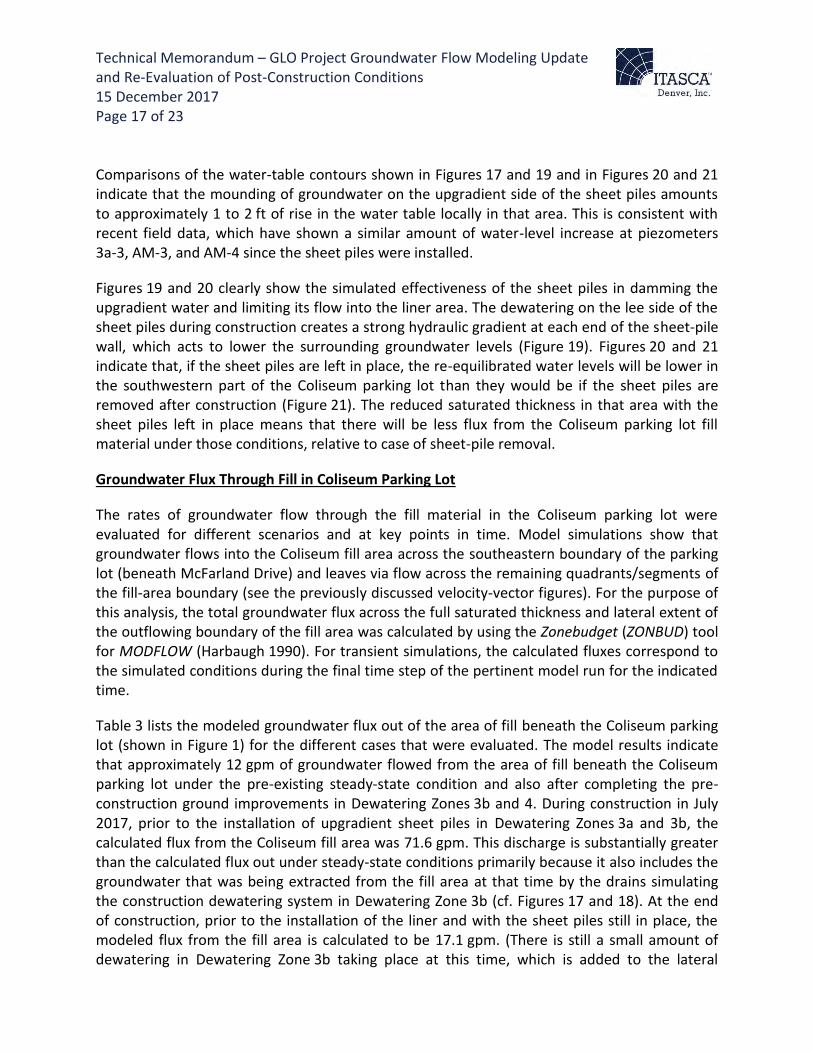
Technical Memorandum – GLO Project Groundwater Flow Modeling Update and Re-Evaluation of Post-Construction Conditions 15 December 2017 Page 17 of 23
Comparisons of the water-table contours shown in Figures 17 and 19 and in Figures 20 and 21 indicate that the mounding of groundwater on the upgradient side of the sheet piles amounts to approximately 1 to 2 ft of rise in the water table locally in that area. This is consistent with recent field data, which have shown a similar amount of water-level increase at piezometers 3a-3, AM-3, and AM-4 since the sheet piles were installed.
Figures 19 and 20 clearly show the simulated effectiveness of the sheet piles in damming the upgradient water and limiting its flow into the liner area. The dewatering on the lee side of the sheet piles during construction creates a strong hydraulic gradient at each end of the sheet-pile wall, which acts to lower the surrounding groundwater levels (Figure 19). Figures 20 and 21 indicate that, if the sheet piles are left in place, the re-equilibrated water levels will be lower in the southwestern part of the Coliseum parking lot than they would be if the sheet piles are removed after construction (Figure 21). The reduced saturated thickness in that area with the sheet piles left in place means that there will be less flux from the Coliseum parking lot fill material under those conditions, relative to case of sheet-pile removal.
Groundwater Flux Through Fill in Coliseum Parking Lot
The rates of groundwater flow through the fill material in the Coliseum parking lot were evaluated for different scenarios and at key points in time. Model simulations show that groundwater flows into the Coliseum fill area across the southeastern boundary of the parking lot (beneath McFarland Drive) and leaves via flow across the remaining quadrants/segments of the fill-area boundary (see the previously discussed velocity-vector figures). For the purpose of this analysis, the total groundwater flux across the full saturated thickness and lateral extent of the outflowing boundary of the fill area was calculated by using the Zonebudget (ZONBUD) tool for MODFLOW (Harbaugh 1990). For transient simulations, the calculated fluxes correspond to the simulated conditions during the final time step of the pertinent model run for the indicated time.
Table 3 lists the modeled groundwater flux out of the area of fill beneath the Coliseum parking lot (shown in Figure 1) for the different cases that were evaluated. The model results indicate that approximately 12 gpm of groundwater flowed from the area of fill beneath the Coliseum parking lot under the pre-existing steady-state condition and also after completing the pre-construction ground improvements in Dewatering Zones 3b and 4. During construction in July 2017, prior to the installation of upgradient sheet piles in Dewatering Zones 3a and 3b, the calculated flux from the Coliseum fill area was 71.6 gpm. This discharge is substantially greater than the calculated flux out under steady-state conditions primarily because it also includes the groundwater that was being extracted from the fill area at that time by the drains simulating the construction dewatering system in Dewatering Zone 3b (cf. Figures 17 and 18). At the end of construction, prior to the installation of the liner and with the sheet piles still in place, the modeled flux from the fill area is calculated to be 17.1 gpm. (There is still a small amount of dewatering in Dewatering Zone 3b taking place at this time, which is added to the lateral
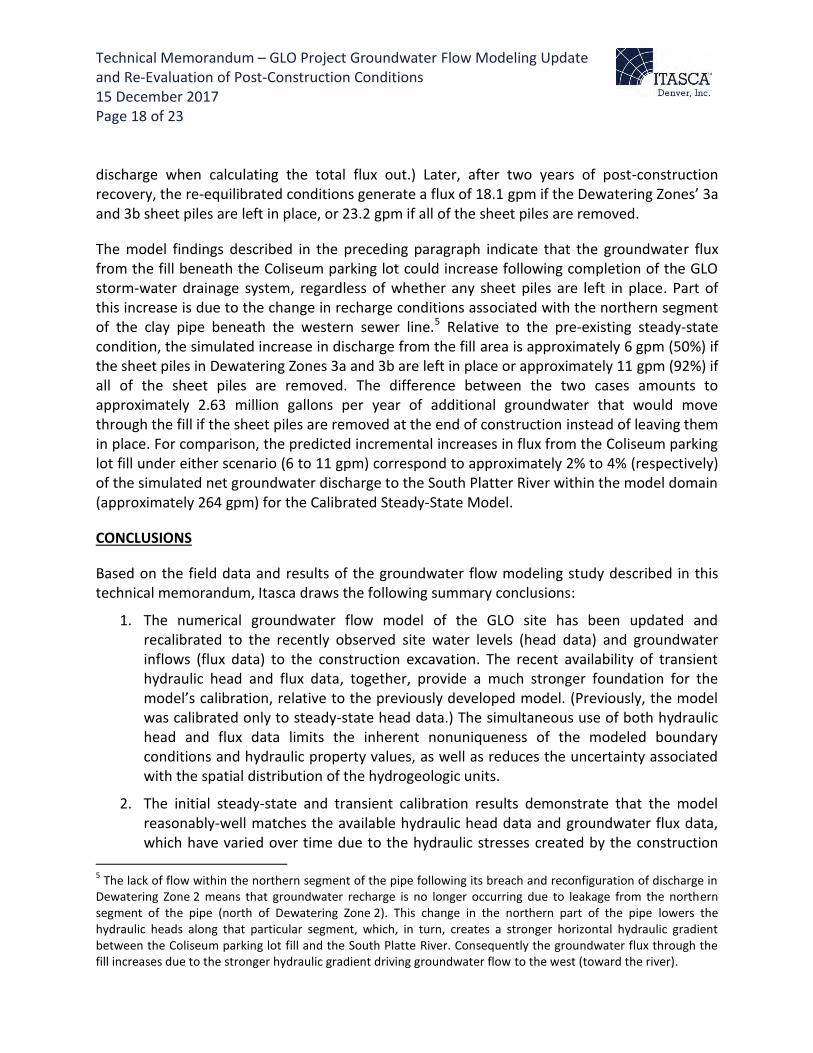
Technical Memorandum – GLO Project Groundwater Flow Modeling Update and Re-Evaluation of Post-Construction Conditions 15 December 2017 Page 18 of 23
discharge when calculating the total flux out.) Later, after two years of post-construction recovery, the re-equilibrated conditions generate a flux of 18.1 gpm if the Dewatering Zones’ 3a and 3b sheet piles are left in place, or 23.2 gpm if all of the sheet piles are removed.
The model findings described in the preceding paragraph indicate that the groundwater flux from the fill beneath the Coliseum parking lot could increase following completion of the GLO storm-water drainage system, regardless of whether any sheet piles are left in place. Part of this increase is due to the change in recharge conditions associated with the northern segment of the clay pipe beneath the western sewer line.5 Relative to the pre-existing steady-state condition, the simulated increase in discharge from the fill area is approximately 6 gpm (50%) if the sheet piles in Dewatering Zones 3a and 3b are left in place or approximately 11 gpm (92%) if all of the sheet piles are removed. The difference between the two cases amounts to approximately 2.63 million gallons per year of additional groundwater that would move through the fill if the sheet piles are removed at the end of construction instead of leaving them in place. For comparison, the predicted incremental increases in flux from the Coliseum parking lot fill under either scenario (6 to 11 gpm) correspond to approximately 2% to 4% (respectively) of the simulated net groundwater discharge to the South Platter River within the model domain (approximately 264 gpm) for the Calibrated Steady-State Model.
CONCLUSIONS
Based on the field data and results of the groundwater flow modeling study described in this technical memorandum, Itasca draws the following summary conclusions:
1. The numerical groundwater flow model of the GLO site has been updated and recalibrated to the recently observed site water levels (head data) and groundwater inflows (flux data) to the construction excavation. The recent availability of transient hydraulic head and flux data, together, provide a much stronger foundation for the model’s calibration, relative to the previously developed model. (Previously, the model was calibrated only to steady-state head data.) The simultaneous use of both hydraulic head and flux data limits the inherent nonuniqueness of the modeled boundary conditions and hydraulic property values, as well as reduces the uncertainty associated with the spatial distribution of the hydrogeologic units.
2. The initial steady-state and transient calibration results demonstrate that the model reasonably-well matches the available hydraulic head data and groundwater flux data, which have varied over time due to the hydraulic stresses created by the construction
5 The lack of flow within the northern segment of the pipe following its breach and reconfiguration of discharge in
Dewatering Zone 2 means that groundwater recharge is no longer occurring due to leakage from the northern segment of the pipe (north of Dewatering Zone 2). This change in the northern part of the pipe lowers the hydraulic heads along that particular segment, which, in turn, creates a stronger horizontal hydraulic gradient between the Coliseum parking lot fill and the South Platte River. Consequently the groundwater flux through the fill increases due to the stronger hydraulic gradient driving groundwater flow to the west (toward the river).
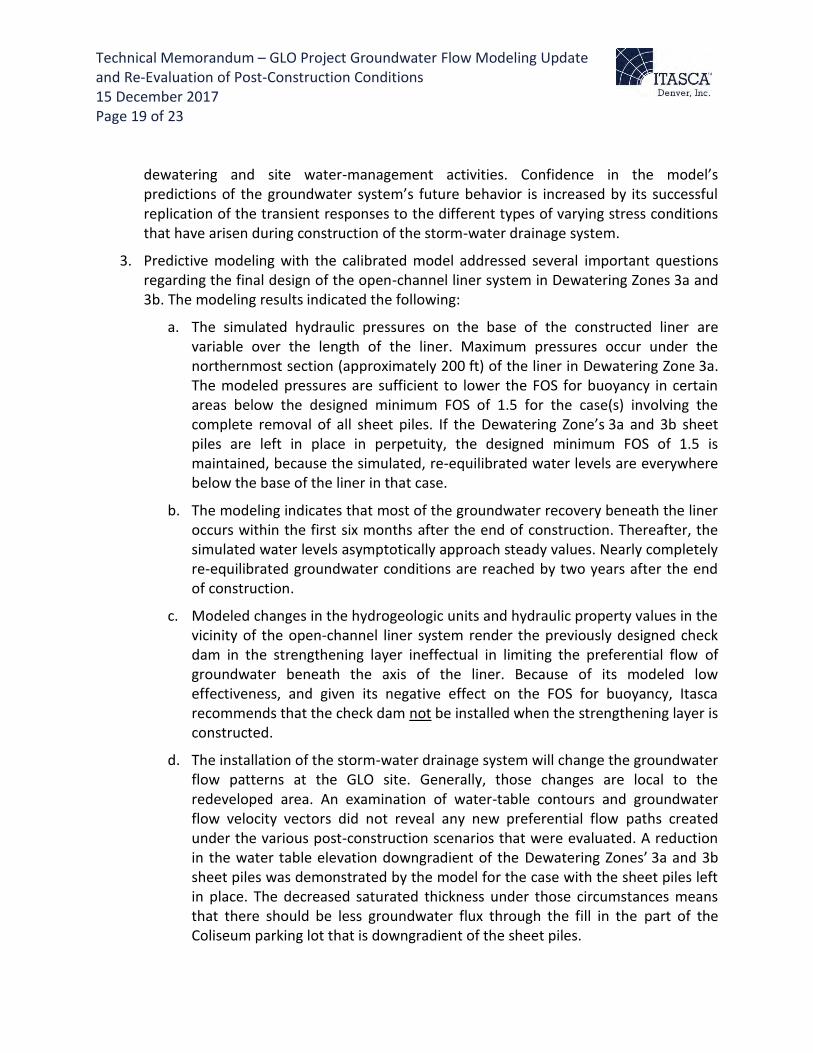
Technical Memorandum – GLO Project Groundwater Flow Modeling Update and Re-Evaluation of Post-Construction Conditions 15 December 2017 Page 19 of 23
dewatering and site water-management activities. Confidence in the model’s predictions of the groundwater system’s future behavior is increased by its successful replication of the transient responses to the different types of varying stress conditions that have arisen during construction of the storm-water drainage system.
3. Predictive modeling with the calibrated model addressed several important questions regarding the final design of the open-channel liner system in Dewatering Zones 3a and 3b. The modeling results indicated the following:
a. The simulated hydraulic pressures on the base of the constructed liner are variable over the length of the liner. Maximum pressures occur under the northernmost section (approximately 200 ft) of the liner in Dewatering Zone 3a. The modeled pressures are sufficient to lower the FOS for buoyancy in certain areas below the designed minimum FOS of 1.5 for the case(s) involving the complete removal of all sheet piles. If the Dewatering Zone’s 3a and 3b sheet piles are left in place in perpetuity, the designed minimum FOS of 1.5 is maintained, because the simulated, re-equilibrated water levels are everywhere below the base of the liner in that case.
b. The modeling indicates that most of the groundwater recovery beneath the liner occurs within the first six months after the end of construction. Thereafter, the simulated water levels asymptotically approach steady values. Nearly completely re-equilibrated groundwater conditions are reached by two years after the end of construction.
c. Modeled changes in the hydrogeologic units and hydraulic property values in the vicinity of the open-channel liner system render the previously designed check dam in the strengthening layer ineffectual in limiting the preferential flow of groundwater beneath the axis of the liner. Because of its modeled low effectiveness, and given its negative effect on the FOS for buoyancy, Itasca recommends that the check dam not be installed when the strengthening layer is constructed.
d. The installation of the storm-water drainage system will change the groundwater flow patterns at the GLO site. Generally, those changes are local to the redeveloped area. An examination of water-table contours and groundwater flow velocity vectors did not reveal any new preferential flow paths created under the various post-construction scenarios that were evaluated. A reduction in the water table elevation downgradient of the Dewatering Zones’ 3a and 3b sheet piles was demonstrated by the model for the case with the sheet piles left in place. The decreased saturated thickness under those circumstances means that there should be less groundwater flux through the fill in the part of the Coliseum parking lot that is downgradient of the sheet piles.
Technical Memorandum – GLO Project Groundwater Flow Modeling Update and Re-Evaluation of Post-Construction Conditions 15 December 2017 Page 20 of 23
e. The rates of groundwater flow through the fill material in the Coliseum parking lot were evaluated for different scenarios and at key points in time. The model results indicate that the groundwater flux from the fill beneath the Coliseum parking lot could increase following completion of the GLO storm-water drainage system, regardless of whether any sheet piles are left in place. Part of this modeled increase is due to the change in recharge conditions associated with the northern segment of the clay pipe beneath the western sewer line.
Including this effect, the simulated increase in groundwater discharge from the fill area is approximately 50% more (6 gpm) than it is under the pre-existing steady-state condition (12 gpm), if the sheet piles in Dewatering Zones 3a and 3b are left in place. If all of the sheet piles are removed following construction, then the modeling indicates an increased flux from the parking lot fill material of approximately 92% (11 gpm), relative to the pre-existing steady-state condition. The difference between these two cases amounts to approximately 2.63 million gallons per year of additional groundwater that would move through the fill if the sheet piles are removed at the end of construction. For comparison, the predicted incremental increases in flux from the Coliseum parking lot fill under either scenario (6 to 11 gpm) correspond to approximately 2% to 4% (respectively) of the simulated net groundwater discharge to the South Platter River within the model domain (approximately 264 gpm) for the Calibrated Steady-State Model.
LIMITATIONS
The services undertaken in completing this study and technical memorandum were performed consistent with generally accepted professional consulting principles and practices. No other warranty, expressed or implied, is made. This document is solely for the use and information of our client unless otherwise noted. Any reliance on this document by a third party is at such party’s sole risk.
Opinions and recommendations contained in this document apply to conditions existing when services were performed and are intended only for the client, purposes, locations, time frames, and project parameters indicated herein. We are not responsible for the impacts of any changes in environmental standards, practices, or regulations subsequent to performance of services. We do not warrant the accuracy of information supplied by others, or the use of segregated portions of this document.
Technical Memorandum – GLO Project Groundwater Flow Modeling Update and Re-Evaluation of Post-Construction Conditions 15 December 2017 Page 21 of 23
REFERENCES
CCD. 2017. Personal communication (email) between Brian McLaren (City and County of Denver), Dan Stone (Itasca Denver, Inc.), and six others, 26 July.
EMSI. 2016. Final design report environmental components for Globeville Landing Outfall Project, Vasquez Boulevard/Interstate 70 Site, Operable Unit #2 Removal Action. Prepared for City and County of Denver by Engineering Management Support, Inc., 5 February.
EMSI. 2017. Personal communication (phone conversation) between Timothy Shangraw (Environmental Management Support, Inc.) and Dan Stone (Itasca Denver, Inc.), 14 December.
Harbaugh, A.W. 1990. A computer program for calculating subregional water budgets using results from the U.S. Geological Survey modular three-dimensional ground-water flow model. U.S. Geological Survey Open-File Report 90-392.
HRS. 2017. Personal communication (email) between Matt Seitz (HRS Water Consultants, Inc.), Dan Stone (Itasca Denver, Inc.), and Timothy Shangraw (Environmental Management Support, Inc.), 31 July.
HGL. 2011. MODHMS/MODFLOW-SURFAC: A comprehensive MODFLOW-based hydrologic modeling system, version 4.0, code documentation report. Reston, VA: HydroGeoLogic Inc.
Itasca. 2015a. Groundwater flow modeling for Globeville Landing Outfall Project Construction Dewatering Study. Technical memorandum prepared for Engineering Management Support, Inc. by Itasca Denver, Inc., 26 October.
Itasca. 2015b. Globeville Landing Outfall Project Construction Dewatering Study, Phase 2. Technical memorandum prepared for Engineering Management Support, Inc. by Itasca Denver, Inc., 4 December.
Itasca. 2016a. Globeville Landing Outfall Project Construction Dewatering Study, Phase 3 – Groundwater Flow Modeling. Technical memorandum prepared for Engineering Management Support, Inc. by Itasca Denver, Inc., 25 January.
Itasca. 2016b. Globeville Landing Outfall Project Construction Dewatering Study, Phase 4 – Hydrologic Tests to Confirm Modeling Assumptions. Technical memorandum prepared for Engineering Management Support, Inc. by Itasca Denver, Inc., 3 August.
McDonald, M.G., and A.W. Harbaugh. 1988. A modular three-dimensional finite-difference ground-water flow model. Techniques of Water-Resources Investigations, Book 6. Washington, DC: US Geological Survey/US Government Printing Office.
Technical Memorandum – GLO Project Groundwater Flow Modeling Update and Re-Evaluation of Post-Construction Conditions 15 December 2017 Page 22 of 23
40thMerrick & Company. 2015. Supplemental Geotechnical Investigation Street Outfall Northwest of 40th and Blake Streets to Globeville Landing Park, Denver, Colorado.
Merrick & Company. 2017. Personal communication (email) between Jeanne Boyle (Merrick & Company), Dan Stone (Itasca Denver, Inc.), and Timothy Shangraw (Environmental Management Support, Inc.), 8 August.
Reddy, K.R., H. Hettiarachchi, N. Parakalla, J. Gangathulasi, J. Bogner, and T. Lagier. 2009. Hydraulic conductivity of MSW landfills. Journal of Environmental Engineering, V. 135, No. 8, p. 677-683.
Smith, R.O., P.A. Schneider, and L.R. Petri. 1964. Ground-water resources of the South Platte River Basin in western Adams and southwestern Weld Counties, Colorado. U.S. Geological Survey Water Supply Paper 1658. Washington, DC: US Geological Survey/US Government Printing Office.
University of Southampton. 2015. Hydraulic conductivity of landfilled waste. https://landss.soton.ac.uk/waste_k (accessed 28 August 2015).
Wilson, W.W. 1965. Pumping tests in Colorado. Colorado Water Conservation Board Circular 11.
Attachments: Figure 1 – Groundwater Model Study Area Figure 2 – Map View of Model Grid and Boundary Conditions Figure 3 – Modeled Distribution of Hydrogeologic Units and Recharge at Ground
Surface Figure 4 – Piezometers and Wells Used as Targets in Model Calibration Figure 5 – Simulated Steady-State Groundwater Elevations Figure 6 – Comparison of Simulated and Observed Steady-State Groundwater
Levels Figure 7 – Spatial Distribution of Steady-State Model Calibration Residuals Figure 8 – Modeled Pre-Construction Groundwater Levels After Installing
Vibro Piers™ and Compaction Grouting Figure 9 – Simulated Locations of Drains Representing Construction Dewatering
Areas in July 2017 Figure 10 – Map View of Transient Hydraulic Boundary Conditions (Sheet Piles,
Arkins Outfall, and Sewer Line Underdrain) Figure 11 – Simulated and Recorded Construction Dewatering Rates Figure 12 – Hydrographs of Simulated and Observed Groundwater Levels Figure 13 – Globeville Landing Outfall Project – Main Components of Final Design Figure 14 – Simulated Hydraulic Head Beneath Centerline of Liner Two Years
After Installation Figure 15 – Simulated Hydraulic Head Beneath Centerline of Liner Over Time at
Selected Locations
Technical Memorandum – GLO Project Groundwater Flow Modeling Update and Re-Evaluation of Post-Construction Conditions 15 December 2017 Page 23 of 23
Figure 16 – Simulated Water-Table Contours and Flow Vectors in Model Layer 7 Under Steady-State Conditions
Figure 17 – Simulated Water-Table Contours and Flow Vectors in Model Layer 7 Under Steady-State Conditions After Ground Improvements
Figure 18 – Simulated Water-Table Contours and Flow Vectors in Model Layer 7 Prior to Installation of Upgradient Sheet Piles
Figure 19 – Simulated Water-Table Contours and Flow Vectors in Model Layer 7 Prior to Placement of Liner
Figure 20 – Simulated Water-Table Contours and Flow Vectors in Model Layer 8 Two Years After Placement of Liner with Sheet Piles Left in Place
Figure 21 – Simulated Water-Table Contours and Flow Vectors in Model Layer 8 Two Years After Placement of Liner with Sheet Piles Removed
Table 1 – Modeled Hydraulic Property Values of Hydrogeologic Units Table 2 – Steady-State Model Calibration Statistics Table 3 – Simulated Groundwater Flow From Fill in Coliseum Parking Lot Attachment A – Hydrogeologic Units in Model Layers
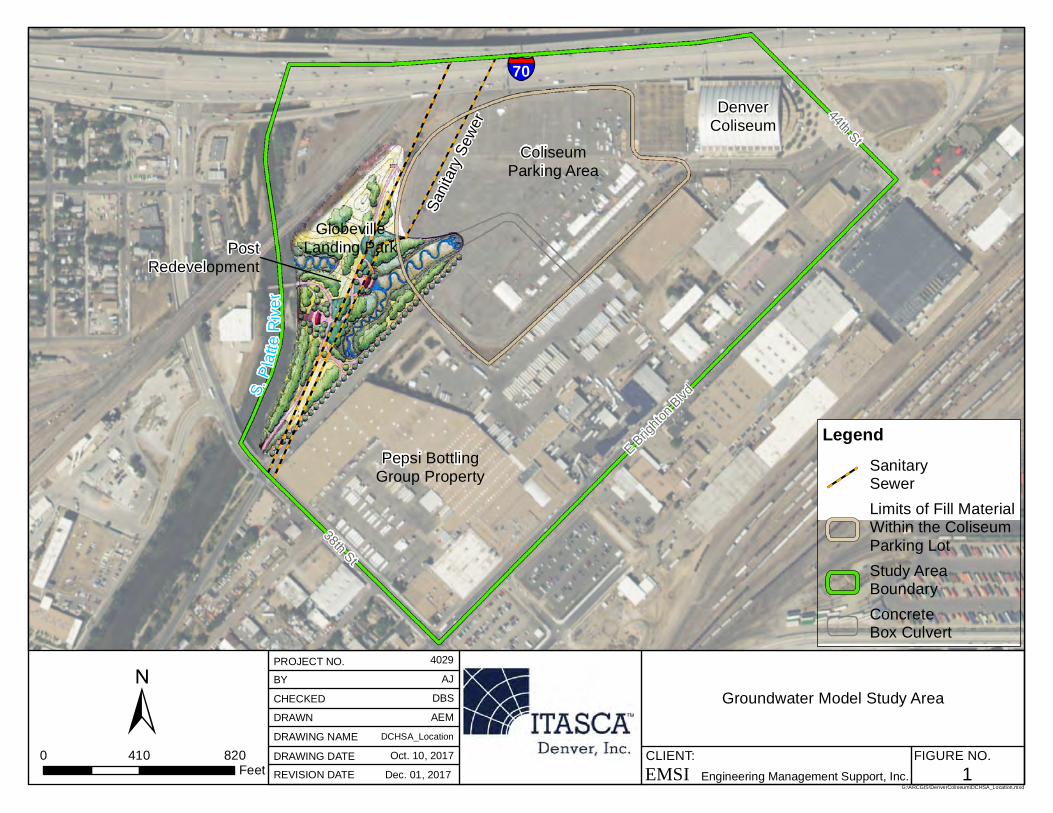
44th St
E BrightonBlvd
38th St
§̈¦70
S.P latteR
iver
DenverColiseum
SanitarySewer
GlobevilleLanding Park
ColiseumParking Area
Pepsi BottlingGroup Property
PostRedevelopment
PROJECT NO.
DRAWN
4029
Groundwater Model Study AreaCHECKED BY
DRAWING NAME DRAWING DATE REVISION DATE
Oct. 10, 2017 DCHSA_Location
AEM
Engineering Management Support, Inc. CLIENT: FIGURE NO.
1
AJ DBS
G:\ARCGIS\DenverColiseum\DCHSA_Location.mxd
0 410 820Feet
±
LegendSanitarySewerLimits of Fill MaterialWithin the ColiseumParking LotStudy AreaBoundaryConcreteBox Culvert
EMSIDec. 01, 2017
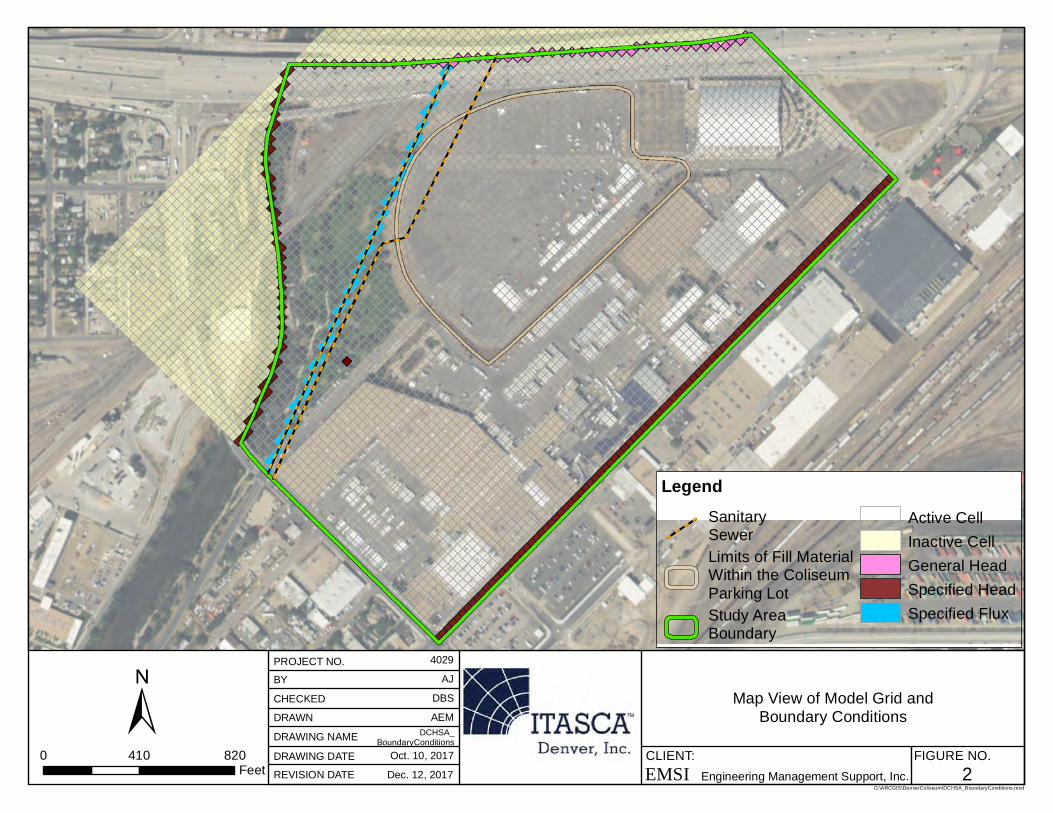
PROJECT NO.
DRAWN
4029
Map View of Model Grid and Boundary Conditions
CHECKED BY
DRAWING NAME DRAWING DATE REVISION DATE
Oct. 10, 2017 DCHSA_
BoundaryConditions
AEM
CLIENT: FIGURE NO.2
AJ DBS
G:\ARCGIS\DenverColiseum\DCHSA_BoundaryConditions.mxd
LegendSanitary SewerLimits of Fill MaterialWithin the Coliseum Parking LotStudy AreaBoundary
Active CellInactive CellGeneral Head Specified Head Specified Flux
Engineering Management Support, Inc. EMSIDec. 12, 2017
± 0 410 820
Feet
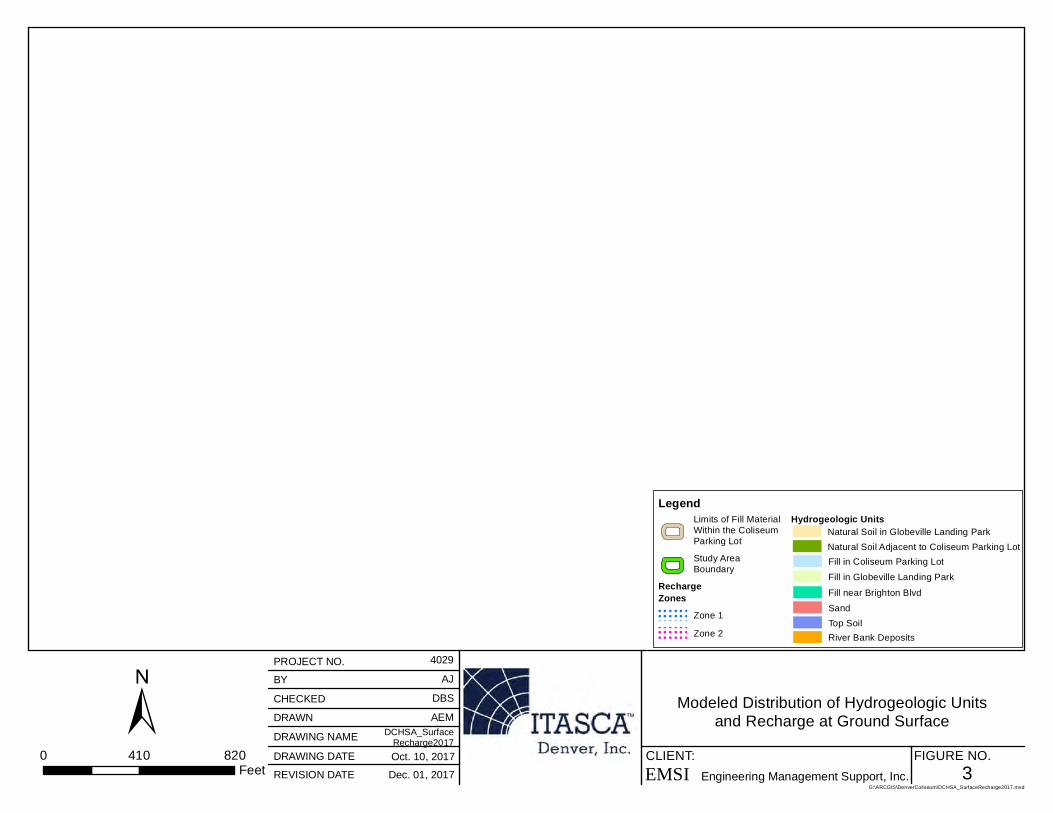
± PROJECT NO. 4029 BY AJ CHECKED DBS DRAWN AEM
DCHSA_SurfaceDRAWING NAME Recharge2017 0 410 820
FeeDRAWING DATE Oct. 10, 2017
t REVISION DATE Dec. 01, 2017
LegendLimits of Fill Material Hydrogeologic UnitsWithin the Coliseum Natural Soil in Globeville Landing Park Parking Lot Natural Soil Adjacent to Coliseum Parking Lot Study Area Fill in Coliseum Parking LotBoundary Fill in Globeville Landing Park
Recharge Fill near Brighton Blvd Zones Sand! ! ! ! ! !
! ! ! ! ! ! Zone 1 ! ! ! ! ! ! Top Soil! ! ! ! ! !
! ! ! ! ! !
! ! ! ! ! ! Zone 2 River Bank Deposits
Modeled Distribution of Hydrogeologic Unitsand Recharge at Ground Surface
CLIENT: FIGURE NO.3EMSI Engineering Management Support, Inc.
G:\ARCGIS\DenverColiseum\DCHSA_SurfaceRecharge2017.mxd
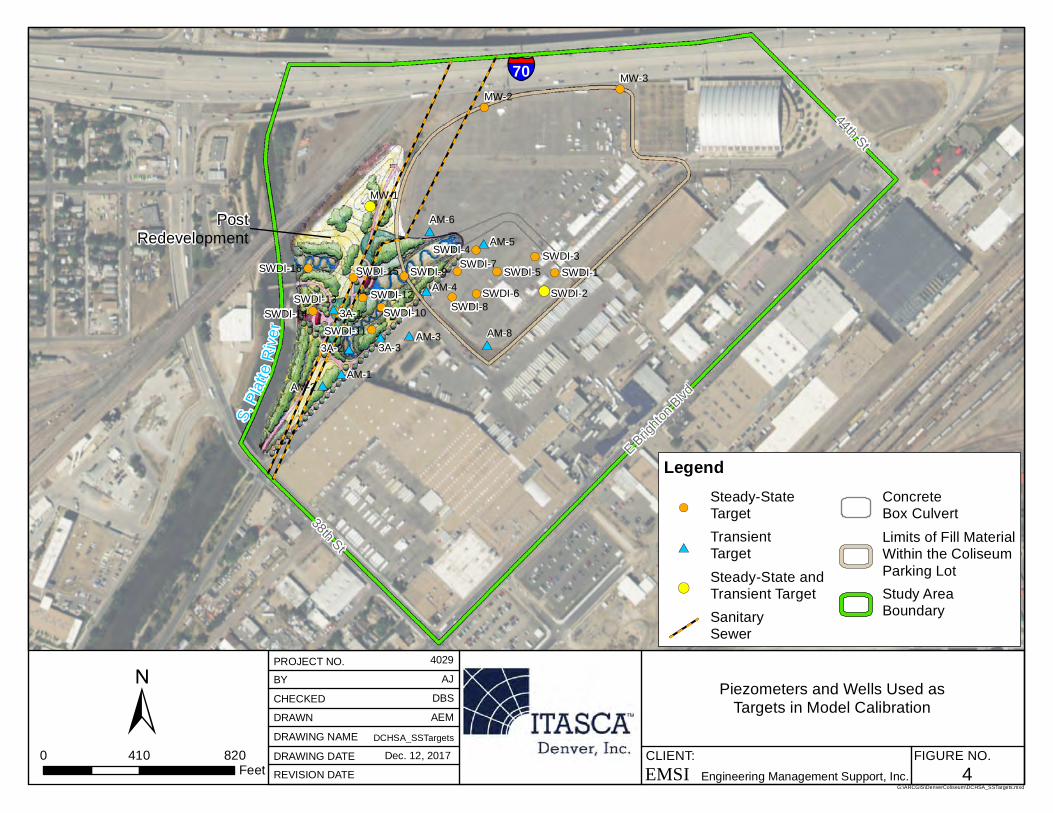
!(
!(
!(!(
!(
!(
!(
!(
!(
!(
!(
!( !(!(
!( !(
!(
!(
!(
!(
!(
#* #*
#*
#*
#* #*
#*
#* #*
#*
44th St
E BrightonBlvd
38th St
§̈¦70
S.PlatteRive r
PostRedevelopment
AM-1AM-2
AM-3
AM-4
AM-5 AM-6
3A-1 AM-8
3A-33A-2
SWDI-1 SWDI-2
SWDI-3SWDI-4 SWDI-5
SWDI-6
SWDI-7
SWDI-8
SWDI-9
SWDI-10 SWDI-11
SWDI-12SWDI-13SWDI-14
SWDI-15SWDI-16
MW-1
MW-2 MW-3
PROJECT NO.
DRAWN
4029
Piezometers and Wells Used asTargets in Model CalibrationCHECKED
BY
DRAWING NAME DRAWING DATE REVISION DATE
Dec. 12, 2017DCHSA_SSTargets
AEM
CLIENT: FIGURE NO.4
AJ DBS
G:\ARCGIS\DenverColiseum\DCHSA_SSTargets.mxd
0 410 820Feet
±
Legend !(
Steady-StateTarget
#* TransientTarget
!( Steady-State andTransient TargetSanitarySewer
ConcreteBox CulvertLimits of Fill MaterialWithin the ColiseumParking LotStudy AreaBoundary
Engineering Management Support, Inc.EMSI
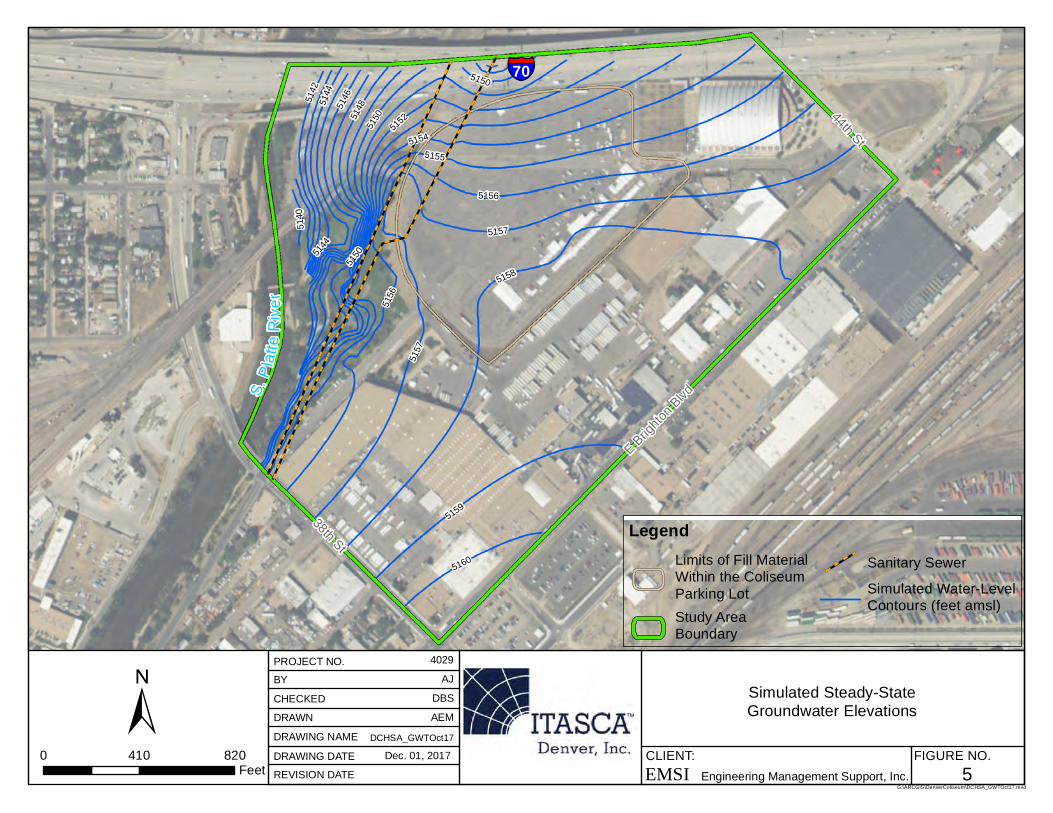
44th St
E BrightonBlvd
38th St
§̈¦70
S.P latteR
iver
5158
5157
5156
51555154
5152
51505144
51505148
5160
5159
5146
5150
51445142
5140
5157
5156
PROJECT NO.
DRAWN
4029
Simulated Steady-StateGroundwater ElevationsCHECKED
BY
DRAWING NAME DRAWING DATE REVISION DATE
Dec. 01, 2017DCHSA_GWTOct17
AEM
CLIENT: FIGURE NO.5
AJ DBS
G:\ARCGIS\DenverColiseum\DCHSA_GWTOct17.mxd
0 410 820Feet
±
LegendLimits of Fill MaterialWithin the ColiseumParking LotStudy AreaBoundary
Sanitary SewerSimulated Water-LevelContours (feet amsl)
Engineering Management Support, Inc.EMSI
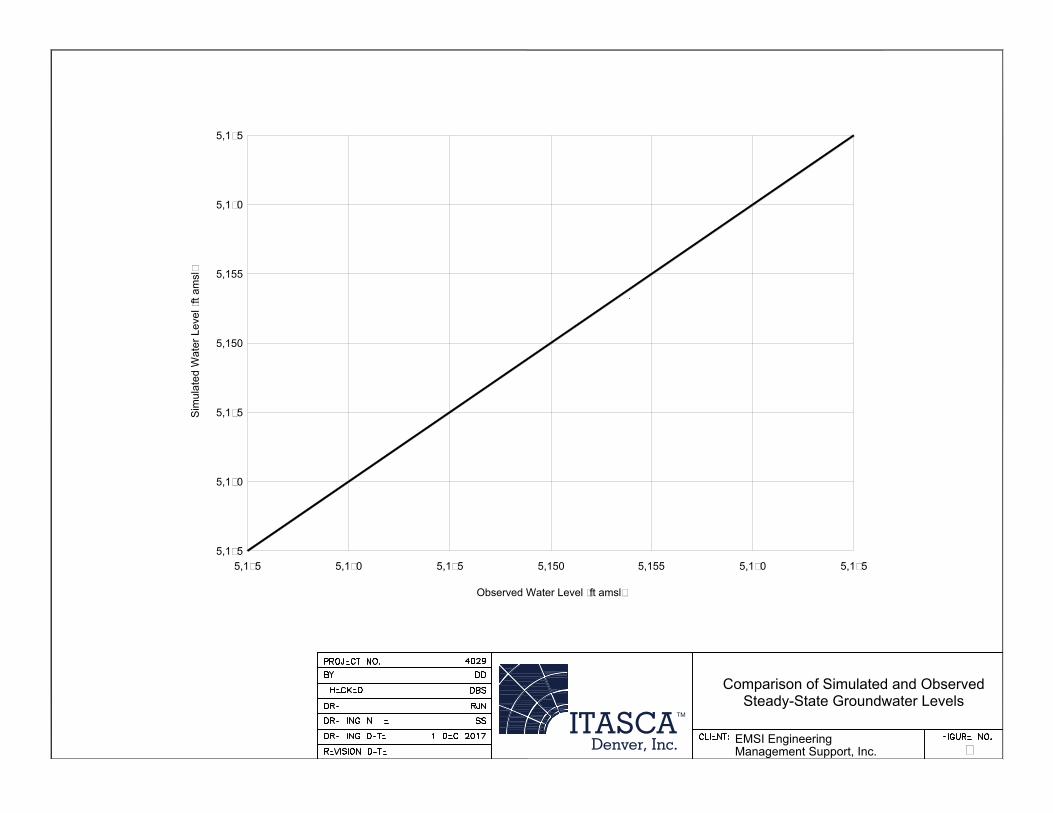
Sim
ula
te
d W
ate
r L
eve
l (ft a
msl)
5,165
5,160
5,155
5,150
5,145
5,140
5,135
5,135 5,140 5,145 5,150
Observed Water Level (ft amsl)
5,155 5,160 5,165
Comparison of Simulated and Observed
Steady-State Groundwater Levels
Management Support, Inc. 6
ITASCATM
Denver, Inc. EMSI Engineering
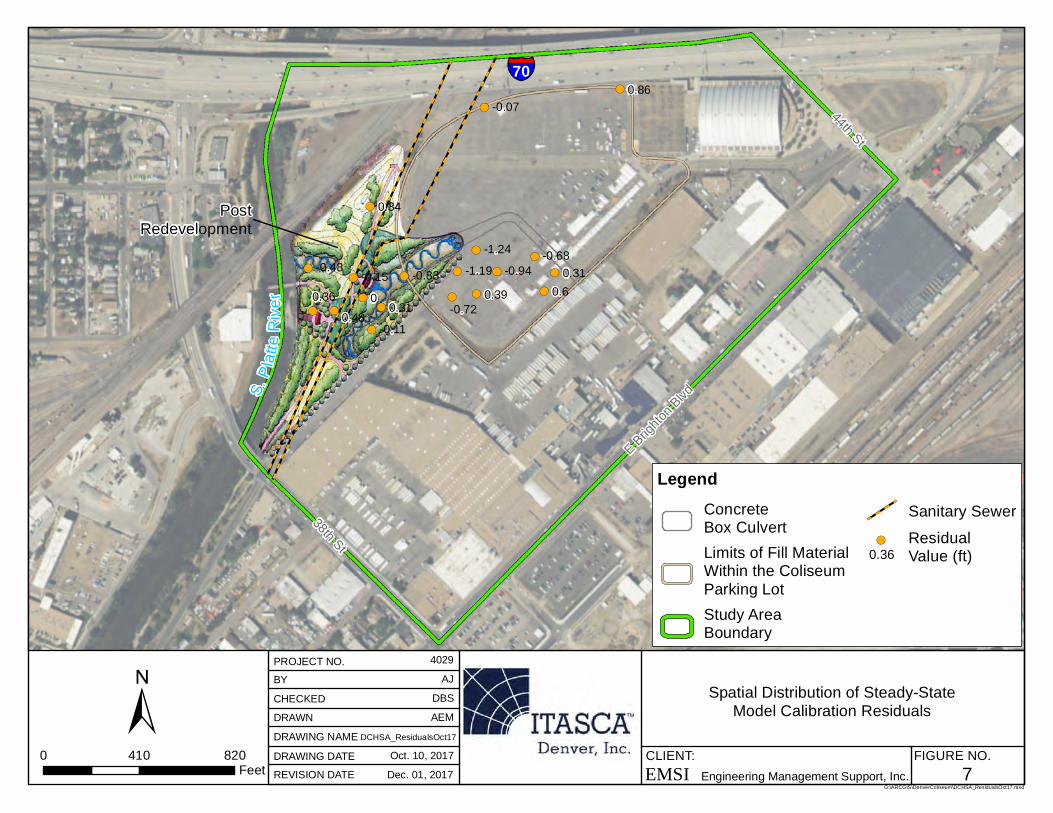
!(
!(
!(
!(!(
!(
!(
!(
!(
!(
!(
!(
!( !(!(
!( !(
!(
!(
!(
44th St
E BrightonBlvd
38th St
§̈¦70
S.P latteR
iver
PostRedevelopment
0.310.6
-0.68-1.24 -0.94
0.39 -1.19
-0.72
-0.83
0.31 -0.11
00.48
0.36 -0.15-0.48
0.34
-0.07 0.86
PROJECT NO.
DRAWN
4029
Spatial Distribution of Steady-StateModel Calibration ResidualsCHECKED
BY
DRAWING NAME DRAWING DATE REVISION DATE
Oct. 10, 2017DCHSA_ResidualsOct17
AEM
CLIENT: FIGURE NO.7
AJ DBS
G:\ARCGIS\DenverColiseum\DCHSA_ResidualsOct17.mxd
0 410 820Feet
±
LegendConcreteBox CulvertLimits of Fill MaterialWithin the ColiseumParking LotStudy AreaBoundary
Sanitary Sewer ResidualValue (ft)
Engineering Management Support, Inc.EMSIDec. 01, 2017
0.36!(
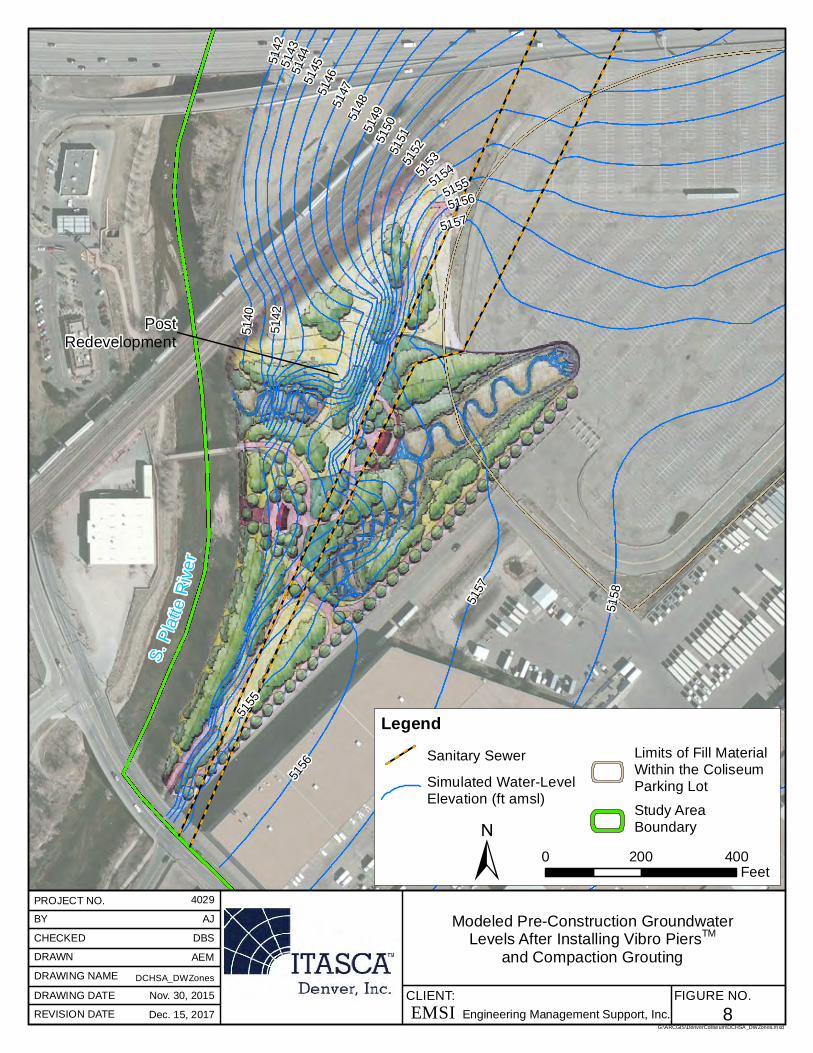
5159
§¦
S.PlatteRiver
PostRedevelopment
51555154515
351525151515051495148514751465145
5156
5142
51585157
51435142
5140
5144
5157
5156
5155
PROJECT NO.
DRAWN
4029 Modeled Pre-Construction GroundwaterLevels After Installing Vibro PiersTM
and Compaction Grouting CHECKED BY
DRAWING NAME DRAWING DATE REVISION DATE
Nov. 30, 2015DCHSA_DWZones
AEM
CLIENT: FIGURE NO.8
AJ DBS
G:\ARCGIS\DenverColiseum\DCHSA_DWZones.mxd
LegendSanitary Sewer Simulated Water-LevelElevation (ft amsl)
Limits of Fill MaterialWithin the ColiseumParking Lot Study AreaBoundary
0 200 400Feet±
Engineering Management Support, Inc.EMSIDec. 15, 2017
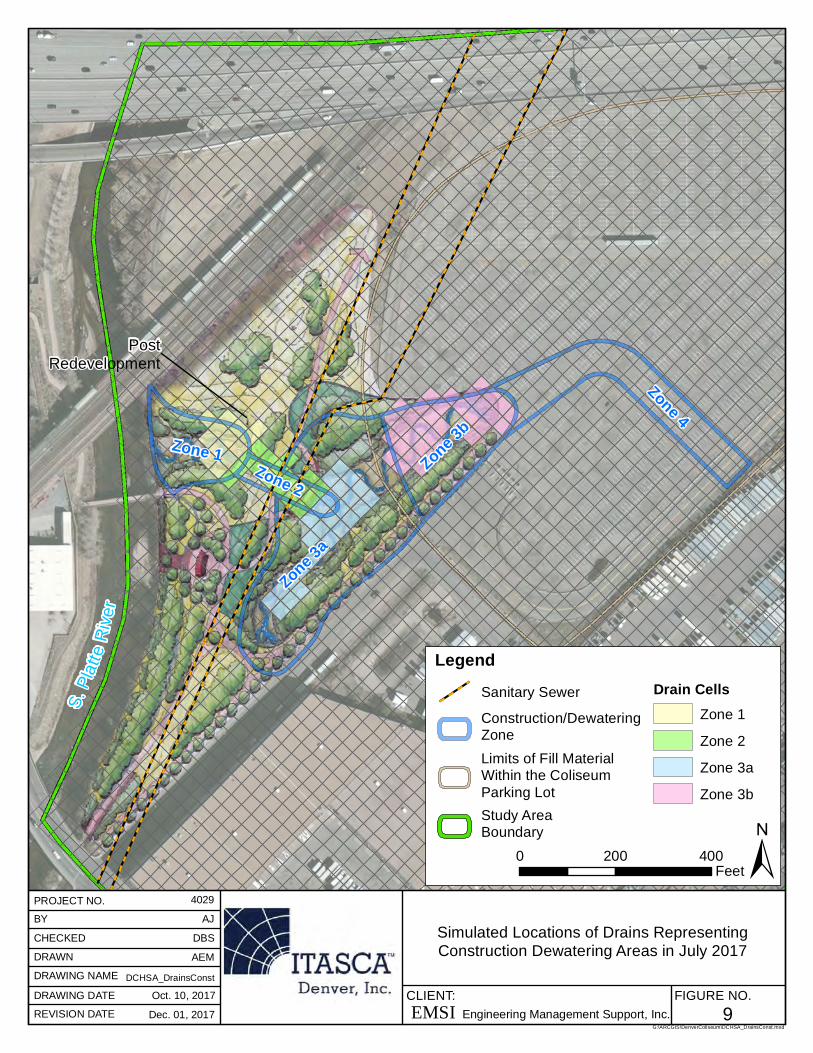
Zone 4 b 3Zone 1 Zone 2
enoZ
a 3enoZ
S.PlatteRiver
PostRedevelopment
LegendDrain CellsSanitary Sewer
Zone 1Construction/DewateringZone Zone 2Limits of Fill Material Zone 3aWithin the ColiseumParking Lot Zone 3bStudy AreaBoundary
0 200 400Feet ±
4029PROJECT NO. BY AJ
Simulated Locations of Drains RepresentingCHECKED DBS Construction Dewatering Areas in July 2017DRAWN AEM DRAWING NAME DCHSA_DrainsConst DRAWING DATE Oct. 10, 2017 CLIENT: FIGURE NO.REVISION DATE Dec. 01, 2017 EMSI Engineering Management Support, Inc. 9
G:\ARCGIS\DenverColiseum\DCHSA_DrainsConst.mxd
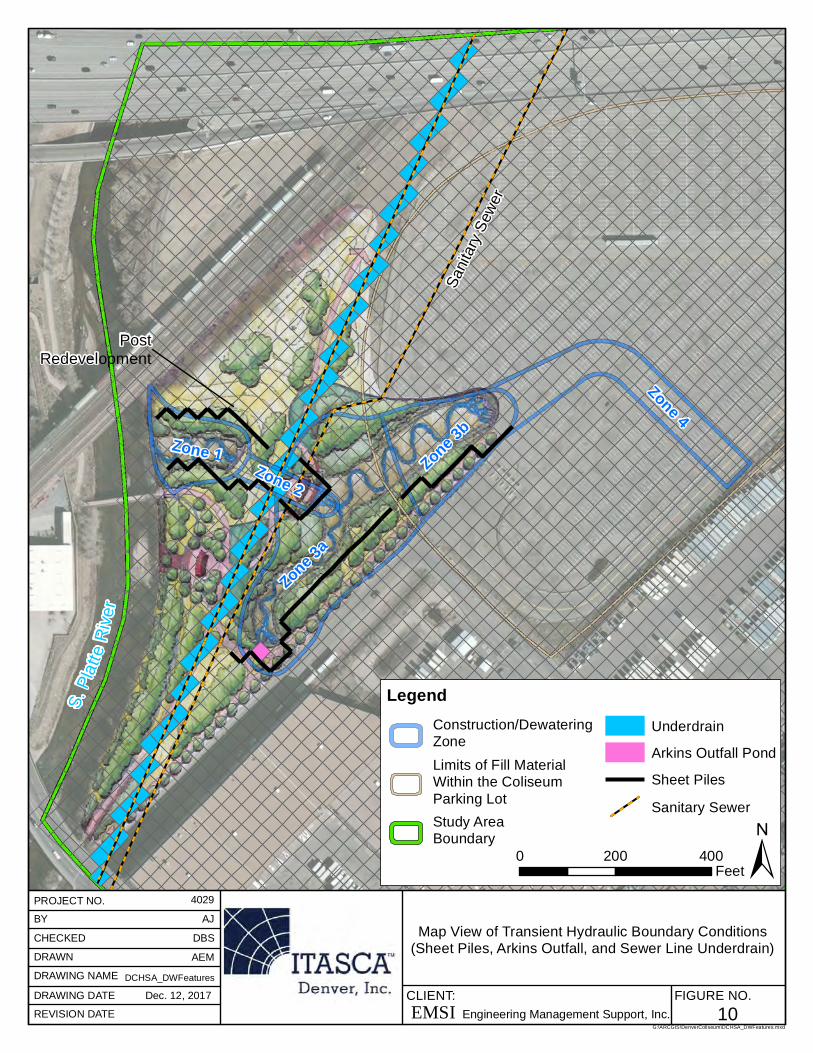
SanitarySewer
Zone 4 b 3Zone 1 Zone 2
enoZ
a 3enoZ
S.PlatteRiver
PostRedevelopment
LegendConstruction/Dewatering UnderdrainZone Arkins Outfall PondLimits of Fill MaterialWithin the Coliseum Sheet PilesParking Lot Sanitary SewerStudy AreaBoundary
0 200 400Feet ±
4029PROJECT NO. BY AJ CHECKED DBS Map View of Transient Hydraulic Boundary Conditions DRAWN AEM (Sheet Piles, Arkins Outfall, and Sewer Line Underdrain)DRAWING NAME DCHSA_DWFeatures DRAWING DATE Dec. 12, 2017 CLIENT: FIGURE NO.REVISION DATE EMSI Engineering Management Support, Inc. 10
G:\ARCGIS\DenverColiseum\DCHSA_DWFeatures.mxd
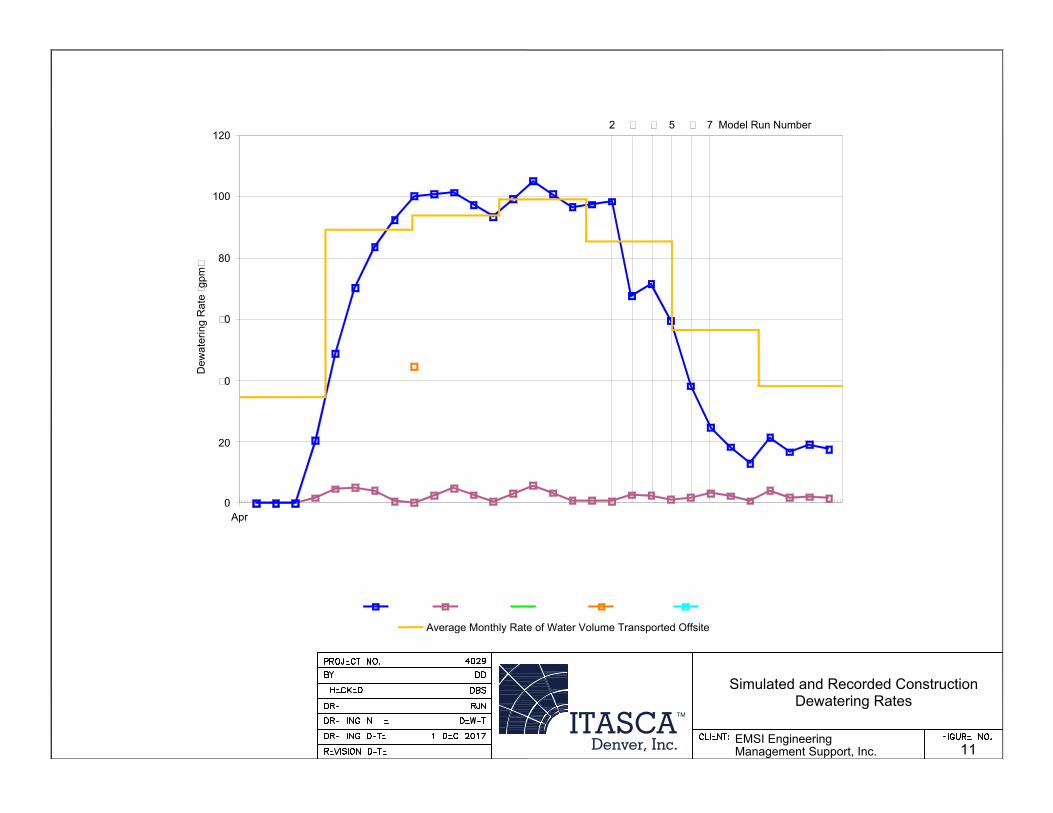
2017
Total Zone 1 Zone 2 Zone 3a Zone 3b
May Jun Jul Aug Sep Oct
2 3 4 5 6 7 Model Run Number
De
wa
te
rin
g R
ate
(g
pm
)
120
100
80
60
40
20
0
Apr
Average Monthly Rate of Water Volume Transported Offsite
Simulated and Recorded Construction
Dewatering Rates
Management Support, Inc. 11
ITASCATM
Denver, Inc. EMSI Engineering
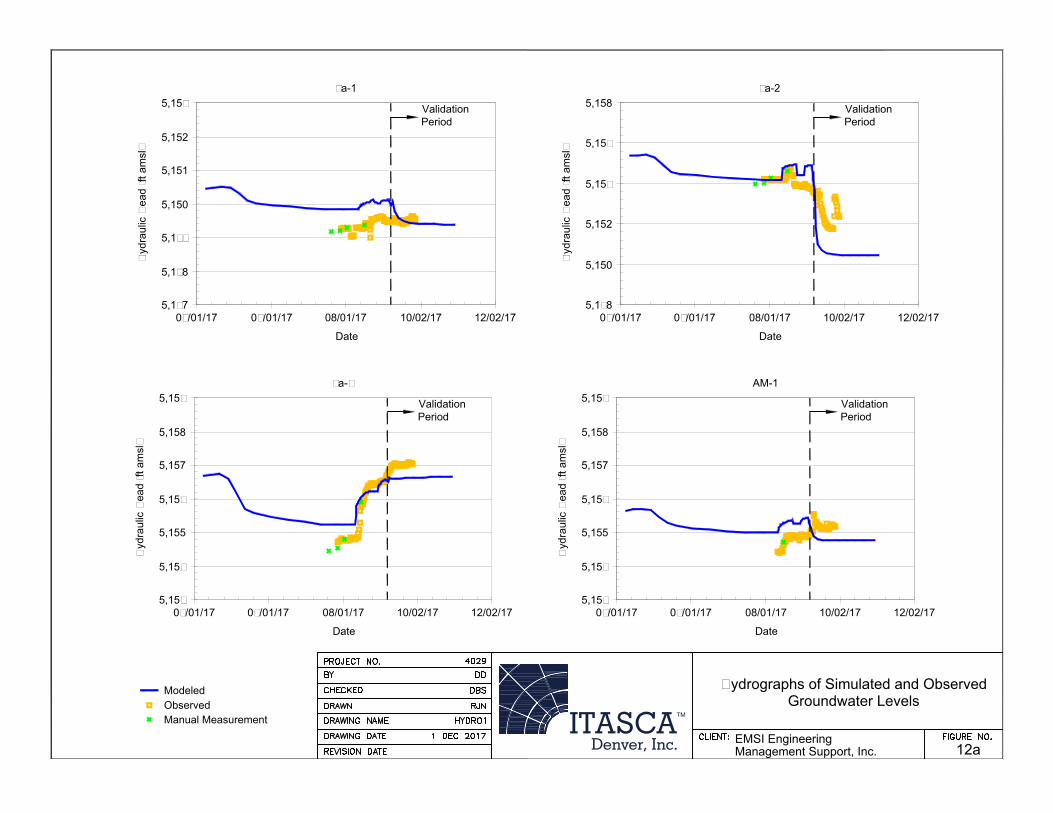
ITASCATM
Denver, Inc.
3a-1 3a-2
5,153 5,158
Validation Validation
Period Period
5,152
5,156
Hyd
ra
ulic H
ea
d (ft a
msl)
Hyd
ra
ulic H
ea
d (ft a
msl)
5,151
5,154
5,150
5,152
5,149
5,148
5,147 5,148
04/01/17 06/01/17 08/01/17 10/02/17 12/02/17 04/01/17 06/01/17 08/01/17 10/02/17 12/02/17
Date Date
3a-3 AM-1
5,159 5,159
Validation Validation
Period Period
5,158 5,158
5,157 5,157
5,156 5,156
5,155
Hyd
ra
ulic H
ea
d (ft a
msl)
Hyd
ra
ulic H
ea
d (ft a
msl)
5,150
5,155
5,154 5,154
5,153 5,153
04/01/17 06/01/17 08/01/17 10/02/17 12/02/17 04/01/17 06/01/17 08/01/17 10/02/17 12/02/17
Date Date
Modeled
Observed
Manual Measurement
Hydrographs of Simulated and Observed
Groundwater Levels
Management Support, Inc. 12a
EMSI Engineering
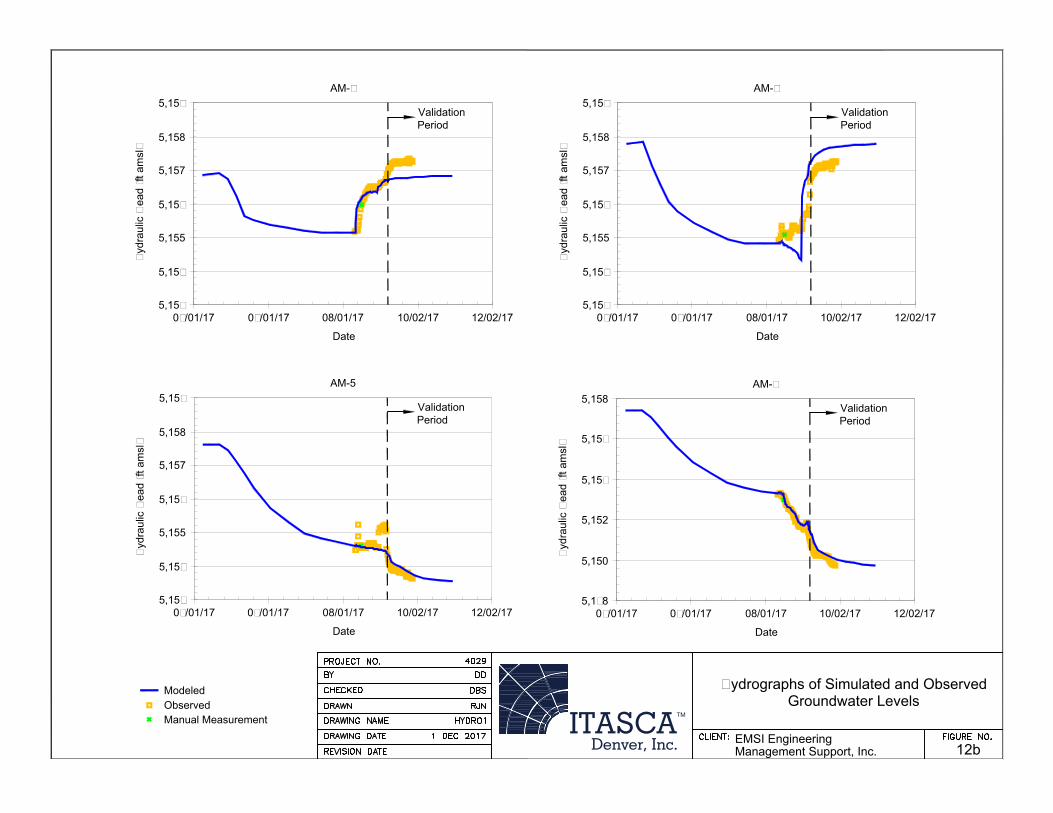
ITASCATM
Denver, Inc.
AM-3 AM-4
5,159
Validation
5,159
Validation
Period Period
5,158 5,158H
yd
ra
ulic H
ea
d (ft a
msl)
Hyd
ra
ulic H
ea
d (ft a
msl)
5,157 5,157
5,156 5,156
5,155
5,154 5,154
5,153 5,153
04/01/17 06/01/17 08/01/17 10/02/17 12/02/17 04/01/17 06/01/17 08/01/17 10/02/17 12/02/17
Date Date
AM-5
AM-6
5,159
5,158
Validation
Validation
Period
Period
5,158
5,157
5,154
5,156
5,152
5,155
5,154
5,153
Hyd
ra
ulic H
ea
d (ft a
msl)
Hyd
ra
ulic H
ea
d (ft a
msl)
5,155
5,156
5,150
5,148
04/01/17 06/01/17 08/01/17 10/02/17 12/02/17
04/01/17 06/01/17 08/01/17 10/02/17 12/02/17
Date
Date
Modeled
Observed
Manual Measurement
Hydrographs of Simulated and Observed
Groundwater Levels
Management Support, Inc. 12b
EMSI Engineering
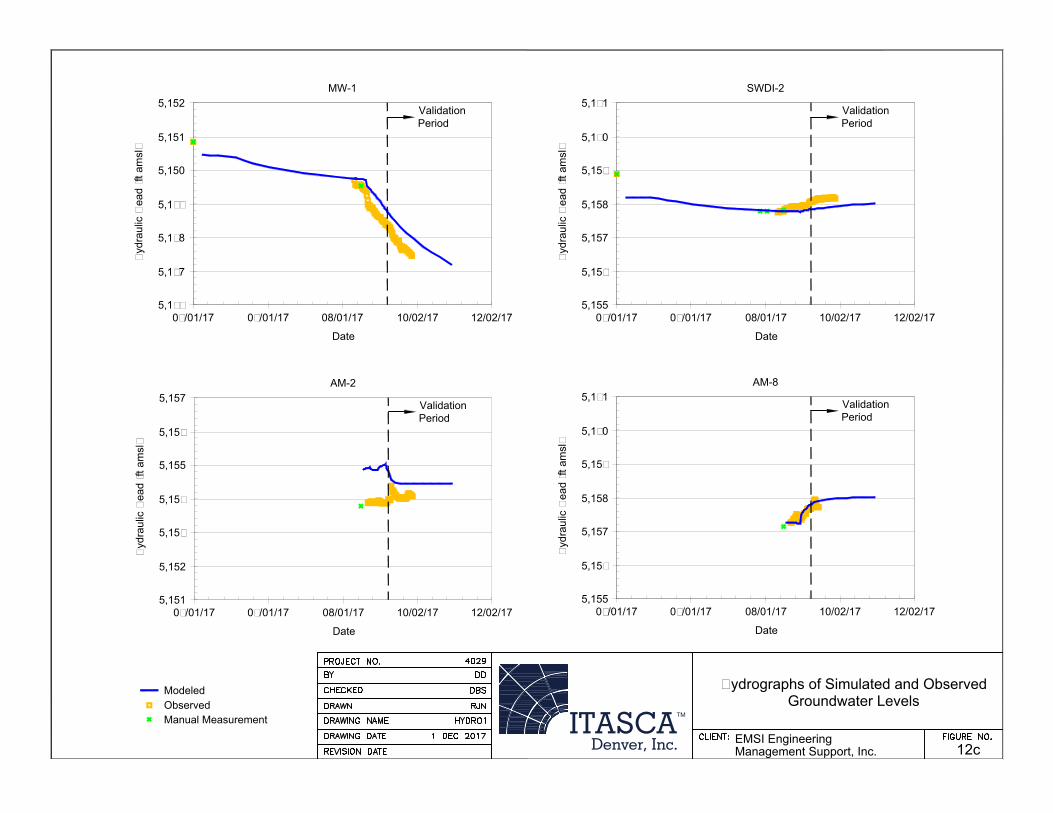
ITASCATM
Denver, Inc.
MW-1 SWDI-2
5,152
Validation
5,161
Validation
Period Period
5,151 5,160H
yd
ra
ulic H
ea
d (ft a
msl)
Hyd
ra
ulic H
ea
d (ft a
msl)
5,150 5,159
5,149 5,158
5,148
5,147 5,156
5,146 5,155
04/01/17 06/01/17 08/01/17 10/02/17 12/02/17 04/01/17 06/01/17 08/01/17 10/02/17 12/02/17
Date Date
AM-2
AM-8
5,157
5,161
Validation
Period
Validation
Period
5,156
5,160
5,155
5,159
5,154
5,158
5,153
Hyd
ra
ulic H
ea
d (ft a
msl)
Hyd
ra
ulic H
ea
d (ft a
msl)
5,157
5,157
5,152
5,156
5,151
5,155
04/01/17 06/01/17 08/01/17 10/02/17 12/02/17
04/01/17 06/01/17 08/01/17 10/02/17 12/02/17
Date
Date
Modeled
Observed
Manual Measurement
Hydrographs of Simulated and Observed
Groundwater Levels
Management Support, Inc. 12c
EMSI Engineering
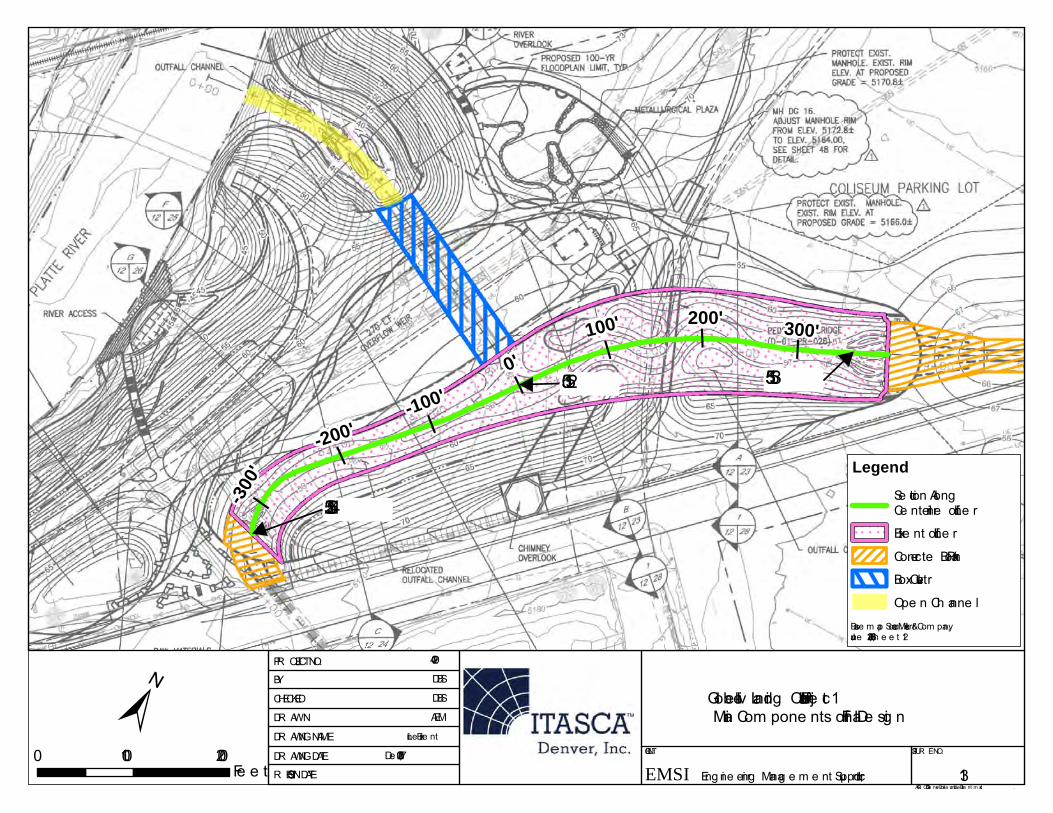
9
9
9
9 9 9
9
-100'
-200'
-300'
1 00 ' 2 00 ' 3 00 '0' 5152.0
5154.25
5153.5
PR OJECTNO.
DR AWN
4029
Globe ville Landing OutfallProje ct—Main Com pone nts ofFinalDe sig n
CHECKEDBY
DR AWINGNAMEDR AWINGDATER EVISIONDATE
De c.01,2017Line rExte nt
AEM
CLIENT: FIGUR ENO.
13
DBSDBS
G:\AR CGIS\De nve rColise um \Line rExte nt m xd
0 100 200Fe e t
± Eng ine e ring Manag e m e nt Support,Inc.EMSI
L e g e n d Se ction AlongCe nte rline ofLine rExte nt ofLine rConcre te Box/PanBoxCulve rtOpe n Ch anne l
Base m ap Source :Me rrick&Com pany,June 24,2016,Sh e e t 12
.
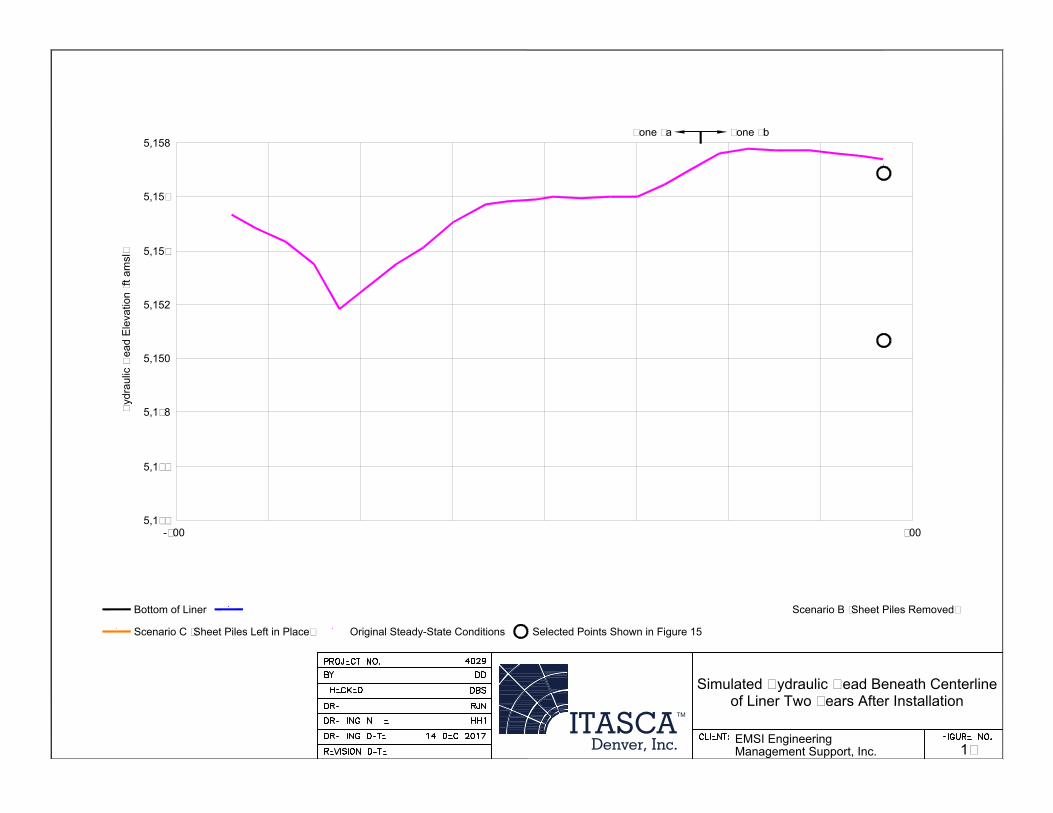
Scenario C (Sheet Piles Left in Place)
Scenario B (Sheet Piles Removed)
Selected Points Shown in Figure 15
-300 -200 -100 0 100 200 300
Prior to Liner Placement (End of Construction)
Longitudinal Distance (ft)
Scenario A (Sheet Piles Removed, With Check Dam)
Hyd
ra
ulic H
ea
d E
le
va
tio
n (ft a
msl)
5,158
5,156
5,154
5,152
5,150
5,148
5,146
5,144
-400
Bottom of Liner
Original Steady-State Conditions
Zone 3a Zone 3b
Simulated Hydraulic Head Beneath Centerline
of Liner Two Years After Installation
Management Support, Inc. 14
ITASCATM
Denver, Inc. EMSI Engineering
400
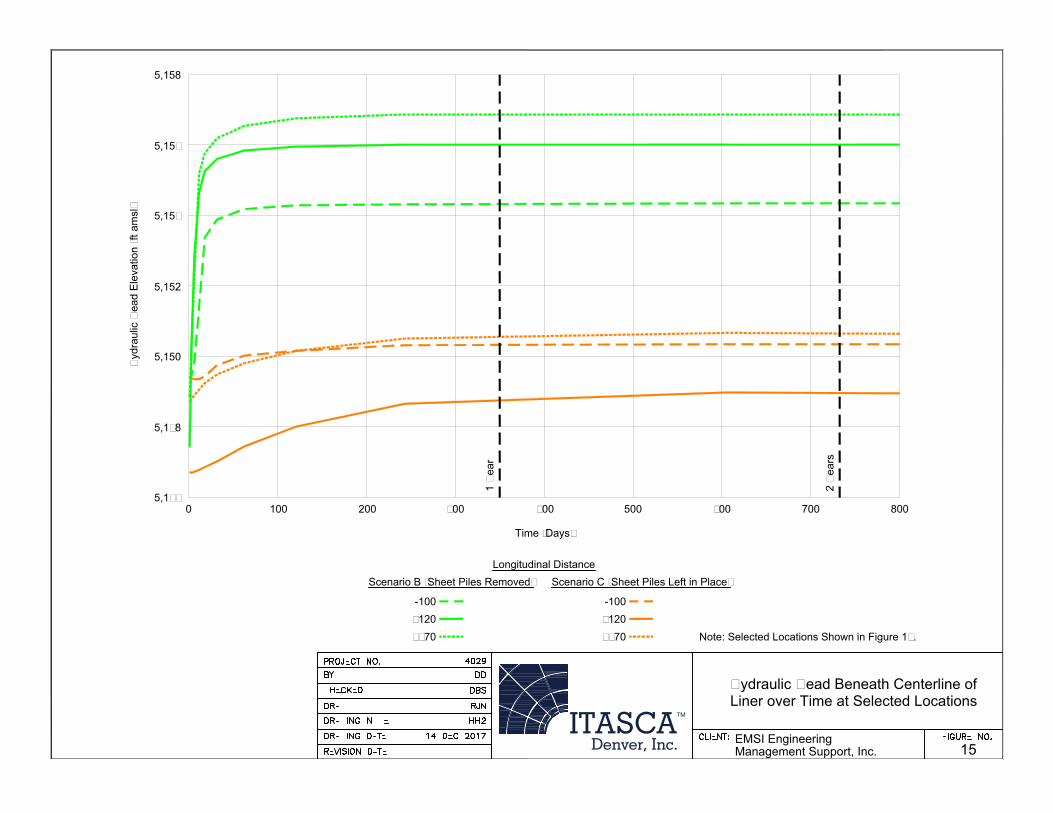
Hyd
ra
ulic H
ea
d E
le
va
tio
n (ft a
msl)
5,158
5,156
5,154
5,152
5,150
5,148
1 Y
ea
r
2 Y
ea
rs
5,146
0 100 200 300 400 500 600 700
Time (Days)
Longitudinal Distance
Scenario B (Sheet Piles Removed) Scenario C (Sheet Piles Left in Place)
-100 -100
+120 +120
+370 +370 Note: Selected Locations Shown in Figure 14.
Hydraulic Head Beneath Centerline of
Liner over Time at Selected Locations
Management Support, Inc. 15
ITASCATM
Denver, Inc. EMSI Engineering
800
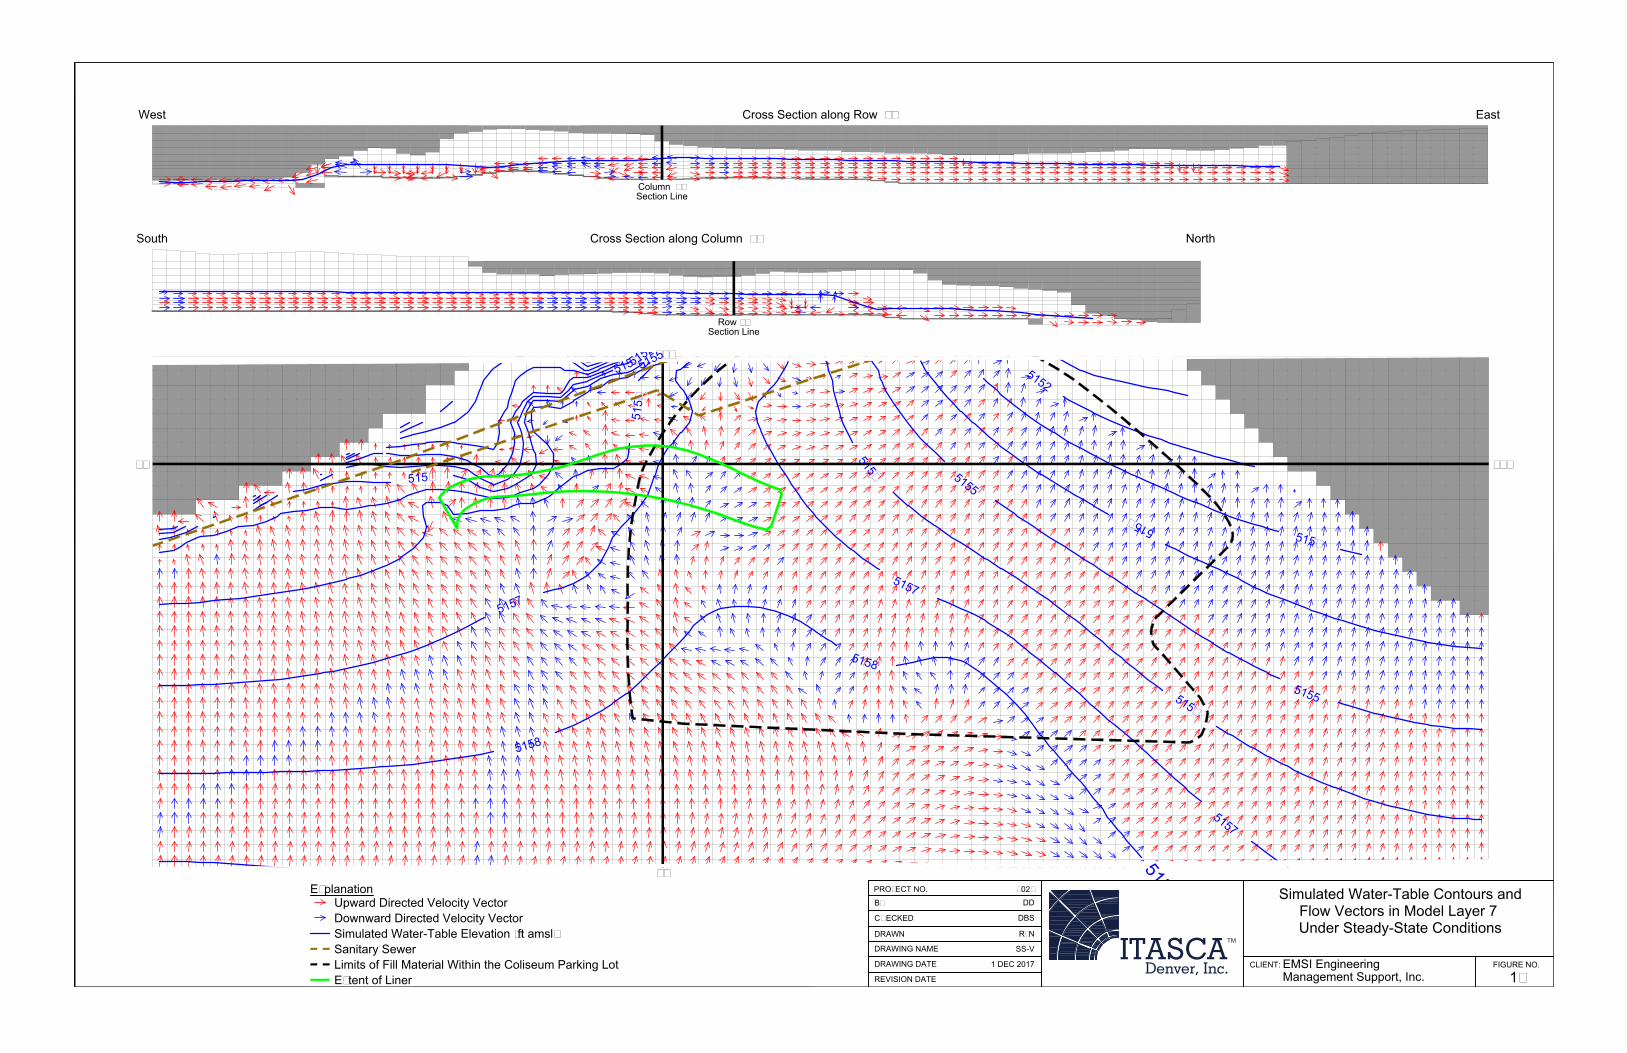
West Cross Section along Row 33 East
South
Column 36
Section Line
Cross Section along Column 36 North
36'
Row 33
Section Line
33 33'
5
1
5
1
5
1
5
2
5
1
5
2
5
1
5
3
5
1
5
5
5
1
5
5
5
1
5
8
5154
5
1
5
4
5
1
5
3
5
1
5
7
5
1
5
7
5156
5
1
5
8
5
1
5
5
5
1
5
6
5
1
5
8
5
1
5
6
5
1
5
7
36
Explanation
Upward Directed Velocity Vector
Downward Directed Velocity Vector
Simulated Water-Table Elevation (ft amsl)
Sanitary Sewer
Limits of Fill Material Within the Coliseum Parking Lot
Extent of Liner
PROJECT NO. 4029
Simulated Water-Table Contours and
BY DD
Flow Vectors in Model Layer 7
CHECKED DBS
Under Steady-State Conditions
DRAWN RJN
DRAWING NAME SS-V
DRAWING DATE 1 DEC 2017 CLIENT: FIGURE NO.
REVISION DATE
Management Support, Inc.
ITASCATM
Denver, Inc. EMSI Engineering
16
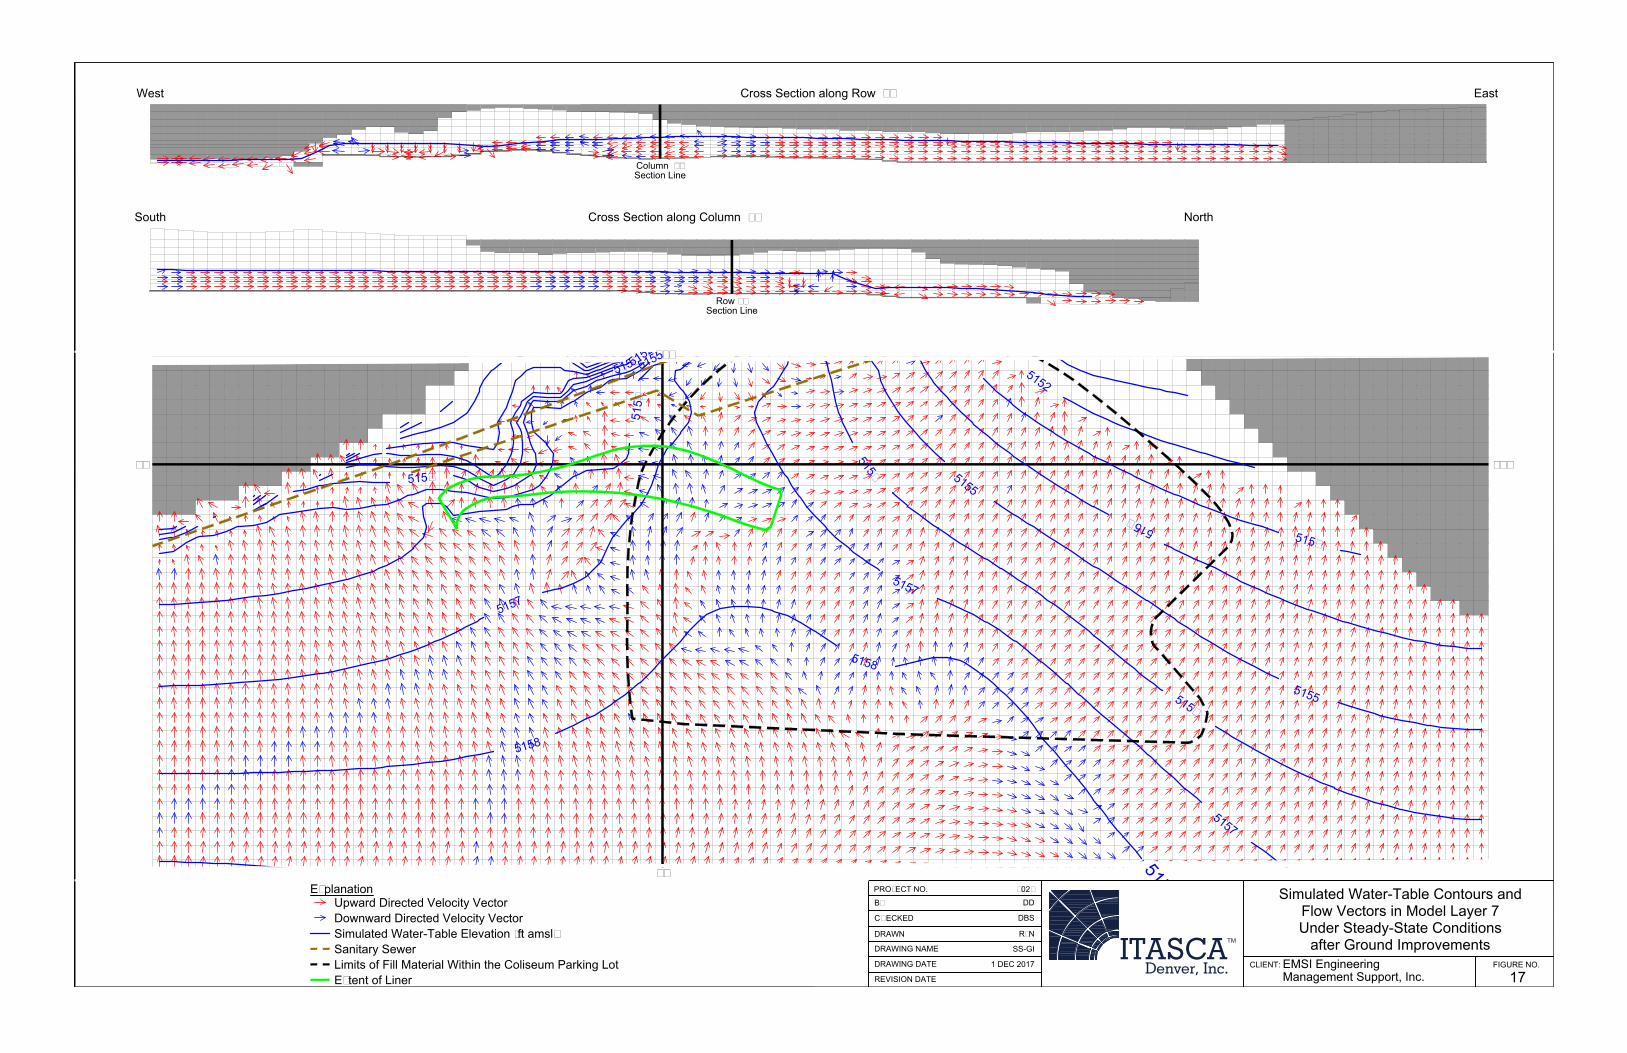
33
West Cross Section along Row 33 East
South
Column 36
Section Line
Cross Section along Column 36 North
Row 33
Section Line
36'
33'
5
1
5
1
5
1
5
2
5
1
5
2
5
1
5
3
5
1
5
5
5
1
5
5
5
1
5
8
5154
5
1
5
4
5
1
5
3
5
1
5
7
5
1
5
7
5156
5
1
5
8
5
1
5
5
5
1
5
6
5
1
5
8
5
1
5
6
5
1
5
7
Explanation
Upward Directed Velocity Vector
Downward Directed Velocity Vector
Simulated Water-Table Elevation (ft amsl)
Sanitary Sewer
Limits of Fill Material Within the Coliseum Parking Lot
Extent of Liner
36
EMSI Engineering
PROJECT NO. 4029
Simulated Water-Table Contours and
BY DD
Flow Vectors in Model Layer 7
CHECKED DBS
Under Steady-State Conditions
DRAWN RJN
DRAWING NAME SS-GI
after Ground Improvements
DRAWING DATE 1 DEC 2017 CLIENT: FIGURE NO.
REVISION DATE
Management Support, Inc.
ITASCATM
Denver, Inc. 17
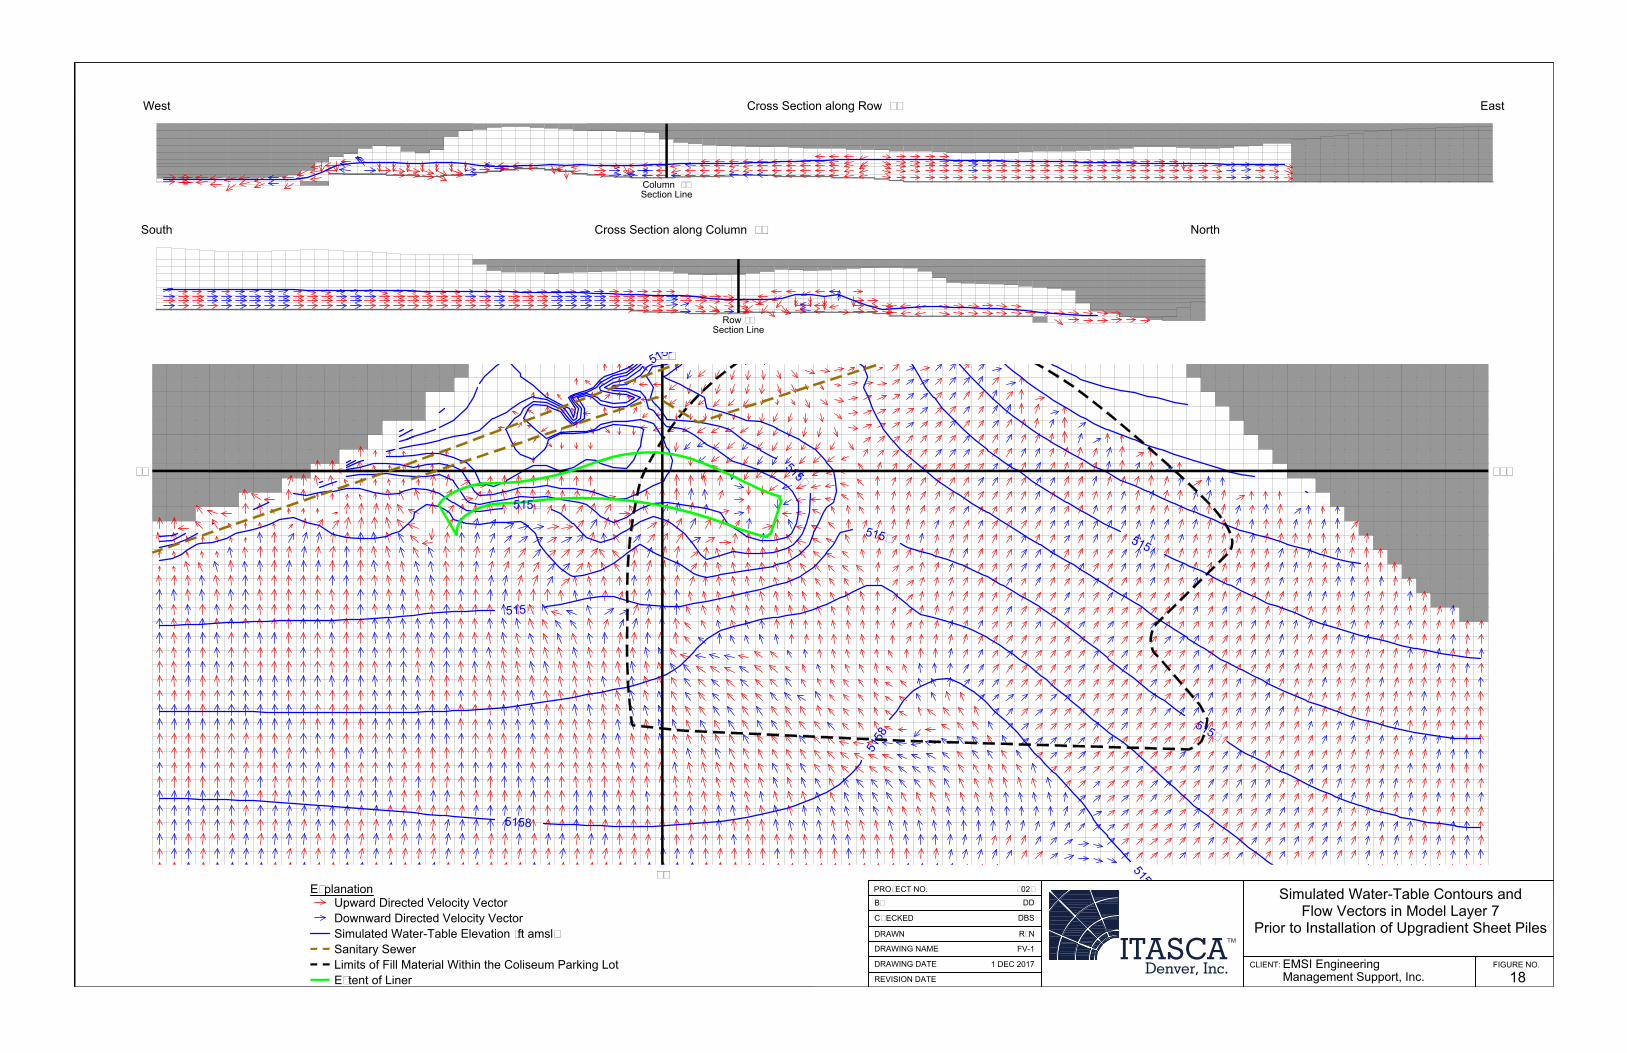
33
West Cross Section along Row 33 East
Column 36
Section Line
South Cross Section along Column 36 North
Row 33
Section Line
36'
33'
5
1
5
2
5
1
5
8
5154
5
1
5
6
5
1
5
4
5156
5
1
5
6
5158
5
1
5
4
5
1
5
8
36
Explanation
Upward Directed Velocity Vector
Downward Directed Velocity Vector
Simulated Water-Table Elevation (ft amsl)
Sanitary Sewer
Limits of Fill Material Within the Coliseum Parking Lot
Extent of Liner
PROJECT NO. 4029
Simulated Water-Table Contours and
BY DD
Flow Vectors in Model Layer 7
CHECKED DBS
Prior to Installation of Upgradient Sheet Piles
DRAWN RJN
DRAWING NAME FV-1
DRAWING DATE 1 DEC 2017 CLIENT: FIGURE NO.
REVISION DATE
Management Support, Inc.
ITASCATM
Denver, Inc. EMSI Engineering
18
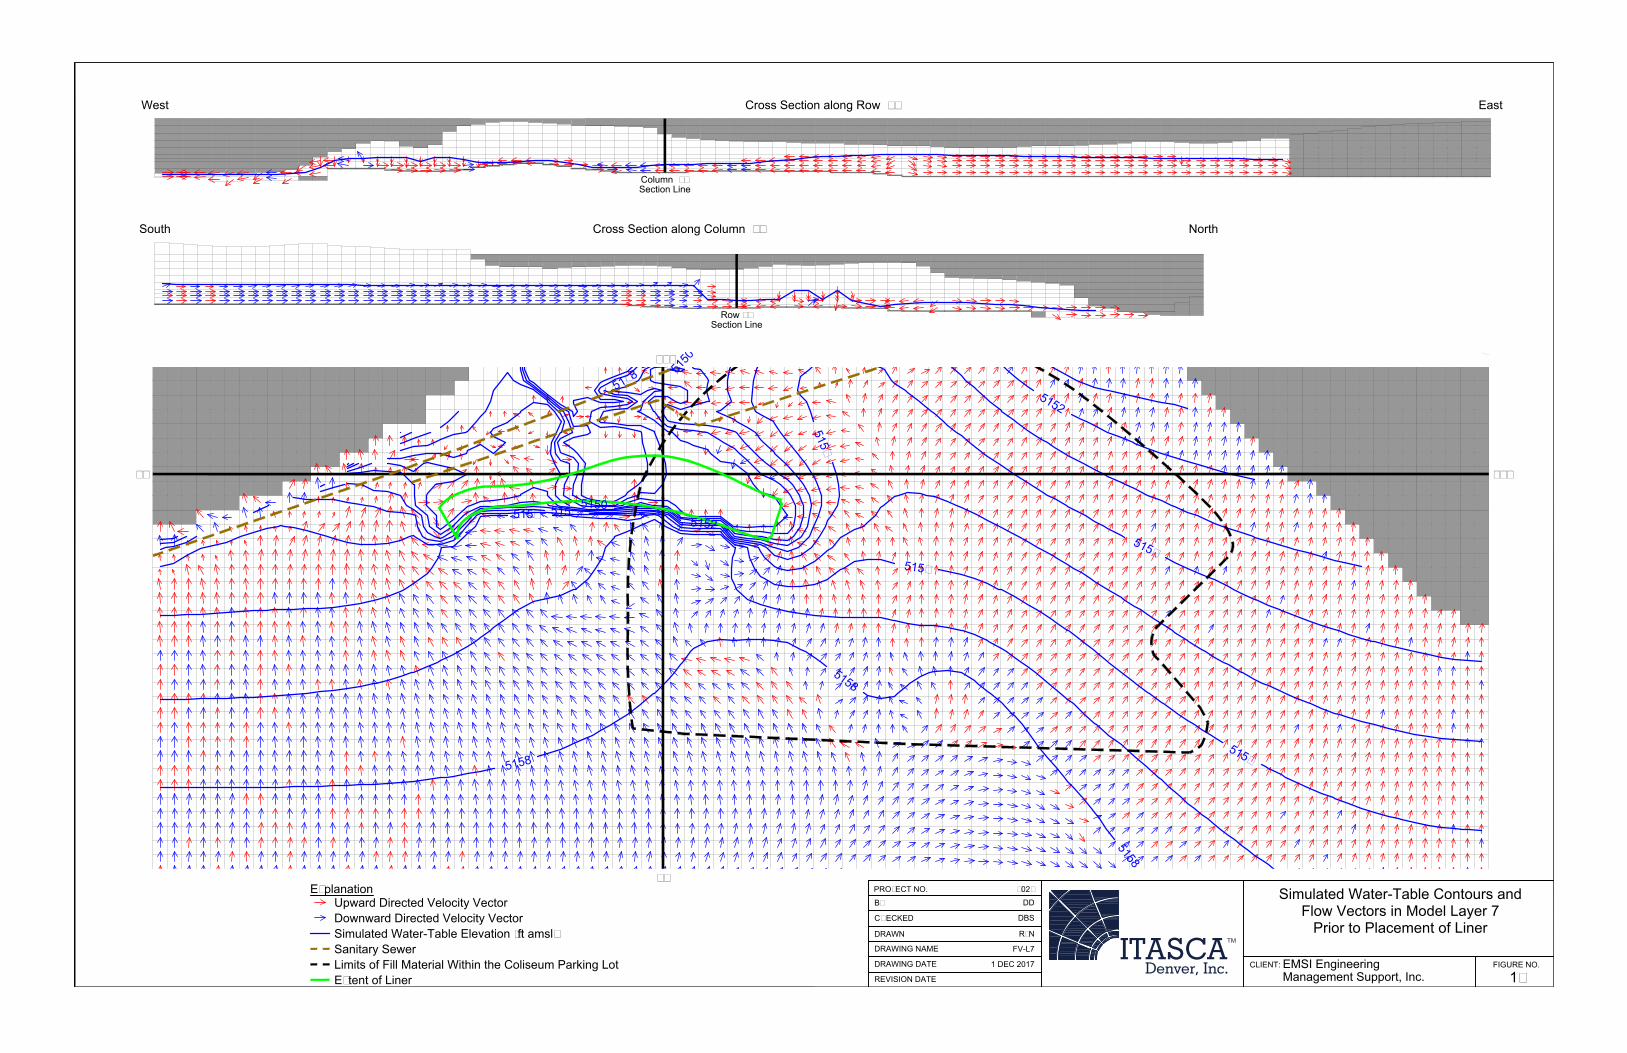
5
1
4
8
5
1
5
0
5
1
5
2
5
1
5
4
5150
5154
5152
5156
5
1
5
4
5
1
5
8
5
1
5
8
5
1
5
6
5
1
5
8
33
South Cross Section along Column 36 North
West Cross Section along Row 33 East
Column 36
Section Line
36'
Row 33
Section Line
33'
5156
36
Explanation
Upward Directed Velocity Vector
Downward Directed Velocity Vector
Simulated Water-Table Elevation (ft amsl)
Sanitary Sewer
Limits of Fill Material Within the Coliseum Parking Lot
Extent of Liner
PROJECT NO. 4029
Simulated Water-Table Contours and
BY DD
Flow Vectors in Model Layer 7
CHECKED DBS
Prior to Placement of Liner
DRAWN RJN
DRAWING NAME FV-L7
DRAWING DATE 1 DEC 2017 CLIENT: FIGURE NO.
REVISION DATE
Management Support, Inc.
ITASCATM
Denver, Inc. EMSI Engineering
19
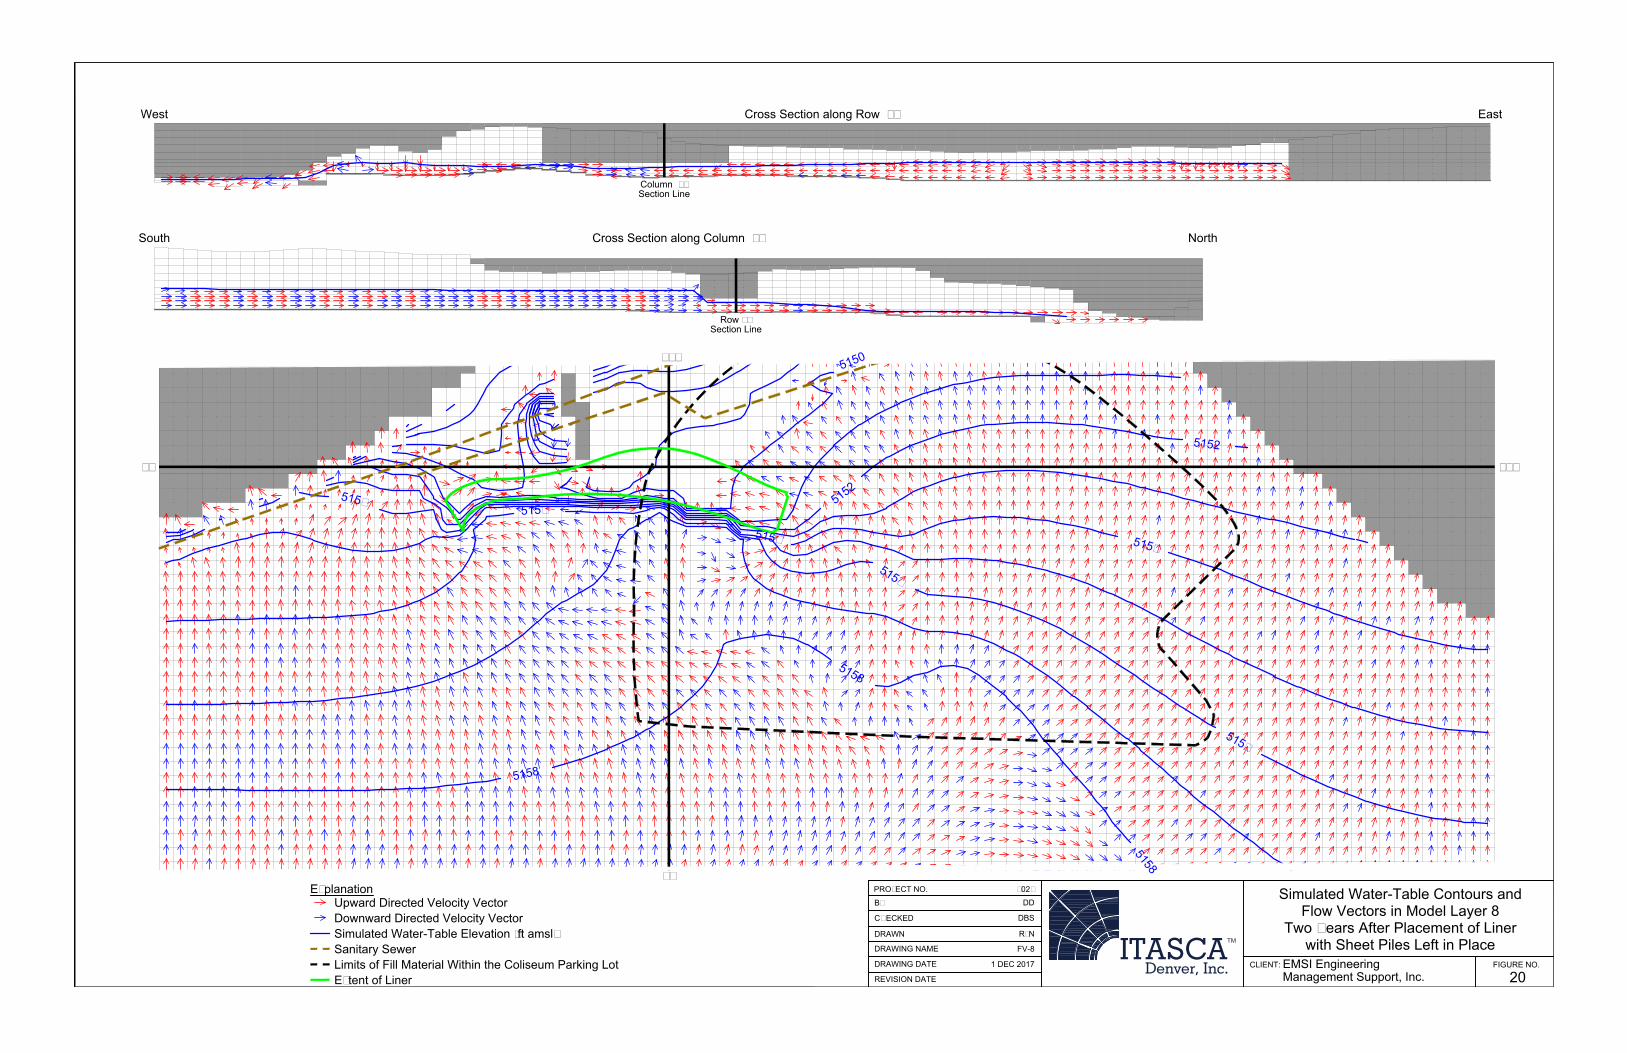
33
West Cross Section along Row 33 East
Column 36
Section Line
South Cross Section along Column 36 North
36'
Row 33
Section Line
33'
5
1
5
0
5152
5
1
5
8
5
1
5
4
5
1
5
2
5156
5
1
5
4
5
1
5
4
5
1
5
6
5
1
5
8
5
1
5
6
5
1
5
8
36
Explanation
Upward Directed Velocity Vector
Downward Directed Velocity Vector
Simulated Water-Table Elevation (ft amsl)
Sanitary Sewer
Limits of Fill Material Within the Coliseum Parking Lot
Extent of Liner
PROJECT NO. 4029
Simulated Water-Table Contours and
BY DD
Flow Vectors in Model Layer 8
CHECKED DBS
Two Years After Placement of Liner
DRAWN RJN
DRAWING NAME FV-8
with Sheet Piles Left in Place
DRAWING DATE 1 DEC 2017 CLIENT: FIGURE NO.
REVISION DATE
Management Support, Inc.
ITASCATM
Denver, Inc. EMSI Engineering
20
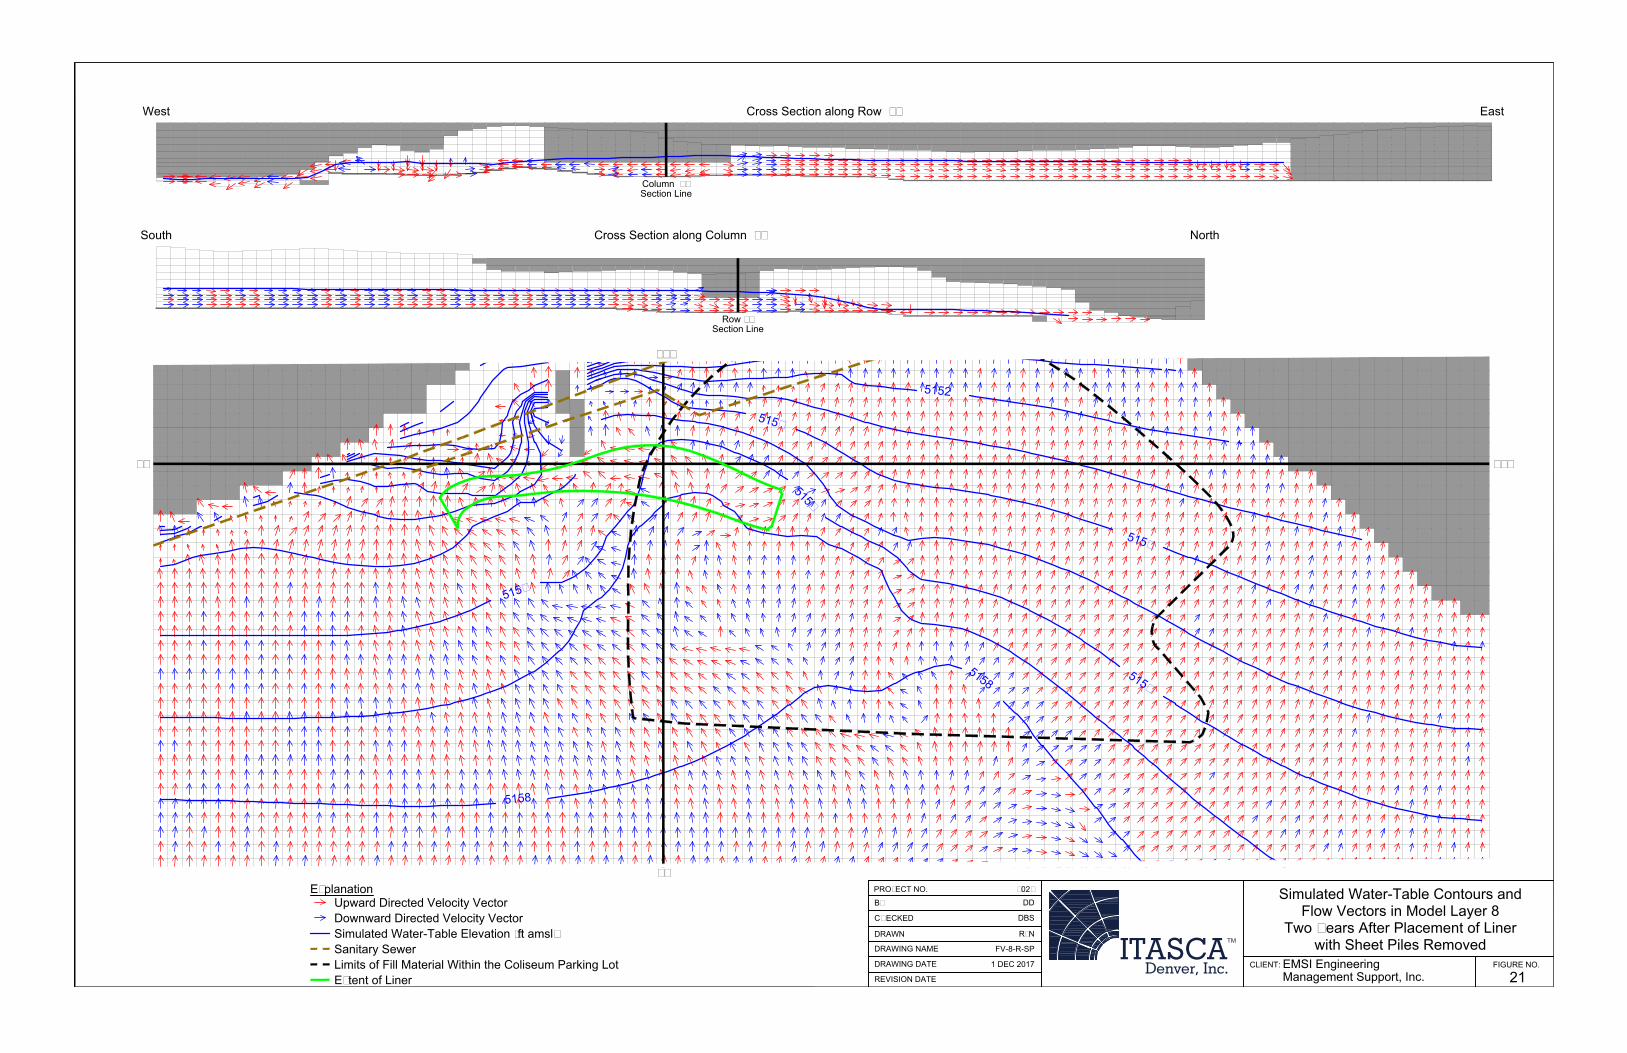
33
West Cross Section along Row 33 East
Column 36
Section Line
South Cross Section along Column 36 North
Row 33
Section Line
36'
33'
5152
5
1
5
4
5
1
5
6
5
1
5
4
5
1
5
6
5
1
5
6
5
1
5
8
5158
36
Explanation
Upward Directed Velocity Vector
Downward Directed Velocity Vector
Simulated Water-Table Elevation (ft amsl)
Sanitary Sewer
Limits of Fill Material Within the Coliseum Parking Lot
Extent of Liner
PROJECT NO. 4029
Simulated Water-Table Contours and
BY DD
Flow Vectors in Model Layer 8
CHECKED DBS
Two Years After Placement of Liner
DRAWN RJN
DRAWING NAME FV-8-R-SP
with Sheet Piles Removed
DRAWING DATE 1 DEC 2017 CLIENT: FIGURE NO.
REVISION DATE
Management Support, Inc.
ITASCATM
Denver, Inc. EMSI Engineering
21
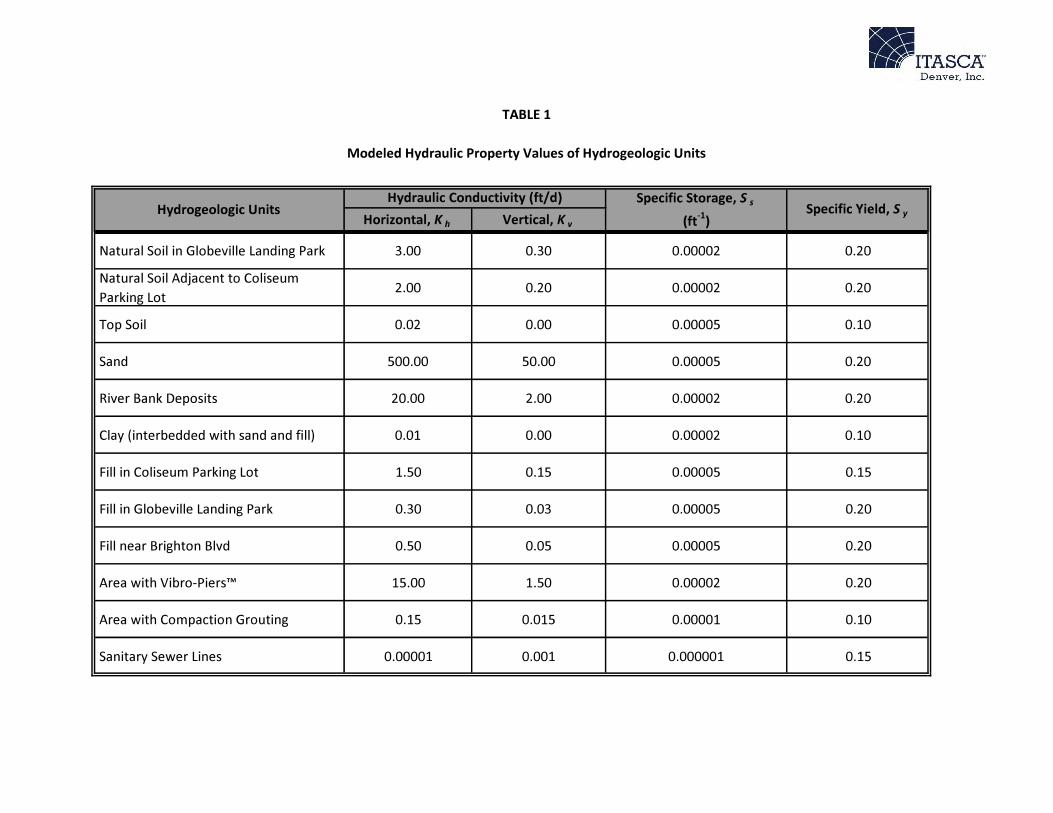
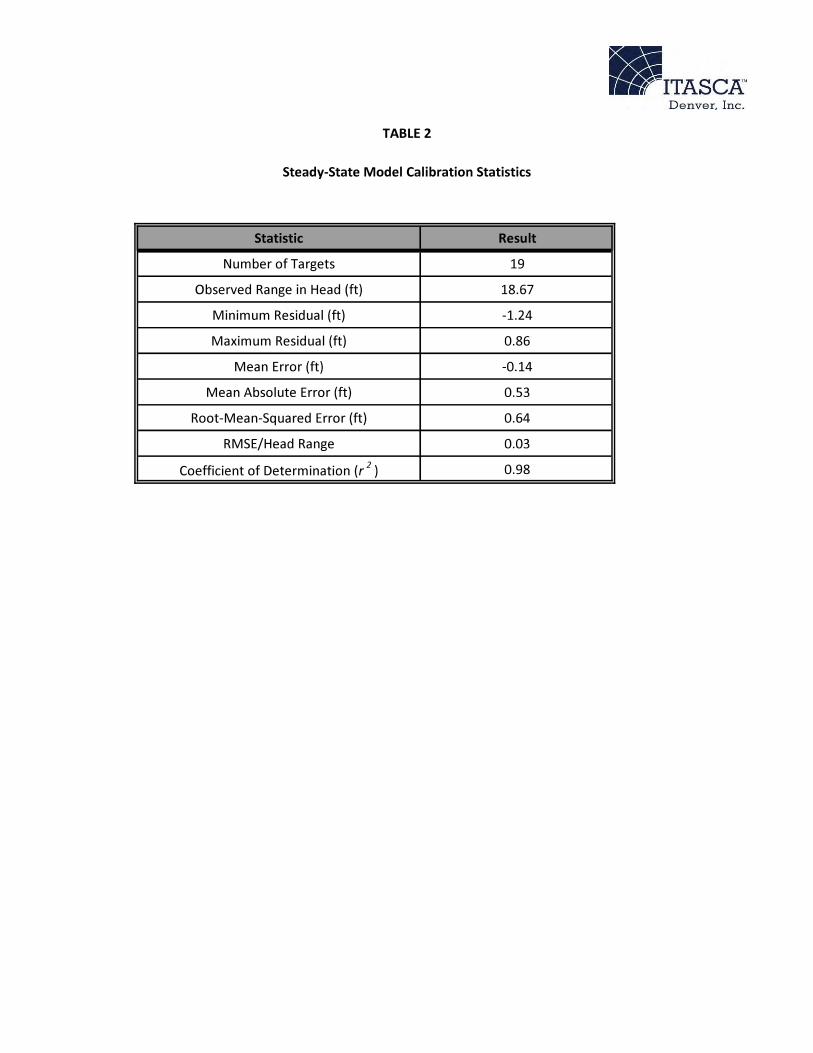
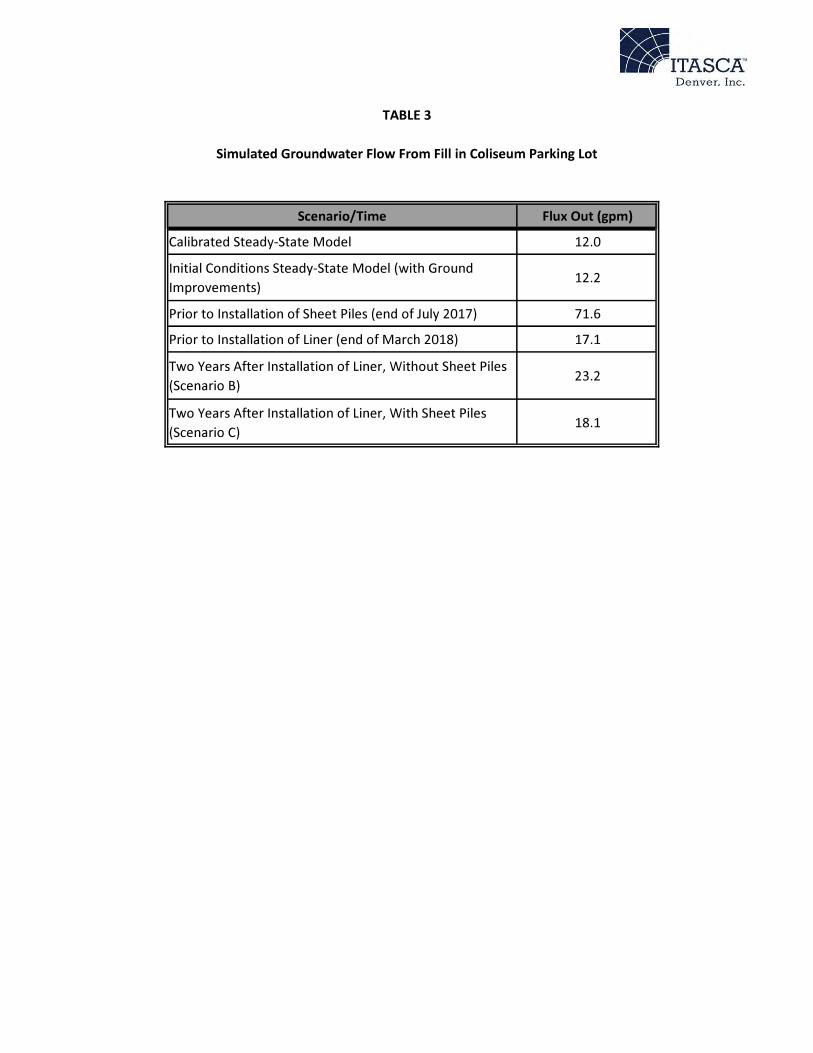
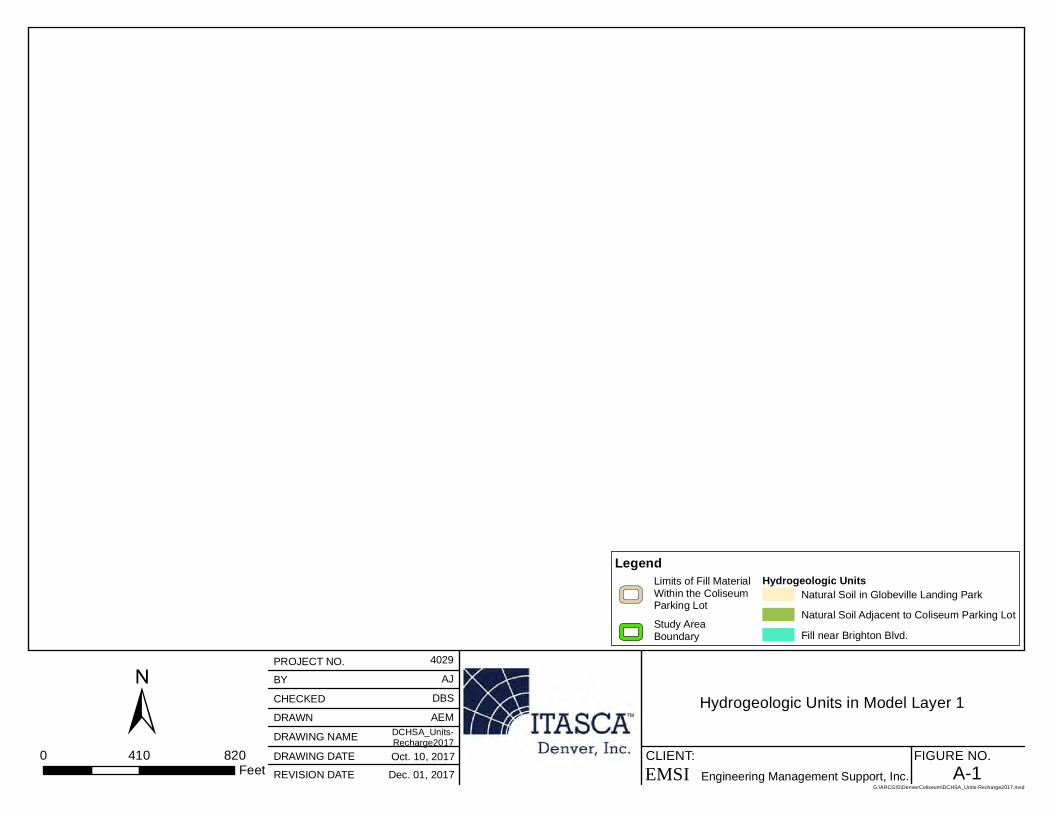
Hydrogeo
± PROJECT NO. 4029 BY AJ CHECKED DBS DRAWN AEM
DCHSA_Units-DRAWING NAME Recharge2017 0 410 820
FeeDRAWING DATE Oct. 10, 2017
t REVISION DATE Dec. 01, 2017
Hydrogeologic Units in Model Layer 1
CLIENT: FIGURE NO.A-1
G:\ARCGIS\DenverColiseum\DCHSA_Units-Recharge2017.mxd
LegendLimits of Fill MaterialWithin the Coliseum Parking Lot Study AreaBoundary
logic UnitsNatural Soil in Globeville Landing Park Natural Soil Adjacent to Coliseum Parking Lot Fill near Brighton Blvd.
Engineering Management Support, Inc. EMSI

Hydrogeo
± PROJECT NO. 4029 BY AJ CHECKED DBS DRAWN AEM
DCHSA_Units-DRAWING NAME Recharge2017 0 410 820
FeeDRAWING DATE Oct. 10, 2017
t REVISION DATE Dec. 01, 2017
Hydrogeologic Units in Model Layer 2
CLIENT: FIGURE NO.A-2
G:\ARCGIS\DenverColiseum\DCHSA_Units-Recharge2017.mxd
LegendLimits of Fill MaterialWithin the Coliseum Parking Lot Study AreaBoundary
logic UnitsNatural Soil in Globeville Landing Park Natural Soil Adjacent to Coliseum Parking Lot Fill near Brighton Blvd. Top Soil
Engineering Management Support, Inc. EMSI

Hydrogeo
± PROJECT NO. 4029 BY AJ CHECKED DBS DRAWN AEM
DCHSA_Units-DRAWING NAME Recharge2017 0 410 820
FeeDRAWING DATE Oct. 10, 2017
t REVISION DATE Dec. 01, 2017
Hydrogeologic Units in Model Layer 3
CLIENT: FIGURE NO.A-3
G:\ARCGIS\DenverColiseum\DCHSA_Units-Recharge2017.mxd
LegendLimits of Fill MaterialWithin the Coliseum Parking Lot Study AreaBoundary
logic UnitsNatural Soil in Globeville Landing Park Natural Soil Adjacent to Coliseum Parking Lot Fill in Coliseum Parking Lot Fill in Globeville Landing Park Fill near Brighton Blvd. Top Soil
Engineering Management Support, Inc. EMSI
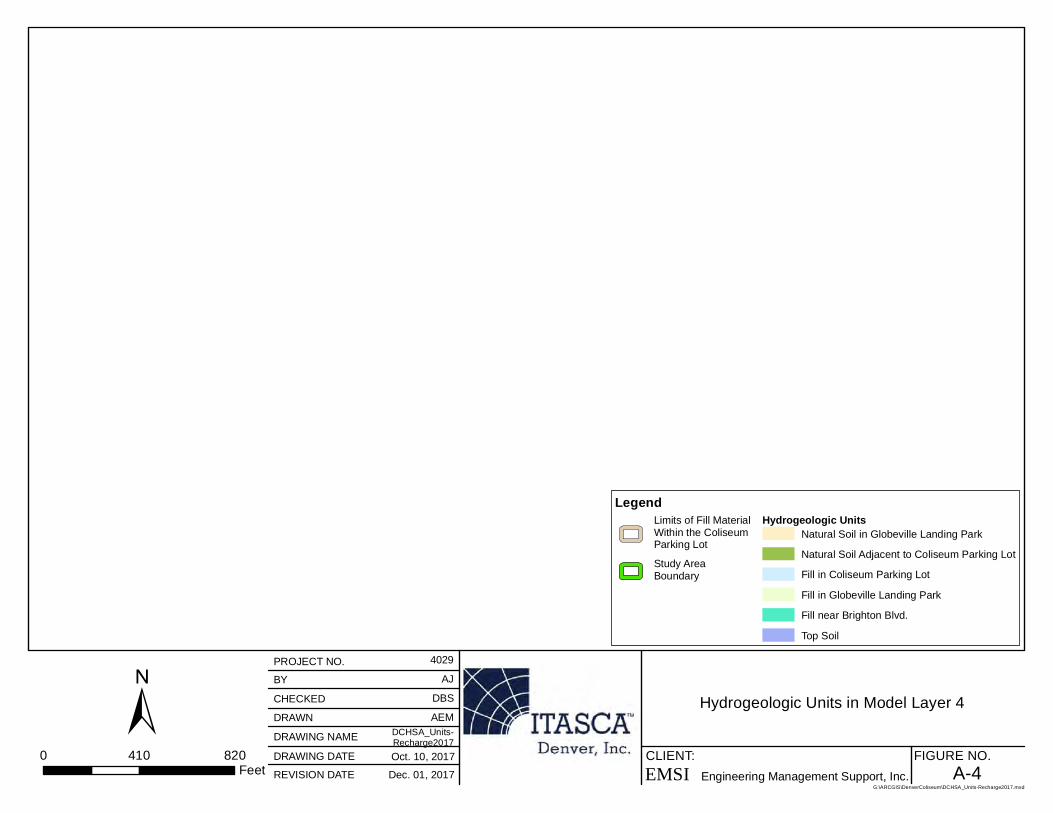
Hydrogeo
± PROJECT NO. 4029 BY AJ CHECKED DBS DRAWN AEM
DCHSA_Units-DRAWING NAME Recharge2017 0 410 820
FeeDRAWING DATE Oct. 10, 2017
t REVISION DATE Dec. 01, 2017
Hydrogeologic Units in Model Layer 4
CLIENT: FIGURE NO.A-4
G:\ARCGIS\DenverColiseum\DCHSA_Units-Recharge2017.mxd
LegendLimits of Fill MaterialWithin the Coliseum Parking Lot Study AreaBoundary
logic UnitsNatural Soil in Globeville Landing Park Natural Soil Adjacent to Coliseum Parking Lot Fill in Coliseum Parking Lot Fill in Globeville Landing Park Fill near Brighton Blvd. Top Soil
Engineering Management Support, Inc. EMSI

Hydrogeo
± PROJECT NO. 4029 BY AJ CHECKED DBS DRAWN AEM
DCHSA_Units-DRAWING NAME Recharge2017 0 410 820
FeeDRAWING DATE Oct. 10, 2017
t REVISION DATE Dec. 01, 2017
Hydrogeologic Units in Model Layer 5
CLIENT: FIGURE NO.A-5
G:\ARCGIS\DenverColiseum\DCHSA_Units-Recharge2017.mxd
LegendLimits of Fill MaterialWithin the Coliseum Parking Lot Study AreaBoundary
logic UnitsNatural Soil in Globeville Landing Park Natural Soil Adjacent to Coliseum Parking Lot Fill in Coliseum Parking Lot Fill in Globeville Landing Park Fill near Brighton Blvd. Top Soil
Engineering Management Support, Inc. EMSI
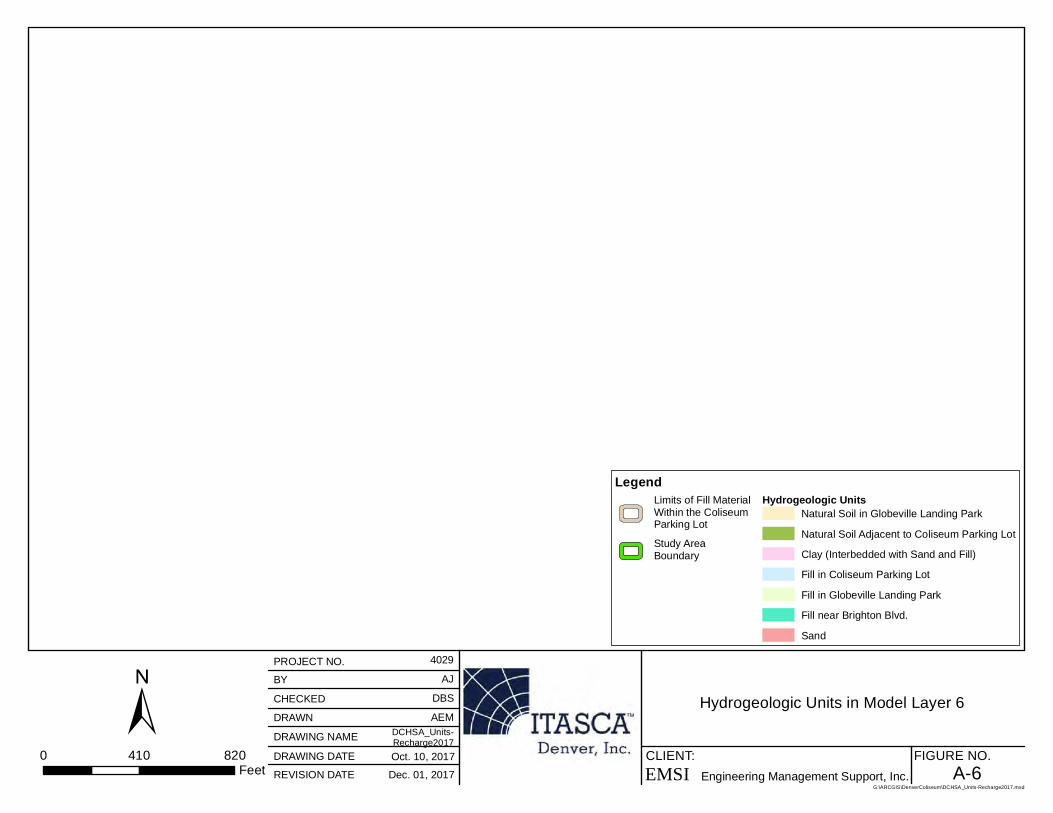
LegendLimits of Fill MaterialWithin the Coliseum Parking Lot Study AreaBoundary
Hydrogeologic UnitsNatural Soil in Globeville Landing Park Natural Soil Adjacent to Coliseum Parking Lot Clay (Interbedded with Sand and Fill)Fill in Coliseum Parking Lot Fill in Globeville Landing Park Fill near Brighton Blvd. Sand
0 ± 410 820
Feet
PROJECT NO. BY CHECKED DRAWN DRAWING NAME DRAWING DATE REVISION DATE
4029 AJ
DBS AEM
DCHSA_Units-Recharge2017 Oct. 10, 2017 Dec. 01, 2017
Hydrogeologic Units in Model Layer 6
CLIENT: FIGURE NO.EMSI Engineering Management Support, Inc. A-6
G:\ARCGIS\DenverColiseum\DCHSA_Units-Recharge2017.mxd
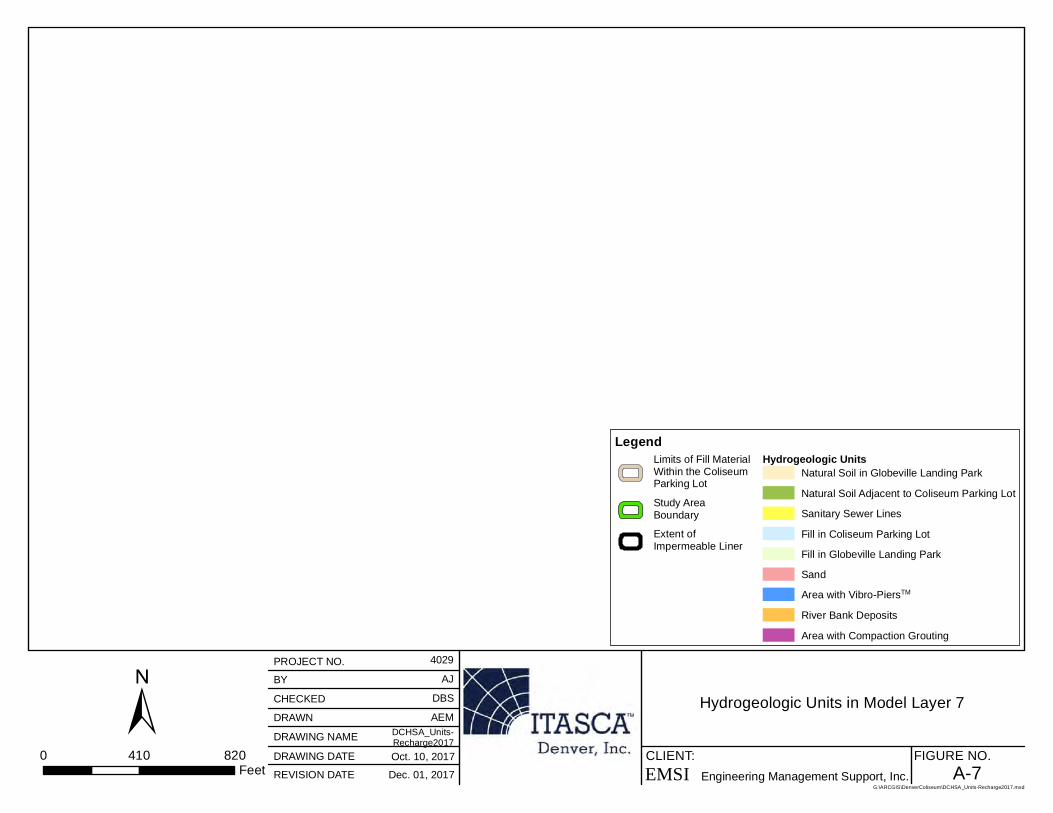
LegendLimits of Fill MaterialWithin the Coliseum Parking Lot Study AreaBoundaryExtent ofImpermeable Liner
Hydrogeologic UnitsNatural Soil in Globeville Landing Park Natural Soil Adjacent to Coliseum Parking Lot Sanitary Sewer Lines Fill in Coliseum Parking Lot Fill in Globeville Landing Park Sand Area with Vibro-PiersTM River Bank Deposits Area with Compaction Grouting
0 ± 410 820
Feet
PROJECT NO. BY CHECKED DRAWN DRAWING NAME DRAWING DATE REVISION DATE
4029 AJ
DBS AEM
DCHSA_Units-Recharge2017 Oct. 10, 2017 Dec. 01, 2017
Hydrogeologic Units in Model Layer 7
CLIENT: FIGURE NO.EMSI Engineering Management Support, Inc. A-7
G:\ARCGIS\DenverColiseum\DCHSA_Units-Recharge2017.mxd
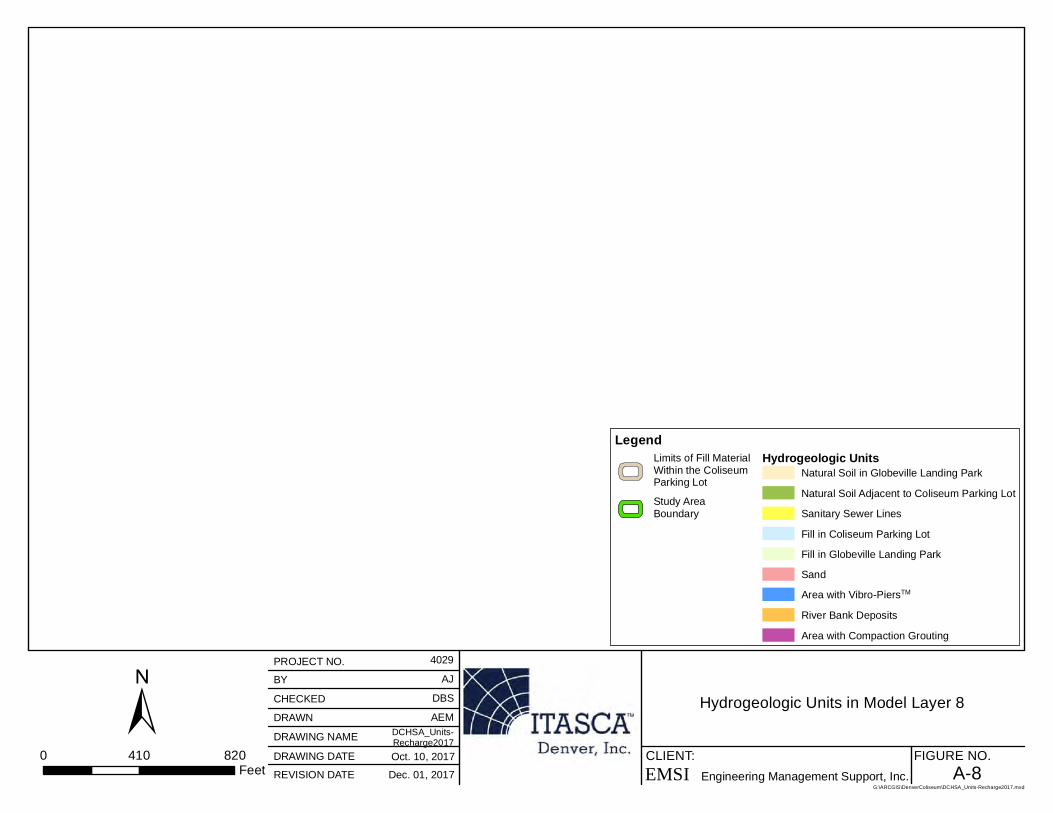
LegendLimits of Fill MaterialWithin the Coliseum Parking Lot Study AreaBoundary
Hydrogeologic UnitsNatural Soil in Globeville Landing Park Natural Soil Adjacent to Coliseum Parking Lot Sanitary Sewer Lines Fill in Coliseum Parking Lot Fill in Globeville Landing Park Sand Area with Vibro-PiersTM River Bank Deposits Area with Compaction Grouting
0 ± 410 820
Feet
PROJECT NO. BY CHECKED DRAWN DRAWING NAME DRAWING DATE REVISION DATE
4029 AJ
DBS AEM
DCHSA_Units-Recharge2017 Oct. 10, 2017 Dec. 01, 2017
Hydrogeologic Units in Model Layer 8
CLIENT: FIGURE NO.EMSI Engineering Management Support, Inc. A-8
G:\ARCGIS\DenverColiseum\DCHSA_Units-Recharge2017.mxd
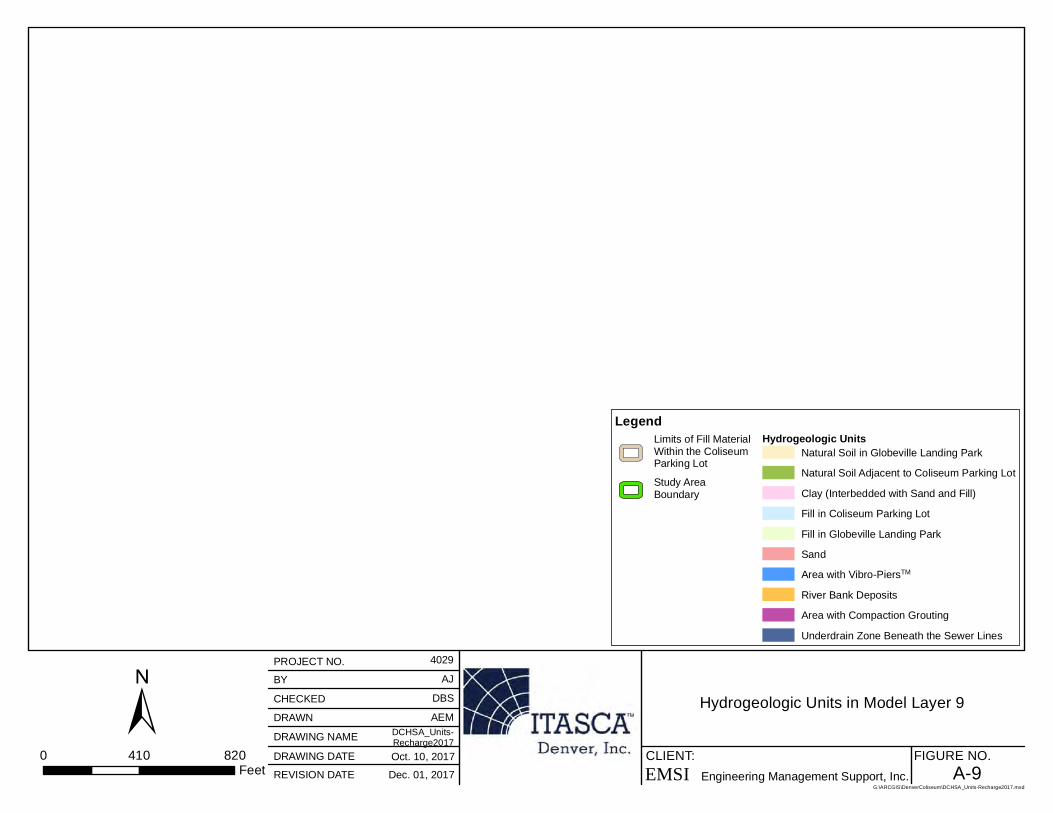
LegendLimits of Fill MaterialWithin the Coliseum Parking Lot Study AreaBoundary
Hydrogeologic UnitsNatural Soil in Globeville Landing Park Natural Soil Adjacent to Coliseum Parking Lot Clay (Interbedded with Sand and Fill)Fill in Coliseum Parking Lot Fill in Globeville Landing Park Sand Area with Vibro-PiersTM River Bank Deposits Area with Compaction Grouting Underdrain Zone Beneath the Sewer Lines
0 ± 410 820
Feet
PROJECT NO. BY CHECKED DRAWN DRAWING NAME DRAWING DATE REVISION DATE
4029 AJ
DBS AEM
DCHSA_Units-Recharge2017 Oct. 10, 2017 Dec. 01, 2017
Hydrogeologic Units in Model Layer 9
CLIENT: FIGURE NO.EMSI Engineering Management Support, Inc. A-9
G:\ARCGIS\DenverColiseum\DCHSA_Units-Recharge2017.mxd
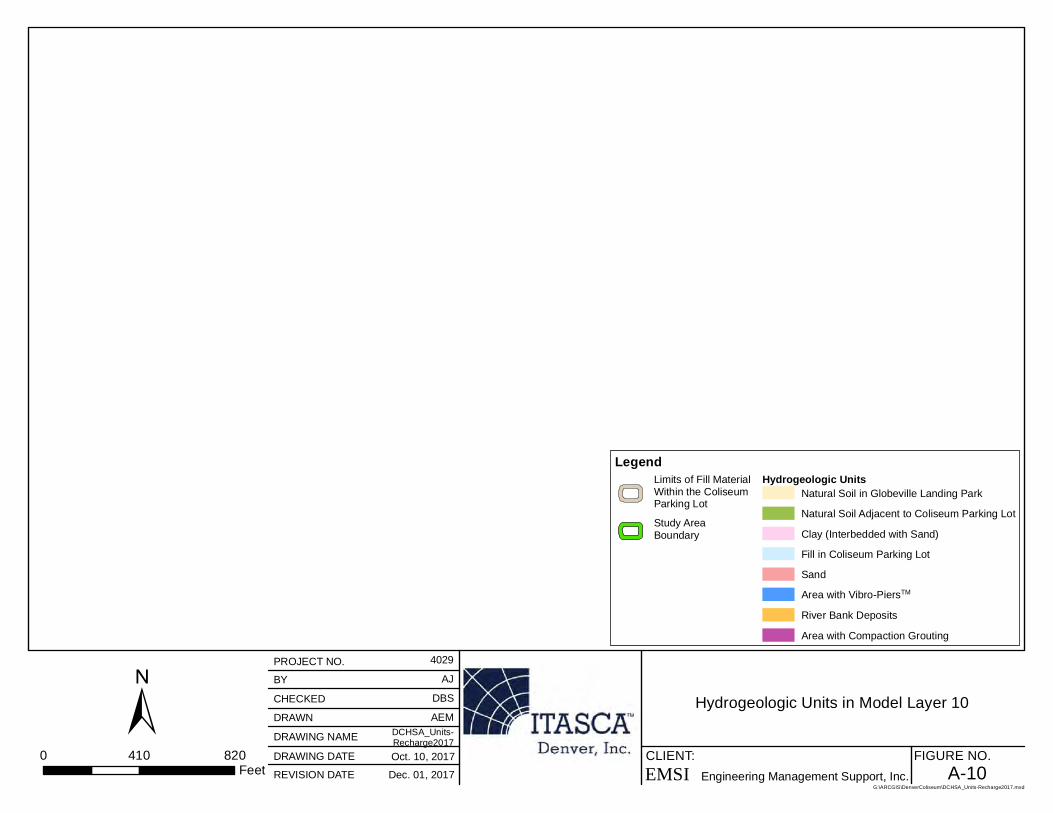
LegendLimits of Fill MaterialWithin the Coliseum Parking Lot Study AreaBoundary
Hydrogeologic UnitsNatural Soil in Globeville Landing Park Natural Soil Adjacent to Coliseum Parking Lot Clay (Interbedded with Sand)Fill in Coliseum Parking Lot Sand Area with Vibro-PiersTM River Bank Deposits Area with Compaction Grouting
0 ± 410 820
Feet
PROJECT NO. BY CHECKED DRAWN DRAWING NAME DRAWING DATE REVISION DATE
4029 AJ
DBS AEM
DCHSA_Units-Recharge2017 Oct. 10, 2017 Dec. 01, 2017
Hydrogeologic Units in Model Layer 10
CLIENT: FIGURE NO.EMSI Engineering Management Support, Inc. A-10
G:\ARCGIS\DenverColiseum\DCHSA_Units-Recharge2017.mxd
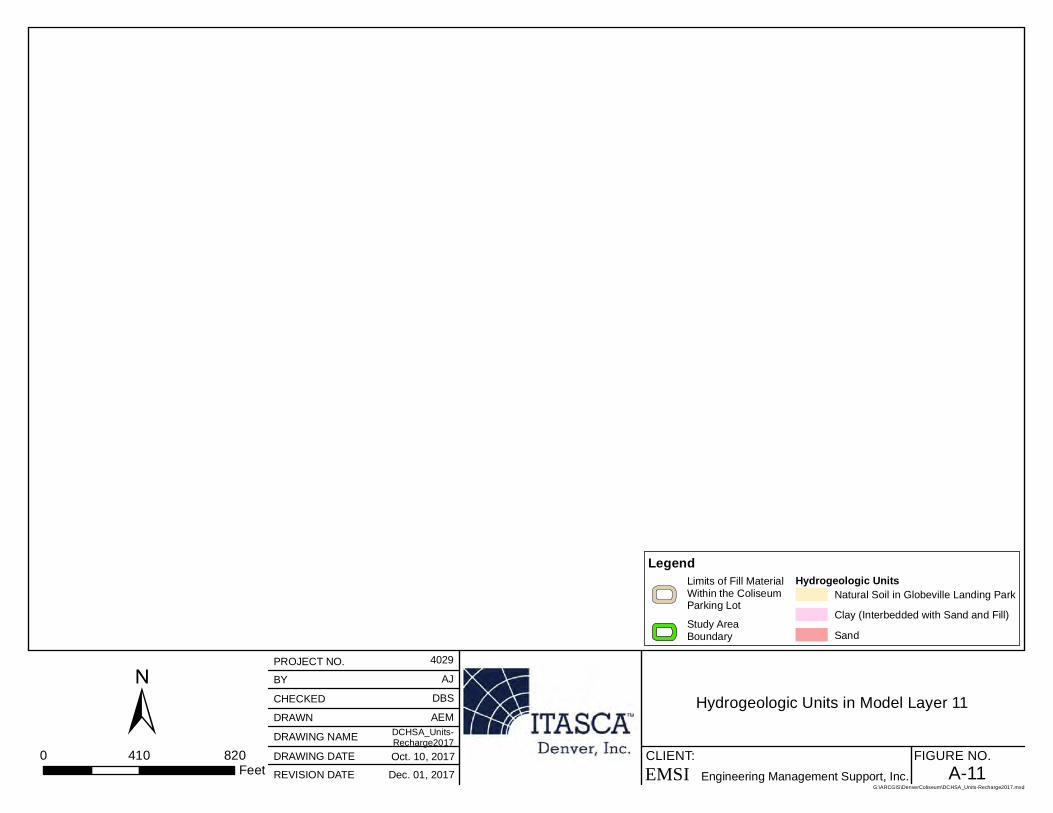
LegendLimits of Fill Material Hydrogeologic UnitsWithin the Coliseum Natural Soil in Globeville Landing Park Parking Lot Clay (Interbedded with Sand and Fill)Study AreaBoundary Sand
± PROJECT NO. 4029 BY AJ CHECKED DBS Hydrogeologic Units in Model Layer 11 DRAWN AEM
DCHSA_Units-DRAWING NAME Recharge2017 0 410 820
FeeDRAWING DATE Oct. 10, 2017 CLIENT: FIGURE NO.
t REVISION DATE Dec. 01, 2017 A-11 EMSI Engineering Management Support, Inc. G:\ARCGIS\DenverColiseum\DCHSA_Units-Recharge2017.mxd