add (previously not rated) sweet delight
TRANSCRIPT

Company Note Food & Beverages │ Singapore │ September 10, 2021
IMPORTANT DISCLOSURES, INCLUDING ANY REQUIRED RESEARCH CERTIFICATIONS, ARE PROVIDED AT THE END OF THIS REPORT. IF THIS REPORT IS DISTRIBUTED IN THE UNITED STATES IT IS DISTRIBUTED BY CGS-CIMB SECURITIES (USA), INC. AND IS CONSIDERED THIRD-PARTY AFFILIATED RESEARCH.
Powered by the EFA Platform
INITIATION
Insert Insert
Delfi Ltd Sweet delight
■ Delfi’s 40% market share (FY20) and established trade channels in Indonesia will likely drive EPS growth of 15%/16%/4% for FY21F/FY22F/FY23F.
■ Trimming of non-performing SKUs by 40% from c.500 in 2015 to c.300 SKUs in 2017 enables Delfi to better capture novel consumer tastes and trends.
■ Initiate coverage with an Add rating and a TP of S$1.02, pegged at the 3-year historical mean P/E of 20x on FY22F EPS with easing restrictions as catalyst.
Reigning chocolatier in Indonesia According to Euromonitor, Delfi commands c.40% of Indonesia’s chocolate confectionery
market based on retail value in 2020. Its flagship brand, SilverQueen, is also the leading
brand in the nation. Indonesia is a key driver to Delfi’s profitability, generating c.70% of its
sales and more than c.90% of its EBITDA over the past five years (FY15-20). Despite
Covid-19, Delfi’s sales recovered from the trough of US$70.5m in 2Q20 to a normalised
level of US$119.4m in 1Q21. Given Delfi’s established presence in Indonesia, we expect
sales momentum to grow beyond pre-Covid-19 levels by FY22F, supporting EPS growth
of 15%/16%/4% for FY21F/FY22F/FY23F.
Portfolio facelifted for 3-year revenue CAGR over 5% Since 2015, Delfi has rationalised its product offerings via: (1) expanding its product
offering through various joint ventures; (2) strategic brand acquisitions; and (3) an
extensive portfolio rationalisation exercise in 2015-17 to remove non-performing SKUs
across its numerous brands. This expanded Delfi’s presence across various chocolate
categories and other snacking segments, while maintaining a stable and lean portfolio
comprising c.300 SKUs since 2017 from c.500 SKUs in 2015. Delfi has since enjoyed
greater operating efficiencies and reduced risk of inventory obsolescence.
Strong balance sheet to support dividend payout Relative to regional peers that are mostly in net debt position, Delfi had a net cash of
US$65.5m as of FY20. This sustained its cash dividend of 2.35 US cents in FY20 despite
38% yoy decrease in net profit, on the back of positive cash flow of US$8m, after paring
down debt. The dividend represented a modest yield of c.4%, which we believe is
sustainable into FY23F. Peers average dividend yield at 2.2%.
Trading at -1 s.d.; initiate coverage with Add and a TP of S$1.02 Delfi trades at an attractive valuation of 15.8x forward 12m P/E, which is more than 1 s.d.
below its 3-year mean and below regional peers’ valuations of 27.1x. We peg our TP of
S$1.02 to 20x FY22F P/E and project demand recovery as Covid-19 cases wane across
Delfi’s operating geographies. Delfi used to trade at around c.25x P/E in FY18-19. We
expect business conditions to recover by FY23F. Re-rating catalysts are strong domestic
recovery of demand in Indonesia and sustained growth in the Philippines and Malaysia.
Downside risks are loss of market share for chocolate confectionery and weaker market
dynamics.
SOURCES: CGS-CIMB RESEARCH, COMPANY REPORTS
Singapore
ADD (previously NOT RATED)
Consensus ratings*: Buy 1 Hold 1 Sell 0
Current price: S$0.775
Target price: S$1.02
Previous target: N.A.
Up/downside: 32.1%
CGS-CIMB / Consensus: -3.4%
Reuters: DELF.SI
Bloomberg: DELFI SP
Market cap: US$353.8m
S$473.6m
Average daily turnover: US$0.26m
S$0.34m
Current shares o/s: 611.2m
Free float: 43.2% *Source: Bloomberg
Key changes in this note
N/A.
Source: Bloomberg
Price performance 1M 3M 12M Absolute (%) -8.3 -15.8 7.6
Relative (%) -4.7 -13.6 -16.5
Major shareholders % held Berlian Enterprises Ltd 52.0
First Pacific Advisors LP 8.1
Aberdeen Standard Investments Asia Ltd
4.9
Insert
Analyst(s)
TAY Wee Kuang
T (65) 6210 8604 E [email protected]
Financial Summary Dec-19A Dec-20A Dec-21F Dec-22F Dec-23F
Revenue (US$m) 440.7 385.1 415.6 434.9 455.1
Operating EBITDA (US$m) 59.91 43.88 49.28 54.58 56.67
Net Profit (US$m) 28.22 17.48 20.11 23.35 24.36
Core EPS (US$) 0.046 0.029 0.033 0.038 0.040
Core EPS Growth 40.9% (37.9%) 15.0% 16.1% 4.3%
FD Core P/E (x) 12.58 20.24 17.60 15.15 14.52
DPS (US$) 0.024 0.024 0.024 0.024 0.024
Dividend Yield 4.06% 4.06% 4.06% 4.06% 4.06%
EV/EBITDA (x) 5.87 7.63 6.21 5.60 5.08
P/FCFE (x) 8.62 13.09 8.71 21.20 10.41
Net Gearing 0.3% (7.4%) (19.7%) (19.1%) (25.4%)
P/BV (x) 1.56 1.57 1.53 1.47 1.41
ROE 13.0% 7.7% 8.8% 9.9% 9.9%
% Change In Core EPS Estimates
CGS-CIMB/Consensus EPS (x) 0.87 0.78 0.68
71.0
80.0
89.0
98.0
107.0
116.0
0.500
0.600
0.700
0.800
0.900
1.000
Price Close Relative to FSSTI (RHS)
2
4
6
8
Sep-20 Dec-20 Mar-21 Jun-21
Vo
l m
Food & Beverages │ Singapore
Delfi Ltd │ September 10, 2021
2
Sweet delight
Investment thesis
Market leadership to catalyse recovery
Delfi has an established portfolio of chocolate confectionery brands, such as
“SilverQueen” (Fig 1), “Ceres” (Fig 2) and “Delfi” (Fig 3), making them the market
leader, in terms of retail value, for branded chocolate confectionery product in
Indonesia.
According to Euromonitor, Delfi (via its subsidiary PT Ceres) commands c.40% of
Indonesia’s chocolate confectionery market based on retail value in 2020 (Fig 4).
Its flagship brand SilverQueen is also the leading brand in the nation. Indonesia
is a key driver of Delfi’s profitability, generating c.70% of its sales and more than
c.90% of its EBITDA over the past five years (FY15-20).
Figure 1: SilverQueen Figure 2: Ceres Figure 3: Delfi
SOURCES: CGS-CIMB RESEARCH, COMPANY REPORTS SOURCES: CGS-CIMB RESEARCH, COMPANY REPORTS SOURCES: CGS-CIMB RESEARCH, COMPANY REPORTS
Figure 4: PT Ceres (by Delfi) commands 39-40% market share by
retail value in Indonesia
Figure 5: SilverQueen brand is the market leader (19%) in
Indonesia by retail value
SOURCES: CGS-CIMB RESEARCH, EUROMONITOR SOURCES: CGS-CIMB RESEARCH, EUROMONITOR
We believe that Delfi can better capture the recovery in chocolate confectionery
consumption, underpinned by its market leadership (Fig 4) and brand dominance
in Indonesia (Fig 5).
Indonesia’s chocolate confectionery consumption dipped in FY20, hurt by the
Covid-19 pandemic, as various sales channels, especially modern trade channels
such as supermarkets and hypermarkets that are usually located in shopping
malls, were hit by lockdowns. An uncertain economic and income outlook also
hurt consumption of chocolates, which typically has elastic demand.
However, Delfi’s sales bottomed at US$70.9m in 2Q20 but recovered sequentially
to a normalised level of US$119.4m in 1Q21. Even though revenues fell to
US$91.1m in 2Q21 alongside a resurgence of Covid-19 cases within the country,
the sales level remained 29% higher yoy (Fig 6), indicating that Indonesians’
preference for chocolate confectionery consumption is enduring. As such, we
believe that demand for chocolate confectionery troughed in 2Q20. The
International Monetary Fund (IMF) projected Indonesia’s GDP to grow by 3.9%
Market share (%) 2016 2017 2018 2019 2020 2021
Ceres PT (Delfi Ltd) 44.7 42.6 44.0 45.0 40.2 39.2
Mayora Inda Tbk PT 21.9 24.2 24.3 24.7 25.7 28.3
Mondelez Indonesia PT 9.0 9.5 9.2 8.8 8.8 9.6
Ferrero & related parties 8.6 9.0 8.8 8.6 8.4 6.9
Garudafood Group 5.7 4.9 4.5 4.2 4.3 4.5
Market share (%) 2017 2018 2019 2020 2021
SilverQueen (Delfi Ltd) 21.2 22.0 22.6 18.1 19.1
Choki Choki 13.1 13.4 13.6 13.7 15.7
Beng-Beng 11.1 10.8 11.1 12.0 12.6
Kinder Joy 7.4 7.2 7.1 6.9 5.6
Cadbury Dairy Milk 5.8 5.6 5.4 5.4 5.9

Food & Beverages │ Singapore
Delfi Ltd │ September 10, 2021
3
for 2021 after contracting 2.1% in 2020, indicating that an economic recovery is in
play.
Figure 6: Quarterly revenue/EBITDA trend from FY18
SOURCES: CGS-CIMB RESEARCH, COMPANY REPORTS
Refreshed portfolio offering
Delfi continually assesses its product portfolio to grow its accessible markets. In
2015-17, Delfi reduced its portfolio SKU by 40% from c.500 to c.300 units by
removing sub-par SKUs. A leaner stable reduces the risk of inventory
obsolescence and increases focus on better performing SKUs. Total inventories
written off and allowance made for inventory obsolescence also trended down
during the period (Fig 7). The worsening of inventory obsolescence in FY19 and
FY20 was due to higher inventory levels from higher sales momentum in FY19,
as well as inability to clear inventory in FY20 when Covid-19 hit demand after
footfall in modern trade channels fell, following closure of supermarket and
hypermarkets. Delfi partners and acquires strategic brands (Fig 8) to build product
offerings and presence in related snacking segments.
Figure 7: Inventory obsolescence (US$ m)
SOURCES: CGS-CIMB RESEARCH, COMPANY REPORTS
Title:
Source:
Please fill in the values above to have them entered in your report
0
5
10
15
20
25
0
20
40
60
80
100
120
140
1Q18 2Q18 3Q18 4Q18 1Q19 2Q19 3Q19 4Q19 1Q20 2Q20 3Q20 4Q20 1Q21 2Q21
Revenue (US$m) EBITDA (US$m)
Steady recovery before resurgence of Covid-19 woes in 2Q21
Revenue restatement from IFRS 15No impact on EBITDA
Title:
Source:
Please fill in the values above to have them entered in your report
1.4
1.9
2.1
0.7
1.2
2.1
1.9
3.12.3 2.0
3.13.7
0
1
2
3
4
5
6
7
8
FY15 FY16 FY17 FY18 FY19 FY20
Inventories written off Allowance made for inventory obsolescence
Gradually improving inventory obsolescence level during SKU rationalisation.
FY19: Result of higher inventory levels from higher sales momentum.
FY20: Lower sales from Covid-19 impact led to higher obsolescence.

Food & Beverages │ Singapore
Delfi Ltd │ September 10, 2021
4
Figure 8: Notable partnerships and brand acquisitions in recent years
SOURCES: CGS-CIMB RESEARCH, COMPANY REPORTS
Figure 9: Choco Pie soft biscuit with Orion Corporation Figure 10: Delfi Big Thunder/Black Thunder chocolates
SOURCES: CGS-CIMB RESEARCH, QOO10 SOURCES: CGS-CIMB RESEARCH, QOO10
Figure 11: Van Houten brand’s range of chocolate/cocoa products
SOURCES: CGS-CIMB RESEARCH, COMPANY REPORTS
Established distribution network as an engine for expansion
Across its operating regions, Delfi manages over 1m point-of-sales, granting the
company access to a wide sales network, including hard-to-reach, independent
traditional trade channels, such as “warungs” in Indonesia and “sari-sari” stores in
the Philippines. We believe that Delfi’s strong access to both modern and
traditional trade channels, especially in its key growth markets, acts as both a
sword and a shield – it creates potential opportunities to work with larger global
players who can tap Delfi’s extensive distribution network, and deters new
entrants via high barriers to entry.
Date Milestones
May 2016
Entered into a joint venture with South Korea's Orion Corporation, one of South Korea's
largest snack and confectionery companies, to develop and market a range of soft biscuit and
cake products (Fig 9) in Indonesia.
April 2017
Entered into a joint venture with Japan's Yuraku Confectionery Company and began the
commercial production of two new chocolate snacks, Delfi Black Thunder and Delfi Big
Thunder (Fig 10).
April 2018Acquired exclusive licence to "Van Houten" chocolate brand from Hershey Singapore Pte.
Ltd. for chocolate and cocoa products (Fig 11) to consumers in Asia and Oceania.

Food & Beverages │ Singapore
Delfi Ltd │ September 10, 2021
5
Its established distribution network is the backbone of its ‘Agency Brands’
business segment (Fig 12). Delfi distributes products from related segments of
other brand principals to complement its existing product portfolio.
Figure 12: Delfi’s Agency Brands portfolio
SOURCES: CGS-CIMB RESEARCH, COMPANY REPORTS
Dividend outlook stable on strong cash generation
Delfi’s FY20 dividend payout of 2.35 US cents, representing a payout ratio of 82%,
sets a precedent for the company given its historical payout ratio of 50-55% (Fig
13). The payout was justifiable given the strong cash flow generation in FY20,
where net cash balance increased US$8m to US$65.5m. We believe that Delfi will
continue to see strong cash generation in FY21 given capex deferment and lower
working capital requirement before sales momentum returns to pre-pandemic
levels. This supports a similar dividend payout in FY21, representing a modest
c.4% dividend yield.
Figure 13: Cash generation in FY20 supported payout ratio beyond historical 50-55%
SOURCES: CGS-CIMB RESEARCH, COMPANY REPORTS
Title:
Source:
Please fill in the values above to have them entered in your report
0.0%
25.0%
50.0%
75.0%
100.0%
0
20
40
60
80
FY16 FY17 FY18 FY19 FY20
Cash balance (US$m) Dividend payout ratio

Food & Beverages │ Singapore
Delfi Ltd │ September 10, 2021
6
Key financials and forecasts
Revenues to recover from Covid-19 speed bump
Post its SKU-rationalisation exercise in FY15, DELFI experienced consecutive
growth in revenues since FY17 before the Covid-19 pandemic speed-bumped its
growth in FY20 (Fig 14). In FY20, IFRS 15 required certain SG&A expenses to be
netted off against revenue, resulting in lower reported revenues for the financial
year. In light of Covid-19 uncertainties and low vaccination rates in Indonesia and
the Philippines, we project a conservative 3-year revenue CAGR of 5.7% in
FY21F-23F.
Figure 14: Revenue underscores underlying growth trends (US$ m)
SOURCES: CGS-CIMB RESEARCH, COMPANY REPORTS
Stable margins on responsive business tactics
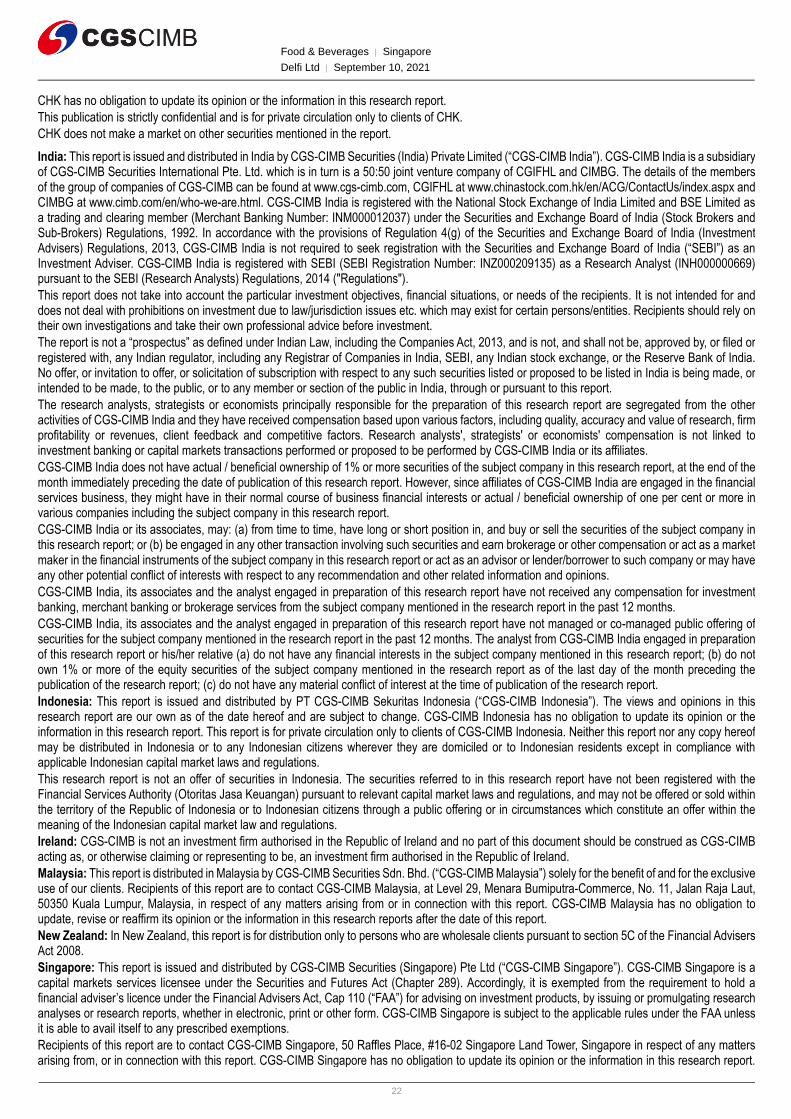
Despite raw material price volatilities, Delfi maintained its gross margins over the
years, barring the impact of IFRS 15 (Fig 15). Delfi procures key ingredients, such
as cocoa, milk and sugar, via futures contracts of up to a year in advance. Delfi
also adjusts product sizes (i.e. right-sizing) to stave off margin pressures (Fig 16).
Figure 15: Relatively stable margins on good control measures
SOURCES: CGS-CIMB RESEARCH, COMPANY REPORTS
Title:
Source:
Please fill in the values above to have them entered in your report
405.9 402.1
381.3
427.0
471.6
440.7
385.1
415.6
434.9
455.1
300.0
320.0
340.0
360.0
380.0
400.0
420.0
440.0
460.0
480.0
500.0
FY15 FY16 FY17 FY18 FY19 FY19(res.)
FY20 FY21F FY22F FY23F
Impact of IFRS 15
3-year CAGR: 5.7%
Title:
Source:
Please fill in the values above to have them entered in your report
25%
30%
35%
40%
FY15 FY16 FY17 FY18 FY19 FY19(res.)
FY20 FY21F FY22F FY23F
Impact of IFRS 15
Gradual recovery of margins expected
Improving margins a result of 'premiumisation'
Food & Beverages │ Singapore
Delfi Ltd │ September 10, 2021
7
Figure 16: SilverQueen Milk Chocolate Almond of various service sizes (30g, 68g, 65g)
SOURCES: CGS-CIMB RESEARCH, LAZADA
Any slight variations in margins are generally due to macro conditions favouring
sales through its trade channels. Modern trade commands higher margins than
general trade. Before the pandemic hit, margins improved as consumption
skewed towards premium products. However, margins were affected in FY20
when movement restrictions hampered footfall in modern trade channels and
consumers shopped at general trade channels nearer to their residences.
Improved working capital cycle
In FY16-20, its working capital cycle lengthened considerably from 91 days to 146
days but 1H21 saw a drastic improvement back to 112 days (Fig 17). The
improvement was squared across higher sales momentum, better inventory
management and more efficient collection of receivables.
Nevertheless, we are cognisant that the working capital cycle could trend higher
as business outlook improves. Inventory stock-ups may be required in anticipation
of business recovery and ahead of festive seasons, such as Christmas and
Valentine’s Day. Delfi typically holds two months of inventory to ensure timely
fulfilment of orders.
Figure 17: Improving operating ratios
SOURCES: CGS-CIMB RESEARCH, COMPANY REPORTS
Title:
Source:
Please fill in the values above to have them entered in your report
20
45
70
95
120
0
40
80
120
160
FY15 FY16 FY17 FY18 FY19 FY20 1H21
LHS: working capital cycle days RHS: Inventory turnover days
RHS: AR turnover days RHS: AP turnover days

Food & Beverages │ Singapore
Delfi Ltd │ September 10, 2021
8
Valuations and recommendation
Delfi’s historical share price performance has been dismal, falling by more than
80% from its peak in 2013 post the divestment of its cocoa ingredients business.
We believe reasons for the weakness in share price are: (1) its business
restructuring, which saw revenues falling 6% in FY15-17 , (2) one-off charges of
US$19.7m in FY15, which sunk Delfi into losses, and (3) exit of several substantial
shareholders, such as Aberdeen, Commonwealth Bank of Australia and Fidelity,
from 2018 (Fig 18).
Nevertheless, we believe that the various overhangs on Delfi’s share price have
been lifted and the share price is poised for a re-rating following a stable operating
outlook and improving recovery prospects.
While the stock traded at lofty valuations above 50x forward P/E in 2016, Delfi is
currently trading at an attractive 15.8x of forward P/E (Fig 19), in our view. This is
1 s.d. below its 3-year historical mean, where Delfi has been trading at a tighter
trading band, and well below peers’ 27.1x (Fig 20). We believe that valuations will
stabilise and peg our TP to 20x FY22F P/E at S$1.02, representing an upside
potential of 27.2%.
Delfi also maintains a strong balance sheet position given Delfi’s net cash position
compared to its peers (Fig 21) as of 10 Sep 2021, which leaves more room for a
valuation re-rating to closer to peers’ and reversion to FY18-FY19’s level of 25x
on positive macroeconomic outlook.
We opted for a P/E-based valuation as there is greater visibility of near-term
earnings outlook with better comparability to peers’ valuation.
Figure 18: 10-year snapshot of share price movements
SOURCES: CGS-CIMB RESEARCH, BLOOMBERG
Title:
Source:
Please fill in the values above to have them entered in your report
0
0.5
1
1.5
2
2.5
3
3.5
4
4.5
5
2011 2012 2013 2014 2015 2016 2017 2018 2019 2020 2021
Sha
re p
rice
(S
$)
Departure of significant stakeholders such as Aberdeen, Commonwealth Bank of Australia and Fidelity.
Period of corporate restructuring.
Disposal of cocoa ingredients business to Barry Callebaut.

Food & Beverages │ Singapore
Delfi Ltd │ September 10, 2021
9
Figure 19: Delfi 12-month forward core P/E
SOURCES: CGS-CIMB RESEARCH, COMPANY REPORTS
Figure 20: Peers Comparison
SOURCES: CGS-CIMB RESEARCH ESTIMATES, COMPANY REPORTS, BLOOMBERG
DATA AS AT 10 SEP 2021
Figure 21: Delfi is in a net cash position vs. peers (as of latest reporting date)
SOURCES: CGS-CIMB RESEARCH, COMPANY REPORTS
DATA AS AT 10 SEP 2021
10
15
20
25
30
35
40
45
50
55
60
Jun-16 Dec-16 Jun-17 Dec-17 Jun-18 Dec-18 Jun-19 Dec-19 Jun-20 Dec-20 Jun-21
P/E
mu
ltip
le (
X)
Delfi 12mth fwd core P/E 3-year historical : 20.4x
3-year historical : 20.4x
+1SD: 24.4x
Bloomberg Price
Target
Price
Market
Cap Core P/E (x) 3-year EPS P/BV (x)
Recurring
ROE (%)
Dividend
Yield (%)
Company Ticker Recom. (lcl curr) (lcl curr) (US$ m) CY21F CY22F CAGR (%) CY21F CY21F CY21F
Delfi Ltd DELFI SP Add 0.77 1.02 350 17.4 15.0 11.7% 1.51 8.8% 4.1%
Mayora Indah MYOR IJ Add 2,240 2,500 3,514 23.9 20.3 12.3% 4.19 18.5% 2.3%
Nestle (Malaysia) NESZ MK Hold 135.0 135.4 7,631 51.6 44.8 11.0% 55.60 111.7% 1.9%
Universal Robina Corporation URC PM Add 145.4 161.0 6,418 26.1 25.7 N/A 3.23 12.7% 2.2%
Indofood CBP ICBP IJ Add 8,525 11,000 6,975 15.6 14.1 5.4% 2.99 20.6% 2.5%
Simple average 29.3 26.2 9.6% 16.50 40.9% 2.2%
Company Currency
Cash and cash
equivalents
(lcl currency
millions
LT + ST debt
(lcl currency
millions)
Net cash/(debt)
(lcl ccy
millions)
Delfi Ltd S$ 75 51 24 Net Cash
Mayora Indah Rp 3,740,976 4,860,827 (1,119,851) Net Debt
Indofood CBP Rp 10,671,942 31,716,578 (21,044,636) Net Debt
Nestle (Malaysia) RM 10 552 (541) Net Debt
Universal Robina Corporation Php 16,772 48,139 (31,367) Net Debt

Food & Beverages │ Singapore
Delfi Ltd │ September 10, 2021
10
Key investment risks
1. Exchange rate risks
Delfi is exposed to risks arising from sales, purchases and operating costs in
currencies other than the respective functional currencies of its businesses, which
are predominantly denominated in Indonesian rupiah (Rp). In particular, the US
dollar is a key currency as it is the reporting currency as well as the currency at
which most of Delfi’s raw materials trade. As such, an unfavourable Rp/US$
movement could negatively impact the company’s profitability. The company
enters into foreign exchange forward contracts to manage its currency exposure
from transactions.
2. Claims associated with disposal of cocoa ingredients division
Following the sale of Delfi Cacau Brasil Ltda to Barry Callebaut in 2013, Delfi was
notified of nine claims by the Brazil tax authorities amounting to US$17.7m
associated with the sale, as stated in Delfi’s 1H21 results update. The board and
management of Delfi believe there are grounds to resist these claims and will keep
shareholders updated on any material developments in relation to the claims. Delfi
believes that it has recognised adequate provisions for the claims but did not
disclose further details as it could seriously prejudice Delfi’s position in the
proceedings. A negative outcome of the proceedings could impact the financial
position of the company.
3. Sensitivity to key raw material costs
Delfi is reliant on a few key ingredients for the production of its products, such as
cocoa, sugar, and milk. As such, during periods of price volatility, gross profit
margins may be impacted due to a lagged effect of passing on cost pressures.
Inventory stock-up in anticipation of future price increases may also result in
reduced cash flows.
4. Change in competitive landscape of the industry
Delfi’s well-established trade channel is its competitive edge against competitors.
Foreign brands generally withhold network investments in Indonesia due to the
lower chocolate consumption per capita. However, should demand in Indonesia
become lucrative enough for competitors to establish their presence in the market,
Delfi will have to field against competitors which have larger scale of operations.
This can potentially reduce market share for its products, in our view.

Food & Beverages │ Singapore
Delfi Ltd │ September 10, 2021
11
Company background
More than a chocolate company
Delfi manufactures, markets and distributes chocolate and other confectioneries.
Apart from its own brands, Delfi also carries third-party agency brands through its
distribution channels. The company first established its business in Indonesia and
has since expanded operations regionally to include the Philippines, Malaysia,
and Singapore.
Delfi was founded in the 1950s when the SilverQueen and Ceres brands were first
launched in Indonesia. The company was listed on SGX’s mainboard in 2004 as
Petra Foods. After the sale of its cocoa ingredients business in 2013, it was
renamed Delfi Ltd in 2016.
Vertically integrated with two main segments
Delfi operates two product segments: (1) own brands, which produces, sells, and
distributes its chocolates and other confectioneries; and (2) agency brands, where
it distributes a portfolio of products from other brand principals in its operating
geographies.
Own Brands
Delfi manufactures products across different chocolate formats as well as other
adjacent categories, such as sweets and snacks (Fig 22).
The key markets are Indonesia and the Philippines; SilverQueen and Goya are its
dominant brands in the two countries, respectively.
Figure 22: Delfi’s Own Brands portfolio as of Sep 21
SOURCES: CGS-CIMB RESEARCH, COMPANY REPORTS
Agency Brands
This segment complements and broadens Delfi’s portfolio of confectionery
products and includes chocolate & sugar confectionery, snacks & wafers, culinary,
breakfast, and healthcare products. The larger product offering allows Delfi to
widen and deepen its access to all retail formats, thus raising operating leverage.
The agency brands are marketed mainly in the other regional markets. The share
of own brands in these markets is lower than in Indonesia.
In FY18-20, own brand sales made up 60-65% of total revenue while agency
brand sales made up the remaining 35-40% (Fig 23). Own brand sales in
Indonesia, make up 74% of Indonesia’s sales (Fig 24) due to a stronger brand
presence, while making up only 40% of other regions’ sales (Fig 25).

Food & Beverages │ Singapore
Delfi Ltd │ September 10, 2021
12
Figure 23: Revenue composition across business segments/geographies
SOURCES: CGS-CIMB RESEARCH, COMPANY REPORTS
Figure 24: Revenue composition – Indonesia Figure 25: Revenue composition – Philippines, Malaysia, and
Singapore
SOURCES: CGS-CIMB RESEARCH, COMPANY REPORTS SOURCES: CGS-CIMB RESEARCH, COMPANY REPORTS
50.6% 52.2% 52.1% 54.6% 51.5% 47.5%
11.8% 11.2% 11.6% 11.2% 11.4% 13.0%
19.6% 20.1% 19.0% 17.0% 18.8% 18.8%
18.0% 16.4% 17.4% 17.1% 18.3% 20.7%
0%
20%
40%
60%
80%
100%
FY15 FY16 FY17 FY18 FY19 FY20
Indonesia - Own brands Others - Own brands
Indonesia - Agency brands Others - Agency brands
72% 72% 73% 76% 73% 72%
28% 28% 27% 24% 27% 28%
0%
10%
20%
30%
40%
50%
60%
70%
80%
90%
100%
FY15 FY16 FY17 FY18 FY19 FY20
Own brands Agency brands
40% 41% 40% 40% 38% 39%
60% 59% 60% 60% 62% 61%
0%
10%
20%
30%
40%
50%
60%
70%
80%
90%
100%
FY15 FY16 FY17 FY18 FY19 FY20
Own brands Agency brands

Food & Beverages │ Singapore
Delfi Ltd │ September 10, 2021
13
Business conduct
Delfi engages in sales across three broad sales channels: (1) modern trade; (2)
general trade; and (3) e-commerce (Fig 26).
Figure 26: Delfi’s sales channels
SOURCES: CGS-CIMB RESEARCH, COMPANY REPORTS
1. Modern trade
Modern trade channels include minimarts, convenience stores, supermarkets,
hypermarts, and pharmacies. Delfi collaborates directly with its retail partners to
sell its products with negotiated promotions, formats and price points, supported
by merchandising, planogramming, and marketing campaigns. Within modern
trade, neighbourhood minimarts and provision stores (known as “warungs” in
Indonesia and “sari-sari” in the Philippines) are popular choices among
consumers who now shop closer to home in view of Covid-19 government
restrictions on their movements. In terms of product mix, Delfi’s modern trade
comprises premium products, which have higher margins compared to value
products. In FY20, modern trade made up c.35% of the group’s total revenue.
2. General trade
Unlike modern trade, general trade involves approaching customers directly.
Interpersonal relationships are forged between Delfi and end-users. Delfi sells its
value products through general trade. Despite modern trade being its main
revenue source, Delfi has renewed focus on general trade since FY19 in a bid to
drive sales volumes for Own Brands. Delfi aims to cultivate general trade as its
second engine of growth following modern trade.
3. E-commerce
Delfi also distributes via several e-commerce channels, including Lazada, Shopee,
Tokopedia, and Bukalapak. In FY20, Delfi accelerated its Malaysian e-commerce
business to support online shopping during the pandemic. The group expanded
from its Delfi e-stores, Dmart.my and Delfi brand store in Lazada and Shopee to
Q-commerce stores, such as Foodpanda and GrabFood, which offer one-hour
delivery services. Nevertheless, sales through e-commerce channels have been
weak within the chocolate confectionery industry for the following reasons – (1)
small ticket size means that demand needs to be driven by other grocery products,
Food & Beverages │ Singapore
Delfi Ltd │ September 10, 2021
14
and (2) logistical challenges, especially in inaccessible geographies like Indonesia,
where poorer transportation infrastructure may result in the chocolates melting
during delivery.
Market presence
Indonesia
The country remains the key market since Delfi’s founding, where the company
has grown into the largest chocolate confectionery player with more than 50%
market share. According to Euromonitor, Indonesia only consumes 0.3kg of
chocolate per capita in 2017. This is in stark contrast with European countries,
which consume 8-9kg of chocolate per capita, and also lower compared to other
developed Asian economies, like Japan and South Korea, which consume roughly
2kg of chocolate per capita. This provides scope for growth in chocolate
consumption as GDP per capita increases due to its status as an affordable luxury.
Consumption of chocolate confectionery in terms of value is expected by
Euromonitor to deliver a CAGR of 5% in 2021-26F so Delfi is well-positioned in
the market to benefit from the increase in demand.
Furthermore, Delfi has noted increased premiumisation of consumption patterns
as sales through modern trade channels, which consist of more premium products,
now make up more than 50% of sales within the country compared to five years
ago, when sales through traditional trade channels made up the majority.
The Philippines
The Philippine market is similar to Indonesia’s in terms of demographics, with
substantial room for growth attributable to low chocolate confectionery
consumption. Delfi ventured into the Philippine market in 2006 through the
acquisition of two well-established local brands, Goya and Knick Knacks.
Revenue in the Philippines is therefore largely driven by Own Brands. In FY20,
Delfi registered yoy c.38% growth for Goya Spreads and doubled Goya Culinary
volume sales despite the shadow cast by the pandemic on the confectionery
sector. This was achieved through improving product visibility.
The fast-growing Philippine economy with a young and rising middle class is a
near-term catalyst for Delfi’s growth strategy in the country. In order to capture the
Gen Z and millennial markets, Delfi has tapped social media and online platforms.
In FY20, it partnered various YouTube vloggers and Instagram influencers to
launch digital campaigns, such as #GVOTD (Goya Vibes of the Day). Delfi
attained almost 10m views for its video collaborations with local personalities on
Facebook. In addition, two online stores, Goya Shopee and its Lazada e-
commerce page, were launched to facilitate accessibility of its products to
customers.
Other markets
In Malaysia and Singapore, Delfi distributes agency brands such as Pringles,
Ritter Sport, Smucker’s, Kikkoman, and Woods’. Malaysia remains Delfi’s second-
largest market with c.28% revenue contribution in 1H21. Moving forward, Delfi
plans to increase its Own Brands presence in Malaysia and Singapore through
revamping of its Van Houten brand. Van Houten was acquired in FY18 and is one
of Delfi’s more widely-known brands.

Food & Beverages │ Singapore
Delfi Ltd │ September 10, 2021
15
Figure 27: Growing gross revenues in Malaysia and Singapore
SOURCES: CGS-CIMB RESEARCH, COMPANY REPORTS
Key corporate milestones
Figure 28: How Delfi Ltd came to be
SOURCES: CGS-CIMB RESEARCH, COMPANY REPORTS
Title:
Source:
Please fill in the values above to have them entered in your report
57.0
63.0
73.2
80.1 81.7
0.6 0.9 2.0 2.0 2.1
-
10.0
20.0
30.0
40.0
50.0
60.0
70.0
80.0
90.0
FY16 FY17 FY18 FY19 FY20
Rev
enu
e (U
S$)
Malaysia Singapore

Food & Beverages │ Singapore
Delfi Ltd │ September 10, 2021
16
Management Team
Figure 29: Management team’s background
SOURCES: CGS-CIMB RESEARCH, COMPANY REPORTS
Position Name Joined Delfi in Background
Group Chief
Executive
Officer
Mr John
Chuang
Tiong
Choon
1984 Mr Chuang established the Company in 1984 and was subsequently appointed Chief Executive
Officer. Under the Singapore Business Awards, Mr Chuang was awarded the title of Best CEO of
2011; and in 2012, he was recognised as Businessman of the Year. In 2015, Mr Chuang received
the SG50 Outstanding Chinese Business Pioneers Award. Prior to founding Delfi, Mr Chuang
undertook the appointments of both Vice-Chairman of the Independence Bank of California and
the President of Wardley Development Inc., California.
Group Chief
Financial Officer
Mr
Richard
Chung
2005 Mr Chung has more than 28 years of experience in financial management, financial and business
analysis, capital raising, and investor relations, among others. He has been with Delfi for more than
fifteen years. Immediately prior to joining the Group as the Head Corporate Planning, Mr Chung
was Director Research for ABN AMRO Securities (Singapore).
Chief of
Manufacturing
and Quality
Mr
Michael
Wynne
Roberts
2019 Mr Roberts has more than 23 years of experience in chocolate manufacturing. From 1994 to 2014,
Mr Roberts held various senior positions within Barry Callebaut, which included 10 years as Vice
President, Supply Chain and Manufacturing. He left Barry Callebaut in 2014 to join Louis Dreyfuss
Co as Asia Head of Industry, and returned to Barry Callebaut as Site Director in 2017, where he
remained immediately prior to joining Delfi.
Director
(Business
Strategy)
Mr Amos
Moses
Yang
2012 Mr Yang has over 20 years of experience in Sales and Marketing. He spent the majority of his
career in the US where he held various Marketing and Sales management positions within
Novartis Consumer Health, L’Oreal Paris and Philip Morris USA. Mr Yang has extensive FMCG
experience across major multinational companies.
President
Director, PT
Nirwana Lestari
Mr Ferry
Haryanto
1995 Mr Haryanto has more than 10 years of experience in sales and marketing roles with PT Guinness
Indonesia, San Miguel Brewery Indonesia and PT Gunung Agung Trading from 1982 to 1995. He
served as the Commercial Director for PT Gunung Agung Trading.
President
Director, PT
Perusahaan
Industri Ceres
Ms Nancy
Florencia
1991 Ms Florencia assumed both roles as President Director and Finance Director of PT Perusahaan
Industri Ceres in 2017. Prior to joining Delfi, Ms Florencia had 10 years of experience in
accounting and financial positions in PT Indocement, PT Henoch Jaya and the PT Kedaung Group.

Food & Beverages │ Singapore
Delfi Ltd │ September 10, 2021
17
ESG in a nutshell
Delfi scored a C for its combined ESG score as rated by Refinitiv in 2020, with a C for Social (c. 45% weightage of its combined ESG score), C+ for Governance (c. 26% weightage), and D+ for Environmental (c. 29% weightage). However, we think Delfi’s actual ESG combined score could be higher since some components in the Environmental and Governance pillars may not have been accurately reflected. Delfi’s ESG scores remained relatively stable from FY18 to FY20, according to Refinitiv. In FY20, Delfi reduced its carbon footprint by opting for liquid petroleum gas (LPG), instead of bunker fuel oil (BFO), in its manufacturing facilities. LPG is less pollutive compared to BFO.
Keep your eye on Implications
In 2015, Barry Callebaut notified Delfi of various claims
from the Brazil tax authorities against the former Delfi
Cacau Brazil Ltda (DCBR), which Barry Callebaut
purchased from Delfi as part of the sale of the cocoa
ingredients business in 2013. As of FY20, Delfi’s total
exposure in respect to tax and labour claims in Brazil was
c.S$17.7m, as stated in Delfi’s 1H21 results update. Delfi
believes that there are grounds to resist these claims and
has since requested Barry Callebaut to defend the claims.
We believe that c.US$17.7m will significantly impact Delfi’s
financials. Since details have not been finalised and have
not been done so for the past six years, we did not factor
these claims into our valuations.
ESG highlights Implications
According to Refinitiv, Delfi’s ESG performance is
comparable to peers with relatively strong E, S, and G
scores.
However, we think Delfi’s combined ESG score can be
higher, especially for its Environmental pillar. For example,
Delfi is supported by a Market Sustainability and Strategy
Committee (MSSC) to oversee its sustainability policies.
Furthermore, Delfi has set clear targets for water and
energy efficiencies, evidenced by its 70% yoy reduction of
bunker fuel oil usage in FY20.
We think that Delfi takes measured steps in its ESG
approach, which can potentially benefit its financials in the
form of reduced costs. These are not factored into our
valuations.
Trends Implications
Delfi’s Governance score fared better in FY20 with a C+,
compared to a C in FY19. This is attributable to
improvements in its board meeting attendance average, as
well as executive members’ gender diversity percentage.
We think Delfi’s FY20 Governance score could be better
than C+. For example, Delfi has a clear corporate
governance board committee with three executive
Directors and five non-executive independent Directors,
with a transparent separation of the roles of the Chief
Executive Officer and the Chairman.
SOURCES: CGS-CIMB RESEARCH, REFINITIV
Izabella Tan assisted in the generation of the report.

Food & Beverages │ Singapore
Delfi Ltd │ September 10, 2021
18
BY THE NUMBERS
SOURCES: CGS-CIMB RESEARCH, COMPANY REPORTS
7.0%7.7%8.4%9.1%9.8%10.5%11.2%11.9%12.6%13.3%14.0%
0.801.301.802.302.803.303.804.304.805.305.80
Jan-17A Jan-18A Jan-19A Jan-20A Jan-21F Jan-22F
P/BV vs ROE
Rolling P/BV (x) (lhs) ROE (rhs)
-80%-30%20%70%120%170%220%270%320%370%420%
10.015.020.025.030.035.040.045.050.055.060.0
Jan-17A Jan-18A Jan-19A Jan-20A Jan-21F Jan-22F
12-mth Fwd FD Core P/E vs FD Core EPS Growth
12-mth Fwd Rolling FD Core P/E (x) (lhs)
FD Core EPS Growth (rhs)
Profit & Loss
(US$m) Dec-19A Dec-20A Dec-21F Dec-22F Dec-23F
Total Net Revenues 440.7 385.1 415.6 434.9 455.1
Gross Profit 133.1 110.1 122.2 131.4 137.5
Operating EBITDA 59.9 43.9 49.3 54.6 56.7
Depreciation And Amortisation (13.4) (13.8) (13.4) (13.5) (13.7)
Operating EBIT 46.5 30.1 35.9 41.1 43.0
Financial Income/(Expense) (5.0) (4.4) (4.1) (4.1) (4.4)
Pretax Income/(Loss) from Assoc. (0.8) (0.4) 0.0 0.0 0.0
Non-Operating Income/(Expense) 3.2 2.3 0.0 0.0 0.0
Profit Before Tax (pre-EI) 43.8 27.6 31.8 36.9 38.5
Exceptional Items (0.3) 0.0 0.0 0.0 0.0
Pre-tax Profit 43.6 27.6 31.8 36.9 38.5
Taxation (15.4) (10.2) (11.7) (13.6) (14.2)
Exceptional Income - post-tax
Profit After Tax 28.2 17.5 20.1 23.4 24.4
Minority Interests
Preferred Dividends
FX Gain/(Loss) - post tax
Other Adjustments - post-tax
Net Profit 28.2 17.5 20.1 23.4 24.4
Recurring Net Profit 28.1 17.5 20.1 23.4 24.4
Fully Diluted Recurring Net Profit 28.1 17.5 20.1 23.4 24.4
Cash Flow
(US$m) Dec-19A Dec-20A Dec-21F Dec-22F Dec-23F
EBITDA 59.91 43.88 49.28 54.58 56.67
Cash Flow from Invt. & Assoc. 0.82 0.39 0.00 0.00 0.00
Change In Working Capital (11.06) 12.96 17.45 (13.54) 2.86
(Incr)/Decr in Total Provisions
Other Non-Cash (Income)/Expense
Other Operating Cashflow 10.81 3.08 (4.06) (4.11) (4.43)
Net Interest (Paid)/Received (2.39) (2.47) 0.00 0.00 0.00
Tax Paid (18.16) (15.44) (11.70) (13.59) (14.17)
Cashflow From Operations 39.93 42.41 50.97 23.34 40.93
Capex (10.19) (4.48) (7.39) (7.79) (8.12)
Disposals Of FAs/subsidiaries 0.00 0.00 0.00 0.00 0.00
Acq. Of Subsidiaries/investments (0.23) (0.36) (0.49) (0.66) (0.83)
Other Investing Cashflow
Cash Flow From Investing (10.42) (4.84) (7.88) (8.45) (8.95)
Debt Raised/(repaid) 11.51 (10.55) (2.45) 1.80 2.00
Proceeds From Issue Of Shares
Shares Repurchased
Dividends Paid (12.59) (14.51) (14.36) (14.36) (14.36)
Preferred Dividends
Other Financing Cashflow 0.00 0.00 0.00 0.00 0.00
Cash Flow From Financing (1.08) (25.06) (16.81) (12.56) (12.36)
Total Cash Generated 28.43 12.51 26.27 2.32 19.62
Free Cashflow To Equity 41.02 27.02 40.63 16.68 33.98
Free Cashflow To Firm 33.18 40.72 43.08 14.89 31.98

Food & Beverages │ Singapore
Delfi Ltd │ September 10, 2021
19
BY THE NUMBERS… cont’d
SOURCES: CGS-CIMB RESEARCH, COMPANY REPORTS
Balance Sheet
(US$m) Dec-19A Dec-20A Dec-21F Dec-22F Dec-23F
Total Cash And Equivalents 57.6 65.5 91.8 94.1 113.7
Total Debtors 89.8 81.8 85.9 74.3 93.3
Inventories 87.4 76.8 62.8 81.6 69.5
Total Other Current Assets 20.2 20.7 20.5 20.8 21.1
Total Current Assets 255.0 244.9 261.0 270.9 297.7
Fixed Assets 117.0 107.2 102.3 97.8 93.4
Total Investments 2.9 2.4 2.4 2.4 2.4
Intangible Assets 21.6 20.9 20.2 19.7 19.3
Total Other Non-Current Assets 5.8 7.1 7.2 7.2 7.3
Total Non-current Assets 147.3 137.6 132.2 127.1 122.4
Short-term Debt 58.3 48.7 46.3 48.1 50.1
Current Portion of Long-Term Debt
Total Creditors 98.0 90.0 97.9 92.0 102.0
Other Current Liabilities 2.4 1.0 1.0 1.0 1.0
Total Current Liabilities 158.8 139.7 145.2 141.1 153.1
Total Long-term Debt 0.0 0.0 0.0 0.0 0.0
Hybrid Debt - Debt Component
Total Other Non-Current Liabilities 1.8 0.5 0.0 0.0 0.0
Total Non-current Liabilities 1.8 0.5 0.0 0.0 0.0
Total Provisions 14.2 16.5 16.5 16.5 16.5
Total Liabilities 174.7 156.7 161.7 157.5 169.6
Shareholders' Equity 227.5 225.6 231.4 240.4 250.4
Minority Interests 0.1 0.1 0.1 0.1 0.1
Total Equity 227.6 225.7 231.5 240.5 250.5
Key Ratios
Dec-19A Dec-20A Dec-21F Dec-22F Dec-23F
Revenue Growth 3.2% (12.6%) 7.9% 4.6% 4.6%
Operating EBITDA Growth 18.8% (26.8%) 12.3% 10.7% 3.8%
Operating EBITDA Margin 13.6% 11.4% 11.9% 12.6% 12.5%
Net Cash Per Share (US$) (0.00) 0.03 0.07 0.08 0.10
BVPS (US$) 0.37 0.37 0.38 0.39 0.41
Gross Interest Cover 12.67 9.55 12.96 14.88 14.27
Effective Tax Rate 35.3% 36.8% 36.8% 36.8% 36.8%
Net Dividend Payout Ratio 44.2% 83.0% 71.4% 61.5% 59.0%
Accounts Receivables Days 67.18 81.48 73.55 67.18 67.18
Inventory Days 97.1 109.3 86.9 86.9 86.9
Accounts Payables Days 42.59 44.62 42.59 42.59 42.59
ROIC (%) 21.2% 12.5% 16.0% 20.5% 20.6%
ROCE (%) 16.8% 10.7% 13.0% 14.5% 14.6%
Return On Average Assets 8.76% 5.56% 6.23% 6.94% 7.04%
Key Drivers
Dec-19A Dec-20A Dec-21F Dec-22F Dec-23F
Own brands- Indonesia revenue growth (%) N/A -19.4% 10.0% 5.0% 5.0%
Agency brand- Indonesia revenue growth (%) N/A -12.6% 10.0% 5.0% 5.0%

Food & Beverages │ Singapore
Delfi Ltd │ September 10, 2021
20
DISCLAIMER The content of this report (including the views and opinions expressed therein, and the information comprised therein) has been prepared by and belongs to CGS-CIMB. Reports relating to a specific geographical area are produced and distributed by the corresponding CGS-CIMB entity as listed in the table below.
This report is not directed to, or intended for distribution to or use by, any person or entity who is a citizen or resident of or located in any locality, state, country or other jurisdiction where such distribution, publication, availability or use would be contrary to law or regulation.
By accepting this report, the recipient hereof represents and warrants that he is entitled to receive such report in accordance with the restrictions set forth below and agrees to be bound by the limitations contained herein (including the “Restrictions on Distributions” set out below). Any failure to comply with these limitations may constitute a violation of law. This publication is being supplied to you strictly on the basis that it will remain confidential. No part of this report may be (i) copied, photocopied, duplicated, stored or reproduced in any form by any means; or (ii) redistributed or passed on, directly or indirectly, to any other person in whole or in part, for any purpose without the prior written consent of CGS-CIMB.
The information contained in this research report is prepared from data believed to be correct and reliable at the time of issue of this report. CGS-CIMB may or may not issue regular reports on the subject matter of this report at any frequency and may cease to do so or change the periodicity of reports at any time. CGS-CIMB has no obligation to update this report in the event of a material change to the information contained in this report. CGS-CIMB does not accept any obligation to (i) check or ensure that the contents of this report remain current, reliable or relevant, (ii) ensure that the content of this report constitutes all the information a prospective investor may require, (iii) ensure the adequacy, accuracy, completeness, reliability or fairness of any views, opinions and information, and accordingly, CGS-CIMB, its affiliates and related persons including China Galaxy International Financial Holdings Limited (“CGIFHL”) and CIMB Group Sdn. Bhd. (“CIMBG”) and their respective related corporations (and their respective directors, associates, connected persons and/or employees) shall not be liable in any manner whatsoever for any consequences (including but not limited to any direct, indirect or consequential losses, loss of profits and damages) of any reliance thereon or usage thereof. In particular, CGS-CIMB disclaims all responsibility and liability for the views and opinions set out in this report.
Unless otherwise specified, this report is based upon sources which CGS-CIMB considers to be reasonable. Such sources will, unless otherwise specified, for market data, be market data and prices available from the main stock exchange or market where the relevant security is listed, or, where appropriate, any other market. Information on the accounts and business of company(ies) will generally be based on published statements of the company(ies), information disseminated by regulatory information services, other publicly available information and information resulting from our research.
Whilst every effort is made to ensure that statements of facts made in this report are accurate, all estimates, projections, forecasts, expressions of opinion and other subjective judgments contained in this report are based on assumptions considered to be reasonable as of the date of the document in which they are contained and must not be construed as a representation that the matters referred to therein will occur. Past performance is not a reliable indicator of future performance. The value of investments may go down as well as up and those investing may, depending on the investments in question, lose more than the initial investment. No report shall constitute an offer or an invitation by or on behalf of CGS-CIMB or any of its affiliates
(including CGIFHL, CIMBG and their respective related corporations) to any person to buy or sell any investments.
CGS-CIMB, its affiliates and related corporations (including CGIFHL, CIMBG and their respective related corporations) and/or their respective directors, associates, connected parties and/or employees may own or have positions in securities of the company(ies) covered in this research report or any securities related thereto and may from time to time add to or dispose of, or may be materially interested in, any such securities. Further, CGS-CIMB, its affiliates and their respective related corporations (including CGIFHL, CIMBG and their respective related corporations) do and seek to do business with the company(ies) covered in this research report and may from time to time act as market maker or have assumed an underwriting commitment in securities of such company(ies), may sell them to or buy them from customers on a principal basis and may also perform or seek to perform significant investment banking, advisory, underwriting or placement services for or relating to such company(ies) as well as solicit such investment, advisory or other services from any entity mentioned in this report.
CGS-CIMB or its affiliates (including CGIFHL, CIMBG and their respective related corporations) may enter into an agreement with the company(ies) covered in this report relating to the production of research reports. CGS-CIMB may disclose the contents of this report to the company(ies) covered by it and may have amended the contents of this report following such disclosure.
The analyst responsible for the production of this report hereby certifies that the views expressed herein accurately and exclusively reflect his or her personal views and opinions about any and all of the issuers or securities analysed in this report and were prepared independently and autonomously. No part of the compensation of the analyst(s) was, is, or will be directly or indirectly related to the inclusion of specific recommendations(s) or view(s) in this report. The analyst(s) who prepared this research report is prohibited from receiving any compensation, incentive or bonus based on specific investment banking transactions or for providing a specific recommendation for, or view of, a particular company. Information barriers and other arrangements may be established where necessary to prevent conflicts of interests arising. However, the analyst(s) may receive compensation that is based on his/their coverage of company(ies) in the performance of his/their duties or the performance of his/their recommendations and the research personnel involved in the preparation of this report may also participate in the solicitation of the businesses as described above. In reviewing this research report, an investor should be aware that any or all of the foregoing, among other things, may give rise to real or potential conflicts of interest. Additional information is, subject to the duties of confidentiality, available on request.
Reports relating to a specific geographical area are produced by the corresponding CGS-CIMB entity as listed in the table below. The term “CGS-CIMB” shall denote, where appropriate, the relevant entity distributing or disseminating the report in the particular jurisdiction referenced below, or, in every other case except as otherwise stated herein, CGS-CIMB Securities International Pte. Ltd. and its affiliates, subsidiaries and related corporations.

Food & Beverages │ Singapore
Delfi Ltd │ September 10, 2021
21
Country CGS-CIMB Entity Regulated by
Hong Kong CGS-CIMB Securities (Hong Kong) Limited Securities and Futures Commission Hong Kong
India CGS-CIMB Securities (India) Private Limited Securities and Exchange Board of India (SEBI)
Indonesia PT CGS-CIMB Sekuritas Indonesia Financial Services Authority of Indonesia
Malaysia CGS-CIMB Securities Sdn. Bhd. Securities Commission Malaysia
Singapore CGS-CIMB Securities (Singapore) Pte. Ltd. Monetary Authority of Singapore
South Korea CGS-CIMB Securities (Hong Kong) Limited, Korea Branch Financial Services Commission and Financial Supervisory Service
Thailand CGS-CIMB Securities (Thailand) Co. Ltd. Securities and Exchange Commission Thailand
Other Significant Financial Interests:
(i) As of August 31, 2021 CGS-CIMB has a proprietary position in the securities (which may include but not be limited to shares, warrants, call warrants and/or any other derivatives) in the following company or companies covered or recommended in this report:
(a) Delfi Ltd
(ii) Analyst Disclosure: As of September 10, 2021, the analyst(s) who prepared this report, and the associate(s), has / have an interest in the securities (which may include but not be limited to shares, warrants, call warrants and/or any other derivatives) in the following company or companies covered or recommended in this report:
(a) -
This report does not purport to contain all the information that a prospective investor may require. Neither CGS-CIMB nor any of its affiliates (including CGIFHL, CIMBG and their related corporations) make any guarantee, representation or warranty, express or implied, as to the adequacy, accuracy, completeness, reliability or fairness of any such information and opinion contained in this report. Neither CGS-CIMB nor any of its affiliates nor their related persons (including CGIFHL, CIMBG and their related corporations) shall be liable in any manner whatsoever for any consequences (including but not limited to any direct, indirect or consequential losses, loss of profits and damages) of any reliance thereon or usage thereof.
This report is general in nature and has been prepared for information purposes only. It is intended for circulation amongst CGS-CIMB’s clients generally and does not have regard to the specific investment objectives, financial situation and the particular needs of any specific person who may receive this report. The information and opinions in this report are not and should not be construed or considered as an offer, recommendation or solicitation to buy or sell the subject securities, related investments or other financial instruments or any derivative instrument, or any rights pertaining thereto.
Investors are advised to make their own independent evaluation of the information contained in this research report, consider their own individual investment objectives, financial situation and particular needs and consult their own professional and financial advisers as to the legal, business, financial, tax and other aspects before participating in any transaction in respect of the securities of company(ies) covered in this research report.
The securities of such company(ies) may not be eligible for sale in all jurisdictions or to all categories of investors.
Restrictions on Distributions
Australia: Despite anything in this report to the contrary, this research is provided in Australia by CGS-CIMB Securities (Singapore) Pte. Ltd. and CGS-CIMB Securities (Hong Kong) Limited. This research is only available in Australia to persons who are “wholesale clients” (within the meaning of the Corporations Act 2001 (Cth) and is supplied solely for the use of such wholesale clients and shall not be distributed or passed on to any other person. You represent and warrant that if you are in Australia, you are a “wholesale client”. This research is of a general nature only and has been prepared without taking into account the objectives, financial situation or needs of the individual recipient. CGS-CIMB Securities (Singapore) Pte. Ltd. and CGS-CIMB Securities (Hong Kong) Limited do not hold, and are not required to hold an Australian financial services license. CGS-CIMB Securities (Singapore) Pte. Ltd. and CGS-CIMB Securities (Hong Kong) Limited rely on “passporting” exemptions for entities appropriately licensed by the Monetary Authority of Singapore (under ASIC Class Order 03/1102) and the Securities and Futures Commission in Hong Kong (under ASIC Class Order 03/1103).
Canada: This research report has not been prepared in accordance with the disclosure requirements of Dealer Member Rule 3400 – Research Restrictions and Disclosure Requirements of the Investment Industry Regulatory Organization of Canada. For any research report distributed by CIBC, further disclosures related to CIBC conflicts of interest can be found at https://researchcentral.cibcwm.com .
China: For the purpose of this report, the People’s Republic of China (“PRC”) does not include the Hong Kong Special Administrative Region, the Macau Special Administrative Region or Taiwan. The distributor of this report has not been approved or licensed by the China Securities Regulatory Commission or any other relevant regulatory authority or governmental agency in the PRC. This report contains only marketing information. The distribution of this report is not an offer to buy or sell to any person within or outside PRC or a solicitation to any person within or outside of PRC to buy or sell any instruments described herein. This report is being issued outside the PRC to a limited number of institutional investors and may not be provided to any person other than the original recipient and may not be reproduced or used for any other purpose.
France: Only qualified investors within the meaning of French law shall have access to this report. This report shall not be considered as an offer to subscribe to, or used in connection with, any offer for subscription or sale or marketing or direct or indirect distribution of financial instruments and it is not intended as a solicitation for the purchase of any financial instrument.
Germany: This report is only directed at persons who are professional investors as defined in sec 31a(2) of the German Securities Trading Act (WpHG). This publication constitutes research of a non-binding nature on the market situation and the investment instruments cited here at the time of the publication of the information.
The current prices/yields in this issue are based upon closing prices from Bloomberg as of the day preceding publication. Please note that neither the German Federal Financial Supervisory Agency (BaFin), nor any other supervisory authority exercises any control over the content of this report.
Hong Kong: This report is issued and distributed in Hong Kong by CGS-CIMB Securities (Hong Kong) Limited (“CHK”) which is licensed in Hong Kong by the Securities and Futures Commission for Type 1 (dealing in securities) and Type 4 (advising on securities) activities. Any investors wishing to purchase or otherwise deal in the securities covered in this report should contact the Head of Sales at CGS-CIMB Securities (Hong Kong) Limited. The views and opinions in this research report are our own as of the date hereof and are subject to change. If the Financial Services and Markets Act of the United Kingdom or the rules of the Financial Conduct Authority apply to a recipient, our obligations owed to such recipient therein are unaffected.
Food & Beverages │ Singapore
Delfi Ltd │ September 10, 2021
22
CHK has no obligation to update its opinion or the information in this research report.
This publication is strictly confidential and is for private circulation only to clients of CHK.
CHK does not make a market on other securities mentioned in the report.
India: This report is issued and distributed in India by CGS-CIMB Securities (India) Private Limited (“CGS-CIMB India”). CGS-CIMB India is a subsidiary of CGS-CIMB Securities International Pte. Ltd. which is in turn is a 50:50 joint venture company of CGIFHL and CIMBG. The details of the members of the group of companies of CGS-CIMB can be found at www.cgs-cimb.com, CGIFHL at www.chinastock.com.hk/en/ACG/ContactUs/index.aspx and CIMBG at www.cimb.com/en/who-we-are.html. CGS-CIMB India is registered with the National Stock Exchange of India Limited and BSE Limited as a trading and clearing member (Merchant Banking Number: INM000012037) under the Securities and Exchange Board of India (Stock Brokers and Sub-Brokers) Regulations, 1992. In accordance with the provisions of Regulation 4(g) of the Securities and Exchange Board of India (Investment Advisers) Regulations, 2013, CGS-CIMB India is not required to seek registration with the Securities and Exchange Board of India (“SEBI”) as an Investment Adviser. CGS-CIMB India is registered with SEBI (SEBI Registration Number: INZ000209135) as a Research Analyst (INH000000669) pursuant to the SEBI (Research Analysts) Regulations, 2014 ("Regulations").
This report does not take into account the particular investment objectives, financial situations, or needs of the recipients. It is not intended for and does not deal with prohibitions on investment due to law/jurisdiction issues etc. which may exist for certain persons/entities. Recipients should rely on their own investigations and take their own professional advice before investment.
The report is not a “prospectus” as defined under Indian Law, including the Companies Act, 2013, and is not, and shall not be, approved by, or filed or registered with, any Indian regulator, including any Registrar of Companies in India, SEBI, any Indian stock exchange, or the Reserve Bank of India. No offer, or invitation to offer, or solicitation of subscription with respect to any such securities listed or proposed to be listed in India is being made, or intended to be made, to the public, or to any member or section of the public in India, through or pursuant to this report.
The research analysts, strategists or economists principally responsible for the preparation of this research report are segregated from the other activities of CGS-CIMB India and they have received compensation based upon various factors, including quality, accuracy and value of research, firm profitability or revenues, client feedback and competitive factors. Research analysts', strategists' or economists' compensation is not linked to investment banking or capital markets transactions performed or proposed to be performed by CGS-CIMB India or its affiliates.
CGS-CIMB India does not have actual / beneficial ownership of 1% or more securities of the subject company in this research report, at the end of the month immediately preceding the date of publication of this research report. However, since affiliates of CGS-CIMB India are engaged in the financial services business, they might have in their normal course of business financial interests or actual / beneficial ownership of one per cent or more in various companies including the subject company in this research report.
CGS-CIMB India or its associates, may: (a) from time to time, have long or short position in, and buy or sell the securities of the subject company in this research report; or (b) be engaged in any other transaction involving such securities and earn brokerage or other compensation or act as a market maker in the financial instruments of the subject company in this research report or act as an advisor or lender/borrower to such company or may have any other potential conflict of interests with respect to any recommendation and other related information and opinions.
CGS-CIMB India, its associates and the analyst engaged in preparation of this research report have not received any compensation for investment banking, merchant banking or brokerage services from the subject company mentioned in the research report in the past 12 months.
CGS-CIMB India, its associates and the analyst engaged in preparation of this research report have not managed or co-managed public offering of securities for the subject company mentioned in the research report in the past 12 months. The analyst from CGS-CIMB India engaged in preparation of this research report or his/her relative (a) do not have any financial interests in the subject company mentioned in this research report; (b) do not own 1% or more of the equity securities of the subject company mentioned in the research report as of the last day of the month preceding the publication of the research report; (c) do not have any material conflict of interest at the time of publication of the research report.
Indonesia: This report is issued and distributed by PT CGS-CIMB Sekuritas Indonesia (“CGS-CIMB Indonesia”). The views and opinions in this research report are our own as of the date hereof and are subject to change. CGS-CIMB Indonesia has no obligation to update its opinion or the information in this research report. This report is for private circulation only to clients of CGS-CIMB Indonesia. Neither this report nor any copy hereof may be distributed in Indonesia or to any Indonesian citizens wherever they are domiciled or to Indonesian residents except in compliance with applicable Indonesian capital market laws and regulations.
This research report is not an offer of securities in Indonesia. The securities referred to in this research report have not been registered with the Financial Services Authority (Otoritas Jasa Keuangan) pursuant to relevant capital market laws and regulations, and may not be offered or sold within the territory of the Republic of Indonesia or to Indonesian citizens through a public offering or in circumstances which constitute an offer within the meaning of the Indonesian capital market law and regulations.
Ireland: CGS-CIMB is not an investment firm authorised in the Republic of Ireland and no part of this document should be construed as CGS-CIMB acting as, or otherwise claiming or representing to be, an investment firm authorised in the Republic of Ireland.
Malaysia: This report is distributed in Malaysia by CGS-CIMB Securities Sdn. Bhd. (“CGS-CIMB Malaysia”) solely for the benefit of and for the exclusive use of our clients. Recipients of this report are to contact CGS-CIMB Malaysia, at Level 29, Menara Bumiputra-Commerce, No. 11, Jalan Raja Laut, 50350 Kuala Lumpur, Malaysia, in respect of any matters arising from or in connection with this report. CGS-CIMB Malaysia has no obligation to update, revise or reaffirm its opinion or the information in this research reports after the date of this report.
New Zealand: In New Zealand, this report is for distribution only to persons who are wholesale clients pursuant to section 5C of the Financial Advisers Act 2008.
Singapore: This report is issued and distributed by CGS-CIMB Securities (Singapore) Pte Ltd (“CGS-CIMB Singapore”). CGS-CIMB Singapore is a capital markets services licensee under the Securities and Futures Act (Chapter 289). Accordingly, it is exempted from the requirement to hold a financial adviser’s licence under the Financial Advisers Act, Cap 110 (“FAA”) for advising on investment products, by issuing or promulgating research analyses or research reports, whether in electronic, print or other form. CGS-CIMB Singapore is subject to the applicable rules under the FAA unless it is able to avail itself to any prescribed exemptions.
Recipients of this report are to contact CGS-CIMB Singapore, 50 Raffles Place, #16-02 Singapore Land Tower, Singapore in respect of any matters arising from, or in connection with this report. CGS-CIMB Singapore has no obligation to update its opinion or the information in this research report.
Food & Beverages │ Singapore
Delfi Ltd │ September 10, 2021
23
This publication is strictly confidential and is for private circulation only. If you have not been sent this report by CGS-CIMB Singapore directly, you may not rely, use or disclose to anyone else this report or its contents.
If the recipient of this research report is not an accredited investor, expert investor or institutional investor, CGS-CIMB Singapore accepts legal responsibility for the contents of the report without any disclaimer limiting or otherwise curtailing such legal responsibility. If the recipient is an accredited investor, expert investor or institutional investor, the recipient is deemed to acknowledge that CGS-CIMB Singapore is exempt from certain requirements under the FAA and its attendant regulations, and as such, is exempt from complying with the following:
(a) Section 25 of the FAA (obligation to disclose product information);
(b) Section 27 (duty not to make recommendation with respect to any investment product without having a reasonable basis where you may be reasonably expected to rely on the recommendation) of the FAA;
(c) MAS Notice on Information to Clients and Product Information Disclosure [Notice No. FAA-N03];
(d) MAS Notice on Recommendation on Investment Products [Notice No. FAA-N16];
(e) Section 36 (obligation on disclosure of interest in specified products), and
(f) any other laws, regulations, notices, directive, guidelines, circulars and practice notes which are relates to the above, to the extent permitted by applicable laws, as may be amended from time to time, and any other laws, regulations, notices, directive, guidelines, circulars, and practice notes as we may notify you from time to time. In addition, the recipient who is an accredited investor, expert investor or institutional investor acknowledges that as CGS-CIMB Singapore is exempt from Section 27 of the FAA, the recipient will also not be able to file a civil claim against CGS-CIMB Singapore for any loss or damage arising from the recipient’s reliance on any recommendation made by CGS-CIMB Singapore which would otherwise be a right that is available to the recipient under Section 27 of the FAA. .
CGS-CIMB Singapore, its affiliates and related corporations, their directors, associates, connected parties and/or employees may own or have positions in specified products of the company(ies) covered in this research report or any specified products related thereto and may from time to time add to or dispose of, or may be materially interested in, any such specified products. Further, CGS-CIMB Singapore, its affiliates and its related corporations do and seek to do business with the company(ies) covered in this research report and may from time to time act as market maker or have assumed an underwriting commitment in specified products of such company(ies), may sell them to or buy them from customers on a principal basis and may also perform or seek to perform significant investment banking, advisory, underwriting or placement services for or relating to such company(ies) as well as solicit such investment, advisory or other services from any entity mentioned in this report.
As of September 10, 2021, CGS-CIMB Singapore does not have a proprietary position in the recommended specified products in this report.
CGS-CIMB Singapore does not make a market on the securities mentioned in the report.
South Korea: This report is issued and distributed in South Korea by CGS-CIMB Securities (Hong Kong) Limited, Korea Branch (“CGS-CIMB Korea”) which is licensed as a cash equity broker, and regulated by the Financial Services Commission and Financial Supervisory Service of Korea. In South Korea, this report is for distribution only to professional investors under Article 9(5) of the Financial Investment Services and Capital Market Act of Korea (“FSCMA”).
Spain: This document is a research report and it is addressed to institutional investors only. The research report is of a general nature and not personalised and does not constitute investment advice so, as the case may be, the recipient must seek proper advice before adopting any investment decision. This document does not constitute a public offering of securities.
CGS-CIMB is not registered with the Spanish Comision Nacional del Mercado de Valores to provide investment services.
Sweden: This report contains only marketing information and has not been approved by the Swedish Financial Supervisory Authority. The distribution of this report is not an offer to sell to any person in Sweden or a solicitation to any person in Sweden to buy any instruments described herein and may not be forwarded to the public in Sweden.
Switzerland: This report has not been prepared in accordance with the recognized self-regulatory minimal standards for research reports of banks issued by the Swiss Bankers’ Association (Directives on the Independence of Financial Research). Thailand: This report is issued and distributed by CGS-CIMB Securities (Thailand) Co. Ltd. (“CGS-CIMB Thailand”) based upon sources believed to be reliable (but their accuracy, completeness or correctness is not guaranteed). The statements or expressions of opinion herein were arrived at after due and careful consideration for use as information for investment. Such opinions are subject to change without notice and CGS-CIMB Thailand has no obligation to update its opinion or the information in this research report.
CGS-CIMB Thailand may act or acts as Market Maker, and issuer and offeror of Derivative Warrants and Structured Note which may have the following securities as its underlying securities. Investors should carefully read and study the details of the derivative warrants in the prospectus before making investment decisions.
AAV, ACE, ADVANC, AEONTS, AMATA, AOT, AP, BAM, BANPU, BBL, BCH, BCP, BCPG, BDMS, BEC, BEM, BGRIM, BH, BJC, BTS, CBG, CENTEL, CHG, CK, CKP, COM7, CPALL, CPF, CPN, CRC, DELTA, DOHOME, DTAC, EA, EGCO, ESSO, GLOBAL, GPSC, GULF, GUNKUL, HANA, HMPRO, ICHI, INTUCH, IRPC, IVL, JAS, JMART, JMT, KBANK, KCE, KKP, KTB, KTC, LH, MAJOR, MEGA, MINT, MTC, NRF, OR, ORI, OSP, PLANB, PRM, PSL, PTG, PTL, PTT, PTTEP, PTTGC, QH, RATCH, RBF, RS, SAWAD, SCB, SCC, SCGP, SINGER, SPALI, SPRC, STA, STEC, STGT, SUPER, SYNEX, TASCO, TCAP, THANI, TISCO, TKN, TOP, TQM, TRUE, TTB, TU, TVO, VGI, WHA Corporate Governance Report:
The disclosure of the survey result of the Thai Institute of Directors Association (“IOD”) regarding corporate governance is made pursuant to the policy of the Office of the Securities and Exchange Commission. The survey of the IOD is based on the information of a company listed on the Stock Exchange of Thailand and the Market for Alternative Investment disclosed to the public and able to be accessed by a general public investor. The result, therefore, is from the perspective of a third party. It is not an evaluation of operation and is not based on inside information.
The survey result is as of the date appearing in the Corporate Governance Report of Thai Listed Companies. As a result, the survey result may be changed after that date. CGS-CIMB Thailand does not confirm nor certify the accuracy of such survey result.
Score Range: 90 - 100 80 – 89 70 - 79 Below 70 No Survey Result
Description: Excellent Very Good Good N/A N/A
United Arab Emirates: The distributor of this report has not been approved or licensed by the UAE Central Bank or any other relevant licensing authorities or governmental agencies in the United Arab Emirates. This report is strictly private and confidential and has not been reviewed by,

Food & Beverages │ Singapore
Delfi Ltd │ September 10, 2021
24
deposited or registered with UAE Central Bank or any other licensing authority or governmental agencies in the United Arab Emirates. This report is being issued outside the United Arab Emirates to a limited number of institutional investors and must not be provided to any person other than the original recipient and may not be reproduced or used for any other purpose. Further, the information contained in this report is not intended to lead to the sale of investments under any subscription agreement or the conclusion of any other contract of whatsoever nature within the territory of the United Arab Emirates.
United Kingdom and European Economic Area (EEA): In the United Kingdom and European Economic Area, this material is also being distributed by CGS-CIMB Securities (UK) Limited (“CGS-CIMB UK”). CGS-CIMB UK is authorized and regulated by the Financial Conduct Authority and its registered office is at 53 New Broad Street, London EC2M 1JJ. The material distributed by CGS-CIMB UK has been prepared in accordance with CGS-CIMB’s policies for managing conflicts of interest arising as a result of publication and distribution of this material. This material is for distribution only to, and is solely directed at, selected persons on the basis that those persons: (a) are eligible counterparties and professional clients of CGS-CIMB UK; (b) have professional experience in matters relating to investments falling within Article 19(5) of the Financial Services and Markets Act 2000 (Financial Promotion) Order 2005 (as amended, the “Order”), (c) fall within Article 49(2)(a) to (d) (“high net worth companies, unincorporated associations etc”) of the Order; (d) are outside the United Kingdom subject to relevant regulation in each jurisdiction, material(all such persons together being referred to as “relevant persons”). This material is directed only at relevant persons and must not be acted on or relied on by persons who are not relevant persons. Any investment or investment activity to which this material relates is available only to relevant persons and will be engaged in only with relevant persons.
This material is categorised as non-independent for the purposes of CGS-CIMB UK and therefore does not provide an impartial or objective assessment of the subject matter and does not constitute independent research. Consequently, this material has not been prepared in accordance with legal requirements designed to promote the independence of research and will not be subject to any prohibition on dealing ahead of the dissemination of research. Therefore, this material is considered a marketing communication.
United States: This research report is distributed in the United States of America by CGS-CIMB Securities (USA) Inc, a U.S. registered broker-dealer and an affiliate of CGS-CIMB Securities Sdn. Bhd., CGS-CIMB Securities (Singapore) Pte Ltd, PT CGS-CIMB Sekuritas Indonesia, CGS-CIMB Securities (Thailand) Co. Ltd, CGS-CIMB Securities (Hong Kong) Limited and CGS-CIMB Securities (India) Private Limited, and is distributed solely to persons who qualify as “U.S. Institutional Investors” as defined in Rule 15a-6 under the Securities and Exchange Act of 1934. This communication is only for Institutional Investors whose ordinary business activities involve investing in shares, bonds, and associated securities and/or derivative securities and who have professional experience in such investments. Any person who is not a U.S. Institutional Investor or Major Institutional Investor must not rely on this communication. The delivery of this research report to any person in the United States of America is not a recommendation to effect any transactions in the securities discussed herein, or an endorsement of any opinion expressed herein. CGS-CIMB Securities (USA) Inc, is a FINRA/SIPC member and takes responsibility for the content of this report. For further information or to place an order in any of the above-mentioned securities please contact a registered representative of CGS-CIMB Securities (USA) Inc.
CGS-CIMB Securities (USA) Inc. does not make a market on other securities mentioned in the report.
CGS-CIMB Securities (USA) Inc. has not managed or co-managed a public offering of any of the securities mentioned in the past 12 months.
CGS-CIMB Securities (USA) Inc. has not received compensation for investment banking services from any of the company mentioned in the past 12 months.
CGS-CIMB Securities (USA) Inc. neither expects to receive nor intends to seek compensation for investment banking services from any of the company mentioned within the next 3 months.
United States Third-Party Disclaimer: If this report is distributed in the United States of America by Raymond James & Associates, Inc (“RJA”), this report is third-party research prepared for and distributed in the United States of America by RJA pursuant to an arrangement between RJA and CGS-CIMB Securities International Pte. Ltd. (“CGS-CIMB”). CGS-CIMB is not an affiliate of RJA. This report is distributed solely to persons who qualify as “U.S. Institutional Investors” or as “Major U.S. Institutional Investors” as defined in Rule 15a-6 under the Securities and Exchange Act of 1934, as amended. This communication is only for U.S. Institutional Investors or Major U.S. Institutional Investor whose ordinary business activities involve investing in shares, bonds, and associated securities and/or derivative securities and who have professional experience in such investments. Any person who is not a U.S. Institutional Investor or Major U.S. Institutional Investor must not rely on this communication. The delivery of this report to any person in the U.S. is not a recommendation to effect any transactions in the securities discussed herein, or an endorsement of any opinion expressed herein. If you are receiving this report in the U.S from RJA, a FINRA/SIPC member, it takes responsibility for the content of this report. For further information or to place an order in any of the above-mentioned securities please contact a registered representative of CGS-CIMB Securities (USA) Inc. or RJA. https://raymondjames.com/InternationalEquityDisclosures
Other jurisdictions: In any other jurisdictions, except if otherwise restricted by laws or regulations, this report is only for distribution to professional, institutional or sophisticated investors as defined in the laws and regulations of such jurisdictions.
Rating Distribution (%) Investment Banking clients (%)
Add 72.1% 1.1%
Hold 19.3% 0.0%
Reduce 8.7% 0.0%
Distribution of stock ratings and investment banking clients for quarter ended on 30 June 2021
623 companies under coverage for quarter ended on 30 June 2021

Food & Beverages │ Singapore
Delfi Ltd │ September 10, 2021
25
Spitzer Chart for stock being researched ( 2 year data )
Delfi Ltd (DELFI SP)
Corporate Governance Report of Thai Listed Companies (CGR). CG Rating by the Thai Institute of Directors Association (Thai IOD) in 2020, Anti-Corruption 2020
ADVANC – Excellent, Certified, AMATA – Excellent, Certified, ANAN – Excellent, n/a, AOT – Excellent, n/a, AP – Excellent, Certified, ASP – Excellent, n/a, AU – Good, n/a, BAM – Very Good, Certified, BAY – Excellent, Certified, BBL – Very Good, Certified, BCH – Good, Certified, BCP - Excellent, Certified, BCPG – Excellent, Certified, BDMS – Excellent, n/a, BEAUTY – Good, n/a, BH - Good, n/a, BJC – Very Good, n/a, BLA – Excellent, Certified, BTS - Excellent, Certified, CBG – Very Good, n/a, CCET – n/a, n/a, CENTEL – Excellent, Certified, CHAYO – Very Good, n/a, CHG – Very Good, n/a, CK – Excellent, n/a, COM7 – Very Good, Certified, CPALL – Excellent, Certified, CPF – Excellent, Certified, CPN - Excellent, Certified,
CPNREIT – n/a, n/a, CRC – Very Good, n/a, DELTA - Excellent, Certified, DDD – Very Good, n/a, DIF – n/a, n/a, DOHOME – Very Good, n/a, DREIT
– n/a, n/a, DTAC – Excellent, Certified, ECL – Excellent, Certified, EGCO - Excellent, Certified, EPG – Excellent, Certified, ERW – Very Good, Certified, GFPT - Excellent, Certified, GGC – Excellent, Certified, GLOBAL – Very Good, n/a, HANA - Excellent, Certified, HMPRO - Excellent, Certified, HUMAN – Good, n/a, ICHI – Excellent, Certified, III – Excellent, n/a, INTUCH - Excellent, Certified, IRPC – Excellent, Certified, ITD – Very Good, n/a, IVL - Excellent, Certified, JASIF – n/a, n/a, JKN – Excellent, Declared, JMT – Very Good, Declared, KBANK - Excellent, Certified, KCE - Excellent, Certified, KEX – n/a, n/a, KKP – Excellent, Certified, KSL – Excellent, Certified, KTB - Excellent, Certified, KTC – Excellent, Certified, LH - Excellent, n/a, LPN – Excellent, Certified, M – Very Good, Certified, MAKRO – Excellent, Certified, MC – Excellent, Certified, MEGA – Very Good, n/a, MINT - Excellent, Certified, MTC – Excellent, Certified, NETBAY – Very Good, n/a, NRF – n/a, n/a, OR – n/a, n/a, ORI – Excellent, Certified, OSP – Very Good, n/a, PLANB – Excellent, Certified, PRINC – Very Good, Certified, PR9 – Excellent, n/a, PSH – Excellent, Certified, PTT - Excellent, Certified, PTTEP - Excellent, Certified, PTTGC - Excellent, Certified, QH – Excellent, Certified, RBF – Good, n/a, RS – Excellent, n/a, RSP – Good, n/a, S – Excellent, n/a, SAK – n/a, n/a, SAPPE – Very Good, Certified, SAWAD – Very Good, n/a, SCB - Excellent, Certified, SCC – Excellent, Certified, SCGP – n/a, n/a, SHR – Very Good, n/a, SIRI – Excellent, Certified, SPA – Very Good, n/a, SPALI - Excellent, Declared, SPRC – Excellent, Certified, SSP - Good, Declared, STEC – n/a, n/a, SVI – Excellent, Certified, SYNEX – Very Good, n/a, TCAP – Excellent, Certified, THANI – Excellent, Certified, TIDLOR – n/a, n/a TISCO - Excellent, Certified, TKN – Very Good, n/a, TMB - Excellent, Certified, TOP - Excellent, Certified, TRUE – Excellent, Certified, TU – Excellent, Certified, TVO – Excellent, Certified, VGI – Excellent, Certified, WHA – Excellent, Certified, WHART – n/a, n/a, WICE – Excellent, Certified, WORK – Good, n/a. - CG Score 2020 from Thai Institute of Directors Association (IOD) - Companies participating in Thailand's Private Sector Collective Action Coalition Against Corruption programme (Thai CAC) under Thai Institute of Directors (as of January 30, 2021) are categorised into: companies that have declared their intention to join CAC, and companies certified by CAC.
Recommendation Framework
Stock Ratings Definition:
Add The stock’s total return is expected to exceed 10% over the next 12 months.
Hold The stock’s total return is expected to be between 0% and positive 10% over the next 12 months.
Reduce The stock’s total return is expected to fall below 0% or more over the next 12 months.
The total expected return of a stock is defined as the sum of the: (i) percentage difference between the target price and the current price and (ii) the forward net dividend yields of the stock. Stock price targets have an investment horizon of 12 months.
Sector Ratings Definition:
Overweight An Overweight rating means stocks in the sector have, on a market cap-weighted basis, a positive absolute recommendation.
Neutral A Neutral rating means stocks in the sector have, on a market cap-weighted basis, a neutral absolute recommendation.
Underweight An Underweight rating means stocks in the sector have, on a market cap-weighted basis, a negative absolute recommendation.
Country Ratings Definition:
Overweight An Overweight rating means investors should be positioned with an above-market weight in this country relative to benchmark.
Neutral A Neutral rating means investors should be positioned with a neutral weight in this country relative to benchmark.
Underweight An Underweight rating means investors should be positioned with a below-market weight in this country relative to benchmark.
#01c
Insert Insert
0.40
0.60
0.80
1.00
1.20
1.40
1.60
Sep-18 Mar-19 Sep-19 Mar-20 Sep-20 Mar-21
Price Close
2.3
0
2.3
0
Recommendations & Target Price
Add Hold Reduce Not Rated