adapting the road safety audit review for local rural ... · adapting the road safety audit review...
TRANSCRIPT

1
ADAPTING THE ROAD SAFETY AUDIT REVIEW FOR LOCAL RURAL ROADS
Eugene M. Wilson
Department of Civil Engineering University of Wyoming
Laramie, Wyoming Technology Transfer Center
July 2000

2
Acknowledgements
The U.S. Department of Transportation’s University Transportation Centers Program, the Wyoming Department of Transportation and the University of Wyoming sponsored this project. The Wyoming Association of County Engineers and Supervisors and Arve Kirkevold provided input and data preparation for this study. The author recognizes and appreciates their help and support.
Disclaimer
The contents of this report reflect the views of the author, who is responsible for the facts and the accuracy of the information presented herein. This document is disseminated under the sponsorship of the Department of Transportation, University Transportation Centers Program, in the interest of information exchange. The U.S. Government assumes no liability for the contents or use thereof.

3
ABSTRACT
It is important to improve safety on local rural roads, but many local transportation
agencies do not implement a road safety improvement program. This often is due to limitations
on funding, expertise, and time. The Road Safety Audit Review (RSAR) process is a viable
option for aiding local transportation agencies in addressing safety issues.
This project developed a simple and cost effective local rural RSAR program. The
RSAR program was developed to identify critical safety issues and to assess the level of auditor
expertise needed. The specific issues of needed safety improvements and the urgency of
implementing these improvements have been defined in the audit process. These issues were
correlated to a proposed local rural functional classification system, also developed as a
component of this research. Pilot audit review groups were composed of experts, county
engineers, and local road supervisors. The different auditor groups generally agreed on the level
of urgency in correcting the needed improvements. While the control group identified more
safety needs on the lower classified roads than the other groups, it should be noted that the
differences generally were those on which the control group recommended no action be taken.
The importance of this process in meeting the needs of local government is that road supervisors
and county engineers from other counties also were effective in identifying safety needs.
Implementing improvements for identified action items with the highest urgency is an
approach that will be an effective tool for local rural governmental agencies.

4

5
TABLE OF CONTENTS
EXECUTIVE SUMMARY ....................................................................................................... 9
CHAPTER 1 - Introduction .................................................................................................... 291.1 Background ...................................................................................................................... 29 1.2 Goals and Objectives for Research .................................................................................. 31 1.3 Report Organization......................................................................................................... 31
CHAPTER 2 - Literature Review............................................................................................ 33 2.1 Introduction...................................................................................................................... 33
2.1.1 Functional Classification Systems ........................................................................... 33 2.2 Safety Programs ............................................................................................................... 34
2.2.1. Highway Safety Improvement Programs.................................................................. 35 2.2.2. Spot Improvement Approach versus System-Wide Improvement Approach........... 36 2.2.3. Safety Management Systems .................................................................................... 37 2.2.4. Risk Management Programs ..................................................................................... 37 2.2.5. Road Safety Audits ................................................................................................... 382.2.6. Road Safety Audit Review........................................................................................ 41
2.3 Summary of Literature Review........................................................................................ 42
CHAPTER 3 - Methodology ................................................................................................... 43 3.1 Overview........................................................................................................................... 43
3.1.1. Audit Groups............................................................................................................. 44 3.1.2. Site Identification...................................................................................................... 44
3.2 Comparative Analysis...................................................................................................... 463.2.1. Percentage ................................................................................................................. 46 3.2.2. Weighted Percentage ................................................................................................ 46 3.2.3. RSAR Completion Reports....................................................................................... 47 3.2.4. Analysis by Local Rural Road Functional Classification ......................................... 48
CHAPTER 4 – Analysis and Results....................................................................................... 51 4.1 RSAR Program ................................................................................................................. 51
4.1.1. Safety Issues to LOOK FOR..................................................................................... 51 4.1.2. Instructions................................................................................................................ 53 4.1.3. New Classification System ....................................................................................... 54 4.1.4. RSAR Program ......................................................................................................... 55
4.2 Comparative Analysis....................................................................................................... 56 4.2.1. Percent Comparisons ................................................................................................ 56 4.2.2. Weighted Percent ...................................................................................................... 634.2.3. RSAR Completion Reports....................................................................................... 68
4.3 Summary of Results.......................................................................................................... 68

6
CHAPTER 5 - Summary, Conclusions, and Recommendations ............................................. 71 5.1 Summary............................................................................................................................ 71 5.2 Conclusions........................................................................................................................ 73 5.3 Recommendations.............................................................................................................. 74
REFERENCES ........................................................................................................................ 77
APPENDIX A – Audit Review Program................................................................................. 79 Instructions for Local Rural Road Safety Audit Review Program .......................................... 80 Functional Local Rural Road Classification ............................................................................ 81 Safety Issues to LOOK FOR: .................................................................................................. 82 Road Safety Audit Review for Local Rural Roads.................................................................. 84
APPENDIX B – County 2 - Final Audit Results..................................................................... 87 Rural Major High Speed .......................................................................................................... 88 Rural Major Medium Speed..................................................................................................... 90Rural Minor.............................................................................................................................. 92 Rural Local............................................................................................................................... 94 Rural Low-Volume .................................................................................................................. 95
APPENDIX C – Trial Audit Results ....................................................................................... 97 Road Deficiency Severities 2 and 3 Summary– Trial Audit.................................................... 98 Rural Primary Roadway Classification.................................................................................... 99 Rural Secondary Roadway Classification.............................................................................. 101 Rural Local Roadway Classification ..................................................................................... 103 Rural Low-volume Local Roadway Classification................................................................ 104
APPENDIX D – Control Group Audit Reports..................................................................... 105 Final Audit – County 2 Control Group Report ...................................................................... 106 Trial Audit – County 1 Control Group Report....................................................................... 110
APPENDIX E – Engineer and Superintendent Audit Reports .............................................. 115 Engineer Audit Reports.......................................................................................................... 116
County I, Rural Primary..................................................................................................... 116County I, Rural Secondary................................................................................................. 116 County I, Rural Local ........................................................................................................ 117County I, Rural Low-volume Local................................................................................... 117 County II, Rural Major High-speed ................................................................................... 117 County II, Rural Major Medium-speed ............................................................................. 118 County II, Rural Minor ...................................................................................................... 118County II, Rural Local ....................................................................................................... 119Rural Low-volume Local................................................................................................... 119

7
Superintendents Audit Reports .............................................................................................. 120 Superintendent I ................................................................................................................. 120 Superintendent II................................................................................................................ 121 Superintendent III .............................................................................................................. 122

8
LIST OF TABLES
Table 1. Classification System for Local Rural Roads1.............................................................. 34 Table 2. Outline of HSIP Structure1 ........................................................................................... 35 Table 3. Selected Roads versus Class Requirement ................................................................... 44 Table 4. Selected Roads versus Class Requirement for Revised Audit Classification............... 45 Table 5. Safety Issues to LOOK FOR ........................................................................................ 52 Table 6. RSAR Procedure Instructions....................................................................................... 54Table 7. Functional Local Rural Road Classification................................................................. 55 Table 8. Total Road Deficiencies Identified– Trial Audit .......................................................... 58 Table 9. Total Road Deficiencies Identified– Final Audit.......................................................... 59 Table 10. Road Deficiency Urgency 4 Only–Final Audit ............................................................ 65 Table 11. Road Deficiency Urgencies 2 and 3 – Final Audit ....................................................... 66

9
EXECUTIVE SUMMARY
Improving safety on local rural roads is a tremendous challenge facing local
transportation agencies across the United States. Not only has transportation technology
undergone many changes, but as our transportation system ages, the uses of many existing
roadways have changed as well. Due to limited resources, including funding, expertise, and
time, many local transportation agencies have been unable to implement a road safety
improvement program.
The purpose of this research was to develop a practical approach to help local
transportation agencies address safety issues on local rural roads. While road safety programs
have long been a part of the management systems of most state highway agencies, it often is
difficult to use the same systems for local jurisdictions. Most local U.S. rural transportation
agencies have limited expertise. Most, in fact, have few if any employees with engineering
degrees. However, these agencies generally have employees who have developed into
knowledgeable professionals through on-the-job learning and training. Improving knowledge
and transferring technology to local governments has been the mission of the local technical
assistance (LTAP) programs since the mid-1980s. Safety training and identifying the need for
roadway improvements have been the focal points of most LTAP programs. Unfortunately,
practical applications continue to be needed to aid these agencies.
The goal of this research was to develop a safety process which meets this need, therefore
it is important that the process be “easy to learn and easy to use.” Tailoring the road safety audit
(RSA) has the potential to fulfill the local government agency safety needs.

10
According to Austroads,4 the Australian equivalent to The American Association of State
Highway and Transportation Officials (AASHTO), the RSA is “…a formalized examination of
an existing or future road or traffic project which interacts with road users, in which an
independent, qualified examiner reports on the project’s accident potential and safety
performance.”
Introduced in England in the 1980s, the road safety audit originally was designed to
identify traffic safety deficiencies on projects primarily still in the planning or construction
stages. Because fewer new roads are being built by rural local U.S. governments, the emphasis
has shifted to analyzing safety on existing roads. A road safety audit performed on an existing
road is more appropriately termed a road safety audit review (RSAR).16
This study examined the minimum level of expertise required to perform a road safety
audit review that effectively identifies the nature of safety deficiencies as well as the urgency for
repair of those deficiencies. The research also developed a functional local rural road
classification system to tailor the RSAR process.
Literature Review
Under the functional classification system, roads and streets are grouped according to the
type of service they provide. The arterial system (including the Interstate System) accounts for
about 11.1 percent of the nation’s total road and street mileage and carries 72.4 percent of total
travel.1 In contrast, the local road system accounts for 68.8 percent of the nation’s total road and
street mileage and carries 12.7 percent of total travel.9
The road classification system developed in this research project is contained in Table 1
and also is included in the attachment, Local Rural Government RSAR Process. This helped

11
guide the RSAR process and expertise evaluation issues. This was accomplished by conducting
RSARs on roadway sections meeting the subclassifications in Table 1. The identification of
needed safety improvements and the issue of urgency were correlated to these subclassifications.
Table 1. Functional Local Rural Road Classification
Rural Major High-Speed Rural Minor Rural Local
Serves larger towns and other traffic generators not served by higher systems, links these places with nearby cities and larger towns or with higher systems, and serves more important intracounty travel corridors.
Typically: ♦ Paved surfaces ♦ Traffic volumes
400 v.p.d. ♦ Operating speed
40-65 m.p.h. ♦ Infrequent accesses
Provides access to land adjacent to the collector network and serves travel over relatively short distances.
Typically: ♦ Unpaved surfaces ♦ Traffic volumes
100-250 v.p.d. ♦ Operating speed
30-45 m.p.h.
Rural Major Medium-Speed Rural Low-volume Local
Serves larger towns and other traffic generators not served by higher systems, links these places with nearby cities and larger towns or with higher systems, and serves more important intracounty travel corridors.
Typically: ♦ Paved surfaces ♦ Traffic volumes 400 v.p.d. ♦ Operating speed 30-
45m.p.h. ♦ Frequent accesses
Accumulates traffic from local roads, brings all developed areas within reasonable distances of collector roads, provides service to the remaining smaller communities, and links the locally important traffic generators in their rural region.
Typically: ♦ Unpaved surfaces ♦ Traffic volumes
250-400 v.p.d. ♦ Operating speed
40-60 m.p.h.
Provides access to land adjacent to the collector network and serves travel over relatively short distances.
Typically: ♦ Unpaved surfaces ♦ Traffic volumes
0-100 v.p.d. ♦ Operating speed variable

12
Recalling the definition of an RSAR, the objectives are:4,15
• to identify potential safety problems for all road users and others affected by a road project
and
• to ensure that measures to eliminate or reduce the problem are considered fully.
Some of the benefits of conducting a road safety audit and review (RSA/RSAR) are the
reduction in:4,14,15
• the likelihood of crashes on the road network,
• the severity of crashes,
• the need for costly remedial work, and
• the total cost of a project to the community, including accidents, disruption, and trauma.
Audit groups, consisting of a control group, two independent engineers, and a team of
superintendents, were used to assess the process developed and issues associated with levels of
expertise needed to conduct RSARs. The control group included a University of Wyoming
Traffic Engineering Professor, an FHWA Traffic Safety Engineer, and a Wyoming Department
of Transportation State Traffic Engineer. Combined, the group had more than 80 years of traffic
engineering safety and operational experience. The independent engineers have familiarity with
the RSA/RSAR process and are county engineers. One engineer has more than 15 years of
experience; the other, 21 years. The team of superintendents consisted of three road supervisors
located in other Wyoming counties. This group had no engineering degree credentials, but
combined, had more than 50 years of transportation experience. The data collected by the
different teams were analyzed using the control group as the basis for comparison.
A trial audit was conducted in County 1 in the southeastern part of the state of Wyoming.
The second and final audit was conducted in the northwestern part of the state. The county

13
engineers audited their own roads and those of the other county engineer. The county engineers
were familiar with the classification issues and both also had attended an RSA specialty
workshop held in 1998. When all the appropriate data were collected, a comparative analysis
was conducted using percentage and weighted percentage of agreement to identify the different
effects of auditor skill and urgency of improvement identifications.
Results
The percent of agreement analysis indicated that the combined decisions of the two
engineers (hypothetical team) identified the largest number of safety issues that also were
identified by the control group. In the first field audit, all groups had a closer agreement for the
higher roadway classifications (local rural major and minor subclasses). In the second field
audit, the closest results were obtained for the rural major medium-speed and rural minor road
classifications. The results were specifically close in the evaluation of roadside features, road
surface, and intersections and approaches categories of safety needs. Contained in the Executive
Summary attachment is a “Look For” list of the subcategories of safety issues. This attachment
also contains the recommended complete RSAR process for rural local governments. The next
step is to implement improvements that address the results of the RSAR. To accomplish this
objective, a short factual proactive report is a potentially needed tool to secure funding and to
help the county transportation agency. A sample of such a report is contained in the Executive
Summary attachment. The final step is to learn from these improvements by evaluating their
effectiveness over time.
The weighted percent of agreement analysis used only the highest safety severity issues.
In the first county, results of the engineers considered as a team were close to matching the

14
control group. The highest levels of agreement were for the rural secondary and rural local road
classifications. The second field audit used the concept of urgency and only those highest
urgency issues were used. The best results were obtained for the rural major medium speed and
rural minor classifications, again by the hypothetical team. It is important to note that more
urgent issues also were identified for these higher roadway classifications.
Overall, the results from these analyses indicate a trend showing that the combination of
the engineers compared favorably for the highest severity and urgency levels on the higher local
rural road classes. The major differences observed were in the local road auditor’s view of
correcting drainage needs as a more urgent safety problem and the control group’s valuing
signing needs as a more urgent priority. These differences probably are reflective of the local
“maintenance” smooth road issues compared to the signing value assessment of “traffic
engineering.” The road supervisors did not identify as many safety issues. They, however,
identified urgent issues that also were identified by the other groups. The road supervisor team
had a tendency not to identify issues and then recommend “do nothing” to improve the situation.
This recommendation surfaced frequently from the other groups, particularly on the lower
functional subclassifications. These differences are important as are the statements made by the
control group to not fix obviously needed safety improvements on the roads. The issues of user
characteristics and resource limitations were important in guiding these decisions.
Conclusions
The finalized local rural road safety audit review approach results in a simple, yet
potentially effective, tool to enhance local rural roadway safety. Evaluation of the proposed
methodology to aid local rural governments in conducting a RSAR was quite positive.

15
Valuable safety improvements were identified by all levels of expertise, particularly in
the higher local rural classifications.
All levels of expertise demonstrated consistency in their assessment of the issue of
urgency, especially in the intermediate to higher urgency levels.
The control group’s combined traffic safety expertise clearly was beneficial in identifying
potential safety deficiencies. However, considering the issue of recommended urgency, the team
of local county engineers identified most higher priority safety needs.
The local county road supervisor team of auditors were less likely to identify low priority
issues on lower classified roads, such as rural local and rural low-volume local roads.
Recommendations
The process developed in this study (Local Rural Government RSAR Process) must be
transferred to local rural governments, including training and a continuation of evaluating
effectiveness of this tool. The Wyoming Association of County Engineers and Road Supervisors
must begin to incorporate the RSAR into county practice. Identifying county safety needs by
sampling roads using the functional classification system should begin. In a three- to five-year
period, all county roads should be assessed using the RSAR process. Combining this with
implementing improvements using the urgency concept should provide local rural governments
with a practical safety tool. The RSAR is a proactive safety tool.

16

17
LOCAL RURAL GOVERNMENT RSAR PROCESS
Instructions for Local Rural Road Safety Audit Review Program
Safety Issues to LOOK FOR
RSAR Form
Functional Local Rural Road Classifications
Sample Letter to County Commissioners
Sample Report of RSAR Findings
“The key to safety is implementing
improvements for safety issues identified as urgent.”
18
Instructions for Local Rural Road Safety Audit Review Program
When you get to the road section:
1. Remember to evaluate the road section based on its functional rural road classification.
2. Review the "Look For."
3. Remember to consider all road users.
4. Drive slowly through the road section and look for potential safety issues. Focus on these issues in the travel way and to the right, as the initial review will be completed when you return to the starting point.
5. Next, drive through the test section at the posted speed limit or at safe operating speed.
6. Start RSAR by resetting odometer at start point, and drive slowly, with hazard lights activated. Stop and evaluate all potential safety deficiencies, looking at the travel way and to the right. Do one direction at a time.
7. Identify potential safety deficiencies. Use the odometer reading to approximate beginning and ending points or spots of deficiency. Repeat in the opposite direction and remember to reset odometer before you start that direction.
8. Next, check access approaches on the right side of the road. Drive access into the road section noting issues needing to be corrected, sight obstructions, signing, etc. Indicate the access location using the approximate mileage on the road section identified previously. Check for both travel directions.
9. For the road classification of this section, indicate how deficiencies should be corrected: a) Leave section as it is, no improvement needed for this road section, i.e. do nothing. b) Schedule Routine Maintenance. c) Major Reconstruction Required. d) Perform Routine Maintenance Immediately. e) Spot Improvement(s) Needed.
Have a safe trip!

19
Safety Issues to LOOK FOR:
Roadside Features 1. Are clear zones free of hazards and non-traversable side slopes without safety barriers? 2. Are the clear zones free of nonconforming and/or dangerous obstructions that are not
properly shielded?
Road Surface-Pavement Condition
3. Is the pavement free of defects that could result in safety problems (e.g., loss of steering control)?
4. Are changes in surface type (e.g., pavement ends or begins) free of poor transitions? 5. Is the pavement free of locations that appear to have inadequate skid resistance that could
result in safety problems, particularly on curves, steep grades, and approaches to intersections?
6. Is the pavement free of areas where ponding or sheet flow of water may occur resulting in safety problems?
7. Is the pavement free of loose aggregate/gravel, which may cause safety problems?
Road Surface-Pavement Markings 8. Is the road free of locations with pavement marking safety deficiencies? 9. Is the road free of pavement markings that are not effective for the conditions present? 10. Is the road free of old pavement markings that affect the safety of the roadway?
Road Surface-Unpaved Roads
11. Is the road surface free of defects that could result in safety problems (e.g., loss of steering control)?
12. Is the road surface free of areas where ponding or sheet flow of water may occur resulting in safety problems?
13. Is the road surface free of loose gravel or fines that may cause safety problems (control, visibility, etc.)?
14. Are changes in surface type (e.g., pavement ends or begins) free of drop-offs or poor transitions?
Signing and Delineation 15. Is the road free of locations where signing is needed to improve safety? 16. Are existing regulatory, warning, and directory signs conspicuous? 17. Is the road free of locations with improper signing, which may cause safety problems? 18. Is the road free of unnecessary signing which may cause safety problems? 19. Are signs effective for existing conditions? 20. Can signs be read at a safe distance? 21. Is the road free of signing that impairs safe sight distances? 22. Is the road free of locations with improper or unsuitable delineation (post delineators,
chevrons, object markers)?

20
Intersections and Approaches 23. Are intersections free of sight restrictions that could result in safety problems? 24. Are intersections free of abrupt changes in elevation or surface condition? 25. Are advance warning signs installed when intersection traffic control cannot be seen a safe
distance ahead of the intersection?
Special Road Users, Railroad Crossings, Consistency 26. Are travel paths and crossing points for pedestrians and cyclists properly signed and/or
marked? 27. Are bus stops and mail boxes safely located with adequate clearance and visibility from the
traffic lane? 28. Is appropriate advance signing provided for bus stops and refuge areas? 29. Are railroad crossing (crossbucks) signs used on each approach at railroad crossings? 30. Are railroad advance warning signs used at railroad crossing approaches? 31. Are railroad crossings free of vegetation and other obstructions that have the potential to
restrict sight distance? 32. Are roadway approach grades to railroad crossings flat enough to prevent vehicle snagging? 33. Is the road section free of inconsistencies that could result in safety problems?

21
Road Safety Audit Review for Local Rural Roads
Jurisdiction: _____________________________________________County
Date: ___________________________________________________
Location: ___________________________________________________
Weather: ___________________________________________________
Auditor(s): ___________________________________________________
Road Class: ___________________________________________________
Paved______ Unpaved______ Unimproved______ Speed_____
Sketch of road section:
Please include exact start and end point, north arrow, and other features as appropriate. i.e.
cattleguards, etc.
N
Overall Evaluation of Road Section, check one and/or comment:
1. Leave section as it is, no improvement needed at this road section
2. Schedule Routine Maintenance
3. Major Reconstruction Required
4. Perform Routine Maintenance Immediately
5. Spot Improvement(s) Needed
6. Comments:

22
Page____ of ____ Main Route Safety Evaluation Evaluation of Intersection/Approaches to Main Route
Direction of travel: N NW W SW S SE E NE (please circle appropriate direction)
Approx. Location
Description of concern or insert a number from the LOOK FOR
Urgency Recommended improvement number and/or specify
Urgency, considering classification of the roadway and cost of improvements
Recommended improvement, considering classification of the roadway and cost of improvements
1. Leave as it is 2. No urgency, but should be addressed 3. Schedule improvement in reasonably short time 4. As soon as possible
1. Remove 2. Repair 3. Relocate 4. Replace 5. Delineate 6. Shield 7. Other, please indicate action

23
Functional Local Rural Road Classification
Rural Major High-Speed Rural Minor Rural Local
Serves larger towns and other traffic generators not served by higher systems, links these places with nearby cities and larger towns or with higher systems, and serves more important intracounty travel corridors.
Typically: ♦ Paved surfaces ♦ Traffic volumes
400 v.p.d. ♦ Operating speed
40-65 m.p.h. ♦ Infrequent accesses
Provides access to land adjacent to the collector network and serves travel over relatively short distances.
Typically: ♦ Unpaved surfaces ♦ Traffic volumes
100-250 v.p.d. ♦ Operating speed
30-45 m.p.h.
Rural Major Medium-Speed Rural Low-volume Local
Serves larger towns and other traffic generators not served by higher systems, links these places with nearby cities and larger towns or with higher systems, and serves more important intracounty travel corridors.
Typically: ♦ Paved surfaces ♦ Traffic volumes
400 v.p.d. ♦ Operating speed
30-45m.p.h. ♦ Frequent accesses
Accumulates traffic from local roads, brings all developed areas within reasonable distances of collector roads, provides service to the remaining smaller communities, and links the locally important traffic generators within their rural region.
Typically: ♦ Unpaved surfaces ♦ Traffic volumes
250-400 v.p.d. ♦ Operating speed
40-60 m.p.h.
Provides access to land adjacent to the collector network and serves travel over relatively short distances.
Typically: ♦ Unpaved surfaces ♦ Traffic volumes
0-100 v.p.d. ♦ Operating speed variable

24
Sample Letter to County Commission
The Federal Highway Administration, Wyoming Department of Transportation, and the Wyoming Local Technical Assistance Program were invited to conduct road safety audit reviews on five ____ County roads. The reviews were conducted with two objectives: 1) serve as a pilot in development of a safety review process for local roads, and 2) make recommendations for possible safety improvements on the reviewed Park County roads.
Recommendations from the reviews are attached.
I would like to extend our appreciation to county person for his efforts with initiating the reviews and his assistance in developing a national model for safety reviews at the local level. _____ County should be proud of the progressive approach their personnel approach the safety of the roads.

25
County Road Safety Audit Reviews November 2, 1999
Mr.______, titleMr.______, titleMr.______, title
Roadways reviewed and the recommendations resulting from the reviews are as follows (specifics on exact locations and more details are provided in the review notes):
RURAL MAJOR HIGH-SPEED CLASSIFICATION
Several items were noted that could be improved if the road was ever reconstructed.However, considering the classification of the road and the cost of improvements, many items were recommended to leave as they are. Included are parallel drainage pipe blunt ends, trees, power poles, mailbox supports, and some relatively steep side slopes.
The following items were thought to be of a relatively low cost improvement that could have positive safety benefits and should be considered for improvement in a reasonably short time frame: Westbound: · relocate curve sign further upstream · delineate roadside where roadway narrows at horizontal curve and a relatively
steep slope exists (two locations) · replace non-standard speed limit signs Eastbound:· replace curve sign with a curve/intersection warning sign · relocate mailboxes · relocate curve sign further upstream · replace curve warning advisory speed plate to be consistent with opposite
direction· add delineation to clearly define edge of roadway cross-section · install a STOP sign
The following item was thought to be of such a nature that we recommend the improvement be initiated as soon as possible: · Install delineation where roadway alignment is not consistent with the power pole
alignment
The following items were considered to be of such a nature that they would have relatively high safety benefit if corrected, but are of relatively high cost for this classification of roadway. Therefore, it is recommended that they be considered for improvement if major reconstruction occurs on the roadway at or near these locations. · Driveway approach in poor location · Westbound view blocked by fence, restricted sight distance

26
· Driveway approach grades cause restricted sight distance
RURAL MAJOR MEDIUM SPEED CLASSIFICATION
Several items were noted that could be improved if the road was ever reconstructed at those specific locations. However, considering the classification of the road and the cost of improvements, many items were recommended to leave as they are. Included are low signs, relatively steep ditches, rigid non-breakaway fence, low guardrail, steep slope leading to guardrail, non-standard arrow speed limit sign.
The following items were thought to be of a relatively low cost improvement that could have positive safety benefits and should be considered for improvement in a reasonably short time frame: Westbound: · relocate 55mph sign · install winding road sign in lieu of many curve warning signs and replace curve
warning sign with turn warning sign at 25mph curve · delineate relatively steep slopes · install RR crossing pavement markings
Eastbound:· delineation inconsistent and in need of maintenance · repair edge dropoff · install winding road sign in lieu of many curve warning signs
The following item was thought to be of such a nature that we recommend the improvement be initiated as soon as possible: · Repair delineation where knocked down and where located on guardrail
RURAL MINOR CLASSICATION
Several items were noted that could be improved if the road ever was reconstructed at those specific locations. However, considering the classification of the road and the cost of improvements, many items were recommended to leave as they are. Included are vertical and horizontal sight restrictions and culvert blunt ends.
The following items were thought to be of a relatively low cost improvement that could have positive safety benefits and should be considered for improvement in a reasonable time frame: · reshape ditch sections · delineate roadside near holes · delineate roadside near steep high slopes
27
RURAL LOCAL CLASSIFICATION
Many potential safety concerns exist on this roadway. However, due to the classification of the roadway, it is recommended that no improvements be made except to install a STOP sign.
RURAL LOW-VOLUME LOCAL CLASSIFICATION
Several items were noted that could be improved if the road ever was reconstructed at those specific locations. However, considering the classification of the road and the cost of improvements, many items were recommended to leave as they are. Included are relatively steep slopes and ditches, vertical and horizontal alignment creating sight restrictions, no notification of road ending, and power poles.
The following items were thought to be of a relatively low cost improvement that could have positive safety benefits and should be considered for improvement within a reasonably short time frame: · pull ditches and remove large rocks

28

29
CHAPTER 1. INTRODUCTION
1.1 Background
Providing the safest travel environment is a challenge that the transportation
profession continues to face. Over the years, the technology of transportation has
changed from many perspectives. These include changes in vehicles, driver
demographics and skills, types of other road users, improvements in safety designs, and
understanding of the complex interactions needed to provide a safer traveling
environment. As the changes have occurred, it has become increasingly more difficult to
determine effective techniques to identify and correct safety deficiencies along the
millions of existing roadway miles. This has been particularly true in the local rural road
arena. Many local road agencies have neither the funding nor the expertise to effectively
respond to these issues. Helping to develop a practical approach to address their local
rural road safety needs is the purpose of this research.
A nationwide survey indicated that an average of 26 percent of local U.S. road
mileage was in need of major repair.18 Chicoine and Walzer7 reported that more than 50
percent of that roadway mileage required more than regular road maintenance. When it
comes to local rural road safety, the issue for these local road agencies is how to
effectively manage the safety of roadway mileage. Wilson17 has suggested that tailoring
road safety audits (RSAs) is one viable option for aiding local road agencies in
addressing these issues.
Road safety audits were introduced in England in the 1980s with the publication
of the Institution of Highways and Transportation guideline “The Safety Audit of
Highways”.4 Later, the road safety audit was adopted by several other countries

30
including Australia, New Zealand, and Denmark. In recent years, many different
guidelines on the topic of road safety audits have been published.1,2,3,8
According to Austroads,4 the Australian equivalent to the American Association
of State Highway and Transportation Officials (AASHTO), the RSA is “…a formalized
examination of an existing or future road or traffic project which interacts with road
users, in which an independent, qualified examiner reports on the project’s accident
potential and safety performance.” The road safety audit was originally designed to
identify traffic safety deficiencies on projects that still are in the planning or construction
phase or have just been opened. Most agencies, especially federal and state agencies,
have had safety programs in place for many years for reviewing new construction. This,
coupled with the fact that fewer new roads are being built, has shifted emphasis to
analyzing safety on existing roads. Wilson16 notes that when a road safety audit is used
on an existing road, it is more appropriately termed road safety audit review (RSAR).
The general purpose of the RSAR is to identify the potential safety hazards that exist.
Tailoring the RSAR to fit specialized cases, such as safety audits of bicycle facilities or
local rural roads has also been proposed (See Chapter, 2.2.6.).
Although road safety programs have become part of the management systems of
most state highway agencies, it often is difficult to use the same systems for local
jurisdictions. This is due to the expense of the initial data collection for a complete road
system safety needs inventory and the limited budgets that often restrict local
transportation agencies.

31
1.2 Goals and Objectives for Research
The goal of this research is to develop an RSAR tool to help local rural
governments develop a practical safety program. Ideally, this program will help to make
local rural roads safer. Keys to such a program include the need to be less expensive and
less time consuming when compared to earlier road safety programs, which most
agencies did not adopt. To meet the research goal, it is important to develop a program
that is “easy to learn and easy to use.”
To support the goal, this paper includes reviews of existing literature on rural road
safety audits and reviews with the objective of modifying and developing an RSAR to
match the local rural road needs. This study also examined the minimum level of
expertise required to perform a road safety audit review by analyzing results of actual
field trials used to develop a road safety audit review process. The final objectives of this
research are to create a road safety audit review that effectively identifies the nature of
safety deficiencies and urgency for repair of those deficiencies. Meeting the need for this
new RSAR to also be less expensive and easier to use was an essential factor.
1.3 Report Organization
Chapter 2 contains a literature review of recent road safety programs. In Chapter
3 the procedures and methodology used to analyze the relationship between level of
expertise and safety deficiencies are identified. Chapter 4 presents analysis and results,
and Chapter 5 contains the summary, conclusions, and recommendations of this research
project.

32

33
CHAPTER 2 – LITERATURE REVIEW
2.1 Introduction
This chapter reviews current literature regarding local rural roads and safety-
related programs. Emphasis has been placed on identifying the state of practice for local
rural agencies and the use of road safety audits. To identify a framework for local rural
roads, functional classification issues are discussed in the following section.
2.1.1 Functional Classification Systems
Under the functional classification system, roads and streets are grouped
according to the type of service they provide. The arterial system, including the Interstate
System, accounts for about 11.1 percent of the nation’s total road and street mileage and
carries 72.4 percent of total travel.1 In contrast, the local road system accounts for 68.8
percent of the nation’s total road and street mileage and carries 12.7 percent of total
travel.9
Local government agencies are responsible for maintaining most of the local
public roads in the United States. Funds available for maintaining local roads are, on
average, only $11,080 per mile, while state highways receive approximately six times as
much maintenance funding.1
There is a need to stratify local roads and streets to help guide the improvement
decision process. One previous rural local road functional classification system
developed at the University of Wyoming indicates the wide range of operating conditions
(see Table 1).1

34
Table 1. Classification System for Local Rural Roads1
ROAD CLASSIFICATION A B
Rural Primary Rural Secondary
Serves larger towns and other Accumulates traffic from local traffic generators not served by roads, brings all developed areas
FUNCTIONAL higher systems, links these places with nearby cities and
within reasonable distance of collector roads, provides service to the
SYSTEM towns or with higher systems, remaining smaller communities, and and serves the more important links the locally important traffic intracounty travel corridors generators with their rural region
Typically paved surface, traffic Typically unpaved surface but may volumes generally are 400 be paved, traffic volumes generally vehicles per day and above range from 250 to 400 vehicles per
day ROAD CLASSIFICATION
C DRural Local Rural Low-volume Local
Provides access to land adjacent to the collector network and
Provides access to land adjacent to the collector network and serves
FUNCTIONAL serves travel over relatively travel over relatively short distances SYSTEM short distances
Typically unpaved surface, Typically graded surface, traffic traffic volumes generally range volumes generally range from 0 from 100 to 250 vehicles per to 100 vehicles per day day
*Note: This classification system was modified by this research project.
2.2 Safety Programs
There are a variety of safety programs in use around the world and in the United
States. This part of the literature review examines major features of these programs.

35
2.2.1. Highway Safety Improvement Programs
In 1979, the FHWA required all states to develop and implement a comprehensive
Highway Safety Improvement Program (HSIP).2 The HSIP policy included three
standard components to make the program effective: planning, implementation, and
evaluation. Each component is a set of defined processes and sub-processes (Table 2).
The number in parentheses after each of the sub-processes in Table 2 refers to the number
of components suggested to attain completion of that sub-process. The total number of
processes and sub-processes recommended for use in the HSIP is 64.
Table 2. Outline of HSIP Structure1
I. PLANNING COMPONENT
Process 1: Collect and Maintain DataSub-process 1: Define the Highway Location Reference System (5) Sub-process 2: Collect and Maintain Crash Data (3) Sub-process 3: Collect and Maintain Traffic Data (3) Sub-process 4: Collect and Maintain Highway Data (3)
Process 2: Identify Hazardous Locations and Elements (7) Process 3: Conduct Engineering Studies Sub-process 1: Collect and Analyze Data at Identified Hazardous Locations (24) Sub-process 2: Develop Candidate Countermeasures (3) Sub-process 3: Develop Projects (5) Process 4: Establish Project Priorities (4)
II. IMPLEMENTATION COMPONENT
Process 1: Schedule and Implement Safety Improvement Projects Sub-process 1: Schedule Projects (4) Sub-process 2: Design and Construct Projects Sub-process 3: Conduct Operational Review
III. EVALUATION COMPONENT
Process 1: Determine the Effect of Highway Safety Improvements Sub-process 1: Perform Non-Crash-Based Project Evaluation Sub-process 2: Perform Crash-Based Project Evaluation Sub-process 3: Perform Program Evaluation Sub-process 4: Perform Administrative Evaluation

36
Because many of the HSIP procedures recommended require financing,
personnel, and expertise not available at most rural local transportation agencies, few
agencies have adopted this safety procedure.
Previous research at the University of Wyoming has focused on tailoring safety
improvement programs for rural local transportation agencies. For example, in 1996
Caldwell and Wilson proposed a safety improvement program for rural local roads. This
program consisted of a “five step, system-wide prioritization” of roads, identification of
safety improvement needs on individual road sections, prioritization of safety
improvements, and program evaluation and an updating of processes.2
2.2.2. Spot Improvement Approach versus System-Wide Improvement Approach
Highway safety improvements generally are considered as either spot
improvements or system wide improvements.10 The spot improvement approach focuses
on hazardous locations or segments of a highway system on which crash frequency or
severity is unusually high. Projects that use this approach often include one or more
crash prevention measures, such as revising grade and alignment, widening pavement,
installing signs or signals, adding pavement markings, flattening fill slopes, removing or
installing guardrails, removing trees, and moving utility poles. The program goal is to
correct a unique, site-specific safety problem identified from analyzing crash data. This
approach then reacts to the identified crash data.
The system-wide improvement approach focuses on roadways in a substantial
portion of an agency’s jurisdiction. An example of a system-wide improvement is to
install cross-bucks at all unmarked rail-highway crossings or to fix all deficient guardrail-
end terminals in a given jurisdiction.10 The road safety audit review has features of both
37
approaches. The RSAR seeks to identify needed safety improvements on road segments
and may incorporate analysis of crash data on the roadway segments audit. It is proactive
in that it looks at segments of roads not identified by crash data, but it also may
incorporate the reactive element of crash data.
2.2.3. Safety Management Systems
The 1991 Intermodal Surface Transportation Efficiency Act (ISTEA) mandated
states to develop, establish, and implement a highway safety management system
(SMS).11 The four processes that SMS focuses on are:11
1. Identifying hazards, setting priorities, and developing a program to correct
hazardous highway locations and features;
2. Maintaining and upgrading the safety of highway features and highway
hardware;
3. Ensuring routine and timely inclusion of safety concerns in the development
of all highway projects; and
4. Identifying special safety needs of commercial motor vehicles in the planning,
design, construction, and operation of the highway system.
Again, the requirements of an SMS are so extensive that most local agencies do not have
the personnel, expertise, and funding to implement an SMS program.
2.2.4. Risk Management Programs
The goals of risk management programs are to identify, quantify, and control
exposure to tort liability. Risk management programs include the following activities:12

38
• Recognize and anticipate the degree of legal risk inherent in all of an agency’s
system responsibilities and programs, procedures, or actions;
• Ensure that available resources are used in a manner that assures maximum
reduction of risk and prevention of loss while accomplishing the mission of
the agency;
• Prepare a timely, defensive response for actual or threatened legal actions; and
• Manage claims to result in proper resolution while achieving economy and
fairness to the agency and therefore the public.
The manner in which a risk management program addresses safety improvement
issues is through preventive maintenance. Essential aspects of an effective risk
management program are employee training and education, good record keeping, and
proper insurance. Other important elements of a successful risk management program are
routine inspections, provisions for emergency maintenance, design and operational
reviews, and a crash record review.2, 5, 13
As with the HSIP and the SMS, risk management programs require resources that
often are not available to local government agencies. Therefore, most local government
agencies have not adopted comprehensive risk management systems.
2.2.5. Road Safety Audits
The road safety audit (RSA) has been defined as a formal examination of an
existing or future road or traffic project, or any project which interacts with road users, in
which an independent, qualified examiner reports on the project’s crash potential and
safety performance.1, 2, 4, 6

39
The objectives of a road safety audit are:4, 15
• to identify potential safety problems for all road users and others
affected by a road project; and
• to ensure that measures to eliminate or reduce the problem are
considered fully.
Some of the benefits of conducting a road safety audit are the reduction in:4, 14, 15
• the likelihood of crashes on the road network;
• the severity of crashes;
• the need for costly remedial work; and
• the total cost of a project to the community, including accidents,
disruption and trauma.
Implied in the benefits list is the implementation of needed improvements. It also is a
tool to help road designers and traffic engineers give more prominence to road safety.
Using the results from an RSA in the design process is a proactive approach to refining
roadway design.
RSAs are conducted at any or all stages of a project. It generally is accepted,
however, that audits performed in earlier stages have more potential benefits. This is
because it is easier to change a line on a plan than to remove the problem by
reconstruction once the road is opened. The following five stages of road safety audits
are identified by Austroads, the National Association of Road Transport and Traffic
Authority for Australia.4, 15

40
Stage 1: The Feasibility Stage
Feasibility stage audits concern route options, layout options, and major design
options, such as roundabouts vs. signals. These audits provide an assessment of the
relative safety performance of scheme options and identify specific safety needs of
various road users. They also may highlight the need to re-design other nearby road or
traffic projects to safely accommodate changes in traffic.
Stage 2: The Draft Design Stage
At this stage, issues such as intersections or interchange layout and the chosen
design standards are addressed. Where land acquisition is required, the draft design stage
audit is undertaken before title boundaries are finalized.
Stage 3: The Detailed Design Stage
At this stage, the geometric design, traffic signing scheme, pavement marking
plans, lighting plans, and landscaping plans are available and are looked at in relation to
the operation of the road. The purpose is not to selectively evaluate compliance to
standards, but to consider how safety enhancements are potentially applied in the design.
Stage 4: The Pre-Opening Stage
Prior to opening, a site inspection is made for all relevant conditions and for all
applicable road users to ensure that the construction has addressed earlier audit concerns.
This stage, just like all stages in an RSA, focuses entirely on safety issues of all road
users.
Stage 5: Existing Roads
Road safety audits also are performed on sections of the existing road networks.
Some of the reasons to audit existing roads are changes in road use, changes in adjacent

41
property use, growth of surrounding landscape, and variances in road features. For local
rural governments, their safety needs primarily are in enhancing the existing road safety.
Due to the shift from proposed to existing, the concept of a road safety audit review
(RSAR) has been used.
When conducting an RSA, the auditor(s) often have available a checklist
especially designed for the stage in which the audit is conducted. This is a key tool to aid
the audit process. The checklist helps the auditor to consider all factors and provides a
reminder of potentially overlooked safety issues.
2.2.6. Road Safety Audit Review
As indicated previously, conducting a safety evaluation of an existing road is
more appropriately termed a road safety audit review (RSAR).16 Several research
projects that focused on adopting the road safety audit for existing roadways have been
completed at the University of Wyoming. The purposes of these projects were to identify
the value of the RSA process and to tailor the RSAR to specific types of projects.
One example of such a project is a bicycle safety audit, which was conducted on
the University of Wyoming campus. The bicycle safety audit developed a prototype
procedure and checklist for auditing bicycle and pedestrian facilities. The process
focused on general facility design, visibility, alignments, travel surface, signing, marking,
and issues associated with the multi-use path and other types of bicycle areas.
Another case specific research conducted at the University of Wyoming was a
rural local road safety audit review.1 In this research, checklists tailored to the problems
most often encountered on rural local roads were developed.

42
2.3 Summary of Literature Review
The conventional highway safety improvement, safety management, and risk
management programs examined in this literature review require a substantial amount of
funding, personnel, and expertise. Due to limited resources, most local government
agencies do not implement these programs.
While some tailoring of the road safety audit already has been completed, a safety
procedure for road safety audit review on local rural roads is still needed. There also
appears to be a lack of research on what level of expertise is needed to perform an RSAR
on the local rural roads. This research project assessed the combination of auditor skill
needed and how best to classify the safety deficiency in terms of urgency of
implementing an improvement. Given the limited resources available to rural local
agencies, the feasibility of conducting RSARs by using a team of independent safety
specialists also is probably not practical.

43
CHAPTER 3 - METHODOLOGY
3.1 Overview
The two major issues raised by the literature review are, first, the need to develop
a simple yet effective RSAR program for local rural roads, and second, the need to assess
the level of expertise needed to perform an RSAR. To address these issues, research
began by developing a preliminary road safety audit procedure. This trial procedure was
based on the classification, checklists, and approach previously developed by Wilson and
Tate;1 and the road safety audit programs developed in Australia and Denmark.4,15
Different audit groups applied the trial audit in the field. The focus groups conducted the
audit and provided recommendations on the procedure. No training, except for a brief
explanation of the proposed RSAR program, was given to different participants in the
trial audit in County 1. The control group was familiar with and had conducted audits.
After the trial audit in County 1, and as a result of the recommendations, a new
RSAR data collection procedure was developed. One of the recommendations was to add
another major rural road classification. The audit classification approach was revised and
the same focus groups tested the revised final audit process in County 2. Again the focus
groups were encouraged to make comments about the program while performing the
audit itself. The final recommended rural local road RSAR process is contained in
Appendix A with the revised recommended rural road functional classification system.
The purpose of the recommended RSAR is to provide a consistent tool, which is easy-to-
use by any auditor.
To answer the second issue of this research, “needed expertise,” the traffic safety
deficiency data collected in the audits, and the audit reports written by members of the

44
audit groups were analyzed. Methods used for the analysis are presented in Section 3.2,
Comparative Analysis.
3.1.1. Audit Groups
The audit groups consisted of a control group, two independent engineers, and a
team of superintendents. The control group included a University of Wyoming Professor,
a FHWA Traffic Safety Engineer, and a Wyoming Department of Transportation State
Traffic Engineer. The team of superintendents consisted of three road supervisors
located in other Wyoming counties. The data collected by the different teams were
analyzed using the control group as the basis for comparison.
3.1.2. Site Identification
The trial audit selected local rural roads, which fit the classifications developed
previously (see Table 3).
Table 3. Selected Roads versus Class Requirement
Rural Road Class Requirement Road Selected
Classification Serves Surface ADT Serves Surface ADT
Rural Primary Town Paved 400+ Town Paved 2074
Rural Secondary Developed Areas
Paved 250-400 Developed Areas
Paved 619
Rural Local Land Access Unpaved 00-250 Land Access Unpaved 424
Rural Low-volume Local
Land Access Unpaved 0-100 Land Access Unpaved no data

45
The trial audit was conducted in County 1 in the southeastern part of Wyoming. The
second and final audit was conducted in the northwestern part of the state. County
engineers audited their own roads and those of the other county engineer. Both county
engineers were familiar with the classification issues and also had attended an RSA
specialty workshop held in 1998. The final audit used five local rural road
classifications. In Table 4, the additional classification of a major medium speed local
rural road was added.
The major local rural classification was subdivided to reflect the different safety
needs that change with operating speed. The difference in access frequency was a major
determining characteristic of these two major local rural road classifications.
Table 4. Selected Roads versus Class Requirement for Revised Audit Classification
Class Requirement Road Selected Rural Road
Classification Serves Surface Speed ADT Serves Surface Speed ADT
Major Medium Speed
Town Paved 40-65 400+ Town Paved >55 715
Major Medium Speed
Town Paved 30-45 400+ Town Paved <45 2340
Minor Developed Areas
Paved 40-60 250-400 Developed Areas
Paved n/a 403
Rural Local Land Access Unpaved 30-45 100-250 Land Access Unpaved n/a 121
Rural Low-volume
Local
Land Access Unpaved variable 0-100 Land Access Unpaved n/a 59

46
3.2 Comparative Analysis
When all the appropriate data were collected, a comparative analysis was
conducted using percentage and weighted percentage of agreement. Each of the analysis
techniques is presented in the following sections.
3.2.1 Percentage
Groups were compared to the control group, whose results were considered the
standard. If the team measured had the exact same deficiencies identified, they would
score 100 percent. When comparing results using the technique of percentage, it is
important that the deficiency found by one group is the exact same deficiency as
identified by the control group. Otherwise, the results found by using this analysis
technique would not have any meaning.
If the control group identified 28 deficiencies, and one county engineer found 16
of the same deficiencies, the percentage of agreement would be 16 divided by 28, or 57
percent. Even though this is a simple calculation, it is a good measurement of how well
the different groups identified the same problems. The results using this analysis
technique are presented in Chapter 4.
3.2.2 Weighted Percentage
Another measure used to evaluate results was weighted percentage. This method
is similar to percentage, but also takes into account the severity of the deficiencies.
When the deficiencies were identified, they also were ranked in the severity or urgency
category, depending on the audit in which they were identified. In the first trial audit

47
(Appendix C) the category was termed severity, with a severity level of 3 classified as a
fatal deficiency, level 2 as a serious deficiency, and level 1 as a minor deficiency. Only
those deficiencies reported as level 2 or level 3 were used in the weighted percentage of
agreement analysis. This decision was made because it is more important to find the
deficiencies that are potentially fatal or result in a serious crash compared to those that
“only” result in a minor accident.
The final audit developed the concept of urgency. By definition, an urgency level
of 4 requires major reconstruction, a level 3 requires intermediate safety improvements,
level 2 requires routine maintenance, and level 1 requires no action. Deficiencies of 2, 3,
and 4 are analyzed in this study, since it was more important to identify problems that
needed to be addressed than problems that could be left as they were. The reason these
analyses were conducted was to determine if the audit groups found a higher percentage
of deficiencies at these more critical levels.
If the control group identified 23 deficiencies in urgency groups 2 and 3, and the
visiting engineer found 14, the weighted percentage of agreement would be 14 divided by
23, or 60 percent. The results of this analysis also are contained in Chapter 4, Analysis
and Results.
3.2.3 RSAR Completion Reports
The different groups who participated in this project were asked to write formal
reports regarding the audit after they had completed their respective prototype audits.
The reports were written and addressed as if the reports were to be sent to county
commissioners in each of the two counties.

48
RSAR reports were analyzed based on engineering judgment. This provided
additional insight into evaluating the level of expertise required. These RSAR reports
were compared with data the groups had collected in their prototype audits to ensure that
conclusions in the reports were the same as conclusions in the findings. Another
important aspect of these reports was simply to see if there were any differences in the
way the various groups reported. The RSAR reports are contained in Appendices D and
E.
3.2.4. Analysis by Local Rural Road Functional Classification
A fourth level of analysis evaluated safety needs stratified by the functional
classification of each roadway sector evaluated. The purposes of these evaluations were
to assess needs for training and/or the ability of each group to assess safety needs.
Considering the safety deficiencies by road type, stratified by the issue of urgency,
provided an opportunity to evaluate both expertise and classification issues. These were
potential tools to determine if classification issues resulted in differences in identifying
and classifying the urgency of improvement.
Ideally all identified “safety needs” would be corrected to the appropriate
standard. However, implementing improvements in the real world revolves around how
these ideals are tempered with user and cost factors. For example, a vertical fifty-foot
drop off adjacent to a roadway is an obvious hazard. However treatment alternatives
range from flattening the cross-slope to an acceptable level, providing guardrail,
providing delineation, to doing nothing.

49
An important issue focused on the views of the various groups with respect to
urgency. For example, considering the previous drop off issue for a rural local low-
volume road classification roadway, groups identifying the issue generally recommended
“do nothing.” In effect, this decision implies that the cost and user issues do not justify
the expense for this road type. On the other hand, the road supervisors often did not even
identify this as a safety problem, in effect also “doing nothing.”
Contained in Chapter 4 and Appendices B and C are results of the analysis using
these methods of evaluation. The analyses provided needed input into developing a
practical local rural road safety audit approach, and assessing auditor expertise.

50

51
CHAPTER 4 – ANALYSIS AND RESULTS
Refinements made to develop the recommended RSAR process are presented in
this chapter. The chapter concludes with an analysis conducted to address auditor
expertise and the effect expertise potentially has on audit results. The issues associated
with the local rural roadway classification are of particular interest in these evaluations.
4.1 RSAR Program
Development of the proposed RSAR program for local rural roads was
undertaken in several steps. The first step was the trial audit, which was developed by
reviewing current programs. The second step was to evaluate comments made by various
auditors in the initial audit. The third step incorporated the comments by revising
proposed local rural road audit classification and redefining the issue of urgency. In step
four, the revised audit classification was retested. Comments from this audit
classification were then incorporated into the final recommended audit procedure. The
results associated with different stages of development of the RSAR program are
presented below.
4.1.1. Safety Issues to LOOK FOR
The first item developed in the RSAR program was the checklist; this was made
after revising the checklist developed by Tate and Wilson1 (see Appendix A). These
checklists were tried in the first field audit. It was determined that a better procedure to
conduct an audit was to consider the checklists before, rather than after or during, the

52
audit. Therefore, the old checklists were more appropriately identified as “Safety Issues
to LOOK FOR.” (See Table 5.)
Table 5. Safety Issues to LOOK FOR
Roadside Features Are clear zones free of hazardous, non-traversable side slopes without safety barriers? Are the clear zones free of nonconforming and/or dangerous obstructions that are not properly shielded?
Road Surface-Pavement Condition Is the pavement free of defects that could result in safety problems (e.g., loss of steering control)? Are changes in surface type (e.g., pavement ends or begins) free of poor transitions? Is the pavement free of locations that appear to have inadequate skid resistance that could result in safety problems, particularly on curves, steep grades, and approaches to intersections? Is the pavement free of areas where ponding or sheet flow of water may occur resulting in safety problems? Is the pavement free of loose aggregate/gravel that may cause safety problems?
Road Surface-Pavement Markings Is the road free of locations with pavement marking safety deficiencies? Is the road free of pavement markings that are not effective for the conditions present? Is the road free of old pavement markings that affect the safety of the roadway?
Road Surface-Unpaved Roads Is the road surface free of defects that could result in safety problems (e.g., loss of steering control)?Is the road surface free of areas where ponding or sheet flow of water occur resulting in safety problems? Is the road surface free of loose gravel or fines that may cause safety problems (control, visibility, etc.)?Are changes in surface type (e.g., pavement ends or begins) free of drop-offs or poor transitions?
Signing and Delineation Is the road free of locations where signing is needed to improve safety? Are existing regulatory, warning, and directory signs conspicuous? Is the road free of locations with improper signing, which may cause safety problems? Is the road free of unnecessary signing, which may cause safety problems? Are signs effective for existing conditions? (Table 8. continued) Can signs be read at a safe distance? Is the road free of signing that impairs safe sight distances? Is the road free of locations with improper or unsuitable delineation (post delineators, chevrons, object markers)?

53
Intersections and Approaches Are intersections free of sight restrictions that could result in safety problems? Are intersections free of abrupt changes in elevation or surface condition? Are advance warning signs installed when intersection traffic control cannot be seen a safe distance ahead of the intersection?
Special Road Users, Railroad Crossings, Consistency Are travel paths and crossing points for pedestrians and cyclists properly signed and/or marked? Are bus stops safely located with adequate clearance and visibility from the traffic lane? Is appropriate advance signing provided for bus stops and refuge areas? Are railroad crossing (crossbucks) signs used on each approach at railroad crossings? Are railroad advance warning signs used at railroad crossing approaches? Are railroad crossings free of vegetation and other obstructions that have the potential to restrict sight distance? Are roadway approach grades to railroad crossings flat enough to prevent vehicle snagging? Is the road section free of inconsistencies that could result in safety problems?
4.1.2. Instructions
Another issue that arose after the first field audit was a need for clear, concise,
and simple RSAR instructions. The procedure developed also provided the benefit of
comparing results of the different audit groups. The final value, however, is one
standardized approach to identify safety needs by different auditors and the potential to
repeat audits at a later date.
Contained in Table 6 are the RSAR procedure instructions. An experienced
auditor would not need these instructions, however they are useful in identifying
locations of safety needs.

54
Table 6. RSAR Procedure Instructions
When you get to the road section: 1. Remember to evaluate the road section based on its functional rural road classification. 2. Review the "Safety Issues to Look For." 3. Remember to consider all road users. Drive slowly through the road section and look for
potential safety issues. Focus on these issues in the travel way and to the right, as the initial review will be completed when you return to the starting point.
4. Next, drive through the test section at the posted speed limit or at safe operating speed. Steps 4 and 5 will probably be combined by experienced auditors.
5. Start RSAR by resetting odometer at start point, and drive slowly, with hazard lights activated. Stop and evaluate all potential safety deficiency, looking at the travel way and to the right. Do one direction at a time.
6. Identify potential safety deficiencies. Use the odometer reading to approximate beginning and ending points or spots of deficiency. Repeat in the opposite direction and remember to reset odometer before you start that direction.
7. Next, check access approaches on the right side of the road. Drive access into the road section noting issues needing to be corrected, sight obstructions, signing, etc. Indicate the access location using the approximate mileage on the road section identified previously. Check for both travel directions.
8. For the road classification of this section, indicate how deficiencies should be corrected. Have a safe trip!
4.1.3. New Classification System
One of the comments made after the first field trial audit was that the current
classification system was in need of improvement. The road sections evaluated indicated
a need for an additional local major road subclassification. The suggestion was that the
range of operating speed and frequency of side road accesses also should be factors for
major local roads. Safety issues and operating characteristics differ widely if a road has
an operating speed of 65 mph versus 45 mph, even though the rest of the requirements of
the road classification are the same. The recommended local rural road functional
classification is presented in Table 7.

55
Table 7. Functional Local Rural Road Classification
Rural Major High-Speed Rural Minor Rural Local
Serves larger towns and other traffic generators not served by higher systems, links these places with nearby cities and larger towns or with higher systems, and serves more important intracounty travel corridors.
Typically: ♦ Paved surfaces ♦ Traffic volumes
400 v.p.d. ♦ Operating speed
40-65 m.p.h. ♦ Infrequent accesses
Provides access to land adjacent to the collector network and serves travel over relatively short distances.
Typically: ♦ Unpaved surfaces ♦ Traffic volumes
100-250 v.p.d. ♦ Operating speed
30-45 m.p.h.
Rural Major Medium-Speed Rural Low-Volume Local
Serves larger towns and other traffic generators not served by higher systems, links these places with nearby cities and larger towns or with higher systems, and serves more important intracounty travel corridors.
Typically: ♦ Paved surfaces ♦ Traffic volumes
400 v.p.d. ♦ Operating speed
30-45m.p.h. ♦ Frequent accesses
Accumulates traffic from local roads, brings all developed areas within reasonable distances of collector roads, provides service to the remaining smaller communities, and links the locally important traffic generators in their rural region.
Typically: ♦ Unpaved surfaces ♦ Traffic volumes
250-400 v.p.d. ♦ Operating speed
40-60 m.p.h.
Provides access to land adjacent to the collector network and serves travel over relatively short distances.
Typically: ♦ Unpaved surfaces ♦ Traffic volumes
0-100 v.p.d. ♦ Operating speed variable
4.1.4. RSAR Program
Members of the audit groups were encouraged to provide comments on the
program at all stages of development. Their input simplified the recommended RSAR
process developed. (See Appendix A.)

56
For each evaluated roadway, the RSAR form identified the route, its
classification, audit review results, and urgency for each section evaluated. Prior
research by Caldwell and Wilson2 provided guidance in developing an overall county
audit program. The forms also were used to assess the audit results and expertise issues.
The RSAR forms provide general information about the road. They also provides space
for an overall evaluation for the entire road audited. Consideration of the roadway
classification is an important aspect of the process. The second page of the RSAR is the
actual audit sheet. The audit sheet includes space to record items such as approximate
location, description of concern, urgency of the problem, and potential improvement.
4.2 Comparative Analysis
To determine the level of expertise and training needed to perform a rural local
road RSAR, it was necessary to measure how groups' results compared with the control
group. Discussed in the next section are the results using the percent comparison
analysis.
4.2.1. Percent Comparisons
For the percent comparison analysis, an aggregate evaluation considering both
engineers also was made. If either the visiting engineer or the resident engineer reported
a safety need it was indicated in the hypothetical team report. The analysis was
completed on a road-by-road and county-by-county basis. The results are summarized
and presented in Table 8, Total Road Deficiencies Identified—Trial Audit and Table 9,
Total Road Deficiencies Identified—Final Audit.

57
Not surprisingly, the hypothetical combination team of engineers achieved the
best overall results. Considering all the road classes, the team had an average of 70
percent in the trial audit, and 44 percent in the final audit. One of the reasons for the
difference was that there was only one deficiency reported by the control group on the
local rural classification roadway and none of the other groups identified this issue.
The other groups did not do as well as the combination of engineers. The visiting
engineer alone had an average of 65 percent in the trial audit. The residing engineer
identified 35 percent. (This is an interesting result, since the trial audit county is his home
county). Only in one road class in one county did the two engineers hypothetical
combination result fail to show a better result than every other group.

58
Tab
le 8
. T
otal
Roa
d D
efic
ienc
ies
Iden
tifi
ed–T
rial
Aud
it
Con
trol
G
roup
T
eam
of
Eng
inee
rs
Vis
itin
g E
ngin
eer
R
esid
ent
Eng
inee
r
Tea
m o
f
Supe
rint
ende
nts
A
VE
RA
GE
Rur
al P
rim
ary
2315
(65
%)
14 (
61%
) 4
(17%
) 3
(13%
) 9.
0 (3
9%)
Rur
al S
econ
dary
15
13 (
86%
) 12
(80
%)
9 (6
0%)
5 (3
3%)
9.8
(65%
)
Rur
al L
ocal
6
3 (5
0%)
3 (5
0%)
2 (3
3%)
1 (1
7%)
2.3
(38%
)
Rur
al L
ow-V
olum
e L
ocal
2
1 (5
0%)
1 (5
0%)
1 (5
0%)
0 .
8 (3
8%)
Tot
al C
ount
y 1
4632
(70
%)
30 (
65%
) 16
(35
%)
9 (2
0%)
21.8
(47
%)

59
Tab
le 9
. T
otal
Roa
d D
efic
ienc
ies
Iden
tifi
ed–F
inal
Aud
it
Con
trol
G
roup
T
eam
of
Eng
inee
rs
Vis
itin
g E
ngin
eer
Res
iden
t E
ngin
eer
Tea
m o
f Su
peri
nten
dent
s A
VE
RA
GE
Rur
al M
ajor
Hig
h-Sp
eed
239
(39%
) 4
(17%
) 8
(34%
) 4
(17%
) 6.
3 (2
7%)
Rur
al M
ajor
Med
ium
-Sp
eed
137
(53%
) 3
(23%
) 7
(53%
) 3
(23%
) 5.
0 (3
8%)
Rur
al M
inor
11
7 (6
4%)
4 (3
6%)
5 (4
5%)
4 (3
6%)
4.8
(43%
)
Rur
al L
ocal
1
00
00
0
Rur
al L
ow-V
olum
e L
ocal
9
2 (2
2%)
1 (1
1%)
1 (1
1%)
3 (3
3%)
1.8
(19%
)
Tot
al C
ount
y 2
5725
(44
%)
12 (
21%
) 21
(37
%)
14 (
25%
) 18
.1 (
32%
)

60
When results are compared by functional classification, it is interesting to note
that all groups had a higher agreement on the rural secondary classification for the trial
audit. The team of engineers had a percent of agreement with the control group of 86
percent; the visiting engineer’s agreement was 80 percent; the resident engineer scored 60
percent; and the team of superintendents had 33 percent agreement on the 15 deficiencies
reported.
In the rural primary class the control group reported 23 deficiencies, and the team
of engineers and the visiting engineer also had good results with percents of agreement of
65 and 61, respectively. The residing engineer did not do as well (17 percent), while the
team of superintendents identified only 13 percent. In the rural local and low-volume
local classes, both the team of engineers, and the visiting engineer had a 50 percent
agreement. The team of superintendents had 17 and 0 percent of agreement on a total of
eight deficiencies reported.
In the final audit, the rural minor class had the highest percent of agreement, and
the engineers, when considered as a team, had the best results with 64 percent. The
resident engineer reported 45 percent; and the visiting engineer and the team of
superintendents, 36. There were 11 deficiencies reported in this class. For rural major
medium-speed classification, the engineering team and the resident engineer identified 53
percent; while the visiting engineer and the superintendent team identified only 23
percent.
The rural major high-speed class had 23 reported deficiencies. In this class the
team of engineers identified 39 percent, the resident engineer, 34, and the visiting
engineer and the superintendents, 17 percent. On the rural local there was only one

61
identified deficiency, and none of the groups reported that deficiency. The local low-
volume class had nine deficiencies, and the engineers identified 22 percent of these. The
overall trend was that the team of engineers identified the highest percentage, in all but
one road class, when compared to the control group. These groups also identified most
of the deficiencies for the higher classified roadways.
The second item that was explored using percent of agreement was how different
groups evaluated specific types of deficiencies. The deficiencies were classified in seven
different categories (Appendices B & C):
1. Roadside features
2. Pavement condition
3. Pavement markings
4. Unpaved roads
5. Signing and delineation
6. Intersections and approaches, and
7. Special road users, railroad crossings, consistency
Once again, the engineers were compared to the control group, as a team and as
individual participants. Overall, on all of the nine field audits, the team of engineers
identified 68 percent of the deficiencies reported by the control group in category one,
roadside features. The visiting engineer in County I indicated 62 percent, and the
resident engineer in County I identified 30 percent. The team of superintendents
identified 26 percent. The total number of deficiencies in this category was 50. In the
second category the total number of deficiencies was six, and the team of engineers and
visiting engineer in County I identified 66 percent of these deficiencies. The resident

62
engineer in County I and the team of superintendents indicated 50 percent of the
deficiencies.
In the signing and delineation category the total number of issues identified by the
control group was 19; the team of engineers identified 32 percent of these. Both the
engineers indicated 21 percent by themselves, and the superintendent team identified 16
percent.
When it came to the safety issues associated with intersections and approaches,
the team of engineers indicated 46 percent of the 13 reported deficiencies. The visiting
engineer in County I alone determined that 38 percent were in need of improvement; and
the resident engineer in County I and the team of superintendents identified 23 percent.
In the category associated with special issues, the team of engineers and visiting engineer
in County I identified 33 percent of the six deficiencies; the resident engineer in County I
and the team of superintendents indicated 17 percent. The results for all the roads are
contained in Appendices B and C.
An interesting observation is that in the pavement condition, signing and
delineation, intersection and approaches, special user, and railroad and consistency
categories none of the groups identified even half of the issues that were identified by the
control group.
It should be noted that the previous discussion has not considered the issue of
urgency of the needed safety improvement. This issue is examined in section 4.2.2. A
potential for the differences is that although the control group identified a problem as a
safety deficiency and the other groups did not identify it, that difference may be
attributed to the control group indicating a low priority need for the improvement. The

63
other groups did not note the deficiency potentially due to low urgency of improvement
and roadway classification.
4.2.2. Weighted Percent
The weighted percent analysis was performed in the same manner as the percent
analysis: that is, by measuring how well the different groups performed when compared
to the control group. The analysis was again conducted on a road-by-road and county-
by-county basis. The results are summarized and presented in Table 10, Road Deficiency
Urgency—Final Audit, Table 11, Road Deficiency Urgencies 2 and 3—Final Audit, and
Appendices B and C.
Measurements of urgency were conducted in the Final Audit as a result of
comments received from the trial audit. Urgency replaced the measurement of severity
since crash severity was considered too subjective. The analysis below is based on the
measurements of an urgency of 4, major reconstruction required, and the combined
urgencies of 2 and 3, routine maintenance and intermediate improvements, respectively.
More data were identified as urgencies 2 and 3, perhaps reflective of the difficulty in
recommending major reconstruction.
As in the percent analysis, the hypothetical combination of the engineers did
better than the other groups in identifying deficiencies. The average weighted percent of
agreement for the combination of the engineers for the trial audit for the combination of
urgencies 2 and 3 was 42 percent; while the visiting engineer identified 21 percent;
resident engineer, 38; and the team of superintendents averaged 21 percent (see Table
11). The final audit data were harder to analyze using the weighted percent method; this

64
was due to the small sample of deficiencies. There were only 12 reported deficiencies
with an urgency level of 3 or 4, in the final audit (see Appendix B for summaries). The
trial audit in County 1 had 36 deficiencies with a severity level of 2 or 3 reported by the
control group. With fewer deficiencies, the weighted percent method produces less
reliable analysis.

65
Tab
le 1
0. R
oad
Def
icie
ncy
Urg
ency
4 O
nly–
Fin
al A
udit
Con
trol
G
roup
T
eam
of
Eng
inee
rs
Vis
itin
g E
ngin
eer
Res
iden
t E
ngin
eer
Tea
m o
f
Supe
rint
ende
nts
AV
ER
AG
E
Rur
al M
ajor
Hig
h-S
peed
3
2 (6
7%)
1 (3
3%)
1 (3
3%)
01.
0 (3
3%)
Rur
al M
ajor
Med
ium
-Spe
ed
00
00
00
Rur
al M
inor
4
3 (7
5%)
1 (2
5%)
31
(25%
) 2.
0 (5
0%)
Rur
al L
ocal
0
00
00
0
Rur
al L
ow-V
olum
e L
ocal
0
00
00
0
Tot
al C
ount
y 2
75
(71%
) 2
(29%
) 4
(57%
) 1
(14%
) 3.
0 (4
3%)
Not
e:
1)
Roa
d D
efic
ienc
y U
rgen
cy is
mea
sure
d in
term
s of
the
repa
ir r
equi
red
to p
reve
nt a
cra
sh b
ased
on
judg
emen
t of
the
pote
ntia
l for
a
cras
h. U
rgen
cy is
mea
sure
d as
: 1 –
leav
e as
is, 2
- ro
utin
e m
aint
enan
ce im
med
iate
ly, 3
- ap
ply
inte
rmed
iate
saf
ety
impr
ovem
ents
, an
d 4-
maj
or r
econ
stru
ctio
n to
sta
ndar
d re
quir
ed.
Thi
s di
ffer
s fr
om th
e m
easu
re u
sed
in T
able
10
(Tri
al A
udit)
. O
nly
defi
cien
cies
id
entif
ied
by th
e co
ntro
l gro
up a
s ur
genc
y 4
appe
ar in
this
tabl
e.
2)
The
use
of
Seve
rity
in th
e T
rial
Aud
it w
as c
onsi
dere
d to
o su
bjec
tive
and
was
cha
nged
to U
rgen
cy in
the
Fina
l Aud
it.

66
Tab
le 1
1. R
oad
Def
icie
ncy
Urg
enci
es 2
& 3
– F
inal
Aud
it
Con
trol
G
roup
T
eam
of
Eng
inee
rs
Vis
itin
g E
ngin
eer
Res
iden
t E
ngin
eer
Tea
m o
f
Supe
rint
ende
nts
AV
ER
AG
E
Rur
al M
ajor
Hig
h-S
peed
15
5 (3
3%)
2 (1
3%)
5 (3
3%)
2 (1
3%)
3.5
(23%
)
Rur
al M
ajor
Med
ium
-Spe
ed
64
(67%
) 2
(33%
) 4
(66%
) 2
(33%
) 3.
0 (5
0%)
Rur
al M
inor
2
1 (5
0%)
1 (5
0%)
01
(50%
) .
8 (3
8%)
Rur
al L
ocal
0
00
00
0
Rur
al L
ow-V
olum
e L
ocal
1
00
00
0
Tot
al C
ount
y 2
2410
(42
%)
5 (2
1%)
9 (3
8%)
5 (2
1%)
7.3
(30%
)
Not
e:
1)
Roa
d D
efic
ienc
y U
rgen
cy is
mea
sure
d in
term
s of
the
repa
ir r
equi
red
to p
reve
nt a
cra
sh b
ased
on
judg
emen
t of
the
pote
ntia
l for
a
cras
h. U
rgen
cy is
mea
sure
d as
: 1 –
leav
e as
is, 2
- ro
utin
e m
aint
enan
ce im
med
iate
ly, 3
- ap
ply
inte
rmed
iate
saf
ety
impr
ovem
ents
, an
d 4-
maj
or r
econ
stru
ctio
n to
sta
ndar
d re
quir
ed.
Thi
s di
ffer
s fr
om th
e m
easu
re u
sed
in T
able
10
(Tri
al A
udit)
. O
nly
defi
cien
cies
id
entif
ied
by th
e co
ntro
l gro
up a
s ur
genc
y 2
or 3
app
ear
in th
is ta
ble.
2)
T
he u
se o
f Se
veri
ty in
the
Tri
al A
udit
was
con
side
red
too
subj
ectiv
e an
d w
as c
hang
ed to
Urg
ency
in th
e Fi
nal A
udit.

67
When the roads were compared by functional classification using the weighted percent of
agreement, the rural secondary category for the trial audit in County 1 (Appendix C) also
indicated the best agreement with safety problems identified by the control group. The
hypothetical combination of engineers identified 79 percent of deficiencies in need of
improvement reported by the control group in the trial audit, whereas the visiting
engineer, identified 71 percent, and the residing engineer indicated 50 percent. All the
reported deficiencies in this road classification were identified as an urgency of 2 or 3.
Of the 16 reported deficiencies in the rural primary class, the engineers identified
81 percent; the visiting engineer, 75; resident engineer, 25; and the superintendents 13
percent. In the two lowest local rural road classes the engineers and the visiting engineer
identified 75 percent in the local class and 50 percent in the low-volume class. The
resident engineer reported 50 percent in both classes, and the superintendents reported no
issues for low-volume class.
In the final audit (measuring urgencies 2 and 3; Table 11, Road Deficiency
Urgencies 2 and 3—Final Audit), the trend was similar but there were fewer deficiencies
reported by the control group. For the rural minor roadway the engineers combined, the
visiting engineer, and the team of superintendents identified 50 percent. Of the 15
reported deficiencies in the major high-speed class, the combined engineers indicated 33
percent, visiting engineer 13 percent, resident engineer 33 percent, and superintendents
13 percent. In the low-volume local class, only one deficiency was reported. The rural
local class had no deficiencies reported by the control group. Once again, the results of
the weighted percent indicated that the hypothetical team of engineers produced the best
results.

68
4.2.3. RSAR Completion Reports
The different groups who participated in this project were asked to write a formal
report regarding audit results. It was requested that these reports be written as if they
were to be sent to the county commissioners in each of the two counties.
Reports from the control group were clear and precise. They gave comments on
the various deficiencies and also technical suggestions for improvements. Their
conclusions were in agreement with their field data.
The reports from the engineers also were very good. They gave recommendations
for improvements, and their reports were clear and understandable.
The report from the superintendent team was brief and less precise. This group
barely touched on main problems in the county, and only one of the members of this
group mentioned any recommendations for improvement for each of the local rural roads
in the county audited. These reports are contained in Appendices D and E.
4.3 Summary of Results
In terms of identifying safety deficiencies, results presented in this chapter
indicate that a hypothetical group combining several county engineers resulted in the best
agreement with the control group. Results of the engineering combination are based on
the concept that they performed the field audits separately and not as a team. These
results only indicate that the two separate engineers’ combined results were better than
the results of either engineer individually.
Considering the classification system the highest level of agreement occurred in
the higher rural roadway classifications. This also is where the control group reported the

69
highest number of deficiencies. These classes both have the highest average daily traffic
and the highest operating speed levels. It is well documented that the severity of
accidents increases with speed. Roadside features, pavement markings, and unpaved
roads safety “look for issues” were more consistently identified by all comparison
groups. Few deficiencies were identified as needing improvement by any groups for the
rural local and the rural low-volume local, which were unpaved roads.
In the final audit, deficiencies when identified with urgency resulted again in the
combination of the engineers agreeing the closest to the control group. These results
were best for the higher local rural road classes, and higher urgencies. Results were
closest to the control group in the rural major high-speed, rural major medium-speed, and
rural minor roads audited. It is quite possible that the team of superintendents detected
more problems in these roads than they reported. They may have not reported the
problem since the severity/urgency was not high enough to be corrected on that particular
road. An example of this is the obvious problem with the steep side slope next to the
low-volume road in County II; this deficiency was reported by the control group and was
given an urgency of 1 (do nothing). This deficiency was not reported by any of the local
auditors. The agreement was not as good on the rural local and the rural low-volume
local roads audited. The major differences were in the local road auditors' view to correct
drainage needs as a more urgent safety problem and the control groups valuing signing
needs as a more urgent priority.
The following chapter presents a summary of the findings associated with the
project. Also included are conclusions made based on the analysis of research findings.
Specific recommendations for further study also are contained in Chapter 5.

70

71
CHAPTER 5 – SUMMARY, CONCLUSIONS, AND RECOMMENDATIONS
5.1 Summary
This research project addressed benefits of a local rural road safety audit review
program, and explored the level of expertise necessary to conduct such a program. The
goal of this research was to develop a tool to help make local rural roads safer.
The conventional highway safety improvement, safety management, and risk
management programs examined in the literature review require substantial amounts of
funding, personnel, and expertise. Due to limited resources at the local level, most local
transportation agencies do not implement such safety programs. Instead, they rely on
input from law enforcement, analysis of accident records, routine maintenance
inspection, and/or input from the public, public officials, and employees for identifying
safety improvement needs. While these methods are somewhat beneficial, the current
high crash rates indicate a need for further attention to safety issues on local rural roads.
The literature review revealed a lack of research regarding the level of expertise needed
to perform a rural local RSAR, and also pointed to the need for a simple, yet effective,
rural local RSAR program.
Research began by developing a preliminary road safety audit program; the
program then was given to the focus group for a prototype audit in the field. Focus
groups were encouraged to not only perform an audit, but also to comment on the
process. The focus groups completed a second series of audits, which led to the final
recommended rural local RSAR.

72
To explore the level of expertise needed to perform a rural local RSAR,
comparative analysis was used in combination with engineering judgment. The data
collected in prototype audits were used as background information for the comparative
analysis. Three methods were used in the analysis: percent of agreement, weighted
percent of agreement, and analysis by local rural functional classification.
The focus groups for this research consisted of a control group, two county
engineers and a team of superintendents. The control group was composed of a WyDOT
traffic engineer, a FHWA safety engineer and a University of Wyoming traffic
engineering professor. In these analyses, results from the different groups were compared
with the results of the control group.
The percent of agreement analysis indicated that the combined decisions of the
two engineers identified the largest number of safety issues identified by the control
group. In the first field audit, all groups had a closer agreement for the higher roadway
classifications. In the second field audit the closest results were obtained for the rural
major medium-speed, and rural minor road classifications. The results were specifically
close in the evaluation of roadside features, road surface, and intersections and
approaches categories.
The weighted percent of agreement analysis used only the highest safety severity
issues. In the first county the results of the engineers considered as a team identified
close to the control group. The highest levels of agreement were for the rural secondary
and rural local road classifications. The second field audit used the concept of urgency
and only those highest urgency issues. The best results were obtained for the rural major
medium speed and rural minor classifications. However, it is important to note that more
urgent issues were identified for the higher roadway classifications.

73
Overall, results from these analyses indicate a trend showing that the combination
of the engineers compared favorably for the highest severity and urgency levels on the
higher local rural road classes. The major differences were in the local road auditor’s
view of correcting drainage needs as a more urgent safety problem and the control
group’s valuing signing needs as a more urgent priority.
The different groups who participated in this project were asked to write a formal
report regarding the audit after they had completed their prototype audits. These RSAR
reports were analyzed based on engineering judgment. The results from the comparisons
of these reports indicated the value of engineering expertise. Reports from the engineers
were more specific and professionally developed.
5.2 Conclusions
In this section, the conclusions reached from the local rural road safety audit
review research are presented:
1. The local rural road functional classification system was improved by reflecting
different operating speed conditions for the major rural roads. These functional
classifications were stratified into major rural high-speed and major rural medium-
speed classes.
2. The finalized local rural road safety audit review approach results in a simple, yet
potentially effective, tool to enhance local rural roadway safety. The evaluation of
the proposed methodology to aid local rural governments in conducting an RSAR was
positive.
3. Valuable safety improvements were identified by all levels of expertise, particularly
in the higher local rural classifications.

74
4. All levels of expertise demonstrated consistency in their assessment of the issue of
urgency, especially in the intermediate to higher urgency levels.
5. The control groups’ combined traffic safety expertise clearly was beneficial in
identifying potential safety deficiencies. However, considering the issue of
recommended urgency, the team of local county engineers identified mainly the
higher priority safety needs.
6. The local county road auditors were less likely to identify low priority issues on lower
classified roads, such as rural local and rural low-volume local roads.
5.3 Recommendations
In this section, recommendations for additional research concerning local rural
road safety audit reviews are presented:
1. Additional field studies of the finalized RSAR program should be conducted to test
the program’s reliability.
2. A larger sample size is needed to validate results from this study and to more
precisely determine the appropriate level of expertise needed to perform an RSAR.
3. In this study the engineers went out separately, but their combined observations were
used to identify deficiencies at their level of expertise. Additional research should be
conducted to explore the value of engineers working as a team, rather than
individually.
4. For further development of the finalized RSAR program, it should be disseminated to
the Wyoming Association of County Engineers and Road Supervisors (WACERS).
5. An appropriate training program for the auditors of local rural RSARs should be
developed.

75
6. The value of using global positioning system technology in rural road safety audit
reviews should be investigated.

76
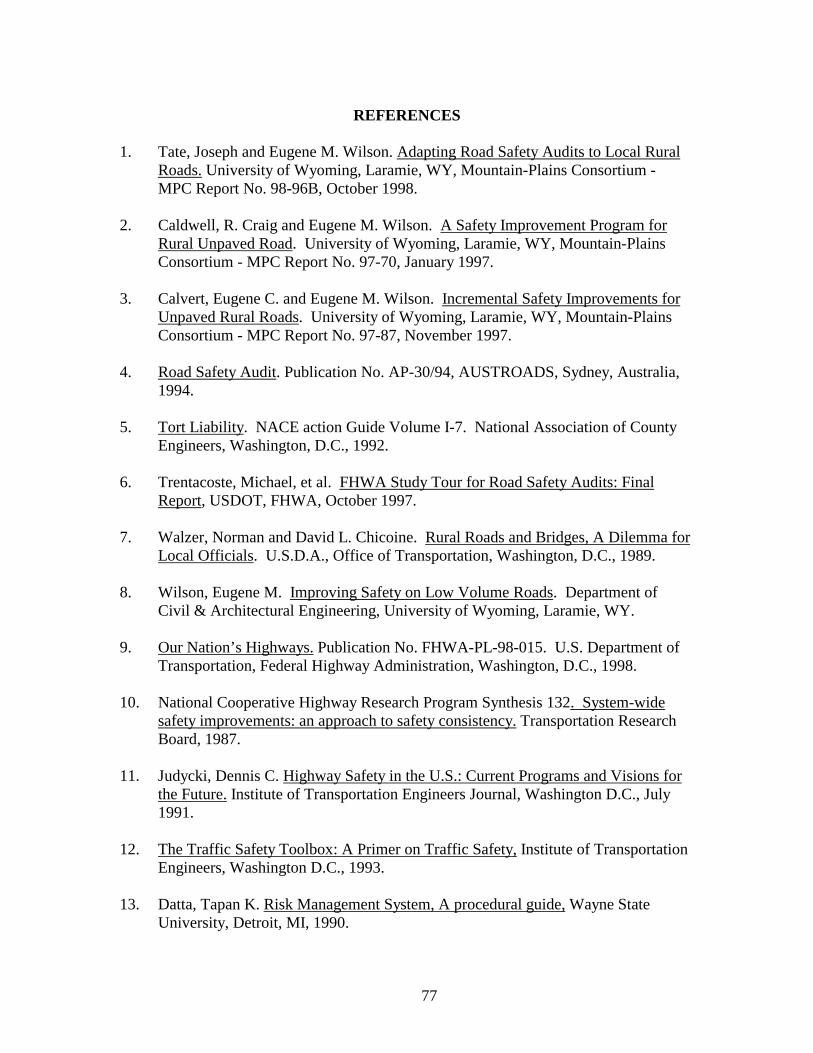
77
REFERENCES
1. Tate, Joseph and Eugene M. Wilson. Adapting Road Safety Audits to Local Rural Roads. University of Wyoming, Laramie, WY, Mountain-Plains Consortium - MPC Report No. 98-96B, October 1998.
2. Caldwell, R. Craig and Eugene M. Wilson. A Safety Improvement Program for Rural Unpaved Road. University of Wyoming, Laramie, WY, Mountain-Plains Consortium - MPC Report No. 97-70, January 1997.
3. Calvert, Eugene C. and Eugene M. Wilson. Incremental Safety Improvements for Unpaved Rural Roads. University of Wyoming, Laramie, WY, Mountain-Plains Consortium - MPC Report No. 97-87, November 1997.
4. Road Safety Audit. Publication No. AP-30/94, AUSTROADS, Sydney, Australia, 1994.
5. Tort Liability. NACE action Guide Volume I-7. National Association of County Engineers, Washington, D.C., 1992.
6. Trentacoste, Michael, et al. FHWA Study Tour for Road Safety Audits: Final Report, USDOT, FHWA, October 1997.
7. Walzer, Norman and David L. Chicoine. Rural Roads and Bridges, A Dilemma for Local Officials. U.S.D.A., Office of Transportation, Washington, D.C., 1989.
8. Wilson, Eugene M. Improving Safety on Low Volume Roads. Department of Civil & Architectural Engineering, University of Wyoming, Laramie, WY.
9. Our Nation’s Highways. Publication No. FHWA-PL-98-015. U.S. Department of Transportation, Federal Highway Administration, Washington, D.C., 1998.
10. National Cooperative Highway Research Program Synthesis 132. System-wide safety improvements: an approach to safety consistency. Transportation Research Board, 1987.
11. Judycki, Dennis C. Highway Safety in the U.S.: Current Programs and Visions for the Future. Institute of Transportation Engineers Journal, Washington D.C., July 1991.
12. The Traffic Safety Toolbox: A Primer on Traffic Safety, Institute of Transportation Engineers, Washington D.C., 1993.
13. Datta, Tapan K. Risk Management System, A procedural guide, Wayne State University, Detroit, MI, 1990.

78
14. Med et vaakent kritisk blikk paa trafikksystemet, Statens vegvesen Vegdirektoratet, Oslo, Norway, 1990.
15. Manual of Road Safety Audit, Road Directorate, Ministry of Transportation, Denmark, 1997.
16. Wilson, Eugene M. Road Safety Audit Reviews For Local Governments.Department of Civil & Architectural Engineering, University of Wyoming, Laramie, WY, 1999.
17. Wilson, Eugene M. Application for Section 402 Funding, Wyoming DOT Highway Safety Program. Department of Civil & Architectural Engineering, University of Wyoming, Laramie, WY, April 1998.
18. Deller, Steven C. and John M. Halstead. Financing Rural Roads and Bridges in the Northern New England States. (Bulletin 836) Orono: Maine Agriculture Experiment Station, October 1991.

79
APPENDIX A – Audit Review Program

80
Instructions for Local Rural Road Safety Audit Review Program
When you get to the road section:
10. Remember to evaluate the road section based on its functional rural road classification.
11. Review the "Look For."
12. Remember to consider all road users.
13. Drive slowly through the road section and look for potential safety issues. Focus on these issues in the travel way and to the right, as the initial review will be completed when you return to the starting point.
14. Next, drive through the test section at the posted speed limit or at safe operating speed.
15. Start RSAR by resetting odometer at start point, and drive slowly, with hazard lights activated. Stop and evaluate all potential safety deficiencies, looking at the travel way and to the right. Do one direction at a time.
16. Identify potential safety deficiencies. Use the odometer reading to approximate beginning and ending points or spots of deficiency. Repeat in the opposite direction and remember to reset odometer before you start that direction.
17. Next, check access approaches on the right side of the road. Drive access into the road section noting issues needing to be corrected, sight obstructions, signing, etc. Indicate the access location using the approximate mileage on the road section identified previously. Check for both travel directions.
18. For the road classification of this section, indicate how deficiencies should be corrected: f) Leave section as it is, no improvement needed for this road section, i.e. do
nothing. g) Schedule Routine Maintenance. h) Major Reconstruction Required. i) Perform Routine Maintenance Immediately. j) Spot Improvement(s) Needed.
Have a safe trip!

81
Functional Local Rural Road Classification
Rural Major High-Speed Rural Minor Rural Local
Serves larger towns and other traffic generators not served by higher systems, links these places with nearby cities and larger towns or with higher systems, and serves more important intracounty travel corridors.
Typically: ♦ Paved surfaces ♦ Traffic volumes
400 v.p.d. ♦ Operating speed
40-65 m.p.h. ♦ Infrequent accesses
Provides access to land adjacent to the collector network and serves travel over relatively short distances.
Typically: ♦ Unpaved surfaces ♦ Traffic volumes
100-250 v.p.d. ♦ Operating speed
30-45 m.p.h.
Rural Major Medium-Speed Rural Low-volume Local
Serves larger towns and other traffic generators not served by higher systems, links these places with nearby cities and larger towns or with higher systems, and serves more important intracounty travel corridors.
Typically: ♦ Paved surfaces ♦ Traffic volumes
400 v.p.d. ♦ Operating speed
30-45m.p.h. ♦ Frequent accesses
Accumulates traffic from local roads, brings all developed areas within reasonable distances of collector roads, provides service to the remaining smaller communities, and links the locally important traffic generators within their rural region.
Typically: ♦ Unpaved surfaces ♦ Traffic volumes
250-400 v.p.d. ♦ Operating speed
40-60 m.p.h.
Provides access to land adjacent to the collector network and serves travel over relatively short distances.
Typically: ♦ Unpaved surfaces ♦ Traffic volumes
0-100 v.p.d. ♦ Operating speed variable

82
Safety Issues to LOOK FOR:
Roadside Features 34. Are clear zones free of hazards and non-traversable side slopes without safety
barriers? 35. Are the clear zones free of nonconforming and/or dangerous obstructions that are not
properly shielded?
Road Surface-Pavement Condition 36. Is the pavement free of defects that could result in safety problems (e.g., loss of
steering control)? 37. Are changes in surface type (e.g., pavement ends or begins) free of poor transitions? 38. Is the pavement free of locations that appear to have inadequate skid resistance that
could result in safety problems, particularly on curves, steep grades, and approaches to intersections?
39. Is the pavement free of areas where ponding or sheet flow of water may occur resulting in safety problems?
40. Is the pavement free of loose aggregate/gravel, which may cause safety problems?
Road Surface-Pavement Markings 41. Is the road free of locations with pavement marking safety deficiencies? 42. Is the road free of pavement markings that are not effective for the conditions
present? 43. Is the road free of old pavement markings that affect the safety of the roadway?
Road Surface-Unpaved Roads 44. Is the road surface free of defects that could result in safety problems (e.g., loss of
steering control)? 45. Is the road surface free of areas where ponding or sheet flow of water may occur
resulting in safety problems? 46. Is the road surface free of loose gravel or fines that may cause safety problems
(control, visibility, etc.)? 47. Are changes in surface type (e.g., pavement ends or begins) free of drop-offs or poor
transitions?
Signing and Delineation 48. Is the road free of locations where signing is needed to improve safety? 49. Are existing regulatory, warning, and directory signs conspicuous? 50. Is the road free of locations with improper signing which may cause safety problems? 51. Is the road free of unnecessary signing which may cause safety problems? 52. Are signs effective for existing conditions? 53. Can signs be read at a safe distance? 54. Is the road free of signing that impairs safe sight distances? 55. Is the road free of locations with improper or unsuitable delineation (post delineators,
chevrons, object markers)?

83
Intersections and Approaches 56. Are intersections free of sight restrictions that could result in safety problems? 57. Are intersections free of abrupt changes in elevation or surface condition? 58. Are advance warning signs installed when intersection traffic control cannot be seen a
safe distance ahead of the intersection?
Special Road Users, Railroad Crossings, Consistency 59. Are travel paths and crossing points for pedestrians and cyclists properly signed
and/or marked? 60. Are bus stops and mail boxes safely located with adequate clearance and visibility
from the traffic lane? 61. Is appropriate advance signing provided for bus stops and refuge areas? 62. Are railroad crossing (crossbucks) signs used on each approach at railroad crossings? 63. Are railroad advance warning signs used at railroad crossing approaches? 64. Are railroad crossings free of vegetation and other obstructions that have the potential
to restrict sight distance? 65. Are roadway approach grades to railroad crossings flat enough to prevent vehicle
snagging? 66. Is the road section free of inconsistencies that could result in safety problems?

84
Road Safety Audit Review for Local Rural Roads
Jurisdiction: _____________________________________________County
Date: ___________________________________________________
Location: ___________________________________________________
Weather: ___________________________________________________
Auditor(s): ___________________________________________________
Road Class: ___________________________________________________
Paved______ Unpaved______ Unimproved______ Speed_____
Sketch of road section:
Please include exact start and end point, north arrow, and other features as
appropriate. i.e. cattleguards, etc.
N
Overall Evaluation of Road Section, check one and/or comment:
1. Leave section as it is, no improvement needed at this road section
2. Schedule Routine Maintenance
3. Major Reconstruction Required
4. Perform Routine Maintenance Immediately
5. Spot Improvement(s) Needed
6. Comments:

85
Page____ of ____ Main Route Safety Evaluation Evaluation of Intersection/Approaches to Main Route
Direction of travel: N NW W SW S SE E NE (please circle appropriate direction)
Approx.Location
Description of concern or insert a number from the LOOK FOR
Urgency Recommended Improvement number and/or specify
Urgency, considering classification of the roadway and cost of improvements
Recommended improvement, considering classification of the roadway and cost of improvements

86
1. Leave as it is 2. No urgency, but should be addressed 3. Schedule improvement in reasonably short time 4. As soon as possible
2. Remove 2. Repair 3. Relocate 8. Replace 9. Delineate 10. Shield 11. Other, please indicate action

87
APPENDIX B – County 2 - Final Audit Results

88
Roa
d D
efic
ienc
y U
rgen
cy –
Fin
al A
udit
R
ural
Maj
or H
igh
Spee
d
DN
#
D
efic
ienc
y T
ype
Rec
Imp
U
rgen
cy
U
rgen
cy o
f 3 &
4
Urg
ency
of 2
& 3
U
rgen
cy 4
Onl
y
CG
R
E
VE
R
S
CG
R
E
VE
R
S
CG
R
E
VE
R
V
RS
C
G
RE
V
E
RV
R
S
CG
R
E
VE
R
V
RS
17
1 E
dge
Def
initi
on
5
2 3
1
1
1
19
1
Edg
e D
efin
ition
5
2
1
3 1
Ste
ep S
ide
Slo
pe
5 2
1
2 2
2
1
1 1
1
16
1
Ste
ep S
ide
Slo
pe
5 2
5
2 2
2
1
1
1 1
25
2
Ditc
h E
rrod
ing
Into
Sho
ulde
r
2 1
2
3 3
3
4 2
Dra
inag
e P
ipe
End
Blu
nt
4
1 4
1 3
3 3
11
2
Mai
lbox
Sup
port
1
18
2 M
ailb
ox T
reat
men
t 1
1
1
3
9 2
Mai
lbox
es L
ocat
ion
3
3
1
1
14
2
Mai
lbox
es L
ocat
ion
3
3
1
1
10
2
Pow
er P
oles
1
6 2
Tre
es
20
15
S
top
Sig
n M
issi
ng
4
2
1
1
17
Cur
ve S
ign
Clo
se
3
2
1
13
17
C
urve
Sig
n C
lose
3
2
2
1
8 23
B
lind
Inte
rsec
tion
4
2
2
3
1
1
22
23
B
lock
ed B
y F
ence
1
2
4
3
1
1
1
1
1
1
23
24
Driv
eway
Poo
rly D
esig
n
4
2
1
1
1
1
1
1
12
33
Alig
nmen
t PP
vs
RW
4
2
3
1
1
15
33
Cur
ve S
peed
Sig
ns
4
2
1
21
33
D
rivew
ay P
oorly
Loc
ated
4
1
1
24
33
Fie
ld A
cces
s A
ppro
ache
s
2
3
3
3
7 33
N
on-S
td. S
peed
Sig
n 4
3
1
1
2 33
R
oad
Nar
row
s 5
5 5
2
2 2
1 1
1 1
5 33
R
oad
X-S
ectio
n 5
2
1
1 1
1
Tot
al Id
entif
ied
Urg
enci
es
22
10
5 5
7 1
1 2
15
5
2 5
2 3
1 1
2
Tot
al R
ecom
men
ded
Impr
ovem
ents
17
9
5 5
N
otes
:
CG
- C
ontr
ol G
roup
; RE
- R
esid
ent E
ngin
eer;
VE
- V
isiti
ng E
ngin
eer;
RV
- C
ombi
ned
resu
lts o
f RE
& V
E; R
S -
Tea
m o
f Sup
erin
tend
ents
R
ecom
men
ded
Impr
ovem
ents
: 6
- O
ther
; 5 -
Shi
eld;
4 -
Del
inea
te; 3
- R
eloc
ate;
2 -
Rep
air;
1 -
Rem
ove
Urg
ency
: 4
- M
ajor
Rec
onst
ruct
ion;
3 -
Inte
rmed
iate
Impr
ovem
ents
; 2 -
Rou
tine
Mai
nten
ance
; 1 -
Lea
ve a
s is

89
Urgency of Deficiency Major
ReconstructionIntermediate
Safety Improvements
Routine Maintenance
Leave deficiency
as it is
Rural Major High-speed
ET
TE
RE
VE
RS
ET
TE
RE
VE
RS
ET
TE
RE
VE
RS
ET
TE
RE
VE
RS
Roadside Features 0 0 0 0 0 2 3 3 1 1 4 2 2 1 1 5 0 0 0 0 Pavement Condition 0 0 0 0 0 0 0 0 0 0 0 0 0 0 0 0 0 0 0 0 Pavement Marking 0 0 0 0 0 0 0 0 0 0 0 0 0 0 0 0 0 0 0 0 Unpaved Roads na na na na na na na na na na na na na na na na na na na na Signing & Delineation 0 0 0 0 0 0 0 0 0 0 3 0 0 0 0 0 0 0 0 0 Intersections & Approaches
2 0 0 0 0 0 1 1 0 1 1 1 1 0 0 0 0 0 0 0
Special Users, RR & Cons.
1 0 0 0 0 2 0 0 0 0 3 1 1 1 0 0 1 1 0 0

90
Roa
d D
efic
ienc
y U
rgen
cy –
Fin
al A
udit
Rur
al M
ajor
Med
ium
Spe
ed
D
N
#
Def
icie
ncy
Typ
e R
ec Im
p
Urg
ency
Urg
ency
of 3
& 4
U
rgen
cy o
f 2 &
3
Urg
ency
4 O
nly
C
G
RE
V
E
RS
C
G
RE
V
E
RS
C
G
RE
V
E
RV
R
S
CG
R
E
VE
R
V
RS
C
G
RE
V
E
RV
R
S
11
1 E
rosi
on O
n E
dge
2 2
2 2
2 3
3 2
1
1 1
1 1
10
1
Gua
rd R
ail S
hort
2
6
1
3
13
1 G
uard
Rai
l Sho
rt
2 6
1 3
4
1 S
teep
Sid
eslo
pe
2
2
3
3
8
1 S
teep
Sid
eslo
pe
3 2
2 3
1
1
1
16
1
Ste
ep S
ides
lope
4
2
2
3
1 1
1
17
2 D
rain
age
Sho
rt
2
2
3
3
7
2 U
tility
Nea
r S
houl
der
3
3
3
8 N
o S
idel
ine
- R
oad
Nar
row
s
4
4
3
2
20
8 R
R M
arki
ng
9
15
Cur
ve S
ign
4
3
12
15
G
ener
al W
indi
ng R
oad
Sig
n 4
2
1
15
15
No
Sto
p S
ign
4
4
6
16
Spe
ed L
imit
Sig
n Lo
w
18
17
N
on-S
td. S
pd. L
imit
Sig
n
1
21
17
RR
Sig
n Lo
w
14
17
S
peed
Lim
it W
rong
3
2
1
2 17
Y
ield
Sig
n
4
4
5 22
D
elin
eato
rs D
own
2 5
1 5
3 2
3 2
1 1
1 1
1 1
1 1
1 1
19
24
A
cces
s R
oad
2
3
1
32
Rou
gh C
ross
ing
1
3
Tot
al Id
entif
ied
Urg
enci
es
9 11
5
6 1
1 1
1 1
6 4
2 4
2
Tot
al R
ecom
men
ded
Impr
ovem
ents
8
11
5 6
N
otes
:
CG
- C
ontr
ol G
roup
; RE
- R
esid
ent E
ngin
eer;
VE
- V
isiti
ng E
ngin
eer;
RV
- C
ombi
ned
resu
lts o
f RE
& V
E; R
S -
Tea
m o
f Sup
erin
tend
ents
R
ecom
men
ded
Impr
ovem
ents
: 6
- O
ther
; 5 -
Shi
eld;
4 -
Del
inea
te; 3
- R
eloc
ate;
2 -
Rep
air;
1 -
Rem
ove
Urg
ency
: 4
- M
ajor
Rec
onst
ruct
ion;
3 -
Inte
rmed
iate
Impr
ovem
ents
; 2 -
Rou
tine
Mai
nten
ance
; 1 -
Lea
ve a
s is

91
Urgency of Deficiency Major
ReconstructionIntermediate
Safety Improvements
Routine Maintenance
Leave deficiency
as it is Rural Major Med.-speed
ET
TE
RE
VE
RS
ET
TE
RE
VE
RS
ET
TE
RE
VE
RS
ET
TE
RE
VE
RS
Roadside Features 0 0 0 0 0 0 6 6 2 0 3 0 0 0 1 3 0 0 0 1 Pavement Condition 0 0 0 0 0 0 0 0 0 0 0 0 0 0 0 0 0 0 0 0 Pavement Marking 0 0 0 0 0 0 0 0 0 0 0 0 0 0 0 0 0 0 0 0 Unpaved Roads na na na na na na na na na na na na na na na na na na na na Signing & Delineation 0 0 0 0 0 1 1 0 1 0 2 0 1 0 1 3 0 0 0 0 Intersections & Approaches
0 0 0 0 0 0 0 0 0 0 0 0 0 0 0 0 0 0 0 0
Special Users, RR & Cons.
0 0 0 0 0 0 0 0 0 0 0 0 0 0 0 1 0 0 0 0

92
Roa
d D
efic
ienc
y U
rgen
cy –
Fin
al A
udit
R
ural
Min
or
D
N
#
Def
icie
ncy
Typ
e R
ec Im
p
Urg
ency
Urg
ency
of 3
& 4
U
rgen
cy o
f 2 &
3
Urg
ency
4 O
nly
C
G
RE
V
E
RS
C
G
RE
V
E
RS
C
G
RE
V
E
RV
R
S
CG
R
E
VE
R
V
RS
C
G
RE
V
E
RV
R
S
8 2
Cul
vert
Blu
nt E
nd
5
1 3
9
2 C
ulve
rt B
lunt
End
5
1
3
10
2 C
ulve
rt B
lunt
End
1
3 2
Ditc
h X
-Sec
tion
2
2
2
2 2
1
1
1 1
7
2 D
itch
X-S
ectio
n 2
2
1
6 2
Hol
e O
n S
ide
Of R
oad
5
4
1
1
13
2
Hol
e O
n S
ide
Of R
oad
5 2
4 4
1 1
1
1 1
1
15
2
Ste
ep/D
eep
Gra
vel P
it 5
6 1
4
1 4
1
1 1
1
1
1 1
1
12
2 S
teep
/Dee
p S
ide
Slo
pe
5 5
2
4 3
3
1 1
1
1
1 1
1
1 2
11
Was
hboa
rd
1
4
11
17
U
nmar
ked
Inte
rsec
tion
2 4
3 2
1
23
Gra
vel P
it I.S
. Nar
row
2
3
5 23
S
ight
Res
tric
tion
1
2
14
23
S
ight
Res
tric
tion
1
Tot
al Id
entif
ied
Urg
enci
es
10
6 5
3 4
3 1
3 1
2
1 1
1 4
3 1
3 1
Tot
al R
ecom
men
ded
Impr
ovem
ents
6
6 5
2
N
otes
:
CG
- C
ontr
ol G
roup
; RE
- R
esid
ent E
ngin
eer;
VE
- V
isiti
ng E
ngin
eer;
RV
- C
ombi
ned
resu
lts o
f RE
& V
E; R
S -
Tea
m o
f Sup
erin
tend
ents
R
ecom
men
ded
Impr
ovem
ents
: 6
- O
ther
; 5 -
Shi
eld;
4 -
Del
inea
te; 3
- R
eloc
ate;
2 -
Rep
air;
1 -
Rem
ove
Urg
ency
: 4
- M
ajor
Rec
onst
ruct
ion;
3 -
Inte
rmed
iate
Impr
ovem
ents
; 2 -
Rou
tine
Mai
nten
ance
; 1 -
Lea
ve a
s is

93
Urgency of Deficiency MajorRe-
construction
Intermediate Safety
Improvements
Routine Maintenance
Leave deficiency
as it is
Rural Minor ET
TE
RE
VE
RS
ET
TE
RE
VE
RS
ET
TE
RE
VE
RS
ET
TE
RE
VE
RS
Roadside Features 4 2 1 1 0 0 3 3 0 1 2 1 0 1 1 4 1 1 0 0 Pavement Condition 0 0 0 0 0 0 0 0 0 0 0 0 0 0 0 0 0 0 0 0 Pavement Marking 0 0 0 0 0 0 0 0 0 0 0 0 0 0 0 0 0 0 0 0 Unpaved Roads 0 0 0 0 0 0 0 0 0 0 0 0 0 0 0 0 0 0 0 0 Signing & Delineation 0 0 0 0 0 0 0 0 0 0 0 0 0 0 0 0 0 0 0 0 Intersections & Approaches
0 0 0 0 0 0 0 0 0 0 0 0 0 0 0 2 1 0 1 1
Special Users, RR & Cons.
0 0 0 0 0 0 0 0 0 0 0 0 0 0 0 0 0 0 0 0

94
Roa
d D
efic
ienc
y U
rgen
cy –
Fin
al A
udit
R
ural
Loc
al
D
N
#
Def
icie
ncy
Typ
e R
ec Im
p
Urg
ency
Urg
ency
of 3
& 4
U
rgen
cy o
f 2 &
3
Urg
ency
4 O
nly
C
G
RE
V
E
RS
C
G
RE
V
E
RS
C
G
RE
V
E
RV
R
S
CG
R
E
VE
R
V
RS
C
G
RE
V
E
RV
R
S
2 1
Ste
ep D
rop
Off
1
7
2 S
uppo
rt P
ole
3
8
2 U
tility
Pol
e
3
1 11
W
ashb
oard
2
3
10
12
Bui
ld U
p R
oad
2
2
11
15
E
nd o
f Cou
nty
Roa
d
4
3
9 15
M
issi
ng S
top
Sig
n
3 33
I
rrig
atio
n C
ross
ing
Nar
row
4
3
3
4
6 33
I
rrig
atio
n C
ross
ing
Nar
row
4
3
3
4
5 33
N
arro
w S
ectio
n
4 1
3 3
Tot
al Id
entif
ied
Urg
enci
es
4
3 3
Tot
al R
ecom
men
ded
Impr
ovem
ents
3 3
5
N
otes
:
CG
- C
ontr
ol G
roup
; RE
- R
esid
ent E
ngin
eer;
VE
- V
isiti
ng E
ngin
eer;
RV
- C
ombi
ned
resu
lts o
f RE
& V
E; R
S -
Tea
m o
f Sup
erin
tend
ents
R
ecom
men
ded
Impr
ovem
ents
: 6
- O
ther
; 5 -
Shi
eld;
4 -
Del
inea
te; 3
- R
eloc
ate;
2 -
Rep
air;
1 -
Rem
ove
Urg
ency
: 4
- M
ajor
Rec
onst
ruct
ion;
3 -
Inte
rmed
iate
Impr
ovem
ents
; 2 -
Rou
tine
Mai
nten
ance
; 1 -
Lea
ve a
s is

95
Roa
d D
efic
ienc
y U
rgen
cy –
Fin
al A
udit
R
ural
Low
-Vol
ume
D
N
#
Def
icie
ncy
Typ
e R
ec Im
p
Urg
ency
Urg
ency
of 3
& 4
U
rgen
cy o
f 2 &
3
Urg
ency
4 O
nly
C
G
RE
V
E
RS
C
G
RE
V
E
RS
C
G
RE
V
E
RV
R
S
CG
R
E
VE
R
V
RS
C
G
RE
V
E
RV
R
S
1 1
Dee
p D
itch
1
6
1 S
teep
Sid
e S
lope
1
1
1
8 1
Ste
ep S
ide
Slo
pe
1
7
2 P
ower
Pol
es
1
4
2 R
ocks
1
2
1
5 2
Sig
ht R
estr
ictio
n
1
3 15
N
o E
nd O
f Roa
d S
ign
4
1
3
2
23
Ver
t/Hor
Alig
nmen
t
1
9 24
S
teep
App
roac
h S
ide
Slo
pe
1
Tot
al Id
entif
ied
Urg
enci
es
9 1
1
1
Tot
al R
ecom
men
ded
Impr
ovem
ents
1
1 1
N
otes
:
CG
- C
ontr
ol G
roup
; RE
- R
esid
ent E
ngin
eer;
VE
- V
isiti
ng E
ngin
eer;
RV
- C
ombi
ned
resu
lts o
f RE
& V
E; R
S -
Tea
m o
f Sup
erin
tend
ents
R
ecom
men
ded
Impr
ovem
ents
: 6
- O
ther
; 5 -
Shi
eld;
4 -
Del
inea
te; 3
- R
eloc
ate;
2 -
Rep
air;
1 -
Rem
ove
Urg
ency
: 4
- M
ajor
Rec
onst
ruct
ion;
3 -
Inte
rmed
iate
Impr
ovem
ents
; 2 -
Rou
tine
Mai
nten
ance
; 1 -
Lea
ve a
s is

96
Urgency of Deficiency Major
ReconstructionIntermediate
Safety Improvements
Routine Maintenance
Leave deficiency as it is
Rural Low-volume Local
ET
TE
RE
VE
RS
ET
TE
RE
VE
RS
ET
TE
RE
VE
RS
ET
TE
RE
VE
RS
Roadside Features 0 0 0 0 0 0 0 0 0 0 1 0 0 0 0 5 1 1 0 3 Pavement Condition 0 0 0 0 0 0 0 0 0 0 0 0 0 0 0 0 0 0 0 0 Pavement Marking 0 0 0 0 0 0 0 0 0 0 0 0 0 0 0 0 0 0 0 0 Unpaved Roads 0 0 0 0 0 0 0 0 0 0 0 0 0 0 0 0 0 0 0 0 Signing & Delineation 0 0 0 0 0 0 0 0 1 0 0 0 0 0 0 1 0 0 0 0 Intersections & Approaches
0 0 0 0 0 0 0 0 0 0 0 0 0 0 0 2 0 0 0 0
Special Users, RR & Cons.
0 0 0 0 0 0 0 0 0 0 0 0 0 0 0 0 0 0 0 0

97
APPENDIX C – Trial Audit Results

98
Roa
d D
efic
ienc
y Se
veri
ties
2 &
3 S
umm
ary–
Tri
al A
udit
Con
trol
G
roup
T
eam
of
Eng
inee
rs
Vis
itin
g E
ngin
eer
R
esid
ent
Eng
inee
r
Tea
m o
f
Supe
rint
ende
nts
AV
ER
AG
E
Rur
al P
rim
ary
1613
(81
%)
12 (
75%
) 4
(25%
) 2
(13%
) 7.
8 (4
8%)
Rur
al S
econ
dary
14
11 (
79%
) 10
(71
%)
7 (5
0%)
07.
0 (5
0%)
Rur
al L
ocal
4
3 (7
5%)
3 (7
5%)
2 (5
0%)
02.
0 (5
0%)
Rur
al L
ow-V
olum
e L
ocal
2
1 (5
0%)
1 (5
0%)
1 (5
0%)
0.8
(38
%)
Tot
al C
ount
y 1
3628
(78
%)
26 (
72%
) 14
(39
%)
2 (6
%)
17.5
(49
%)
Not
es:
1).
Roa
d D
efic
ienc
y Se
veri
ty is
mea
sure
d in
term
s of
the
pres
umed
con
sequ
ence
s of
a c
rash
as
a re
sult
of th
e de
fici
ency
. Se
veri
ty is
m
easu
red
as: 1
– m
inor
acc
iden
t, 2-
ser
ious
acc
iden
t, 3-
fat
al a
ccid
ent.
Onl
y de
fici
enci
es id
entif
ied
by th
e co
ntro
l gro
up a
s se
veri
ty 2
or
3 ap
pear
in th
is ta
ble.
2)
.
Seve
rity
, as
used
in th
is ta
ble
(Tri
al A
udit)
, was
con
side
red
very
sub
ject
ive
and
was
mod
ifie
d to
mea
sure
urg
ency
in th
e Fi
nal
Aud
it. C
ompa
rativ
e an
alys
es u
sing
urg
ency
are
pre
sent
ed la
ter
in th
is c
hapt
er.

99
Summary of Results from Field RSAR in County I for the Rural Primary Roadway Classification
Jurisdiction: County I Road Class: Rural Primary CG = Control Group
VE = Visiting Engineer
RE = Resident Engineer
RS = Team of Superintendents
Included in this table are the results from the control group and all the deficiencies identified by all participants of this study. The deficiencies identified by the other groups, but not by the control group, are not included in the analysis for this research.
Under Deficiencies Identified by:1 means identified, 0 means not identified Under Severity:1 means minor accident, 2 means serious accident, 3 means fatal accident, * means no data Under Recommended Improvements:1 means remove, 2 means repair, 3 means relocate, 4 means delineate, 5 means shield, 6 means other, * means no data
Deficiency Identified by:
Severity Recommended Improvements
Def. # Deficiency Type
CG VE RE RS CG VE RE RS CG
VE RE RS
1 1-side slope 1 1 1 1 2 1 2 2 * 2 * 2 2 25 constr.area 1 1 0 0 2 1 * * 3 5 * * 3 2-rocks 1 1 0 0 1 1 * * 1 1 * * 4* 25-access 0 1 0 0 * 1 * * * 7 * * 6 24-non transv. 1 0 0 0 2 * * * * * * * 7 9-lack of p.mark. 1 1 1 0 2 2 2 * 4 4 1 * 8 1-fence down 1 0 0 0 2 * * * 2 * * * 9 22-bad delin.brid 1 0 0 0 1 * * * 4 * * * 10 2-guardrail end 1 1 0 0 2 2 * * * 4 * * 11 2-bridgerail 1 1 0 0 2 2 * * * 4 * * 12 2-guardrail/bridge 1 1 0 0 2 2 * * * 4 * * 13 2-guardrail low 1 1 0 0 2 2 * * * 4 * * 14 23-bad sight dist. 1 1 0 1 2 2 * 2 * 1 * 1 15 4- pavement end 1 1 0 0 1 1 * * 2 2 * * 16* 19-roadname sign 0 1 0 0 * 1 * * * 4 * * 17 19-speedsign high 1 0 0 0 1 * * * * * * * 18 2-mailboxes 1 1 1 0 2 2 1 * 3 3 * * 19 22-poor
conditions1 1 0 0 2 2 * * 2 2 * *
20 2-mailboxes 1 1 0 0 2 2 * * 3 3 * *

100
Summary of Results from Field RSAR in County I for the Rural Primary Roadway Classification (Cont.)
21 23-vegetation 1 1 0 0 2 2 * * 1 1 * * 22 3-workz. utility-
cut 1 0 0 1 1 * * * 2 * * 2
23 2-rocks in c.z. 1 0 1 0 *2 * 2 * 1 * 6 * 24* 2-utility platform 0 1 0 0 * 3 * * * 6 * * 25 23-visiability n.b. 1 0 0 0 2 * * * 5 * * * 26 2-non-br.away
lam. 1 0 0 0 1 * * * 4 * * *
27 1-unnec.fence post
1 0 0 0 1 * * * 1 * * *
Summary Data CG VE RE RS Found Deficiencies = 23 17 4 3
*These deficiencies were identified by the groups and not identified by the control group as needed safety improvements. Considering the severity issues most of these deficiencies were identified by the other groups as minor accident.
Severity of Deficiency 3--Fatality likely 2--Serious injury 1--Minor damage
Rural Primary ET
TE
VE
RE
RS
ET
TE
VE
RE
RS
ET
TE
VE
RE
RS
Roadside Features 0 0 0 0 0 9 8 6 2 1 3 1 2 1 0 Pavement Condition 0 0 0 0 0 0 0 0 0 0 2 1 1 0 1 Pavement Marking 0 0 0 0 0 1 1 1 1 0 0 0 0 0 0 Unpaved Roads na na na na na na na na na na na na na na na Signing & Delineation 0 0 0 0 0 1 1 1 0 0 2 0 0 0 0 Intersections & Approaches 0 0 0 0 0 5 2 2 0 1 0 1 1 0 0 Special Users, RR & Cons. 0 0 0 0 0 0 0 0 0 0 0 0 0 0 0

101
Summary of Results from Field RSAR in County I for the Rural Secondary Roadway Classification
Jurisdiction: County I Road Class: Rural Secondary
CG = Control Group
VE = Visiting Engineer
RE = Resident Engineer
Included in this table are the results from the control group and all the deficiencies identified by all participants of this study. The deficiencies identified by the other groups, but not by the control group, are not included in the analysis for this research.
RS = Team of Superintendents
Under Deficiencies Identified by:1 means identified, 0 means not identified Under Severity:1 means minor accident, 2 means serious accident, 3 means fatal accident, * means no data Under Recommended Improvements:1 means remove, 2 means repair, 3 means relocate, 4 means delineate, 5 means shield, 6 means other, * means no data
Deficiency Identified by:
Severity Recommended Improvements if any
Deficiency # Deficiency Type
CG VE RE RS CG
VE RE RS CG VE
RE RS
1* 33-road narrow
0 1 1 0 * 1 1 * * * 4 *
2 17-bike sign 1 0 0 0 3 * * * * * * * 3 1-side slope 1 1 1 1 * 2 2 * * * 2 2 4 8-pm poor 1 1 1 1 3 2 * * 2 2 2 2 5* 2-tresp.sign 0 0 0 0 * * * * * * * * 6 24-slope/pipe 1 1 1 0 3 1 2 * * * 2 * 7* 2-ditch
erosion0 0 1 1 * * 2 * * * 2 2
8 2-blind curve 1 1 0 0 3 3 * * 5 * * * 9* 2-
construction0 1 0 0 * 1 * * * * * *
10 2-ditch/cr.sec 1 1 1 0 3 1 2 * * * 4 * 11 16-curve sign 1 0 1 1 3 * 2 * 4 * 4 4 12 1-curve delin 1 1 1 1 3 2 1 * 5 5 5 5 13 2-x.section 1 1 0 0 2 1 * * * * * * 14 15-
haz.marking 1 0 0 0 2 * * * * * * *

102
Summary of Results from Field RSAR in County I for the Rural Secondary Roadway Classification (Cont.)
15 2-steep ravine 1 1 0 0 3 1 * * * * * * 16 2-
x.sect.access 1 1 1 0 3 1 1 * * 2 2 *
17 2-steep side sl.
1 1 1 1 3 1 2 * * * 2 2
18 2-culvert end 1 1 0 0 3 * * * * 2 * * 19 22-curve
design 1 1 1 0 3 3 2 * 5 5 5 *
20* 16-no speedl.sb
0 0 0 1 * * * * * * * 4
Summary Data CG
VE
RE
RS
Found Deficiencies = 15 14 11 7
*These deficiencies were identified by the groups and not identified by the control group as needed safety improvements. Considering the severity issues most of these deficiencies were identified by the other groups as minor accident or without severity.
Severity of Deficiency 3--Fatality likely 2--Serious injury 1--Minor damage
Rural Secondary ET
TE
VE
RE
RS
ET
TE
VE
RE
RS
ET
TE
VE
RE
RS
Roadside Features 7 1 1 0 0 1 4 2 3 0 1 3 5 2 0 Pavement Condition 0 0 0 0 0 0 0 0 0 0 0 0 0 0 0 Pavement Marking 1 0 0 0 0 0 1 1 0 0 0 0 0 0 0 Unpaved Roads na na na na na na na na na na na na na na na Signing & Delineation 3 1 1 0 0 1 1 0 1 0 0 0 0 0 0 Intersections & Approaches 1 0 0 0 0 0 1 0 1 0 0 1 1 0 0 Special Users, RR & Cons. 0 0 0 0 0 0 0 0 0 0 0 0 0 0 0

103
Summary of Results from Field RSAR in County I for the Rural Local Roadway Classification
Jurisdiction: County I Road Class: Rural Local CG = Control Group
VE = Visiting Engineer
RE = Resident Engineer
RS = Team of Superintendents
Included in this table are the results from the control group and all the deficiencies identified by all participants of this study. The deficiencies identified by the other groups, but not by the control group, are not included in the analysis for this research.
Under Deficiencies Identified by: 1 means identified, 0 means not identified Under Severity: 1 means minor accident, 2 means serious accident, 3 means fatal accident, * means no data Under Recommended Improvements: 1 means remove, 2 means repair, 3 means relocate, 4 means delineate, 5 means shield, 6 means other, * means no data
Deficiency Identified by:
Severity Recommended Improvements
Deficiency # Deficiency Type
CG VE RE RS CG VE RE RS CG VE RE RS 1 11-washboard 1 1 1 1 2 1 2 * 1 * 1 1 2 2-utility nb 1 0 0 0 1 * * * 3 * * * 3 2-ditch 1 1 1 0 2 2 2 * 6 4 4 * 4 17-stop sign 1 1 0 0 2 3 * * 4 4 * * 5 33- expect. 1 0 0 0 2 * * * 4 * * * 6 2-street sign 1 0 0 0 1 * * * 2 * * * 7* 13-soft spots 0 0 1 0 * * 2 * 2 * * *
Summary Data CG VE RE RS Found Deficiencies = 6 3 3 1 *This deficiency was identified by the resident engineer and not identified by the control group as a needed safety improvement. Considering the severity issues this deficiency was identified by the engineer as serious accident.
Severity of Deficiency 3--Fatality likely 2--Serious injury 1--Minor damage
Rural Local ET
TE
VE
RE
RS
ET
TE
VE
RE
RS
ET
TE
VE
RE
RS
Roadside Features 0 0 0 0 0 1 1 1 1 0 2 0 0 0 0 Pavement Condition 0 0 0 0 0 1 0 0 0 0 0 0 0 0 0 Pavement Marking na na na na na na na na na na na na na na na Unpaved Roads 0 0 0 0 0 1 1 0 1 0 0 1 1 0 0 Signing & Delineation 0 1 1 0 0 1 0 0 0 0 0 0 0 0 0 Intersections & Approaches 0 0 0 0 0 0 0 0 0 0 0 0 0 0 0 Special Users, RR & Cons. 0 0 0 0 0 0 0 0 0 0 0 0 0 0 0
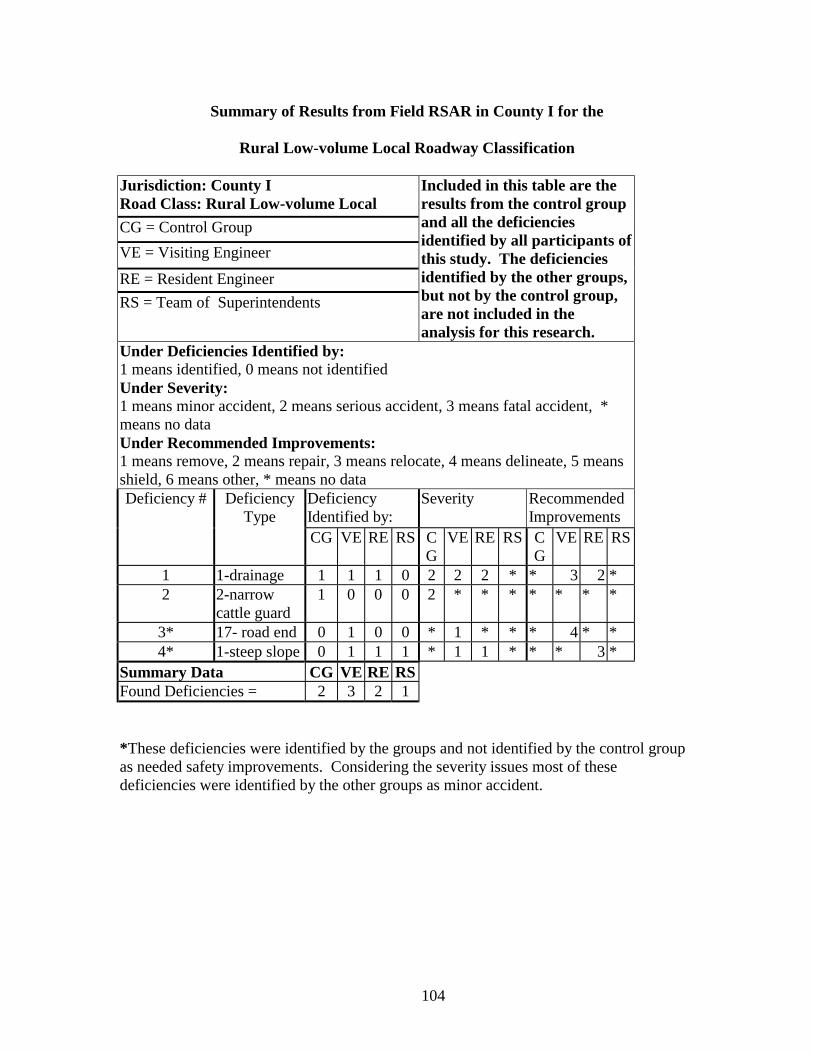
104
Summary of Results from Field RSAR in County I for the
Rural Low-volume Local Roadway Classification
Jurisdiction: County I Road Class: Rural Low-volume Local
CG = Control Group
VE = Visiting Engineer
RE = Resident Engineer
RS = Team of Superintendents
Included in this table are the results from the control group and all the deficiencies identified by all participants of this study. The deficiencies identified by the other groups, but not by the control group, are not included in the analysis for this research.
Under Deficiencies Identified by:1 means identified, 0 means not identified Under Severity:1 means minor accident, 2 means serious accident, 3 means fatal accident, * means no data Under Recommended Improvements:1 means remove, 2 means repair, 3 means relocate, 4 means delineate, 5 means shield, 6 means other, * means no data
Deficiency Identified by:
Severity Recommended Improvements
Deficiency # Deficiency Type
CG VE RE RS CG
VE RE RS CG
VE RE RS
1 1-drainage 1 1 1 0 2 2 2 * * 3 2 * 2 2-narrow
cattle guard 1 0 0 0 2 * * * * * * *
3* 17- road end 0 1 0 0 * 1 * * * 4 * * 4* 1-steep slope 0 1 1 1 * 1 1 * * * 3 *
Summary Data CG VE RE RS Found Deficiencies = 2 3 2 1
*These deficiencies were identified by the groups and not identified by the control group as needed safety improvements. Considering the severity issues most of these deficiencies were identified by the other groups as minor accident.

105
APPENDIX D – Control Group Audit Reports

106
Final Audit – County 2 Control Group Report

107

108
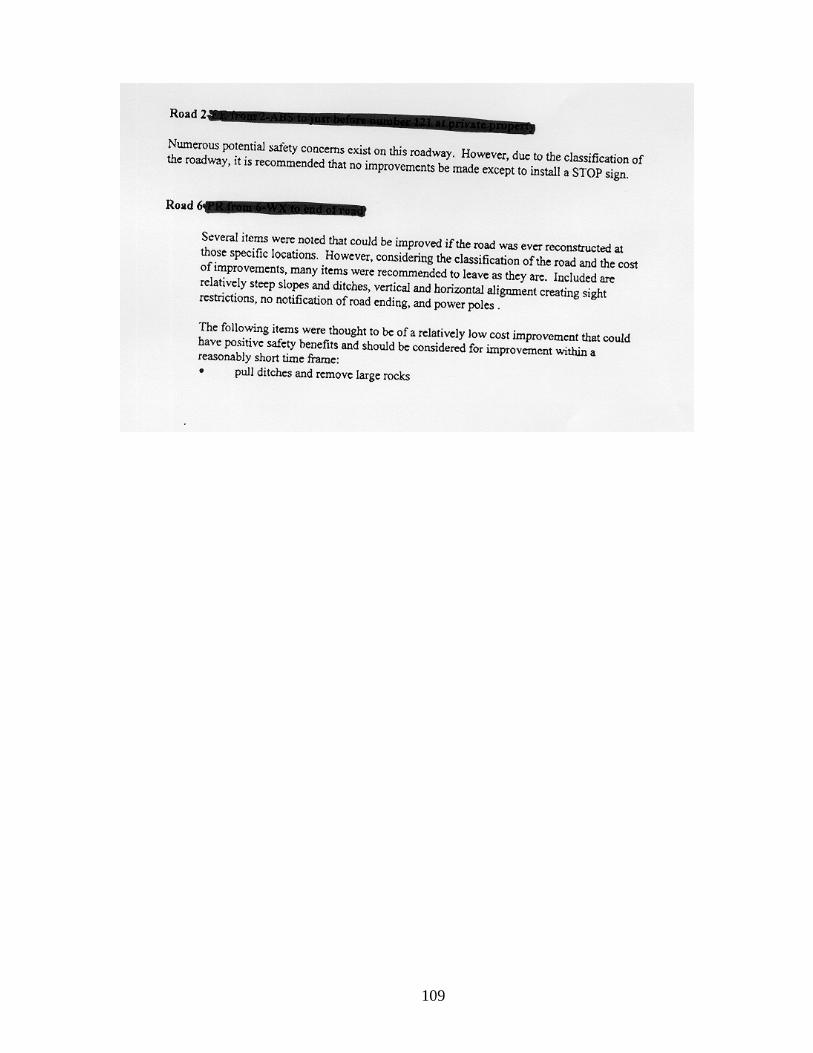
109

110
Trial Audit – County 1 Control Group Report

111

112

113
114

115
APPENDIX E – Engineer and Superintendent Audit Reports

116
Engineer Audit Reports
County I, Rural Primary (This is only the part of the report which reflect the Rural Primary Classification)
At the request of …………………………….. Road & bridge Supervisor, and ………………………. I completed a Safety Audit Review (SAR) on October 6, 1999 of several of ………….. County’s roads. The following is a summary and recommended improvements to be made based on this review.
First, it should be noted that this review is only of a few select ………………. County Roads and is not indicative of all of ………….. County Roads. The roads where selected based on the Functional classification of the road, as described in the attached table:
…….. Drive, from ………….. Avenue to end of County Road past ………. Drive
………. Drive from …………Avenue to end of County Road past ……… Drive
Recommended Improvements:
1. Construction area signage and control 2. Improve side slopes and drainage. 3. Remove bushes, mailboxes, fences, power poles and other obstructions
from R.O.W. 4. Striping – either remove or eliminate centerline striping.
County I, Rural Secondary (This is only the part of the report which reflect the Rural Secondary Classification)
Ninth Street, from north City limits, at the cattleguard, north six miles to MP 8.
Recommended Improvements
1. Curve at MP 4.8 to MP 5.1 – There have been several accidents with injuries at this location..
- Improve the side slopes to allow for recovery if a vehicle misses the curve.
- Install chevrons and advance warning signs to warn drivers of hazard.
2. Improve side slopes and drainage. Improve drainage and repair erosion damage.
3. Striping – either remove or eliminate centerline striping. 4. Improve access control – side slopes, radii and culverts

117
County I, Rural Local
(This is only the part of the report which reflect the Rural Local Classification)
Functional Classification: Rural Local Street
This is a gravel road with an ADT of 424. There were two deficiencies noted, but they were considered minor, and no immediate corrective action needs to be taken. They will be corrected as part of routine maintenance.
Functional Classification: Rural Local
This is a gravel road which connects …………… with ………….. There were four deficiencies noted, but only one needs to be covered in this report. The road is rough and needs to be bladed. This will be accomplished as part of routine maintenance. The full report from the Team of Superintendents is contained in Appendix B-1-b
County I, Rural Low-volume Local (This is only the part of the report which reflect the Rural Low-volume Local Classification)
County Road from ………….. South 1.1 miles to the end of County Maintenance.
Recommended Improvements:
1. Extend culverts for irrigation crossings from the edge of R.O.W. to the edge of the R.O.W.
2. Mark end of county road.
County II, Rural Major High-speed (This is only the part of the report which reflect the Rural Major High-speed Classification)
Rural Major High Speed
End of new construction. Road Narrows without warning.
Steep in slopes on new construction.
Irrigation ditches extend into clear zone.
Install Narrow Toad sign as soon as possible.
Improve side slope as time and money allow.
Extend pipe to the edge of the right of way.

118
County II, Rural Major Medium-speed (This is only the part of the report which reflect the Rural Major Medium-speed Classification)
Rural Major Medium Speed
Road narrows about half way through the section.
Delineators missing or not up to standards.
Holes in shoulders.
Install sign to warn motorist about narrow roadway as soon as possible.
Bring delineators up to standard or eliminate.
Blade shoulders to insure smooth pavement transition from shoulder.
County II, Rural Minor (This is only the part of the report which reflect the Rural Minor Classification)
Rural Minor Washboard surface.
Steep in slopes.
No sign at T junction on North end of road.
Bad new approach.
Insufficient sight distance on corner.
Gravel pit next to road.
Blade road immediately.
Lessen in slopes with maintainer when time and money allow.
Install stop sign as soon as possible.
Make approach installer, Lessen side slopes and make better ratios. Daylight corner or sign when time and money allow.
Work with landowner to keep any further excavation away from clear zone.

119
County II, Rural Local (This is only the part of the report which reflect the Rural Local Classification)
Rural Local Wash board surface.
Horizontal and vertical site distance very limited.
End or road.
Blade road immediately.
Install a “Narrow Winding Road with Limited Site Distance” sign.
Due to the local nature of the road and the high cost to improve, install a sign.
Rural Low-volume Local (This is only the part of the report which reflect the Rural Low-volume Local Classification)
Rural Low-Volume local Excellent local, low volume road.
I wish we had some like this in our County.

120
Superintendents Audit Reports (The reports from the superintendents are in general not classification specific so the entire report from all the participants will follow.)
Superintendent I
Dear …………………………..
First of all I would like to thank you for asking me to be a part of the Safety Audit Team.
It gave me a chance to view roads in there counties with a team of professionals not only to look at safety concerns, but also to compare roads in ………… County to other county roads. Also, I was able to visit with my counterparts and discuss our concerns.
When we upgrade a road I feel it would be very beneficial to have a professional team conduct a safety audit to assist me with setting priorities and prepare plans for the Board of Commissioners.
County II:
County has similar problems as we do in ……… County. The main item is with utilities in the right of way along with private fences, irrigation ditches and large trees. Some approaches on various properties were established before standards were set in the county. They have done a very good job on the newly constructed and road upgrades and they should be proud of their accomplishments.
County I:
Again, the same situation as ………. County II, utilities and privates fences are within the right of way. Additionally, some industries have built on or near the edge of the right of way. Also, it appears that an upgrade on signing and delineation needs to be done in some areas. This is something that needs to be looked at closely because it is very expensive and very expensive to maintain. Overall, their roads are well maintained.
If the County’s decide that Road Safety Audits should continue, I would appreciate a chance to participate.
Thanks again.
Sincerely, Road supervisor.

121
Superintendent II
TO WHOM IT MAY CONVERN - COUNTY II
UPON COMPLETION OF OUR ROAD SAFETY AUDIT IN YOUR COUNTY, WE HAVE LISTED SOME OF THE FOLLOWING CONCERNS WE HAVE ENCOUNTERED. WE UNDERSTAND THAT DUE TO BUDGET RESTRAINTS AND MANPOWER, SOME OF THE ISSUES MAY NOT BE ABLE TO BE ADRESSED UTINL FUTURE DATE.
RURAL LOCAL ON COUNTY ROAD: WE FOUND THAT THE ROW WAS LIMITED DUE TO THE IMPROPER INSTALLATION AND LOCATION OF THE UTILITIES AND ALSO THE LOCATION OF THE IRRIGATION DITCH. WE DO FEEL THAT THERE MAY BE AN AREA ON THE SOUTH SIDE OF THE ROAD THAT COULD BE USED TO RAISE THE ELEVATION OF THE ROAD AND REPAIR SOME OF THE SLOPES. THE BERMS ALONG SIDE THE ROAD COULD ALSO BE USED AS FILL.
RURAL MAJOR H.S ON THE …………………… WE FOUND SOME AREAS THAT MAY NEED MORE IMMEDIATE ATTENTION. THE REASON WE FEEL THIS IS THAT THIS ROAD HAS A LOT HIGHER VOLUME OF TRAFFIC. THE MOST APPARENT BEING THE OBSTRUCTIONS IN THE IRRIGATION DITCHES THAT ARE WITHIN THE RIGHT OR WAY. ALSO CONSIDER LIMITING SOME OF THE FIELD APPROACHES.
WE THOUGHT THAT THE BEGINNING OF THE ROAD WAS IN VERY GOOD CONDITION AND THE IMPROVEMENTS THAT WERE MADE TO THAT SECTION WERE VERY WELL DONE. IT WAS CLEAR THAT SAFETY WAS CONSIDERED IN THAT NEW CONSTRUCTION.
OVERALL, WE FELT THAT THE COUNTY ROAD SYSTEM IN …..COUNTY ii WAS IN GOOD SHAPE. WITH ROUTINE MAINTENANCE, WE FEEL THAT A LOT OF THE COMMENTS IN THIS REPORT WOULD BE TAKEN CARE OF.
RSA TEAM SUPERINTENDANT

122
Superintendent III
Road Safety Audit
I would like to applaud you on your efforts to make our county roads safer. It will be interesting to see the comparisons between the different observers on tis project. It would be wrong for me to say that our County roads are totally safe, as I don’tbelieve any county’s roads are. This RSA can be a very good tool for identifying safety problems, and hopefully correcting them as budgets allow. As we observed these roads, as County Road Supervisors, we were finding problems that we may have already corrected in our counties: such as inslopes, back slopes or crowning the centerline, etc. But on the other hand I don’t believe we scrutinized some areas as intensely as some of the other observers may have: such as gravel or other surface types, as I see these as cosmetic problems that are solved with routine maintenance. We found a few signing problems such as changing a yield to stop sign, or something that directly impacted an intersection. I am sure there will be some conflicting reports on signing with this report. I really feel we need to consider ADT’s and user types when we address the signing issue. I will end by suggesting that in the future when we do an RSA that the observer know who will be reviewing the RSA because that will dictate one or two things. First, if it is reviewed by Road & Bridge personnel, who will be constructing and or maintaining the problem, then it will be looked on as positive constructive criticism. Second if it is reviewed by County commissioners, who may not have an understanding of road constructions or if it is reviewed in a public forum; it could be potentially detrimental to road & bridge programs, as well as counties in general. In either case, you will get a different report. The first being more productive.
Thank you for the opportunity to participate in this worthwhile project.
County Road & Bridge.