adaptation to dna damage checkpoint in senescent ... dev... · instability (harrison and haber...
TRANSCRIPT

Adaptation to DNA damage checkpointin senescent telomerase-negative cellspromotes genome instabilityHéloïse Coutelier,1,10 Zhou Xu,1,10Mony ChendaMorisse,1Maoussi Lhuillier-Akakpo,2,3,4 Serge Pelet,5
Gilles Charvin,6,7,8,9 Karine Dubrana,2,3,4 and Maria Teresa Teixeira1
1Laboratoire de Biologie Moléculaire et Cellulaire des Eucaryotes, UMR8226, Centre National de la Recherche Scientifique(CNRS), Institut de Biologie Physico-Chimique, Paris Sciences et Lettres (PSL) Research University, Sorbonne Université, F-75005Paris, France; 2Institute of Molecular and Cellular Radiobiology, Commissiriat à l’Énergie Atomique et aux Énergies Alternatives(CEA)/Direction de la Recherche Fondamentale (DRF), 92260 Fontenay-aux-Roses Cedex, France; 3U967, Institut National de laSanté et de la Recherche Médicale (INSERM), 92260 Fontenay-aux-Roses Cedex, France; 4UMR967, Université Paris-Diderot etUniversité Paris-Sud, 92260 Fontenay-aux-Roses cedex, France; 5Department of Fundamental Microbiology, University ofLausanne, CH-1015 Lausanne, Switzerland; 6Department of Developmental Biology and Stem Cells, Institut de Génétique et deBiologie Moléculaire et Cellulaire, 67400 Illkirch, France; 7UMR7104, CNRS, 67400 Illkirch, France; 8U964, INSERM, 67400Illkirch, France; 9Université de Strasbourg, 67400 Illkirch, France
In cells lacking telomerase, telomeres gradually shorten during each cell division to reach a critically short length,permanently activate the DNA damage checkpoint, and trigger replicative senescence. The increase in genomeinstability that occurs as a consequencemay contribute to the early steps of tumorigenesis. However, because of thelow frequency of mutations and the heterogeneity of telomere-induced senescence, the timing and mechanisms ofgenome instability increase remain elusive. Here, to capture early mutation events during replicative senescence,we used a combined microfluidic-based approach and live-cell imaging in yeast. We analyzed DNA damagecheckpoint activation in consecutive cell divisions of individual cell lineages in telomerase-negative yeast cells andobserved that prolonged checkpoint arrests occurred frequently in telomerase-negative lineages. Cells relied on theadaptation to the DNA damage pathway to bypass the prolonged checkpoint arrests, allowing further cell divisionsdespite the presence of unrepairedDNAdamage.We demonstrate that the adaptation pathway is amajor contributorto the genome instability induced during replicative senescence. Therefore, adaptation plays a critical role in shapingthe dynamics of genome instability during replicative senescence.
[Keywords: telomere; senescence; DNA damage checkpoint; adaptation; genomic instability; Cdc5]
Supplemental material is available for this article.
Received July 2, 2018; revised version accepted October 3, 2018.
Eukaryotic cells respond to DNA damage by activating acheckpoint that arrests the cell cycle and permits thecell to attempt DNA damage repair. This pathway is acti-vated at specific phases of the cell cycle and limits genomeinstability (Harrison and Haber 2006). However, if DNArepair pathways fail or are impeded, cells can avoid deathby bypassing the checkpoint arrest and undergoing celldivision despite persistentDNAdamage, a process knownas adaptation (Sandell and Zakian 1993; Toczyski et al.1997; Lee et al. 1998b). Adaptation is thought to providethe cell with an opportunity to survive and produce prog-eny by allowing DNA repair to occur in other cell cycle
phases and/or by tolerating nonlethal loss of geneticmate-rial (Galgoczy and Toczyski 2001; Kaye et al. 2004). Forunicellular organisms, adaptation could generate geneticand phenotypic diversity and allow survival of the popula-tion under stress conditions. In human cells, adaptation isalso a proposed source of genome instability and can con-tribute to the development of therapy resistance in cancercells (Syljuasen et al. 2006; Kalsbeek and Golsteyn 2017).Double-strand breaks (DSBs) and other DNA lesions
lead to cell cycle arrest by activating the DNA damagecheckpoint signaling cascade. The Mec1/ATR kinase isrecruited along with its interacting partner, Ddc2/ATRIP,to the DSB, where they bind to newly formed ssDNA.This complex phosphorylates Rad9 (functionally related
10These authors contributed equally to this work.Corresponding authors: [email protected], [email protected] published online ahead of print. Article and publication date areonline at http://www.genesdev.org/cgi/doi/10.1101/gad.318485.118. Free-ly available online through the Genes & Development Open Accessoption.
© 2018 Coutelier et al. This article, published inGenes &Development,is available under a Creative Commons License (Attribution-NonCom-mercial 4.0 International), as described at http://creativecommons.org/licenses/by-nc/4.0/.
GENES & DEVELOPMENT 32:1–15 Published by Cold Spring Harbor Laboratory Press; ISSN 0890-9369/18; www.genesdev.org 1
Cold Spring Harbor Laboratory Press on November 21, 2018 - Published by genesdev.cshlp.orgDownloaded from

to 53BP1 inmammals), which then binds the forkhead-as-sociated (FHA) domains of the Rad53 and Chk1 kinases(Durocher et al. 1999). Once bound to Rad9, Rad53 isphosphorylated by Mec1, which initiates autohyperphos-phorylation of Rad53, which is required to fully activateand amplify the checkpoint signal, resulting in cell cyclearrest in G2/M (Harrison and Haber 2006).
If the cell can repair DNA damage during the check-point arrest, it can resume the cell cycle and proceedwith mitosis. This process, known as recovery, requiresinactivation of the checkpoint factors, including reversalof Rad53 phosphorylation (Pellicioli et al. 2001; Leroyet al. 2003). If DNA damage persists, the cell either is per-manently arrested and eventually dies or initiates adapta-tion. In the latter case, only Rad53 is dephosphorylatedand inactivated, whereas the upstream checkpoint factorsremain active, with factors such as Ddc2/ATRIP remain-ing at the DNA damage site (Melo et al. 2001) and phos-phorylated Rad9 persisting in the nucleus (Donnianniet al. 2010; Vidanes et al. 2010).
Although telomeres, which cap the ends of linear eu-karyotic chromosomes, are structurally similar to theends of DSBs, they do not activate the DNA damage re-sponse under normal conditions and are intrinsically re-fractory to repair. This prevents fusion of chromosomesand genome instability (Pardo and Marcand 2005; JainandCooper 2010). CellularDNApolymerases cannot fullyreplicate telomeric DNA, which shortens with each celldivision, compromising telomere protective functions(Lingner et al. 1995; Soudet et al. 2014). Telomere shorten-ing is counteracted by telomerase, a reverse transcriptasethat iteratively synthesizes telomeric repeats (Wu et al.2017). However, in some vertebrates, including humans,telomerase is absent from many somatic tissues, and thetelomeres eventually shorten sufficiently to induce per-manent activation of the DNA damage checkpoint andtrigger replicative senescence (d’Adda di Fagagna et al.2003; Herbig et al. 2006; Campisi and d’Adda di Fagagna2007; Carneiro et al. 2016). In other multicellular organ-isms that have constitutively active telomerase, such asmice, and most unicellular experimental model organ-isms, such as budding yeast, this senescence phenotypecan be recapitulated by deleting or inhibiting telomeraseactivity (Lundblad and Szostak 1989; Blasco et al. 1997;Enomoto et al. 2002; Ijpma and Greider 2003; Teixeira2013; Gonzalez-Garcia et al. 2015). Thus, telomere short-ening limits the life span of eukaryotic cells (Suram andHerbig 2014). Cancer cells can avoid senescence by alter-ing theDNAdamage checkpoint pathway response; for ex-ample, through p53 inactivation and abnormal elongationof telomeres, by re-expression of telomerase, or by up-reg-ulation of homology-dependent repair between telomeres(Lundblad and Blackburn 1993; Greider 1998; Artandi andDePinho 2000; Shay et al. 2012).
Although senescencewas first described as a tumor sup-pressormechanism, there is also evidence that telomerasedeficiency/inactivation is linked to increased genome in-stability, a hallmark of cancer (Blasco et al. 1997; Leeet al. 1998a; Chin et al. 1999; Hanahan and Weinberg2000; Hackett et al. 2001; Hackett and Greider 2003;
Maciejowski et al. 2015; Aunan et al. 2017; Maciejowskiand de Lange 2017). However, how genome instabilityarises in a cell with eroding telomeres but functionalDNA damage checkpoints, as it occurs physiologicallyin telomerase-negative somatic cells, has remained elu-sive. This is a crucial question for understanding howmutations and chromosomal aberrations are introducedduring the early stages of tumorigenesis.
Here, we used telomerase-negative Saccharomyces cer-evisiae cells to investigate sources of genome instabilityoccurring before the onset of replicative senescence. Wetracked individual cell lineages over time using a micro-fluidic/single-cell imaging approach and found that theprocess of adaptation occurs frequently in response toDNA damage in checkpoint-proficient cells during senes-cence. Moreover, we show that frequent prolonged arrestsand adaptation shape senescence dynamics and are a ma-jor contributor to the increase in genome instability asso-ciated with replicative senescence.
Results
Prolonged nonterminal cell cycle arrests in cells lackingtelomerase activity
To understand the origin of genome instability during rep-licative senescence in DNA damage checkpoint-profi-cient cells, we used microfluidics coupled to live-cellimaging, allowing us to monitor successive divisions ofsingle yeast cells (Fig. 1A; Supplemental Fig. S1; Supple-mental Movie S1; Fehrmann et al. 2013; Xu et al. 2015).In our previous study (Xu et al. 2015), we examined indi-vidual senescent yeast lineages using a TetO2-TLC1strain in which expression of TLC1 telomerase RNA isconditionally repressed by addition of doxycycline (dox)to the medium. We showed that terminal senescenceand cell death are often preceded by intermittent and sto-chastic long cell cycles followed by resumption of cell cy-cling, suggesting that the onset of replicative senescenceis a complex multistep pathway.
To investigate the relationship between long cell cyclesand genome instability, we compared cell division cyclesin telomerase-positive (−dox) (Supplemental Fig. S1) andtelomerase-negative (+dox) (Fig. 1B) TetO2-TLC1 lineages.We detected a significant difference between the dis-tribution of cell cycle durations of telomerase-positiveand telomerase-negative cells (n= 1895 and n = 5962, re-spectively; P= 3.10−61 by two-sample Kolmogorov-Smir-nov test) (Fig. 1B; Supplemental Fig. S1). The average cellcycle duration of telomerase-positive cells was ∼90 min,and only 1.3% of cycles were considered “long” (definedas >150 min [mean+3 SD duration of telomerase-positivecell division]). In contrast, themean cell cycle duration fortelomerase-negative cells was ∼140 min, and “long” cy-clesweremuchmore frequent (>150min for 19%of cycles)(Fig. 1B,C). Thus, repression of telomere activity substan-tially increased the frequency of “long” cell cycles.
Because cell cycle arrests found at the termini of the lin-eages lead to cell death, these events cannot contribute togenome instability at a population level. Therefore, we
Coutelier et al.
2 GENES & DEVELOPMENT
Cold Spring Harbor Laboratory Press on November 21, 2018 - Published by genesdev.cshlp.orgDownloaded from
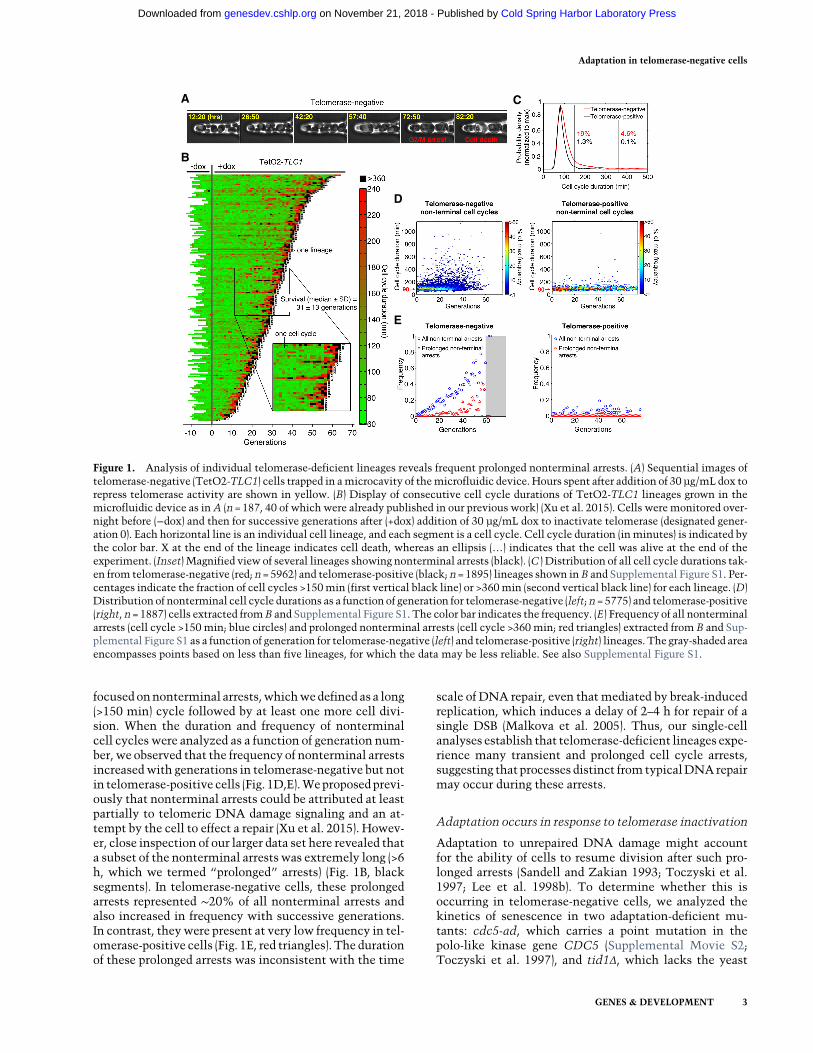
focused onnonterminal arrests,whichwedefined as a long(>150 min) cycle followed by at least one more cell divi-sion. When the duration and frequency of nonterminalcell cycles were analyzed as a function of generation num-ber, we observed that the frequency of nonterminal arrestsincreasedwith generations in telomerase-negative but notin telomerase-positive cells (Fig. 1D,E).Weproposedprevi-ously that nonterminal arrests could be attributed at leastpartially to telomeric DNA damage signaling and an at-tempt by the cell to effect a repair (Xu et al. 2015). Howev-er, close inspection of our larger data set here revealed thata subset of the nonterminal arrests was extremely long (>6h, which we termed “prolonged” arrests) (Fig. 1B, blacksegments). In telomerase-negative cells, these prolongedarrests represented ∼20% of all nonterminal arrests andalso increased in frequency with successive generations.In contrast, theywere present at very low frequency in tel-omerase-positive cells (Fig. 1E, red triangles). The durationof these prolonged arrests was inconsistent with the time
scale of DNA repair, even thatmediated by break-inducedreplication, which induces a delay of 2–4 h for repair of asingle DSB (Malkova et al. 2005). Thus, our single-cellanalyses establish that telomerase-deficient lineages expe-rience many transient and prolonged cell cycle arrests,suggesting that processes distinct from typicalDNArepairmay occur during these arrests.
Adaptation occurs in response to telomerase inactivation
Adaptation to unrepaired DNA damage might accountfor the ability of cells to resume division after such pro-longed arrests (Sandell and Zakian 1993; Toczyski et al.1997; Lee et al. 1998b). To determine whether this isoccurring in telomerase-negative cells, we analyzed thekinetics of senescence in two adaptation-deficient mu-tants: cdc5-ad, which carries a point mutation in thepolo-like kinase gene CDC5 (Supplemental Movie S2;Toczyski et al. 1997), and tid1Δ, which lacks the yeast
A
B
D
E
C
Figure 1. Analysis of individual telomerase-deficient lineages reveals frequent prolonged nonterminal arrests. (A) Sequential images oftelomerase-negative (TetO2-TLC1) cells trapped in amicrocavity of themicrofluidic device. Hours spent after addition of 30 µg/mL dox torepress telomerase activity are shown in yellow. (B) Display of consecutive cell cycle durations of TetO2-TLC1 lineages grown in themicrofluidic device as inA (n =187, 40 of which were already published in our previous work) (Xu et al. 2015). Cells weremonitored over-night before (−dox) and then for successive generations after (+dox) addition of 30 µg/mL dox to inactivate telomerase (designated gener-ation 0). Each horizontal line is an individual cell lineage, and each segment is a cell cycle. Cell cycle duration (in minutes) is indicated bythe color bar. X at the end of the lineage indicates cell death, whereas an ellipsis (…) indicates that the cell was alive at the end of theexperiment. (Inset) Magnified view of several lineages showing nonterminal arrests (black). (C ) Distribution of all cell cycle durations tak-en from telomerase-negative (red; n=5962) and telomerase-positive (black; n=1895) lineages shown in B and Supplemental Figure S1. Per-centages indicate the fraction of cell cycles >150min (first vertical black line) or >360min (second vertical black line) for each lineage. (D)Distribution of nonterminal cell cycle durations as a function of generation for telomerase-negative (left; n =5775) and telomerase-positive(right, n =1887) cells extracted fromB and Supplemental Figure S1. The color bar indicates the frequency. (E) Frequency of all nonterminalarrests (cell cycle >150 min; blue circles) and prolonged nonterminal arrests (cell cycle >360 min; red triangles) extracted from B and Sup-plemental Figure S1 as a function of generation for telomerase-negative (left) and telomerase-positive (right) lineages. The gray-shaded areaencompasses points based on less than five lineages, for which the data may be less reliable. See also Supplemental Figure S1.
Adaptation in telomerase-negative cells
GENES & DEVELOPMENT 3
Cold Spring Harbor Laboratory Press on November 21, 2018 - Published by genesdev.cshlp.orgDownloaded from

paralog of the recombination and repair enzyme Rad54(Lee et al. 2001).
When the cdc5-ad allele was introduced into ourTetO2-TLC1 strain and the cells were grown in the ab-sence of dox (i.e., telomerase-positive), we observed no dif-ference between cdc5-ad and wild-type lineages in termsof cell cycle duration (mean±SD: 98 ± 26 min and 91 ±37 min, respectively) (Supplemental Fig. S2A,E), basalmortality (rate <5.3 × 10⁻³ and <4.3 × 10⁻³ per generation,respectively), or frequency of nonterminal arrests (Supple-mental Fig. S2A,C,D). However, telomerase-negativecdc5-ad lineages showed a significantly reduced frequen-cy of prolonged nonterminal arrests (Fig. 2A,C,D,G–I; Sup-plemental Movie S3) compared with telomerase-negativeCDC5 lineages (Fig. 1B,D [left panel], E [left panel]), sug-gesting that adaptation may be responsible for the high
frequency of prolonged nonterminal arrests in telomere-negative cells.
To verify this, we examined the tid1Δ mutant, whichlikely plays a distinct role in adaptation (Lee et al. 2001;Shah et al. 2010). Like the cdc5-ad strain, telomerase-pos-itive tid1Δ cells displayed normal cell cycle durations(mean±SD: 85 ± 26 min) (Supplemental Fig. S2B,E), basalmortality level (rate <6 × 10³ per generation), and frequen-cy of nonterminal arrests (Supplemental Fig. S2B–D) com-pared with wild-type cells. We also observed a significantdecrease in the frequency of prolonged nonterminal ar-rests in telomerase-negative tid1Δ lineages comparedwith wild-type lineages, albeit to a lesser extent than tel-omerase-negative cdc5-ad cells (Fig. 2B,E,F,G–I; Supple-mental Movie S4). Both cdc5-ad and tid1Δ mutants alsoshowed a reduced frequency of nonterminal arrests <6 h
A B
C E FD
G H I
Figure 2. Adaptation-deficientmutants displaya reduced frequencyof prolongednonterminal arrests. (A,B) DisplayofTetO2-TLC1cdc5-ad (A; n =116) and tid1Δ (B; n= 103) lineages before and after dox addition. See Figure 1B for a description of the plot features. (C,E) Distri-bution of nonterminal cell cycle durations as a function of generation for telomerase-negative cdc5-ad (C, n=2397) and tid1Δ (E, n=999)cells, as extracted from experiment shown in A and B, respectively. The color bar indicates the frequency. (D,F ) Frequency of all nonter-minal arrests (cell cycle >150min; blue circles) and prolonged nonterminal arrests (cell cycle >360min; red triangles) as a function of gen-eration for telomerase-negative cdc5-ad (D) and tid1Δ (F ) cells, as extracted from experiments shown in A and B, respectively. The gray-shaded area encompasses points based on less than five lineages, for which the data may be less reliable. (G–I ) Percentage of nonterminalarrests (G) and prolonged nonterminal arrests (H) and the ratio of nonterminal to all prolonged (nonterminal + terminal) arrests (I ) over allcell cycles for telomerase-negative lineages of the indicated genotypes (wild type: TetO2-TLC1), as extracted from experiment shown inAand B and Figure 1B. (n.s.) Not significant; (∗∗) P<0.01; (∗∗∗∗) P <0.0001 by χ2 goodness of fit test. See also Supplemental Figure S2.
Coutelier et al.
4 GENES & DEVELOPMENT
Cold Spring Harbor Laboratory Press on November 21, 2018 - Published by genesdev.cshlp.orgDownloaded from

(Fig. 2A,B,G), suggesting that adaptation in response totelomere shortening might also occur during briefer ar-rests. Collectively, these data indicate that adaptationme-diates the resumption of cell cycling after prolongedarrests.
Adaptation does not affect telomere homeostasis,checkpoint activation, or homology-dependent repair
The absence of prolonged arrests in adaptation mutantscould result from altered telomere length or structure.To verify that telomere homeostasis was not disruptedin the adaptation-defective mutants used here, we mea-sured telomere lengths in telomerase-positive (reflectingsteady-state length) and telomerase-negative (indicatingthe kinetics of telomere shortening) backgrounds. A het-erozygous diploid TLC1/tlc1Δ CDC5/cdc5-ad strain wasallowed to sporulate, and spores of all four resulting geno-types were selected. Cultures were grown and diluted dai-ly, and samples were taken throughout senescence (days4–8) and post-senescence (days 9–10) (Fig. 3A). Telomerelength was measured using XhoI digestion of genomicDNA followed by Southern blot analysis. We observedno significant differences between cdc5-ad and wild-type cells in steady-state telomere length distribution,telomere shortening kinetics, or the ability of post-senes-cent survivors tomaintain typical long and heterogeneoustelomeres (Fig. 3B,E; Lundblad and Blackburn 1993). Sim-
ilar results were found for tid1Δ mutants (Fig. 3C–E).Thus, aberrant telomere homeostasis does not explainthe lack of prolonged arrests in the adaptation mutants.We also asked whether the adaptation mutants might
display defective checkpoint activation in response totelomeric damage. We considered this unlikely becausewhilemany proteins involved in adaptation also play rolesin DNA damage repair and checkpoint activation, this isnot the case for Cdc5 and Tid1 (Toczyski et al. 1997; Leeet al. 2001;Melo et al. 2001; Pellicioli et al. 2001; HarrisonandHaber 2006;Clerici et al. 2014). Indeed,we specificallychose themto avoid confounding effects on checkpoint ac-tivation. Consistent with this, we found that cdc5-admu-tants and wild-type cells showed indistinguishableabilities to (1) form Ddc2-eGFP foci in the nucleus, (2) ar-rest in G2/M phase of the cell cycle, (3) undergo Rad53hyperphosphorylation in response toDSBs inducedby zeo-cin, and (4) undergo G2/M arrest at the restrictive temper-ature in acdc13-1background (inwhich telomeresbecomeuncapped at high temperature, inducing checkpoint acti-vation) (Supplemental Fig. S3A–D; Supplemental MovieS2). Therefore, we conclude that the reduction in pro-longed nonterminal arrests during replicative senescencein the cdc5-ad mutant is not caused by disruption ofDNA damage checkpoint activation.Finally, we wondered whether adaptation mutants
might alter homology-dependent repair efficiency. Totest this, we performed a recombination assay based oncell survival following repair of a DSB by homologous
A C
Cel
ls/m
l
Days after sporulation Days after sporulation
Cel
ls/m
l
kb
3 4 5 6 7 8 9 10Days
tlc1Δ tlc1Δ cdc5-ad3 4 5 6 9 10
3 -
1.5 -
3 -
1.5 -
3 4 5 6 7 8 9
tlc1Δ3 4 5 6 7 8 9 10
tlc1Δ tid1Δ
kb
Days
4 -5 -6 -8 -
10 -
4 -5 -6 -8 -
10 -
B D
PD 30 39 49 57 63 68 77 86 7930 39 49 58 75 84 PD 30 39 49 57 63 70 30 39 49 55 60 65 8374
TLC1
tid1ΔTID1
TLC1
cdc5-adCDC5
ETelomere shortening rate
(bp/PD, mean ± SD)
tlc1Δ CDC5
tlc1Δ cdc5-ad
3.5 ± 0.6
tlc1Δ TID1
tlc1Δ tid1Δ
3.1 ± 0.2
3.2 ± 0.4
3.2 ± 0.2
109
108
107
106
3 4 5 6 7 8 9 10
109
108
107
106
3 4 5 6 7 8 9 10
Figure 3. Adaptation does not affect telomere length or its regulation. (A) Growth of tlc1Δ CDC5 and tlc1Δ cdc5-ad cells selected aftersporulation of a heterozygous TLC1/tlc1ΔCDC5/cdc5-ad diploid strain. After dissection, spores were grown on plates for 2 d, genotyped,and transferred to liquid culture (indicated as day 3). Cells were sampled daily and normalized to the same density (OD600 nm= 0.01).(B) XhoI terminal restriction fragment Southern blot analysis of telomere lengths in the cells described in A. (PD) Population doublings.(C,D) As described for A and B except that TLC1/tlc1Δ TID1/tid1Δ heterozygotes were allowed to sporulate, and the growth rates andtelomere lengths of tlc1Δ TID1 and tlc1Δ tid1Δ genotypes were analyzed. (E) Mean telomere shortening rates (base pair/population dou-bling [bp/PD]) of the genotypes analyzed in A–D over days 3–5. Mean±SD of n=3 independent experiments per genotype. See also Sup-plemental Figure S3.
Adaptation in telomerase-negative cells
GENES & DEVELOPMENT 5
Cold Spring Harbor Laboratory Press on November 21, 2018 - Published by genesdev.cshlp.orgDownloaded from

recombination (Batte et al. 2017). A single DSB was in-duced by expression of the I-SceI endonuclease, which isdriven by the inducible GAL promoter, in a ura3 allelebearing the I-SceI recognition site. Cells survived by ho-mology-dependent repair with a donor ura3-1 allele. Sur-vival frequency normalized to the total number of platedcells provides a measure of repair efficiency. We detectedno significant difference in survival frequency after DSBinduction between the three genotypes (wild type, cdc5-ad, and tid1Δ) regardless of where the cutting site wasplaced; i.e., at an intrachromosomal locus (LYS2 gene) orthe 6R subtelomere (Supplemental Fig. S3E). Thus, the ob-served phenotypes of cdc5-ad and tid1Δ mutants in repli-cative senescence are probably not due to a change ofhomology-dependent repair efficiency.
A checkpoint activation reporter for monitoringadaptation in single cells
To detect adaptation events in senescing cells in real-time, we developed a DNA damage checkpoint activationreporter. We reasoned that the DNA damage checkpointmachinery would remain active during the cell cycle im-mediately following prolonged arrest if the cell underwentadaptation, whereas the checkpoint would be inactivatedif the cell successfully repaired the damage and recovered.We monitored Rad9 phosphorylation, which is main-tained at high levels in adapted cells despite Rad53dephosphorylation (Donnianni et al. 2010; Vidanes et al.2010). Rad9 is recruited to theDNAdamage site and phos-
phorylated in aMec1-dependentmanner (Emili 1998; Via-lard et al. 1998; Schwartz et al. 2002). PhosphorylatedRad9 then binds to Rad53 via its FHA domains (Durocheret al. 1999; Schwartz et al. 2002; Sweeney et al. 2005). Wegenerated strains harboring an mCherry-tagged Rad53FHA1 domain, which should remain cytoplasmic untilcheckpoint activation, when it should interact with phos-phorylated Rad9 in the nucleus (Fig. 4A). The cells also ex-pressed histone Hta2 fused to yECFP as a nuclear marker.
We treated cells harboring both FHA1-mCherry andHta2-yECFP (the “FHA1-mCherry reporter”) with zeocinto generate DSBs. DNA damage resulted in the accumula-tion of FHA1-mCherry in the nucleus (Fig. 4B,C). Mostcells arrested inG2/M (Supplemental Fig. S4A), indicatingthat expression of the reporter did not interfere withthe checkpoint response. A mutant FHA1 that cannotinteract with phosphorylated Rad9 (His75 to alanine[H75A], corresponding to H88A in the full-length Rad53protein) (Durocher et al. 1999) abolished nuclear localiza-tion of mCherry upon DNA damage induction (Fig. 4B,C).Similar results were obtained upon induction of a singleDSB in a strain containing a unique cleavage site for theendonuclease HO (Supplemental Fig. S4B,C; Lee et al.1998b). Thus, the FHA1-mCherry reporter specifically de-tects checkpoint activation in response to DNA damage.
We asked whether the FHA1-mCherry reporter coulddistinguish between adaptation and recovery events. Weused the cdc13-1 mutant model of adaptation, in whichtelomeres are uncapped at high temperatures, leading tocheckpoint activation and either adaptation or death
C
Phase contrast Hta2-yECFPFHA1-mCherry or
FHA1-H75A-mCherry Merge
B
wt
H75
Aw
tH
75A
+ z
eoci
n-
zeoc
in
A
Rad9
Rad53FHA1
mCherry
Rad9
Rad53FHA1
P
mCherry
- DSB + DSB
D
FHA1-mCherrycdc13-1 cells
23°C 32°C 32°C
23°C3h 21h
2h
Nor
mal
ized
ave
rage
nucl
ear
mC
herr
y si
gnal
0
1
2
3
4
0
0.5
1
1.5
2
Nor
mal
ized
ave
rage
nucl
ear
mC
herr
y si
gnal
FHA1-mCherry: wt H75A
- zeocin + zeocin
wt H75A
unchallenged
cellsarre
sted
cells recovered
cells adapted
cells
Figure 4. Detection of DNA damagecheckpoint activation with a fluorescentbiosensor. (A) Schematic showing themCherry-coupled Rad53-FHA1 fluorescentprotein interacting with phosphorylatedRad9 in the nucleus in response to a DSB.(B) Representative phase contrast and fluo-rescence images of cells carrying the nuclearmarker Hta2-yECFP and either the wild-type FHA1-mCherry (wt) or a mutant ver-sion that cannot bind to phosphorylatedRad9 (FHA1-H75A-mCherry). Cells wereimaged 3.5 h after treatment with 300 µg/mL zeocin or nontreated. (C ) Quantificationof the experiment inB. Data are presented asthe nuclear mCherry signal normalized tothe untreated cells carrying wild-typeFHA1-mCherry. N≥ 50 untreated cells; N≥ 160 zeocin-treated cells. (∗∗∗∗) P< 0.0001;(n.s.) not significant by the Mann-WhitneyU-test. (D, bottom panel) The experimentalscheme: cdc13-1 cells carrying the FHA1-mCherry reporter were grown at 23°C (“un-challenged cells”) and then placed for 3 h atthe restrictive temperature of 32°C (“arrest-ed cells”). The cells were then split into twocultures: One was incubated for 2 h at 23°C(“recovered cells”), and the other was incu-
bated for an additional 21 h at 32°C (“adapted cells”). (Top panel) Quantification of nuclear mCherry fluorescence normalized to the un-challenged cells. N=279 unchallenged cells; N=191 arrested cells; N =255 recovered cells; N=59 adapted cells. (∗) P<0.05; (∗∗∗∗) P<0.0001 by the Mann-Whitney U-test. See also Supplemental Figure S4.
Coutelier et al.
6 GENES & DEVELOPMENT
Cold Spring Harbor Laboratory Press on November 21, 2018 - Published by genesdev.cshlp.orgDownloaded from

(Garvik et al. 1995; Paschini et al. 2012). However, check-point activation can be reversed if the cells are returnedto the permissive temperature (23°C), allowing full recov-ery (Lydall and Weinert 1995; Toczyski et al. 1997). Weincubated cdc13-1 cells expressing FHA1-mCherry re-porter for 3 h at 32°C and then either incubated themfor an additional 21 h at 32°C or returned them for 2 hto 23°C (Fig. 4D). As expected, the nuclear mCherry sig-nal increased significantly after 3 h at the restrictive tem-perature, indicative of checkpoint activation, and thendecreased to basal levels after 2 h at 23°C. However, cellsremaining for 24 h at 32°C showed sustained elevation ofthe nuclear mCherry signal upon adaptation comparedwith basal levels (Fig. 4D; Supplemental Fig. S4D,E).These data demonstrate that the FHA1-mCherry reportercan distinguish between recovery and adaptation eventsin live single cells.We used this reporter to assess checkpoint activation in
individual telomerase-negative cell lineages. We con-firmed that the senescence profile of reporter-expressingTetO2-TLC1 cells was comparable with that of controlTetO2-TLC1 cells under the microfluidic imaging con-ditions (median ± SD: 34± 18 vs. 31 ± 13 generations, re-spectively) (Supplemental Fig. S5A; Fig. 1B). The averagenuclear mCherry signal before senescence was low anddisplayed oscillatory behavior (Fig. 5A,B), which could re-flect Rad9 phosphorylation during S and G2 phases of thecell cycle (Vialard et al. 1998). In contrast, the reporter sig-nal increased substantially during cell cycle arrest, indi-cating DNA damage checkpoint activation, consistentwith our finding that deletion of MEC1 suppressed thesearrests (Fig. 5A,B; Xu et al. 2015).We observed two distinct patterns of nuclear mCherry
signal intensity in the cell cycle immediately followingnonterminal arrests: maintenance of high levels (79%;38 out of 48 cycles) (Fig. 5C,D,E,H; Supplemental Fig.S5B) and return to basal levels (21%; 10 out of 48 cycles)(Fig. 5C,F,G,H; Supplemental Fig. S5B), consistent withadaptation and recovery events, respectively. The fractionof cells that adapted after experiencing a prolonged arrest(79%) was in agreement with the 83% reduction in pro-longed nonterminal arrests found in the cdc5-ad mutantcompared with wild-type cells (Fig. 2A,H). Thus, adapta-tion events occur frequently during senescence, suggest-ing that telomeric damage is not always repaired beforethe affected cells resume division and reach a terminalsenescent state.Of 32 prolonged cell cycles, 23 (72%) were followed at
some point in the subsequent divisions by a cell cycle ofnormal duration (Fig. 5I; Supplemental Fig. S5C,D). Themean±SD number of cell divisions that followed a pro-longed arrest was 9.4 ± 10.1 divisions, with a maximumof 33. Therefore, in a majority of lineages, adaptationeventually led to normal cell cycles with inactive DNAdamage checkpoints, suggesting that repair pathways op-erated to silence the initial damage signal in subsequentcell divisions and that post-adapted cells would not dieout in the population of senescent cells. Instead, post-adapted cells display substantial proliferation potential,up to billions of cells in the progeny.
Adaptation drives genome instability in senescence
Based on our observation of a high frequency of adaptationevents in telomerase-negative lineages (∼2%–7%of all celldivisions) and theproliferativepotential of adaptedcell lin-eages, we hypothesized that adaptation might contributeto the increase in genome instability observed as cells ad-vance into senescence, since adaptation can be followedby genome instability (Galgoczy and Toczyski 2001). Totest this hypothesis, we measured the mutation rate ofthe endogenousCAN1 gene in the TetO2-TLC1 strain us-ing fluctuation assays (Hackett et al. 2001).CAN1 encodesan arginine permease such that cells carrying mutationsin the gene are insensitive to the toxic arginine analogcanavanine.Growth inarginine-deficient canavanine-sup-plemented medium thus selects for CAN1 mutants, andthe mutation rate can be estimated by enumerating CanR
clones (Lea and Coulson 1949; Chen et al. 1998). Weobserved no difference in the CAN1 mutation rates oftelomerase-positive cdc5-ad and wild-type strains (mean[95% confidence intervals]: 1.4 [1.0–1.7] × 10−7 and 1.6[1.2–2.0] × 10−7 mutations per generation, respectively).To evaluate CAN1 mutation rates during senescence,
independent cultures of TetO2-TLC1 wild-type andcdc5-adcellsweregrown in rich liquiddox-containingme-dium and diluted daily to 104 cells permilliliter. Each day,a sample of each culture was plated on canavanine-con-taining plates to score CanR colonies and, in parallel, onrich medium plates to normalize the number of cells plat-ed (Fig. 6A). As telomerase-negative cells lose their prolif-eration potential over time, CAN1mutants were selectedon plates lacking dox to allow telomerase re-expressionand thus ensure accurate quantification of colonynumber.Wild-type telomerase-negative cultures displayed an in-crease in CAN1 mutation rate over time, which peakedat approximately ninefold the basal rate on day 6, concom-itant with the senescence crisis (Fig. 6B,D; SupplementalFig. S6A–F; Hackett et al. 2001). In contrast, the cdc5-adstrain mutation rate was more modest and peaked at ap-proximately fourfold the basal rate at senescence crisis,corresponding to an ∼56% decrease compared with thewild-type strain (Fig. 6D). Similar results were obtainedwith the tid1Δ telomerase-negative strain, which dis-played a mutation rate at senescence crisis ∼40% lowerthan the wild-type telomerase-negative cultures (approxi-mately sixfold vs. ∼10-fold increased rate, respectively)(Fig. 6C,E; Supplemental Fig. S6G–J). These data indicatethat adaptation contributes nearly half of the increase inmutation rate observed in senescence.
Post-adapted cells display gross genome rearrangements
After adaptation to DNA damage, repair pathways avail-able to the cell in the next G1 phase may differ from thosein G2/M.We thus asked whether adaptation modified thespectrum of mutations that led to CanR cells obtained inthe fluctuation assays (Fig. 6A).The CanR colonies obtained in both wild-type and
cdc5-ad backgrounds displayed size heterogeneity, possi-bly reflecting diverse mutation mechanisms. Most small
Adaptation in telomerase-negative cells
GENES & DEVELOPMENT 7
Cold Spring Harbor Laboratory Press on November 21, 2018 - Published by genesdev.cshlp.orgDownloaded from

A
Time without telomerase (hrs)
Ave
rage
nuc
lear
mC
herr
y si
gnal
(A
U)
B
Ave
rage
nuc
lear
mC
herr
y si
gnal
(A
U)
Time without telomerase (hrs)
C
telomeraseinactivation
(+dox)
OR
Cell cyclefollowing
prolongedarrest
Arrest> 5hrs
adaptation
recovery21%
79% senescence
F
E
G
D
Ave
rage
nuc
lear
mC
herr
y si
gnal
(A
U)
arre
st >5
hrs
cell c
ycle
follo
wing
prolo
nged
arre
st
Adaptation subset (79%)
Ave
rage
nuc
lear
mC
herr
y si
gnal
(A
U)
Time (min)
Ave
rage
nuc
lear
mC
herr
y si
gnal
(A
U)
Time (min)
Ave
rage
nuc
lear
mC
herr
y si
gnal
(A
U)
Recovery subset (21%)
arre
st >5
hrs
cell c
ycle
follo
wing
prolo
nged
arre
st
Ave
rage
nuc
lear
mC
herr
y si
gnal
(A
U)
cell c
ycle
<2.5
hrs
arre
st >5
hrs
cell c
ycle
follo
wing
prolo
nged
arre
st
H I
Number of cell divisionsafter prolonged arrest
Cou
nt
0
5
10
15
1-5
6-10
11-15
16-20
21-25
>2
6
Figure 5. A novel checkpoint activation reporter reveals adaptation events at the single-cell level in telomerase-negative lineages.(A,B) Average nuclear FHA1-mCherry signal in representative telomerase-negative lineages monitored over the course of senescenceshown in Supplemental Figure S5A. Vertical lines represent budding events. The gray-shaded area represents the basal nuclear FHA1-mCherry signal in normally dividing cells ± 3 SD. (C ) Average nuclear FHA1-mCherry signal per cell cycle quantified in telomerase-negative single cells with normal cell cycle durations (<2.5 h; n =31 cell cycles), cell cycles showing prolonged arrest (>5 h, n =32 cellcycles) (see Supplemental Fig. S5B, indicated by white arrows in Supplemental Fig. S5A), and the first cell cycle immediately followingprolonged arrest (n =64 cell cycles) (see Supplemental Fig. S5B). Data were taken from the experiment shown in Supplemental FigureS5A. (∗∗∗∗) P <0.0001; (n.s.) not significant by the Mann-Whitney U test. (D,F ) The analysis in C was further divided into two subsets:adaptation (D; n=38 pairs of two consecutive cell cycles) and recovery (F; n =10 pairs of two consecutive cell cycles); only cells arrestedfor >5 h and displaying increased mCherry signal were included in this analysis, thus excluding 16 out of the 64 prolonged arrests fromfurther analysis (Supplemental Fig. S5B). Adaptation and recovery are defined as a high nuclear mCherry signal that is maintained (adap-tation;D) or decreases to a basal level (recovery; F ) in the cell cycle immediately following prolonged arrest. (∗∗) P <0.01; (n.s.) not signifi-cant by theMann-WhitneyU-test. (E,G) Representative plots of the average nuclear FHA1-mCherry signal showing an adaptation (E) and arecovery (G) event. Blue lines show the prolonged arrest (>5 h) followed by cell division, budding, and the second cell cycle of the resultingmother (red) and daughter (green) cells. The gray-shaded area represents the average basal reporter signal during normal cell cycles, and thevertical lines indicate cytokinesis and budding. (H) Schematic summarizing the behavior of the FHA1-mCherry reporter during an arrest>5 h, the immediate following cell cycle, and its interpretation into adaptation (79% of the events) or recovery (21% of the events), asplotted inD–G. These particular cell cycles are placed in the context of cell lineages from telomerase inactivation to senescence (red cells).A red nucleus indicates that the nuclear signal of FHA1-mCherry fusion protein is above background as in Figure 4A. See also Supplemen-tal Figure S5. (I ) Distribution of the number of cell divisions after prolonged arrest. n =32.
8 GENES & DEVELOPMENT
Cold Spring Harbor Laboratory Press on November 21, 2018 - Published by genesdev.cshlp.orgDownloaded from

colonies recovered normal growth when restreaked,reminiscent of the transient lower growth/high mortalityseen immediately after the appearance of unstable chro-mosomes (Pobiega and Marcand 2010; Vasan et al. 2014;Beyer and Weinert 2016). To identify altered chromo-somes, we separated the whole chromosomes of CanR
clones by pulsed-field gel electrophoresis (PFGE). MostCanR colonies displayed changes in the mobility of oneor several chromosomes compared with the initial wild-type or cdc5-ad CAN1 strains before telomerase inactiva-tion (Fig. 7A; Supplemental Fig. S7A), showing that grosschromosomal rearrangements (GCRs) occur in senescentcells and not only on the chromosome carrying the report-er gene forwhichweselected.However, the extent of theseabnormalities appeared similar between wild-type andcdc5-ad strains.To better quantify the gross chromosomal rearrange-
ments leading to canavanine resistance, we replica-platedCanR colonies on plates containing both canavanine and5-fluoroorotic acid (5-FOA), thus additionally selecting
for loss of URA3 expression (Fig. 7C). The simultaneousloss of CAN1 and URA3 was characterized previously asdue to GCRs (Chen and Kolodner 1999). We observedthat in all three genotypes (CDC5 TID1, cdc5-ad, andtid1Δ), 2%–4% of CanR colonies experienced GCRs.Importantly, we found no significant differences betweenadaptation-proficient and adaptation-deficient strainsat both day 1 and day 6 after telomerase inactivation.Therefore, adaptation did not influence the mechanismsby which senescent cells generate aberrant genomerearrangements.In small CanR colonies, PCR designed to amplify the
CAN1 gene frequently failed (Supplemental Fig. S7B,C),consistent with a terminal deletion of chromosome 5(Hackett et al. 2001), although other possibilities exist,such as mutations of one of the primer annealing sites,large insertions in theCAN1 gene, or chromosome fusionsdisrupting the CAN1 gene. In contrast, in normal-sizedcolonies, the CAN1 gene could be amplified most of thetime (Supplemental Fig. S7B,D), and chromosome 5 wasfrequently found to be intact (Fig. 7B). We sequenced thePCR products (Fig. 7D) and identified point mutations, in-sertions, and deletions. Overall, they were not sig-nificantly different between wild-type cells and cdc5-admutants. Therefore, adaptation did not influence the na-ture and spectrum of CAN1 mutations formed duringsenescence.Since adaptation is known to transiently alter check-
point activation, we wondered whether CanR strains—roughly half of which have previously undergoneadaptation in senescence—still had an intact checkpointpathway. To test this, CanR strains were treated with zeo-cin and tested for their ability to arrest in G2/M. Allstrains of both wild-type and cdc5-ad genotypes were ar-rested in G2/M to the same extent as the parental strains(Fig. 7E). As a negative control, RAD9 deletion preventedthe G2/M arrest in cells treated by zeocin (SupplementalFig. S3B). This result suggested that although half of theCanR mutants of wild-type genotype previously experi-enced adaptation, none irreversibly mutated their check-point signaling pathway. Therefore, the increase inmutagenesis and chromosomal rearrangements in senes-cence is not the result of pre-existing mutations in genesencoding checkpoint factors.
Discussion
Themolecular events occurring in individual cells as theydivide and progress toward senescence are difficult tostudy in bulk cell populations. Mutations and other ge-nome-destabilizing events are rarebut canhavemajor con-sequences for the whole cell population. Here, we studiedcell division dynamics in individual telomerase-deficientcell lineages to understand when and how genome insta-bility is initiated upon telomerase inactivation. We usedamicrofluidic-based approach coupled to live-cell imagingto monitor consecutive divisions of individual telomere-deficient cells until they entered senescence and died.We found thatmany lineages display frequent arrests prior
A
B C
D E
Cel
ls/m
l
Days after telomerase inactivation
Days after telomerase inactivation
Mut
atio
n/ge
nera
tion
Cel
ls/m
l
Days after telomerase inactivation
Days after telomerase inactivation
0 1 2 3 4 5 6 7 8 9 10
109
108
107
106
0 1 2 3 4 5 6 7 8 9 10
109
108
107
106
0.2
0.4
0.6
0.8
1x10⁻⁶
0 1 2 3 4 5 6 7 8 9 100
Mut
atio
n/ge
nera
tion
0.2
0.4
0.6
0.8
1x10⁻⁶
0 1 2 3 4 5 6 7 8 9 100
CDC5cdc5-ad
CDC5cdc5-ad
TID1tid1Δ
TID1tid1Δ
synthetic medium+ canavanine
24 h
104 cells/ml
canavanine resistant(CAN1 mutant)
Rich medium+ doxycycline
count cells
plate
48 h tetO2-TLC1
strains
dilute
Figure 6. Adaptation contributes to the increased mutation rateobserved in senescence. (A) Experimental protocol for the fluctu-ation assay of CAN1 gene mutation during senescence. Cellswere grown in liquid YPD medium and 30 µg/mL dox for 10 d.Cells were counted and diluted daily to ensure that CanRmutantswere not transferred from the previous culture. A sample of cellswas plated on canavanine-containingmedium lacking arginine oron YPD plates (for normalization). The colonies formed after 2 dat 30°Cwere counted, and themutation ratewas calculated. (B,C )Average growth curves of 20 independent cultures of telomerase-inactivated CDC5 and cdc5-ad strains (B) and 10 independentcultures of telomerase-inactivated TID1 and tid1Δ strains (C ).Data are presented as the means± SD. (D,E) Rates of CAN1gene mutation in the cultures shown in B and C, respectively.Data are presented as the mutation rate ±95% confidence inter-val. See also Supplemental Figure S6.
Adaptation in telomerase-negative cells
GENES & DEVELOPMENT 9
Cold Spring Harbor Laboratory Press on November 21, 2018 - Published by genesdev.cshlp.orgDownloaded from

to the terminal arrest at replicative senescence. Thesenonterminal arrests increased in frequency with timeand mirrored the increase in genome instability duringsenescence. About 20% of the nonterminal arrests, whichwecalledprolonged arrests,wereextremely long (>5–6h), atime scale inconsistent with known DNA repair mecha-nisms (Fig. 1). Instead, the cells underwent adaptation, en-tered mitosis, and proceeded to divide in the presenceof unrepaired DNA damage (Sandell and Zakian 1993;Toczyski et al. 1997). We showed that this mechanism ac-counted for nearly half of the increase in genome instabil-ity of senescent cells. Our results support the followingsequence of events (Fig. 7F): A critically short or damagedtelomere induces a checkpoint arrest, and, because repairpathways might not be efficient, adaptation would allowcell divisionafter an extendedperiod of timeand lead to ge-nome instability in the following cell cycles. This openstheway for genomevariants to arise.Most variants are det-rimental to cell growth, but rare ones might potentiallystabilize and propagate and thus serve as a precursor forsenescence escape.
We used two independent approaches to demonstratethat adaptation occurred in the absence of telomerase. Inthe first approach, we analyzed adaptation-deficient mu-tants and found that they displayed significantly fewer
nonterminal arrests, particularly the prolonged arrests,compared with their wild-type counterparts, suggestingthat adaptation was required for telomerase-negative cellsto escape from these arrests (Fig. 2). Interestingly, telome-rase-negative cdc5-ad lineages display a median survivalsimilar to telomerase-negative CDC5 lineages, which ishigher than expected if adaptation mutants were unableto resume cell cycle after an early arrest. Since telome-rase-negative tid1Δ lineages have a significantly reducedmedian survival compared with cdc5-ad (median ± SD:22± 12 and 30 ± 13, respectively), we speculate that thehigher survival of the cdc5-ad mutant might be due to anadditional or altered function unrelated to adaptation. Fur-thermore, in response to DNA damage, the cdc5-ad mu-tant was as proficient for checkpoint activation, cellcycle arrest, recruitment of repair factors (Toczyskiet al. 1997; Melo et al. 2001; Pellicioli et al. 2001; thisstudy), and homology-dependent repair as wild type.This rules out inefficient checkpoint activation or repairas a possible explanation for the unexpectedly high sur-vival of telomerase-negative cdc5-ad lineages. Furtherstudies shall clarify this cdc5-ad-specific phenotype ob-served only in the absence of telomerase. In the second ap-proach, we developed a fluorescent biosensor to monitorcheckpoint activation in live cells (Figs. 4, 5). In the
A
B
% G
2/M
cel
ls
C
Point mutation
Insertion/Deletion
Not identified
CanR CDC5
CanR cdc5-ad
6 2 4
10 1 1
0
20
40
60
80
100
CDC5 cdc5-ad
ctrl
zeocin
Initial strainCDC5
Initial straincdc5-adCanR CDC5 CanR cdc5-ad
V
D
E
adaptation
adaptation
proliferation of post-adapted
cell lineagecontaining
genome variants
senescence
telomeraseinactivation
telomericdamage
DNArepair
IVIIIIIX
V, VIIIXIX
II, XIXVI, XIII
XV
IVXII
VII
Initial strainCDC5
Initial straincdc5-ad
CanR CDC5 CanR cdc5-ad
Days aftertelomerase inactivation
% CanR colonies that experienced GCR (mean ± SD)
CDC5 TID1cdc5-ad
3.1 ± 1.82.9 ± 1.33.7 ± 2.7
61
tid1∆
F
CEN.
TEL.AVT2CAN1Chr. V
30 kb
URA3
2.3 ± 0.82.7 ± 2.42.1 ± 1.4
Figure 7. Adaptation drives genome instability in sen-escence. (A) Chromosomes of CanR colonies of the indi-cated genotypes were separated by PFGE and visualizedby ethidium bromide staining. Arrows illustrate rear-ranged chromosomes. (B) Southern blot of the PFGEshown inAhybridizedwith a probe against the essentialgene PCM1 on chromosome 5. (C ) Fraction of the CanR
colonies that grew on plates containing both canavanineand 5-fluoroorotic acid (5-FOA), selecting for loss ofCAN1 andURA3 functions, events thatwere previouslycharacterized as GCRs (Chen and Kolodner 1999). Thepercentages were derived from n >2500 CanR coloniesfor each genotype and day and fromN= 5–6 independentcultures per genotype. (Top panel) A scheme of the re-gion bearing the CAN1 and URA3 reporter genes isshown. (D) Types of mutations found by sequencingthe CAN1 gene of CanR colonies. (E) CanR colonies ofthe indicated genotypes were tested for the ability to ar-rest inG2/M following exposure to 300µg/mLzeocin for3.5h.Data arepresentedas themeans± SD. (F )Model forthe emergence of checkpoint activation-proficientadapted cells with persistent DNA damage. Upon telo-merase inactivation, theDNAdamage checkpoint is ac-tivated in response to telomere replication defects ortelomere shortening (red cells), which interrupts cellproliferation and results in their progressive dilution inthe population. Even if DNA repair fails, the cells mayundergo adaptation by bypassing downstream check-point signaling. The proliferation capacity of these line-ages is thus extended despite the persistence of theinitial damage or repair intermediates. Some genomevariants may arise that result in viable progeny. Seealso Supplemental Figure S7.
Coutelier et al.
10 GENES & DEVELOPMENT
Cold Spring Harbor Laboratory Press on November 21, 2018 - Published by genesdev.cshlp.orgDownloaded from

majority of prolonged arrests (∼80%), Rad9 phosphoryla-tion was maintained at high levels through the next cellcycle, as expected after adaptation (Donnianni et al.2010; Vidanes et al. 2010). The remaining prolonged ar-rests (∼20%) were followed immediately by a cell cyclein which the checkpoint reporter signal returned to basallevels, consistent with recovery after repair of the initialDNA damage. The two independent approaches led tosimilar estimates of the fraction of prolonged nonterminalarrests followedbyadaptation (∼80%).Taken together, theresults revealed that adaptation occurred in telomerase-negative cells at a frequency of ∼2%–7% of all cell divi-sions and therefore contributed substantially to the kinet-ics of senescence.Adaptation has been observed previously in response to
various mechanisms of DNA damage, including an endo-nuclease-induced single DSB, DSB-inducing drugs (e.g.,zeocin), replication-inhibiting drugs (e.g., aphidicolin),and ionizing radiation (SerranoandD’Amours 2014).How-ever, not all DNA damages can support adaptation; for in-stance, cells experiencing two inducedDSBs cannot adapt,suggesting that adaptation relies on a quantitative and/orqualitative assessment of the initial damage by the cell(Lee et al. 1998b). In contrast, telomeres lacking functionalCdc13 accumulate large amounts of ssDNA, trigger a po-tentDNAdamagecheckpoint activation, andcan still sup-port adaptation (Garvik et al. 1995; Toczyski et al. 1997).Furthermore, Cdc13-independent survivor cells requirefactors involved in adaptation (Mersaoui et al. 2015). Ourresults add critically short and/or broken telomeres result-ing simply from telomerase deficiency to the list of DNAdamage mechanisms that can lead to adaptation.We found that some telomerase-negative lineages out-
lived their first prolonged arrest by many generations (upto 33, representing ∼9 billion cells in the progeny) (Fig.5). Several scenarios might explain such longevity in thefaceof persistentDNAdamage. First, a different set of telo-mere repair mechanisms might be available in a subse-quent cell cycle to repair the dysfunctional telomeresthat elicited the prolonged arrest. Second, adaptationmight result in at least temporarydeficiency incheckpointactivation events downstream from Rad9 phosphoryla-tion. Third, consecutive adaptation events might occur,which is plausible in the case of critically short telomeresbecause theyare not lethal per se. If so, thiswould raise thequestion of whether the first adaptation event could favoror even accelerate subsequent ones, perhaps through apriming mechanism or simply because adaptation-pro-moting factors such as Cdc5 would already be present athigh levels. In this context, the initial telomeric damageand subsequent genome rearrangementsmight be less det-rimental to cell growth than other chromosomal breaksleading to loss of essential genes, for instance.In adaptation-deficient strains, the mutation rate was
approximately twofold lower than inadaptation-proficientstrains at senescence crisis (Figs. 6, 7). Several non-mutual-ly exclusive mechanisms have been suggested to explaingenome instability in senescence. Dysfunctional or shorttelomeres can lead to extensive resection and end degrada-tion, which would initiate genome instability close to
chromosomeends (Garviket al. 1995;Hackett andGreider2003; Fallet et al. 2014). Exposed ssDNA or telomere-freeends can also cause global genome instability by recombi-nation with homologous sequences or telomere fusionsand subsequent breakage–fusion–bridge cycles (Murnane2006). Alternatively, sister dysfunctional/short telomerescan fuse, perhaps through faulty replication and fork clo-sure, and form dicentric or other types of unstable chro-mosomes (Beyer and Weinert 2016). In addition, repairattempts may leave toxic or unstable repair intermediatessuchashalf crossover-initiatedcascades, asobservedwhenbreak-induced replication is ineffective (Vasan et al. 2014).Resolution of chromosomal instability by successive re-combination and breakage events overmany cell divisionsmay then spread genome instability across chromosomes.The possibility that the stabilization of the genome spansover several cell divisions is consistentwith the nontermi-nal arrests thatwe describe, which increase the chances ofsubsequent arrests, as we noticed previously (Xu et al.2015). We thus propose that, although adaptation doesnot change DNA repair options or mechanisms, it couldbe an important mechanism to force mitosis in cells thatmight otherwise be permanently arrested, thus promotingprogress toward resolution of the instability.In conclusion, the role of adaptation in senescence de-
scribed here may have implications for understanding ofthe early steps of tumorigenesis. We provide a plausiblescenario through which mutations and genome instabili-ty in general, key enabling characteristics of cancer, canarise in the absence of prior mutations, since telomeraseis physiologically repressed in the vastmajority of somaticcells in humans. This scenario is consistent with evidenceof telomere exhaustion, checkpoint activation, and ge-nome instability found in precancerous lesions (Artandiand DePinho 2010; Hanahan andWeinberg 2011). In addi-tion, because senescent cells accumulatewith age (Jeyapa-lan et al. 2007), adaptation to telomere signaling could beinvolved in the association between an increased risk ofcancer and age.
Materials and methods
Yeast strains
All yeast strains used in this study have a W303 background cor-rected for RAD5 and ADE2 (rad5-535 and ade2-1 in the originalstrain) (see Supplemental Table S1).
Terminal restriction Southern blot analysis
Genomic DNAwas extracted from cultures using a standard phe-nol:chloroform:isoamyl (25:24:1) purification procedure and iso-propanol precipitation. A sample of 500 ng of genomic DNAwas digestedwithXhoI, and the productswere ethanol-precipitat-ed, resuspended in loading buffer (gel loading dye, Purple 6X,NewEnglandBiolabs), and resolved on a 1%agarose gel for 4 h at 150V.The gelwas then soaked in a denaturation bath (0.4MNaOH, 1MNaCl) for 20 min and transferred by capillary action to a chargednylon membrane (Hybond XL, GE Healthcare). The telomere-specific oligonucleotide probe (5′-GGGTGTGGGTGTGTGTGGTGGG-3′) was 32P-labeled at the 5′ terminus with ATP (γ-32P)
Adaptation in telomerase-negative cells
GENES & DEVELOPMENT 11
Cold Spring Harbor Laboratory Press on November 21, 2018 - Published by genesdev.cshlp.orgDownloaded from

using T4 polynucleotide kinase (New England Biolabs). Themembrane was then hybridized using the Rapid-hyb buffer proto-col (GEHealthcare). In brief, themembranewas prehybridized for1 h at 42°C in Rapid-hyb buffer, 20 pmol of the radioactive probewas added, and the incubation was continued for 1 h. The mem-brane was washed consecutively with 5× SSC and 0.5% SDS for10 min at 42°C, 5× SSC and 0.1% SDS for 20 min at 42°C, and1× SSC and 0.1% SDS for 30 min at 25°C. The membrane wasthen imaged with a Typhoon FLA 9500 scanner (GE Healthcare).
SDS-PAGE and Western blot analysis
Aliquots of 5 × 10⁷ cells were harvested by centrifugation. Thepellets were lysed in 0.2 MNaOH for 10 min on ice, and proteinswere precipitated by the addition of 50 µL of 50% trichloroaceticacid. The samples were centrifuged at 16,100g for 10 min at 4°C,and the pelletswere resuspended in 4× Laemmli buffer and heatedfor 5 min at 95°C. Samples were separated in a denaturing 7.5%37.5:1 polyacrylamide gel, and proteins were transferred to a ni-trocellulose membrane (Amersham Protran 0.45 NC, GE Health-care). The membranes were stained with Ponceau Red andimmunoblotted with anti-Rad53 primary antibody (Abcam,EL7.E1) that recognizes both the unphosphorylated and phos-phorylated forms of Rad53. Blots were then incubated with ahorseradish peroxidase-coupled secondary antibody, and the sig-nal was detected using ECL reagent (Amersham, GE Healthcare).
Recombination efficiency measurement
The recombination efficiency measurement upon induction of asingle DSB was performed as described (Batte et al. 2017). Briefly,the yeast strains were grown overnight in rich medium contain-ing 2% lactate, 3% glycerol, and 0.05% glucose; counted; andthen plated on 2% galactose plates to induce I-Sce I expressionand on 2% glucose plates to normalize the cell count and platingefficiency.
PFGE
To prepare DNA samples for PFGE, exponentially growing cellswere harvested, washed in 10 mM Tris-HCl and 50 mM EDTA(pH 8.0), and cast in plugs of 0.56% low-melting-point agarose(MP Biomedicals) in 50 mM potassium phosphate and 50 mMEDTA (pH 7.0). Plugs were incubated in the same buffer contain-ing 10 mM dithiothreitol and 0.4 mg/mL Zymolyase 20T (Seika-gaku) for 24 h at 37°C. The solution was then replaced with10mMTris-HCl (pH 8.0) containing 50mMEDTA, 1% sarkosyl,and 2 mg/mL proteinase K (New England Biolabs), and the plugswere incubated for 24 h at 50°C. After extensive washing with10mMTris-HCl and 50mMEDTA (pH 8.0), the plugs were load-ed into thewells of a 0.9% agarose gel (SeakemGold, Ozyme) andelectrophoresed at 13°C in a rotating PFGE apparatus (Rotaphor6.0, Biometra) according to the manufacturer’s instructions forseparation of S. cerevisiae chromosomes. DNA was visualizedby staining with 0.5 µg/mL ethidium bromide under UV illumi-nation (Gel Doc, Bio-Rad).
Fluctuation assay for mutation rate estimation
Cells bearing the TetO2-TLC1 construct and the endogenousCAN1 gene were used for this assay. Five independent clones ofeach genotype (wild-type, cdc5-ad, and tid1Δ) were selected,grown in 5 or 10 mL of medium containing 30 µg/mL dox for22 h at 30°C, and counted. Samples of 200–500 cells were platedon standard (control) YPD plates, and 107 or 108 cells were plated
on synthetic complete medium-containing 2% glucose (SD)plates lacking arginine and supplemented with 60 µg/mL canava-nine. Each day, the liquid cultures were diluted to 1 × 10⁴ cells permilliliter. Plates were incubated for 48 h at 30°C, and the colonieswere counted. The number of CanR colonies growing on the can-avanine plates gives a value r corresponding to the number ofmu-tants. The colony count on the control YPD plates was forcorrection of the cell number added to the canavanine plates.From the r values of the five independent cultures, which theoret-ically follows the Luria and Delbrück distribution, the mutationrate was estimated using the maximum likelihood method (MSSalgorithm) (Sarkar et al. 1992; Foster 2006). This algorithm isbased on the Lea and Coulson function that gives the differentterms (pr)r≥0 of the Luria and Delbrück distribution for a givennumber of mutations m:
p0 = e−m; pr = mr
∑r−1
i=0
pi(r− i+ 1)
,
where (pr)r≥0 is the probability of obtaining a culture containing rmutants from a number of mutationsm. To estimate the value ofm that best fits the probability (pr)r≥0 from the experimentalmea-sure of r, the algorithm maximizes the likelihood function f :
f(r|m) =∏C
i=1
f(ri|m),
where f (r∣m) =pr , andC is the number of cultures. After obtainingan estimated value ofm, a correction was applied to take into ac-count that only a fraction of the culture was used to estimate thenumber ofmutants, whichwould lead to a sampling bias ofmact =mobs[(z−1)/zln(z)] , where mact is the corrected number of mu-tants, mobs is the number of mutants before correction, and z isthe fraction of plated cells. The mutation rate was then obtainedby dividing mact by the total number of cells in the culture.The 95% confidence interval (mdown,mup) of mact was estimat-
ed according to the Stewart method (Stewart 1994; Foster 2006):mup = exp[ln(mact) + 1.96σ(e
1.96σ)−0.315] and mdown = exp[ln(mact)−1.96σ(e1.96σ)+0.315], where σ is the standard deviation of ln(mact),calculated with the following approximation:
s ≈ 1.225m−0.315���C
√ ,
where C is the number of cultures. Finally, mup and mdown weredivided by the average total number of cells in the cultures to ob-tain the 95% confidence interval of the estimated mutation rate.
Microfluidic experiments
The microfluidic mold was fabricated using standard soft lithog-raphy techniques as described (Fehrmann et al. 2013). Epoxy rep-licates of the mold were used to make the chips. To cast the chip,polydimethylsiloxane (PDMS; Sylgard 184) and curing agentweremixed in a 10:1 ratio, degassed with a vacuum pump for 30 min,and poured into the mold. The PDMSwas cured by baking for 5 hat 70°C and then carefully removed from the mold. A biopsypuncher (1.5mm;Harris Unicore) was used to create holes to con-nect the tubing. The PDMS and a glass coverslip (24 × 50 mm)were surface-activated by plasma (Diener Electronic) to covalent-ly bond the two parts. SD medium was filtered using a 0.22-µmpolyethersulfone filter (Millipore) and loaded into the deviceusing a peristaltic pump (IPCN, Ismatec). Cells from a log-phaseculture (OD600 = 0.5) were gently injected into the device usinga 1-mL syringe. A constant medium flow (28 µL/min) was main-tained throughout the experiment. For experiments with strainsexpressing the TetO2-TLC1 construct, cells were allowed to
Coutelier et al.
12 GENES & DEVELOPMENT
Cold Spring Harbor Laboratory Press on November 21, 2018 - Published by genesdev.cshlp.orgDownloaded from

divide and invade the cavities for 12–24 h before themediumwasswitched to SD containing 30 µg/mL dox.
Time-lapse and fluorescence microscopy
Cells in the microfluidic device were imaged using a fully motor-ized Axio Observer Z1 inverted microscope (Zeiss) with a 100×immersion objective, a Hamamatsu Orca R2 camera, and cons-tant focusmaintainedwith focus stabilization hardware (Definitefocus, Zeiss). To minimize phototoxicity, we used light-emittingdiode light sources for both phase contrast and fluorescence imag-es (Colibri 2, Zeiss) with the following settings: for standardmicrofluidic time-lapse experiments, 4.0 V for 70 msec; fortime-lapse experiments using the FHA1-mCherry/Hta2-yECFPreporters, 3.0 V for 40 msec; and for phase contrast, 10% of max-imum intensity for 200 msec for the CFP channel and 15% ofmaximum intensity for 500 msec for the mCherry channel,with 2 ×2 binning in all three. The temperature was maintainedat 30°Cwith a controlled heating unit and an incubation chamberthat held the entire microscope base, including the stage and theobjectives. Images were acquired every 10 min using Zen soft-ware (Zeiss). All aspects of image acquisition were fully automat-ed and controlled, including temperature, focus, stage position,and time-lapse imaging. Images were acquired for up to 120 h instandard experiments. Static fluorescence microscopy experi-ments using the FHA1-mCherry reporter were performed withthe following settings: 4.0 V for 70 msec for phase contrast,100% intensity for 300 msec for the CFP channel, and 100% in-tensity for 1000 msec for the mCherry channel without binning.Ddc2-eGFP was detected similarly with the GFP filter (100% in-tensity for 400 msec). For the experiment using the single induc-ible HO cut in Supplemental Figure S4, B and C, live-cell imageswere acquired at the indicated time points after induction using awide-field inverted microscope (Leica, DMI-6000B) equippedwith adaptive focus control to eliminate Z drift, a 100×/1.4 NAimmersion objective with a Prior NanoScanZ NanopositioningPiezo Z stage system, a CMOS camera (ORCA-Flash 4.0, Hama-matsu), and a solid-state light source (SpectraX, Lumencore).The system was piloted by MetaMorph software (Molecular De-vices). Fifteen focal steps of 0.25 µm were acquired sequentiallyfor CFP, YFP, and mCherry, with an exposure time of 100 msecusing solid state 434-, 475-, and 575-nm diodes and appropriatefilters (GFP-mCherry filter: excitation double BP, 450–490/550–590 nm and dichroic double BP 500–550/600–665 nm; ECFP/EYFP/mCherry filter: excitation triple BP 420–450/490–515/560–590 and dichroic triple BP 455–485/520–550/600–670; Chro-ma Technology Corp.).
Image analysis and single-cell lineage tracking
Custom software written in Matlab, phyloCell 2.1 was used tosegment and track cells and assign mother–daughter links.Time-lapse images were exported as high-resolution TIF filesand analyzed with the graphical user interface of phyloCell. Fordetails about the routines and algorithms implemented in phylo-Cell, see Fehrmann et al. (2013). In contrast to Fehrmann et al.(2013), the cell at the tip of the cavity would frequently be re-placed by its daughter cell, which was intended in our approach.To efficiently track such lineages, in which we frequentlyswitched focus from a given cell to its daughter cell, the time-lapse images were retrospectively analyzed starting from thelast image. This avoided tracking of lineages in which the cellswere ejected from the microcavity. In experiments involvingthe FHA1-mCherry/Hta2-yECFP reporter, the nucleus was seg-mented using the CFP channel with an Otsu threshold method,and the cell was segmentedwith either phyloCell formicrofluidic
experiments or a custom watershed-based method for phase con-trast images. The nuclear mCherry signal was measured in theoverlap of the cellular and nuclear masks and averaged over themeasured area of the nucleus. For the experiment using the singleinducible HO cut, image analysis was performed on the medianslice of each image. Nuclei were segmented based on the CFP sig-nal (automatic Otsu threshold), and the mean mCherry intensitywas measured for each nucleus using Fiji software (Schindelinet al. 2012).
Checkpoint activation reporter system
The checkpoint activation reporter systemconsisted of theRad53FHA1 domain coupled to mCherry and the nuclear marker Hta2-yECFP. A codon-shuffled sequence encoding the Rad53 FHA1domain (amino acids 14–164) flanked by two 15-amino-acid link-ers was cloned into a pSIV URA3 vector under the pRPS20 pro-moter and fused with mCherry (pNM66) (Wosika et al. 2016).For Supplemental Figure S4, B and C, the wild-type and H75Amutant versions of FHA1were cloned into the pSIVURA3 vectorunder the pRPL24A promoter (pNM65 and pNM142). BstBI-digested fragments of these plasmids were then transformedinto the strains of interest and inserted into the URA3 locus.The endogenous HTA2 gene was tagged with yECFP-Kan ampli-fied from the pKT102 plasmid (Sheff and Thorn 2004).
Computational and statistical analyses
All computational and statistical analyses were performed withthe statistical toolbox of Matlab R2013a. Data are representedas the median, first and third quartiles, 99th percentiles (boxplots), the mean±SD, or the mean and 95% confidence interval,as indicated in the legends. Differences were compared using Stu-dent’s t-test, theMann-WhineyU test, and two-sample Kolmogo-rov-Smirnov test as indicated.
Acknowledgments
We thank David Toczyski, Jim Haber, and Naïma BelgarehTouzé for yeast strains and plasmids; Pascale Jolivet, AubinFleiss, and Gilles Fischer for technical help; and Eric Vandjourfor medium preparation. We also thankmembers of M.T.T.’s lab-oratory, Miguel Ferreira, Claus Azzalin, Ted Weinert, Titia deLange, Joachim Lingner, Jim Haber, and Damien D’Amours forfruitful discussions. K.D. thanks the European Research Councilunder the European Community’s Seventh Framework Program(FP7/2007 2013/European Research Council grant agreement281287) for funding. S.P. thanks the Swiss National ScienceFoundation and the University of Lausanne for funding, andNadim Mira for technical assistance. This work was supportedby “Fondation de la Recherche Medicale” (“MTT Équipe Label-lisée”) and the French National Research Agency (ANR) as partof the “Investissements d’Avenir” Program (LabEx Dynamo)and ANR-16-CE12-0026 to M.T.T. and G.C. H.C. has been sup-ported by a doctoral grant from the Paris Sciences et Lettres(PSL) Idex program implemented by the ANR (ANR-10-IDEX-0001-02 PSL).Author contributions: Z.X. and M.T.T. conceived the study.
H.C., Z.X., S.P., G.C., K.D., and M.T.T. performed the methodol-ogy. Z.X. and G.C. were responsible for the software used. H.C.and Z.X. performed the formal analysis. H.C., Z.X., M.C.M.,M.L.-A, S.P., and K.D. performed the investigations. H.C., Z.X.,and M.T.T. wrote the original draft of the manuscript. H.C. andZ.X. visualized the study. Z.X. and M.T.T. supervised the study.
Adaptation in telomerase-negative cells
GENES & DEVELOPMENT 13
Cold Spring Harbor Laboratory Press on November 21, 2018 - Published by genesdev.cshlp.orgDownloaded from
References
Artandi SE, DePinho RA. 2000. A critical role for telomeres insuppressing and facilitating carcinogenesis. Curr Opin GenetDev 10: 39–46.
Artandi SE, DePinho RA. 2010. Telomeres and telomerase in can-cer. Carcinogenesis 31: 9–18.
Aunan JR, Cho WC, Soreide K. 2017. The biology of aging andcancer: a brief overview of shared and divergent molecularhallmarks. Aging Dis 8: 628–642.
Batte A, Brocas C, Bordelet H, Hocher A, RuaultM, Adjiri A, Tad-dei A, Dubrana K. 2017. Recombination at subtelomeres isregulated by physical distance, double-strand break resectionand chromatin status. EMBO J 36: 2609–2625.
Beyer T, Weinert T. 2016. Ontogeny of unstable chromosomesgenerated by telomere error in budding yeast. PLoS Genet12: e1006345.
Blasco MA, Lee HW, Hande MP, Samper E, Lansdorp PM,DePinho RA, Greider CW. 1997. Telomere shortening and tu-mor formation by mouse cells lacking telomerase RNA. Cell91: 25–34.
Campisi J, d’Adda di Fagagna F. 2007. Cellular senescence: whenbad things happen to good cells. Nat Rev Mol Cell Biol 8:729–740.
Carneiro MC, de Castro IP, Ferreira MG. 2016. Telomeres in ag-ing and disease: lessons from zebrafish. Dis Model Mech 9:737–748.
ChenC, Kolodner RD. 1999. Gross chromosomal rearrangementsin Saccharomyces cerevisiae replication and recombinationdefective mutants. Nat Genet 23: 81–85.
Chen C, Umezu K, Kolodner RD. 1998. Chromosomal rearrange-ments occur in S. cerevisiae rfa1mutator mutants due to mu-tagenic lesions processed by double-strand-break repair. MolCell 2: 9–22.
Chin L, Artandi SE, Shen Q, Tam A, Lee SL, Gottlieb GJ, GreiderCW, DePinho RA. 1999. p53 deficiency rescues the adverse ef-fects of telomere loss and cooperates with telomere dysfunc-tion to accelerate carcinogenesis. Cell 97: 527–538.
ClericiM, Trovesi C,Galbiati A, LucchiniG, LongheseMP. 2014.Mec1/ATR regulates the generation of single-stranded DNAthat attenuates Tel1/ATM signaling at DNA ends. EMBO J33: 198–216.
d’Adda di Fagagna F, Reaper PM,Clay-Farrace L, FieglerH, Carr P,Von Zglinicki T, Saretzki G, Carter NP, Jackson SP. 2003. ADNA damage checkpoint response in telomere-initiated sen-escence. Nature 426: 194–198.
Donnianni RA, Ferrari M, Lazzaro F, Clerici M, TamilselvanNachimuthu B, Plevani P, Muzi-Falconi M, Pellicioli A.2010. Elevated levels of the polo kinase Cdc5 override theMec1/ATR checkpoint in budding yeast by acting at differentsteps of the signaling pathway. PLoS Genet 6: e1000763.
Durocher D, Henckel J, Fersht AR, Jackson SP. 1999. The FHAdomain is a modular phosphopeptide recognition motif. MolCell 4: 387–394.
Emili A. 1998. MEC1-dependent phosphorylation of Rad9p in re-sponse to DNA damage. Mol Cell 2: 183–189.
Enomoto S, Glowczewski L, Berman J. 2002. MEC3, MEC1, andDDC2 are essential components of a telomere checkpointpathway required for cell cycle arrest during senescence inSaccharomyces cerevisiae. Mol Biol Cell 13: 2626–2638.
Fallet E, Jolivet P, Soudet J, LisbyM,Gilson E, TeixeiraMT. 2014.Length-dependent processing of telomeres in the absence oftelomerase. Nucleic Acids Res 42: 3648–3665.
Fehrmann S, Paoletti C, Goulev Y, Ungureanu A, Aguilaniu H,Charvin G. 2013. Aging yeast cells undergo a sharp entry
into senescence unrelated to the loss of mitochondrial mem-brane potential. Cell Rep 5: 1589–1599.
Foster PL. 2006. Methods for determining spontaneous mutationrates. Methods Enzymol 409: 195–213.
Galgoczy DJ, Toczyski DP. 2001. Checkpoint adaptation pre-cedes spontaneous and damage-induced genomic instabilityin yeast. Mol Cell Biol 21: 1710–1718.
Garvik B, CarsonM, Hartwell L. 1995. Single-strandedDNA aris-ing at telomeres in cdc13 mutants may constitute a specificsignal for the RAD9 checkpoint.Mol Cell Biol 15: 6128–6138.
Gonzalez-Garcia MP, Pavelescu I, Canela A, Sevillano X, LeehyKA,NelsonAD, IbanesM, ShippenDE, BlascoMA,Cano-Del-gado AI. 2015. Single-cell telomere-length quantification cou-ples telomere length to meristem activity and stem celldevelopment in Arabidopsis. Cell Rep 11: 977–989.
Greider CW. 1998. Telomeres and senescence: the history, the ex-periment, the future. Curr Biol 8: R178–R181.
Hackett JA, Greider CW. 2003. End resection initiates genomicinstability in the absence of telomerase. Mol Cell Biol 23:8450–8461.
Hackett JA, Feldser DM, Greider CW. 2001. Telomere dysfunc-tion increases mutation rate and genomic instability. Cell106: 275–286.
Hanahan D, Weinberg RA. 2000. The hallmarks of cancer. Cell100: 57–70.
Hanahan D, Weinberg RA. 2011. Hallmarks of cancer: the nextgeneration. Cell 144: 646–674.
Harrison JC, Haber JE. 2006. Surviving the breakup: the DNAdamage checkpoint. Annu Rev Genet 40: 209–235.
Herbig U, Ferreira M, Condel L, Carey D, Sedivy JM. 2006. Cellu-lar senescence in aging primates. Science 311: 1257.
IjpmaAS,Greider CW. 2003. Short telomeres induce aDNAdam-age response in Saccharomyces cerevisiae. Mol Biol Cell 14:987–1001.
Jain D, Cooper JP. 2010. Telomeric strategies: means to an end.Annu Rev Genet 44: 243–269.
Jeyapalan JC, Ferreira M, Sedivy JM, Herbig U. 2007. Accumula-tion of senescent cells in mitotic tissue of aging primates.Mech Ageing Dev 128: 36–44.
KalsbeekD, GolsteynRM. 2017. G2/M-phase checkpoint adapta-tion and micronuclei formation as mechanisms that contrib-ute to genomic instability in human cells. Int J Mol Sci 18:E2344.
Kaye JA, Melo JA, Cheung SK, Vaze MB, Haber JE, Toczyski DP.2004. DNA breaks promote genomic instability by impedingproper chromosome segregation. Curr Biol 14: 2096–2106.
Lea DE, Coulson CA. 1949. The distribution of the numbers ofmutants in bacterial populations. J Genet 49: 264–285.
Lee HW, Blasco MA, Gottlieb GJ, Horner JW II, Greider CW,DePinho RA. 1998a. Essential role of mouse telomerase inhighly proliferative organs. Nature 392: 569–574.
Lee SE, Moore JK, Holmes A, Umezu K, Kolodner RD, Haber JE.1998b. Saccharomyces Ku70, mre11/rad50 and RPA proteinsregulate adaptation to G2/M arrest after DNA damage. Cell94: 399–409.
Lee SE, Pellicioli A, Malkova A, Foiani M, Haber JE. 2001. TheSaccharomyces recombination protein Tid1p is required foradaptation from G2/M arrest induced by a double-strandbreak. Curr Biol 11: 1053–1057.
Leroy C, Lee SE, Vaze MB, Ochsenbien F, Guerois R, Haber JE,Marsolier-Kergoat MC. 2003. PP2C phosphatases Ptc2 andPtc3 are required forDNAcheckpoint inactivation after a dou-ble-strand break. Mol Cell 11: 827–835.
Coutelier et al.
14 GENES & DEVELOPMENT
Cold Spring Harbor Laboratory Press on November 21, 2018 - Published by genesdev.cshlp.orgDownloaded from

Lingner J, Cooper JP, Cech TR. 1995. Telomerase and DNA endreplication: no longer a lagging strand problem? Science 269:1533–1534.
Lundblad V, Blackburn EH. 1993. An alternative pathway foryeast telomere maintenance rescues est1− senescence. Cell73: 347–360.
Lundblad V, Szostak JW. 1989. A mutant with a defect in telo-mere elongation leads to senescence in yeast. Cell 57:633–643.
Lydall D, Weinert T. 1995. Yeast checkpoint genes in DNA dam-age processing: implications for repair and arrest. Science 270:1488–1491.
Maciejowski J, de Lange T. 2017. Telomeres in cancer: tumoursuppression and genome instability. Nat Rev Mol Cell Biol18: 175–186.
Maciejowski J, Li Y, Bosco N, Campbell PJ, de Lange T. 2015.Chromothripsis and kataegis induced by telomere crisis.Cell 163: 1641–1654.
Malkova A, Naylor ML, Yamaguchi M, Ira G, Haber JE. 2005.RAD51-dependent break-induced replication differs in kinet-ics and checkpoint responses from RAD51-mediated geneconversion. Mol Cell Biol 25: 933–944.
Melo JA, Cohen J, Toczyski DP. 2001. Two checkpoint complex-es are independently recruited to sites ofDNAdamage in vivo.Genes Dev 15: 2809–2821.
Mersaoui SY, Gravel S, Karpov V, Wellinger RJ. 2015. DNA dam-age checkpoint adaptation genes are required for division ofcells harbouring eroded telomeres. Microb Cell 2: 394–405.
Murnane JP. 2006. Telomeres and chromosome instability.DNARepair 5: 1082–1092.
Pardo B, Marcand S. 2005. Rap1 prevents telomere fusions bynonhomologous end joining. EMBO J 24: 3117–3127.
Paschini M, Toro TB, Lubin JW, Braunstein-Ballew B, Morris DK,Lundblad V. 2012. A naturally thermolabile activity compro-mises genetic analysis of telomere function in Saccharomycescerevisiae. Genetics 191: 79–93.
Pellicioli A, Lee SE, Lucca C, Foiani M, Haber JE. 2001. Regula-tion of Saccharomyces Rad53 checkpoint kinase during adap-tation from DNA damage-induced G2/M arrest. Mol Cell 7:293–300.
Pobiega S, Marcand S. 2010. Dicentric breakage at telomere fu-sions. Genes Dev 24: 720–733.
Sandell LL, Zakian VA. 1993. Loss of a yeast telomere: arrest, re-covery, and chromosome loss. Cell 75: 729–739.
Sarkar S, Ma WT, Sandri GH. 1992. On fluctuation analysis: anew, simple and efficient method for computing the expectednumber of mutants. Genetica 85: 173–179.
Schindelin J, Arganda-Carreras I, Frise E, Kaynig V, Longair M,Pietzsch T, Preibisch S, Rueden C, Saalfeld S, Schmid B,et al. 2012. Fiji: an open-source platform for biological-imageanalysis. Nat Methods 9: 676–682.
SchwartzMF, Duong JK, Sun Z,Morrow JS, Pradhan D, Stern DF.2002. Rad9 phosphorylation sites couple Rad53 to the Saccha-romyces cerevisiae DNA damage checkpoint. Mol Cell 9:1055–1065.
Serrano D, D’Amours D. 2014. When genome integrity and cellcycle decisions collide: roles of polo kinases in cellular adapta-tion to DNA damage. Syst Synth Biol 8: 195–203.
Shah PP, Zheng X, Epshtein A, Carey JN, Bishop DK, Klein HL.2010. Swi2/Snf2-related translocases prevent accumulationof toxic Rad51 complexes during mitotic growth. Mol Cell39: 862–872.
Shay JW, Reddel RR, Wright WE. 2012. Cancer. Cancer and telo-meres—an ALTernative to telomerase. Science 336: 1388–1390.
Sheff MA, Thorn KS. 2004. Optimized cassettes for fluorescentprotein tagging in Saccharomyces cerevisiae. Yeast 21: 661–670.
Soudet J, Jolivet P, Teixeira MT. 2014. Elucidation of the DNAend-replication problem in Saccharomyces cerevisiae. MolCell 53: 954–964.
Stewart FM. 1994. Fluctuation tests: how reliable are the esti-mates of mutation rates? Genetics 137: 1139–1146.
Suram A, Herbig U. 2014. The replicometer is broken: telomeresactivate cellular senescence in response to genotoxic stresses.Aging Cell 13: 780–786.
Sweeney FD, Yang F, Chi A, Shabanowitz J, Hunt DF, DurocherD. 2005. Saccharomyces cerevisiae Rad9 acts as a Mec1 adap-tor to allow Rad53 activation. Curr Biol 15: 1364–1375.
Syljuasen RG, Jensen S, Bartek J, Lukas J. 2006. Adaptation to theionizing radiation-induced G2 checkpoint occurs in humancells and depends on checkpoint kinase 1 and Polo-like kinase1 kinases. Cancer Res 66: 10253–10257.
TeixeiraMT. 2013. Saccharomyces cerevisiae as amodel to studyreplicative senescence triggered by telomere shortening. FrontOncol 3: 101.
Toczyski DP, Galgoczy DJ, Hartwell LH. 1997. CDC5 and CKIIcontrol adaptation to the yeast DNA damage checkpoint.Cell 90: 1097–1106.
Vasan S, DeemA, Ramakrishnan S, Argueso JL,MalkovaA. 2014.Cascades of genetic instability resulting from compromisedbreak-induced replication. PLoS Genet 10: e1004119.
Vialard JE, Gilbert CS, Green CM, Lowndes NF. 1998. The bud-ding yeast Rad9 checkpoint protein is subjected to Mec1/Tel1-dependent hyperphosphorylation and interacts withRad53 after DNA damage. EMBO J 17: 5679–5688.
Vidanes GM, Sweeney FD, Galicia S, Cheung S, Doyle JP, Dur-ocher D, Toczyski DP. 2010. CDC5 inhibits the hyperphos-phorylation of the checkpoint kinase Rad53, leading tocheckpoint adaptation. PLoS Biol 8: e1000286.
Wosika V, Durandau E, Varidel C, Aymoz D, Schmitt M, Pelet S.2016. New families of single integration vectors and gene tag-ging plasmids for geneticmanipulations in budding yeast.MolGenet Genomics 291: 2231–2240.
Wu RA, Upton HE, Vogan JM, Collins K. 2017. Telomerasemechanism of telomere synthesis. Annu Rev Biochem 86:439–460.
Xu Z, Fallet E, Paoletti C, Fehrmann S, Charvin G, TeixeiraMT. 2015. Two routes to senescence revealed by real-timeanalysis of telomerase-negative single lineages.Nat Commun6: 7680.
Adaptation in telomerase-negative cells
GENES & DEVELOPMENT 15
Cold Spring Harbor Laboratory Press on November 21, 2018 - Published by genesdev.cshlp.orgDownloaded from

10.1101/gad.318485.118Access the most recent version at doi: published online November 21, 2018Genes Dev.
Héloïse Coutelier, Zhou Xu, Mony Chenda Morisse, et al. telomerase-negative cells promotes genome instabilityAdaptation to DNA damage checkpoint in senescent
Material
Supplemental
http://genesdev.cshlp.org/content/suppl/2018/11/21/gad.318485.118.DC1
Published online November 21, 2018 in advance of the full issue.
License
Commons Creative
.http://creativecommons.org/licenses/by-nc/4.0/License (Attribution-NonCommercial 4.0 International), as described at
, is available under a Creative CommonsGenes & DevelopmentThis article, published in
ServiceEmail Alerting
click here.right corner of the article or
Receive free email alerts when new articles cite this article - sign up in the box at the top
Published by © 2018 Coutelier et al.; Published by Cold Spring Harbor Laboratory Press
Cold Spring Harbor Laboratory Press on November 21, 2018 - Published by genesdev.cshlp.orgDownloaded from