adaptation to climate in widespread eucalypt...
TRANSCRIPT
Margaret Byrne, Suzanne Prober, Liz McLean, Dorothy Steane, William Stock, Brad Potts and Rene Vaillancourt
Adaptation to climate in widespread Eucalypt speciesFinal Report


ADAPTATION TO CLIMATE IN WIDESPREAD EUCALYPT SPECIES
Climate-resilient revegetation of multi-use landscapes: exploiting genetic variability in
widespread species
AUTHORS
Margaret Byrne – Department of Environment and Conservation
Suzanne Prober – CSIRO Ecosystem Sciences
Liz McLean – Department of Environment and Conservation
Dorothy Steane – University of Tasmania
William Stock – Edith Cowan University
Brad Potts – University of Tasmania
Rene Vaillancourt – University of Tasmania

Published by the National Climate Change Adaptation Research Facility
ISBN: 978-921609-98-5 NCCARF Publication 27/13
© 2013 The State of Western Australia and the National Climate Change Adaptation Research Facility
This work is copyright. Apart from any use as permitted under the Copyright Act 1968, no part may be reproduced by any process without prior written permission from the copyright holder.
Please cite this report as: Byrne, M, Prober, S, McLean, E, Steane, D, Stock, W, Potts, B, Vaillancourt, R 2013 Adaptation to climate in widespread eucalypt species, National Climate Change Adaptation Research Facility, Gold Coast, pp. 86.
Acknowledgement: This work was carried out with financial support from the Australian Government (Department of Climate Change and Energy Efficiency) and the National Climate Change Adaptation Research Facility.
The role of NCCARF is to lead the research community in a national interdisciplinary effort to generate the information needed by decision-makers in government, business and in vulnerable sectors and communities to manage the risk of climate change impacts.
We thank the Reference Group for their engagement and advice in regard to the operation and effectiveness of this work undertaken in this project: Gary Howling (Great Eastern Ranges Initiative), David Freudenberger (Greening Australia), Neil Riches (WA State NRM), Richard Mazanec (DEC WA).
We thank the following people for their generous assistance with this project: David Bush (CSIRO) for access and information on trials and E. tricarpa wild collection sites, Shane Lavell and Paul Turnbull (DSE Victoria) for access to trials and practical assistance with trial sampling, Martyn Lavery (Arianda Seed) for advice and sample collection at the wild E. tricarpa sites, Craig Macfarlane (CSIRO) for advice and practical assistance with leaf measurements, Paul Tilyard for assistance with genetic data analysis, Nat Raisbeck-Brown (CSIRO) for GIS, climate data and fieldwork, Gay Blake, Georg Wiehl and Didier Alanoix (DEC WA/CSIRO) for fieldwork and laboratory work, Anne Rick for information on E. salubris populations and field assistance. We thank two reviewers for comments on a draft of this report.
Disclaimer: The views expressed herein are not necessarily the views of the Commonwealth or NCCARF, and neither the Commonwealth nor NCCARF accept responsibility for information or advice contained herein.
Cover image © 2010 Tatiana Gerus

TABLE OF CONTENTS ABSTRACT .................................................................................................................. 1
EXECUTIVE SUMMARY .............................................................................................. 2
1. OBJECTIVES OF THE RESEARCH ..................................................................... 4
2. RESEARCH ACTIVITIES AND METHODS ........................................................... 6
2.1 Eucalyptus tricarpa study sites ....................................................................... 6
2.2 Eucalyptus salubris study sites ....................................................................... 8
2.3 Climate and soil characteristics....................................................................... 9
2.4 Morphology and physiology measurements .................................................. 10
2.5 Molecular methods ....................................................................................... 11
2.5.1 Background .................................................................................................. 11
2.5.2 Method ......................................................................................................... 13
2.6 Statistical analysis ........................................................................................ 13
3. RESULTS AND OUTPUTS ................................................................................. 16
3.1 Results of Eucalyptus tricarpa study ............................................................. 16
3.1.1 Environmental variation along the gradient ................................................... 16
3.1.2 Morphology and physiology along the rainfall gradient .................................. 16
3.1.3 Variation among provenances in the common gardens ................................ 18
3.1.4 Growth rate of trees in the common gardens ................................................ 19
3.1.5 Genomic results ............................................................................................ 19
3.2 Results of Eucalyptus salubris study ............................................................. 32
3.2.1 Environmental variation along the gradient ................................................... 32
3.2.2 Morphology and physiology along the gradient ............................................. 32
3.2.3 Genomic results ............................................................................................ 36
4. DISCUSSION ...................................................................................................... 48
4.1 Functional responses to climate across the gradients ................................... 48
4.2 Genomic variation across the gradients ........................................................ 53
4.2.1 Evidence of adaptive genetic variation .......................................................... 53
4.2.2 Environmental indicators of genetic adaptation ............................................. 54
4.3 Implications for revegetation seed sourcing .................................................. 54
5. GAPS AND FUTURE RESEARCH DIRECTIONS ............................................... 58
6. REFERENCES .................................................................................................... 60
APPENDIX 1: CLIMATIC VARIABLES ...................................................................... 70
APPENDIX 2: STUDY SITE SOIL CHARACTERISTICS ........................................... 71
APPENDIX 3: ANUCLIM DRAFTSMAN PLOTS OF EUCALYPTUS TRICARPA CLIMATIC VARIABLES ............................................................................................. 73
APPENDIX 4: REGRESSION ANALYSIS OF THE ADAPTIVE GENETIC INDEX (CAP1) OF EUCALYPTUS TRICARPA AGAINST SOIL PROPERTIES. ................... 74
APPENDIX 5: ANALYSIS OF VARIANCE (ANOVA) OF PHYSIOLOGICAL/MORPHOMETRIC DATA IN WILD POPULATIONS AND FIELD TRIALS OF EUCALYPTUS TRICARPA. .................................................................... 75
APPENDIX 6: REGRESSION ANALYSIS OF PHYSIOLOGICAL/MORPHOMETRIC DATA IN WILD POPULATIONS OF EUCALYPTUS TRICARPA AGAINST THE ADAPTIVE GENETIC INDEX (CAP1). ....................................................................... 78
APPENDIX 7: REGRESSION ANALYSIS OF PHYSIOLOGICAL/MORPHOMETRIC DATA FROM EUCALYPTUS TRICARPA IN COMMON GARDEN FIELD TRIALS AT LAKE TYERS (WET TRIAL) AND HUNTLY (DRY TRIAL) AGAINST THE ADAPTIVE GENETIC INDEX (CAP1). .......................................................................................... 79
APPENDIX 8: REGRESSION ANALYSIS OF PLASTIC TRAIT DATA FROM EUCALYPTUS TRICARPA AGAINST THE ADAPTIVE GENETIC INDEX (CAP1). .. 81
APPENDIX 9: REGRESSION ANALYSIS OF THE ADAPTIVE GENETIC INDEX (CAP1) OF EUCALYPTUS TRICARPA AGAINST CLIMATIC VARIABLES. ............. 82
APPENDIX 10: ANUCLIM DRAFTSMAN PLOTS OF EUCALYPTUS SALUBRIS CLIMATIC VARIABLES ............................................................................................. 84
APPENDIX 11: REGRESSION ANALYSIS OF THE ADAPTIVE GENETIC INDEX (CAP1) OF EUCALYPTUS SALUBRIS LINEAGE 1 AGAINST CLIMATIC VARIABLES. .............................................................................................................. 85

List of Figures Figure 1: Locations of the nine study populations of Eucalyptus tricarpa (triangles), and the two common garden sites at Huntly (red circle) and Lake Tyers (blue circle) .......... 7
Figure 2: Locations of the nine study populations of Eucalyptus salubris ...................... 9
Figure 3: Relationships between functional traits of nine Eucalyptus tricarpa provenances and the mean annual precipitation (MAP) at their site of origin, when growing in two common gardens (at Huntly with 470 mm MAP, and at Lake Tyers with 840 mm MAP), and in their natural habitat (Wild) ........................................................ 17
Figure 4: Relationships between trait plasticity (relative trait range calculated from measurements taken from the two common gardens; RTR) of nine Eucalyptus tricarpa provenances, and the mean annual precipitation (MAP) at their site of origin ............. 20
Figure 5: Size of the sampled Eucalyptus tricarpa trees in the common gardens, 12 years after planting ..................................................................................................... 20
Figure 6: Principal Coordinates Analysis of Eucalyptus tricarpa DArTseq data ........... 21
Figure 7: Plot of CAP analysis of the 94 outlier DArTseq markers from Eucalyptus tricarpa and 15 climatic variables (from ANUCLIM) ..................................................... 23
Figure 8: The allele (band) frequency of three Eucalyptus tricarpa DArTseq markers showed a strong, highly significant (P < 0.001) correlation to the Aridity Index of each site. ............................................................................................................................. 26
Figure 9: Functional traits in nine Eucalyptus salubris populations, across an aridity gradient (mean annual precipitation/mean annual potential evaporation; P/PE) .......... 33
Figure 10: Relationship between leaf nitrogen content per dry mass (Nmass) and leaf lamina thickness, in nine populations of Eucalyptus salubris across an aridity gradient ................................................................................................................................... 35
Figure 11: Relationship between foliage cellulose 13C content and precipitation during the 12 months immediately prior to sampling, in nine populations of Eucalyptus salubris across an aridity gradient ............................................................................................ 36
Figure 12: Principal Coordinates Plot of the full Eucalyptus salubris DArTseq data set (268 samples, 16122 DArTseq markers) .................................................................... 37
Figure 13: Principal Coordinates Plot of the Eucalyptus salubris ‘Lineage 1’ full DArTseq data set. PCo1 accounts for 27% of the total genetic variance and separates the six provenances along a rainfall gradient. ............................................................. 38
Figure 14: A Mantel test showed that there was a strong, but only weakly significant (P = 0.025), correlation between Nei’s genetic distance and linear geographic distance of ‘Lineage 1’ provenances of Eucalyptus salubris. ......................................................... 38
Figure 15: Principal Coordinates Plot of Eucalyptus salubris ‘Lineage 1’ outlier Sal-DArTseq data set (149 samples, 18 loci) .................................................................... 39
Figure 16: CAP analysis of outlier data for Eucalyptus salubris ‘Lineage 1’................. 41
Figure 17: In Eucalyptus salubris ‘Lineage 1’, the CAP-based Aridity Index was one of a few variables that showed a strong, significant correlation with allele frequency of an
outlier locus (salDArTseq 3689) for which there was also a reasonably uniform distribution of points across the populations ................................................................ 47
Figure 18: Illustrations of various provenancing strategies for revegetation ................ 56
Figure 19: Flow diagram illustrating the decision making framework for choice of germplasm for environmental plantings. ...................................................................... 57
List of Tables Table 1: Location and mean annual climatic conditions (over the period 1925-1995; Atlas of Living Australia) of the nine study populations, and the two common garden sites of Eucalyptus tricarpa. .......................................................................................... 8
Table 2: Location and mean annual climatic conditions (over the period 1925-1995) of the nine study populations of Eucalyptus salubris ....................................................... 10
Table 3. CAP1 values and normalised site means for each ANUCLIM Climatic Variable included in a CAP analysis of Eucalyptus tricarpa.. ..................................................... 24
Table 4: Correlations between the allele frequencies of Eucalyptus tricarpa DArTseq markers and various climatic, morphological and genetic traits ................................... 27
Table 5: Environmental variables giving the best (highest R2) correlations with each of the measured traits in Eucalyptus salubris across an aridity gradient .......................... 34
Table 6: CAP1 values and normalised site means for each ANUCLIM Climatic Variable included in a CAP analysis of Eucalyptus salubris ‘Lineage 1’ .................................... 40
Table 7: Significant correlations between allele frequencies of Eucalyptus salubris DArTseq markers (in Lineage 1) and climatic, soil and physiological/morphometric traits. ........................................................................................................................... 42

Adaptation to climate in widespread eucalypt species 1
ABSTRACT
The long term success of revegetation efforts will depend upon the planted species’ resilience to climate change. Many widespread species grow across a range of climatic conditions and, thus, may possess adaptations that could be utilised to improve climate resilience of restored ecosystems. Species can achieve a widespread distribution via two main mechanisms; (1) by diverging into a series of specialised populations, or (2) through high phenotypic plasticity. The extent to which populations are specialised or plastic in response to climate will determine the seed-sourcing strategy required for optimal restoration outcomes under a changing climate. We examined genetic divergence and phenotypic plasticity in two widespread Eucalyptus species (E. tricarpa in southeastern Australia, E. salubris in southwestern Australia), to determine the nature of adaptation to climate in these species, and whether genomic screening might be a useful tool to assess climate adaptation.
We examined nine populations of each species across climate gradients and, for E. tricarpa, trees originating from the same populations were also studied in two common garden field trials. We characterised responses in functional traits relevant to climate adaptation, including leaf size, thickness, tissue density, and carbon isotope ratio (δ13C). Genetic variation was assessed with genome scans using DArTseq markers, and ‘outlier markers’ were identified as being linked to regions of the genome that are potentially under selection.
Evidence of both plastic response and genetic specialisation for climate was found in both species, indicating that widespread eucalypts utilise a combination of both mechanisms for adaptation to spatial variation in climate. The E. tricarpa common garden data suggested high plasticity in most of the measured functional traits, and the extent of plasticity in some traits (e.g. leaf size and thickness) varied among provenances, suggesting genetic variation for plasticity itself. In E. salubris, most functional traits showed little variation across the gradient. However, water use efficiency appeared highly plastic, as determined from the strong correlation between δ13C and recent precipitation (R2 = 0.83). Both species showed spatial partitioning of genetic variation across the gradient, and data for E. salubris revealed two distinct lineages. The genome scans yielded 16,122 DArTseq markers for “Lineage 1” of E. salubris, of which 0.1% were potentially adaptive ‘outlier loci’, and 6,544 markers for E. tricarpa, of which 2.6% were outliers. Canonical Analysis of Principal Coordinates (CAP) analysis showed that the outlier markers were correlated with climatic variables, and some were also strongly correlated with functional traits. An ‘Aridity Index’ was also developed from the CAP analysis that has potential as a tool for environmental planners to use for matching seed sources to target climates.
Widespread eucalypts are likely to possess a capacity to respond plastically to a changing climate to some extent, but selection of seed sources to match projected climate changes may confer even greater climate resilience. Further study of the mechanisms of plasticity in response to climate may improve our ability to assess climate adaptation in other species, and to determine optimal strategies for ecosystem restoration and management under climate change.

2 Adaptation to climate in widespread eucalypt species
EXECUTIVE SUMMARY
The long term success of revegetation efforts will depend upon the planted species’ resilience to climate change. Restoration of Australia’s degraded and fragmented multi-use landscapes represent multi-million dollar investments, yet current practices take little account of climate change. Until recently there has been a strong focus on using local genetic stock (germplasm) for optimal restoration. In a changing climate this paradigm is being questioned and research on this is urgently needed.
Many widespread species occur across a range of climatic conditions and, thus, may possess adaptations that could be utilised to improve climate resilience of restored ecosystems. Species can achieve a widespread distribution via two main mechanisms; (1) by genetically diverging into a series of populations, each specialised for the local conditions, and/or (2) through high phenotypic plasticity (the ability of an individual to adjust its characteristics in response its environment), enabling each individual to thrive in a wide range of conditions. The extent to which each population is specialised or plastic in response to climate will determine the seed-sourcing strategy required for optimal restoration outcomes under a changing climate. In addition, highly specialised populations are likely to be more severely impacted by a changing climate than highly plastic populations, and so the nature of adaptation to climate has implications for the ongoing management of both natural and restored ecosystems.
Directly determining the extent of functional specialisation and phenotypic plasticity in widespread species requires multiple provenance trials, such that individuals of each population can be tested under a range of climatic conditions. However, it is clearly impractical to test every species in this manner prior to its use in revegetation. With further research and development, genomic technologies may provide a way of examining climate adaptation without costly and time consuming provenance trials. We examined genetic divergence and phenotypic plasticity in two widespread Eucalyptus species native to the fragmented, multi-use landscapes of the Australian wheatbelts; E. tricarpa in southeastern Australia, and E. salubris in southwestern Australia. Our aims were to determine the nature of adaptation in these species and to assess whether genomic screening might be useful as a tool to assess climate adaptation in eucalypts.
Nine populations of each study species were selected across climate gradients. The E. tricarpa populations were distributed across a rainfall gradient of 460-1020 mm mean annual precipitation (MAP). Eucalyptus tricarpa trees originating from the same populations were also studied growing within two common gardens, near each end of the gradient, in order to directly distinguish genetic differences among provenances from plastic responses to climate across the gradient. The E. salubris populations were distributed across a combined rainfall and temperature gradient, from 200 mm MAP and 26°C mean annual temperature (MAT) at the most arid site, to 400 mm MAP and 21°C MAT at the least arid site. We characterised responses in functional traits relevant to climate adaptation, including leaf size, thickness, tissue density, and intrinsic water use efficiency (measured as an increase in carbon-13 content (δ13C)). Genetic variation was assessed with genome scans, and ‘outlier’ markers (for which the patterns differed more among provenances than would be expected from genetic drift along the gradient alone) were identified which represent genes or genomic regions potentially involved in climate adaptation.
Evidence of both plastic response and genetic specialisation for climate was found in both species, indicating that widespread eucalypts can utilise a combination of both these mechanisms to adapt to spatial variation in climate. The E. tricarpa common
Adaptation to climate in widespread eucalypt species 3
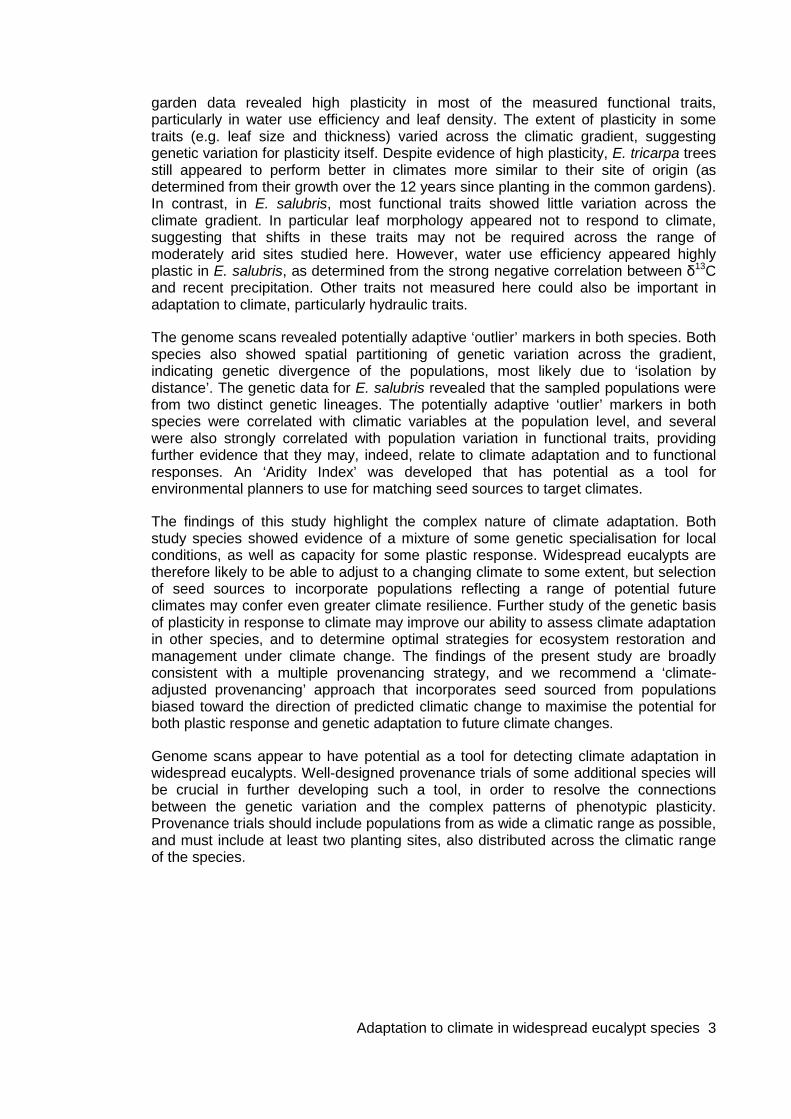
garden data revealed high plasticity in most of the measured functional traits, particularly in water use efficiency and leaf density. The extent of plasticity in some traits (e.g. leaf size and thickness) varied across the climatic gradient, suggesting genetic variation for plasticity itself. Despite evidence of high plasticity, E. tricarpa trees still appeared to perform better in climates more similar to their site of origin (as determined from their growth over the 12 years since planting in the common gardens). In contrast, in E. salubris, most functional traits showed little variation across the climate gradient. In particular leaf morphology appeared not to respond to climate, suggesting that shifts in these traits may not be required across the range of moderately arid sites studied here. However, water use efficiency appeared highly plastic in E. salubris, as determined from the strong negative correlation between δ13C and recent precipitation. Other traits not measured here could also be important in adaptation to climate, particularly hydraulic traits.
The genome scans revealed potentially adaptive ‘outlier’ markers in both species. Both species also showed spatial partitioning of genetic variation across the gradient, indicating genetic divergence of the populations, most likely due to ‘isolation by distance’. The genetic data for E. salubris revealed that the sampled populations were from two distinct genetic lineages. The potentially adaptive ‘outlier’ markers in both species were correlated with climatic variables at the population level, and several were also strongly correlated with population variation in functional traits, providing further evidence that they may, indeed, relate to climate adaptation and to functional responses. An ‘Aridity Index’ was developed that has potential as a tool for environmental planners to use for matching seed sources to target climates.
The findings of this study highlight the complex nature of climate adaptation. Both study species showed evidence of a mixture of some genetic specialisation for local conditions, as well as capacity for some plastic response. Widespread eucalypts are therefore likely to be able to adjust to a changing climate to some extent, but selection of seed sources to incorporate populations reflecting a range of potential future climates may confer even greater climate resilience. Further study of the genetic basis of plasticity in response to climate may improve our ability to assess climate adaptation in other species, and to determine optimal strategies for ecosystem restoration and management under climate change. The findings of the present study are broadly consistent with a multiple provenancing strategy, and we recommend a ‘climate-adjusted provenancing’ approach that incorporates seed sourced from populations biased toward the direction of predicted climatic change to maximise the potential for both plastic response and genetic adaptation to future climate changes.
Genome scans appear to have potential as a tool for detecting climate adaptation in widespread eucalypts. Well-designed provenance trials of some additional species will be crucial in further developing such a tool, in order to resolve the connections between the genetic variation and the complex patterns of phenotypic plasticity. Provenance trials should include populations from as wide a climatic range as possible, and must include at least two planting sites, also distributed across the climatic range of the species.

4 Adaptation to climate in widespread eucalypt species
1. OBJECTIVES OF THE RESEARCH
Multi-million dollar investments in revegetation of degraded and fragmented landscapes currently take little account of climate change. Restoration efforts have generally focused on locally sourced seed in order to maintain locally adapted ecotypes (Broadhurst et al., 2008; Hereford, 2009). Although introduction of non-local individuals can sometimes benefit remnant populations in fragmented landscapes, by alleviating inbreeding depression, the use of foreign ecotypes in revegetation may be associated with negative outcomes, including founder effects, genetic swamping of local populations, and outbreeding depression (Hufford & Mazer, 2003; Edmands, 2007; Kramer & Havens, 2009; Vander Mijnsbrugge et al., 2010). However, these negative effects are by no means always observed and in a changing climate, local populations may no longer be well adapted (Broadhurst et al., 2008). The translocation of species and ecotypes according to projected future climates is increasingly being considered, in attempts to mitigate climate change impacts on biodiversity and ecosystem functioning (Hoegh-Guldberg et al., 2008; Thomas, 2011; Weeks et al., 2011, Lunt et al. 2013).
The type of seed-sourcing strategy that will maximise resilience, and maintain ecological functioning of plantings into the future, depends upon the capacity of species to respond rapidly to climatic changes. Phenotypic plasticity - the ability of an individual to adjust its characteristics in response its environment - is increasingly recognised as playing a critical role in climate change response (Matesanz et al., 2010; Nicotra et al., 2010; Hof et al., 2011; Richter et al., 2012). Populations that are highly specialised for local conditions, possessing little plasticity, could survive climatic changes through shifts in geographical distribution, or through in situ adaptation via selection on pre-existing genetic variation. However, it is unlikely that range shifts and in situ adaptation alone will be able to keep pace with rapid climate changes, particularly in sessile organisms with long generation times, such as trees, and in fragmented, multi-use landscapes where the options for colonisation of new sites are limited (Jump & Peñuelas, 2005; Benito Garzón et al., 2011; Hoffmann & Sgrò, 2011). In contrast, more plastic species or populations may be better positioned to adjust rapidly to climate change, and by enabling persistence in the short term, plasticity may facilitate further genetic adaptation to new conditions (West-Eberhard, 2005; Ghalambor et al., 2007; Nicotra et al., 2010). Indeed, specialist species of numerous taxa across the globe appear to be currently facing greater rates of extinction than more plastic, generalist species, as a result of human induced habitat changes (Clavel et al., 2010). Translocation of species and ecotypes showing adaptation in revegetation may improve long-term ecosystem resilience, but may not be warranted for more plastic species. Understanding and quantifying local adaptation and plasticity in response to climate are, therefore, crucial in designing effective revegetation strategies.
High phenotypic plasticity is not always adaptive, but an ability to adjust key functional traits is very likely to be adaptive under rapid climate change (Nicotra et al., 2010). Widespread tree species that span a range of environments commonly show variation in functional traits across climate gradients, including changes in gas exchange physiology, leaf morphology and anatomy, hydraulic structure, and phenology (e.g. Castro-Díez et al., 1997; Prior et al., 2005; Schulze et al., 2006a; Cornwell et al., 2007; Gouveia & Freitas, 2009; Vitasse et al., 2009; Cernusak et al., 2011). Determining the extent to which this variation reflects phenotypic plasticity, as opposed to genetic differences among populations, requires common garden, reciprocal transplant or controlled environment studies in which each population is grown under multiple conditions. Previous studies utilising these methods have revealed a variety of

Adaptation to climate in widespread eucalypt species 5
responses among different species and environments. For instance, stone pine (Pinus pinea), widespread across contrasting habitats in the Mediterranean region, possesses minimal genetic variation, and responds across its range almost entirely through phenotypic plasticity (Mutke et al., 2010). On the other hand, Douglas fir (Pseudotsuga menziesii) across northern USA, and Norway spruce (Picea albies) along altitude gradients in Poland, both show strong genetic differentiation in cold response among provenances (Rehfeldt, 1989; Oleksyn et al., 1998). The tropical tree Metrosideros polymorpha occurs along altitude gradients varying in rainfall and temperature in Hawaii; in this species some functional traits are highly plastic in response to climate (including carbon isotope discrimination and leaf thickness), while other traits vary partly due to genetic differences among populations, and partly through plastic response (such as specific leaf area and nitrogen use efficiency) (Cordell et al., 1998). Although informative, it is clearly impractical to establish reciprocal transplant experiments for every species prior to its use in revegetation. However, genomic technologies might provide alternatives to long-term experiments and provide reliable data in short time-frames to support land management decisions. By combining genomic studies with established reciprocal transplant experiments, we may gain insights into the molecular basis of plasticity and adaptation (Aubin-Horth & Renn, 2009; Franks & Hoffmann, 2012). By drawing on the results of such studies, we may be able to develop generic methods that will allow us to predict species’ responses to climate change, thereby providing a scientific basis for environmental management decisions.
Climate change is leading to increased aridity in southern Australia, in common with many other regions of the world (Murphy & Timbal, 2008; Allen et al., 2010; Kirono et al., 2011). Large parts of southern Australia are multi-use landscapes, containing highly fragmented and ecologically significant Eucalyptus woodlands, which are the targets of ongoing conservation efforts (Kelly & Mercer, 2005; Prober & Smith, 2009). In this one-year study, we examined aspects of climate adaptation in two widespread Eucalyptus species that are native to the wheat-belt regions of southern Australia. In southeastern Australia, Eucalyptus tricarpa (red ironbark) occurs over a wide range of annual rainfall conditions, across the central Victorian Goldfields, East Gippsland, and the southern regions of New South Wales. In southwestern Australia, Eucalyptus salubris (gimlet) spans an aridity gradient across the wheatbelt and Great Western Woodlands. Across a climate gradient in each species, we characterised ecophysiological traits relevant to functional responses to climate, and employed a genomics approach to identify patterns of genetic variation and evidence of adaptation. In addition, existing provenance trials of E. tricarpa allowed us to directly determine the extent of phenotypic plasticity in functional traits for this species. By combining ecophysiological and genetic data, we tested the extent to which populations of these widespread eucalypt species may be locally adapted or plastic in response to climate. Furthermore, we aimed to evaluate the genomic approach as a tool for detecting adaptive variation within widespread species.

6 Adaptation to climate in widespread eucalypt species
2. RESEARCH ACTIVITIES AND METHODS
Two study species, Eucalyptus tricarpa and Eucalyptus salubris, were selected on the basis of (1) wide climatic distribution, (2) relevance for revegetation in fragmented wheatbelt areas, and (3) availability of suitable provenance trials to facilitate distinguishing local genetic adaptation from plastic responses to climate. Eucalyptus tricarpa is a tree that grows to 35 m tall, occurring in open forest throughout central and eastern Victoria, and southeastern New South Wales, across a mean annual precipitation (MAP) range of 450 - 1200 mm. Eucalyptus tricarpa is relevant for revegetation in the wheatbelt areas of southeastern Australia, and excellent provenance trials of this species have been established for forestry research. Eucalyptus salubris is a small tree that grows to 15 m tall; it is widespread in south western Australia, across MAP 200 - 440 mm, and mean annual temperature (MAT) 16 - 21 °C. Eucalyptus salubris is relevant for revegetation of southwestern wheatbelt areas, although no suitable provenance trials were available. For each study species, we sampled populations across a climatic gradient, conducted genomic analyses, and took measurements of physiological and morphological traits commonly involved in climate adaptation.
A note on site codes: For the genomic analysis, each wild collection site for each species was given a specific code relating to (1) the relative MAP at the site, from lowest (1_) to highest (9_); (2) the name of the site (a two-letter abbreviation, e.g., QV for Queen Victoria Spring Nature Reserve, WA); and (3) the relative location of the site (for E. tricarpa, the codes NW, N, E and EE relate to the direction of the site from Melbourne, with EE being the most easterly populations; for E. salubris the codes relate to formal botanical provinces, E = Eremaean (arid) zone; SWP = Southwestern Botanical Province; IZ = Southwestern Botanical Province Interzone). Hence, the code 1_QV_E indicates that this site recorded the lowest MAP of the nine provenances, the trees were collected from Queen Victoria Spring Nature Reserve (WA) and the collection site is located in the Eremaean botanical zone of WA. Site information and codes used are listed in Tables 1 (Eucalyptus tricarpa) and 2 (Eucalyptus salubris).
2.1 Eucalyptus tricarpa study sites
Common garden plantings of E. tricarpa provenances were established in 2000 as part of the Australian Low Rainfall Tree Improvement Group program, using individual tree, open-pollinated seedlots collected from multiple native provenances from throughout the natural range of E. tricarpa in southeastern Australia (Stackpole & Harwood, 2001). The present study was conducted on nine of these planted provenances, with sites of origin distributed across a rainfall gradient (Figure 1, Table 1). Foliage was sampled for morphometric and physiological analyses from two common garden plantings, located near each end of the rainfall gradient, as well as from the natural forests at the original seed collection site of each provenance (Figure 1, Table 1).
The common gardens were located at Huntly and Lake Tyers, on ex-grazing land. E. tricarpa is present locally in remnant vegetation within 1 km of each site. Both sites are flat, except for one quarter of the Lake Tyers planting, located on a 10° southern slope. The trees were originally planted in rows with spacing 1.8 m within rows and 4 m between rows, in four replicate blocks, each containing a five-tree plot of each family. The trials were subsequently thinned to 60% of the original planting density based on tree size (but not form); the smallest two trees from each plot were removed, to leave three trees of each family in each replicate block (D. Bush, personal communication).

Adaptation to climate in widespread eucalypt species 7
Figure 1: Locations of the nine study populations of Eucalyptus tricarpa (triangles), and the two common garden sites at Huntly (red circle) and Lake Tyers (blue circle). Population numbering corresponds with Table 1.
We sampled ten trees of each provenance at each common garden, except for three provenances at the Lake Tyers site, for which only eight or nine trees were present. Severely stunted trees were excluded from sampling. The planted trees originated from 3-11 single mother tree seedlots per provenance; our sampling included individuals from as many different seedlots as possible. The common garden sampling took place in April 2012, when the trees were approximately 12 years old. Trees were reproductively mature (fruits present on many), but had not attained the size of mature trees in the natural forest, and thus were still actively growing in height and girth.
Wild trees were sampled in May 2012, at the original seed collection sites of each of the provenances included in the field trials (Stackpole & Tibbits, 2000). For physiological measurements, ten mature trees (members of the overstorey canopy) were sampled at each site, and for genetic analysis the same ten trees as well as an additional 20 trees were sampled. All selected trees had canopies that appeared healthy, with normal colour and amount of leaf cover, relative to other trees and sites. Vegetation at the higher rainfall eastern sites consisted of tall stands of E. tricarpa mixed with other eucalypts, particularly E. muelleriana, with a tall, dense understorey. Vegetation transitioned to increasingly open forest toward the drier western sites which comprised almost pure stands of E. tricarpa with sparse, low understorey at the driest sites. All sites were relatively intact natural vegetation, most within reserves or state forest. The landscape was steeply undulating in the east and at Christmas Hills, and gently undulating at the western sites. Trees were selected from a variety of upper, mid and lower slope positions where present, with a minimum distance of 50 m between trees. Disturbed areas were avoided, i.e. we did not collect within 20 m of a major track, within 500 m of a forest boundary with cleared land, or in areas recently burnt or affected by past gold mining activity.

8 Adaptation to climate in widespread eucalypt species
Table 1: Location and mean annual climatic conditions (over the period 1925-1995; Atlas of Living Australia) of the nine study populations, and the two common garden sites of Eucalyptus tricarpa. Population numbering corresponds with Figure 1. The codes used for population identification in genomic analyses are given in brackets; see introduction to section 2 for explanation.
Location (Code)
Lati-tude (°N)
Longi-tude (°E)
Annual precip-itation (mm)
Daily maximum
temp. (°C)
Daily minimum
temp. (°C)
Annual evapo-ration (mm)
Annual solar
radiation (MJ m-2)
Site geol-ogy*
Populations:
1. Tarnagulla (1TG_NW) -36.76 143.85 460 20.4 7.4 1335 199
Osc
2. Mt Bealiba (2BL_NW)
-36.81 143.65 511 19.9 7.2 1306 197 Osc
3. Craigie (3CG_NW)
-37.08 143.77 543 19.7 7.1 1249 195 Osc
4. Heathcote (4HC_N) -36.98 144.75 621 19.3 7.3 1297 193
Osc
5. Heyfield (5HF_E)
-37.94 146.73 683 19.1 7.6 1177 184 Czc
6. Christmas Hills (8XH_NE) -37.69 145.31 787 18.6 8.1 1194 177
Ssdm
7. Mt Nowa Nowa (6NN_EE)
-37.7 148.11 860 19.2 7.5 1241 184 Czc
8. Tuckerbox (9_TB_EE)
-37.63 148.24 879 18.7 7 1217 183 Osa
9. Martins Creek (7MC_EE)
-37.47 148.58 1020 18.4 6.4 1241 180 Osa
Common gardens:
Huntly -36.63 144.31 472 20.6 7.6 1395 199 Osc
Lake Tyers -37.82 148.10 840 19.4 8.4 1261 185 Czc *Geology abbreviations: C, Cambrian; O, Ordovician; S, Silurian; a, intermediate extrusive / high level intrusive andesite, trachyte, latite, pyroclastic rocks; c, non-carbonate chemical sediment chert, evaporite, phosphorite, BIF; d, mafic intrusive gabbro, dolerite, norite; m, calc-silicate and marble meta carbonates and calcareous sediments; s, siliciclastic/undifferentiated sediment shale, siltstone, sandstone, conglomerate, mudstone; z, fault / shear rock mylonite, fault breccia, cataclasite, gouge.
2.2 Eucalyptus salubris study sites Nine populations of E. salubris were identified across an aridity gradient, from warmer and lower rainfall sites north of Kalgoorlie, to cooler and higher rainfall sites in the wheatbelt region (Figure 2, Table 2). Most of the more arid populations (sites 1- 5) were located within the relatively intact and undisturbed vegetation of the Great Western Woodlands, and consisted of sparse woodland dominated by mature E. salubris, with an extensive brush layer that became less dense with aridity. The less arid populations (sites 6 - 9) were located within remnant vegetation in the more fragmented and disturbed wheatbelt region, and consisted of denser, younger stands of E. salubris compared with the more arid populations. All sites were mostly flat, with

Adaptation to climate in widespread eucalypt species 9
some gently sloping (no more than 7°) areas. At least three other related species that have the potential to hybridise with E. salubris, occur within parts of our study region (E. tortilis, E. ravida and E. diptera) (Johnson & Hill, 1991). Sites with large numbers of these related species were avoided and, in most cases, our sample populations consisted of morphologically pure stands of E. salubris. Ten of the larger trees, with healthy canopies of normal colour and leaf cover, were sampled from each population for physiological analysis. The same ten trees plus an additional 20 trees were sampled for genetic analysis, with a minimum distance of 20 m between sampled trees.
Figure 2: Locations of the nine study populations of Eucalyptus salubris. Population numbering corresponds with Table 2.
2.3 Climate and soil characteristics Long term climate averages for each study site were obtained from the Atlas of Living Australia (http://spatial.ala.org.au/layers/); data are annual means over the years 1925-1995, from surface layers gridded to 0.01° (~1 km) resolution. Data obtained included the ‘mean annual aridity index’, defined as the ratio of mean annual precipitation to mean annual open pan evaporation (P/PE). Recent climate statistics were obtained from the SILO data drill service (http://www.longpaddock.qld.gov.au/silo/), for the 3 month, 6 month and 12 month periods immediately prior to the sampling dates for each study site. SILO data are from surface layers gridded to 0.05° (~5 km) resolution.
Approximately ten soil cores of 0-10 cm depth were collected at each site, distributed across the same areas as the sampled trees. Soil cores were bulked within each site, and analysed by CSBP Analytical Laboratories (Bibra Lake, WA, Australia) for nutrient content, pH, electrical conductivity and particle size composition. Geological information (1:1 000 000 scale categories) was obtained for each site from Surface Geology of Australia (Raymond & Retter, 2010), through the Atlas of Living Australia (http://spatial.ala.org.au/layers/).

10 Adaptation to climate in widespread eucalypt species
Table 2: Location and mean annual climatic conditions (over the period 1925-1995) of the nine study populations of Eucalyptus salubris. Population numbering corresponds with Figure 2.
Location (Code) Lati-tude (°N)
Longi-tude (°E)
Annual precip-itation (mm)
Daily maxi-mum temp. (°C)
Daily mini-mum temp. (°C)
Annual evapo-ration (mm)
Annual solar
radiation (MJ m-2)
Annual P/PE*
Site geol-ogy#
1. Queen Victoria Spring Res. (1_QV_E)
-30.15 123.32 199 26.1 11.6 2642 231 0.11 Qd
2. Bullock Holes Reserve (2_BH_E)
-30.52 121.79 225 25.7 11.9 2608 230 0.13 Ade
3. Credo Station (3_CR_E)
-30.19 120.65 237 25.9 12.0 2595 231 0.14 Qrc
4. Kangaroo Hills (4_KH_IZ) -30.99 121.12 276 24.7 10.9 2424 226 0.16
Qrc
5. Lake Johnston (5_LJ_IZ) -32.03 120.82 250 24.3 10.4 2097 219 0.19
Qdlu
6. Bruce Rock (6_BR_SWP)
-31.87 118.17 329 24.5 10.5 2101 223 0.27 Agl
7. Dunn Rock (7_DR_SWP) -33.24 119.55 345 22.6 9.6 1795 206 0.29
Ag
8. Lockhart Rd (Newdegate) (8_LR_SWP)
-33.30 119.02 352 22.6 9.4 1753 207 0.32 Czs
9. Ravensthorpe (9_RT_SWP)
-33.45 120.03 402 21.7 9.4 1740 202 0.30 Ag
*Ratio of mean annual precipitation to mean annual potential evaporation.
#Gology abbreviations: A, Archean; C, Cambrian; Q, Quaternary; c, non-carbonate chemical sediment chert, evaporite, phosphorite, BIF; d, mafic intrusive gabbro, dolerite, norite; e, metamorphosed ultramafic rocks serpentinite, talc schist, chlorite schist (no feldspars), tremolite schist, ultr amafic amphibolite; g, felsic to intermediate intrusive granite, granodiorite, tonalite, monzonite, diorite, syenite; l, carbonate sediment limestone, marl, dolomite; r, low-medium grade metafelsite rhyolitic schist, meta-andesite; s, siliciclastic/undifferentiated sediment shale, siltstone, sandstone, conglomerate, mudstone; u, ultramafic undivided (intrusive & extrusive) komatiite, high Mg basalt, pyroxenite, dunite, wehrlite; z, fault / shear rock mylonite, fault breccia, cataclasite, gouge.
2.4 Morphology and physiology measurements Leaf morphological measurements were taken on ten mature leaves per tree, obtained from the mid-outer canopy from three branches distributed around the canopy perimeter. Leaves were dried at 55 °C, weighed, and lamina thickness measured with a micrometer (Digimatic; Mitutoyo, Japan) (e.g. Schulze et al., 1998; Macfarlane et al., 2004). Leaves were then imaged with a flatbed scanner, and the area of each leaf was determined in Matlab (MathWorks, Natick, MA, USA). Specific leaf area (SLA) and average tissue density were calculated from the dry mass, thickness and area measurements (e.g. Wilson et al., 1999; Warren et al., 2005). The individual leaf data were averaged to give a single value of each trait for each tree.

Adaptation to climate in widespread eucalypt species 11
Five to six leaves per tree were pooled for carbon stable isotope and nitrogen content measurements (Miller et al., 2001; Warren et al., 2005). Cellulose 13C/12C ratio is used as an indicator of intrinsic water use efficiency; RuBisCO preferentially utilises 12CO2, but as stomatal conductance decreases to reduce water loss, CO2 within the leaf tissues becomes limiting, forcing increased fixation of 13CO2 (Dawson et al., 2002). A higher (less negative) 13C/12C value therefore reflects greater intrinsic water use efficiency during the period when the carbon was fixed. Leaf nitrogen content is strongly related to photosynthetic capacity, since photosynthetic apparatus comprises the majority of leaf nitrogen (e.g. Evans, 1989). A strip was cut from each leaf across the centre of the blade, including the mid-vein, and ground to a fine powder in a ball mill. Crude cellulose was extracted from the ground leaf material using a modified acid-diglyme procedure (Macfarlane et al., 1999). The 13C/12C ratio of the cellulose samples, and the total carbon and nitrogen content of the bulk leaf material, were measured in an isotope ratio mass spectrometer. The 13C content is reported in parts per thousand (‰), as delta values relative to the Vienna PeeDee Belemnite international standard.
The size of each sampled tree was measured. The circumference of all stems were measured at 1.2 m height with a tape measure, and the stem cross sectional area calculated for each tree (assuming stem circularity). Height was determined from the ground by estimating the number of 2 m increments from the base to the top of the tree from a distance of approximately 10 m. Height estimates were then corrected for perspective error using a set of ‘calibration’ trees which were being thinned from the plots at the Lake Tyers common garden site, for which height was estimated while standing, then measured with a tape measure after felling.
For E. tricarpa, the plasticity of each measured trait was calculated for each provenance from the common garden data, as a relative trait range index (RTR; Valladares et al., 2006):
RTR = (mean in environment 1) − (mean in environment 2)
(maximum observed mean value)
where ‘environment 1’ is the common garden site usually inducing the higher trait value, ‘environment 2’ is the common garden site usually inducing the lower trait value, and the ‘maximum observed value’ is the highest mean trait value across all provenances and both common gardens. RTR ranges from 1 to -1, positive values indicate a potentially adaptive trait response between the two common gardens, negative values indicate a potentially mal-adaptive response.
2.5 Molecular methods 2.5.1 Background Several types of molecular marker can be used for scanning genomes for signals of selection in natural populations. The choice of marker depends on a range of factors, including the availability of genomic resources (e.g., EST libraries, a genome sequence) for the study organism, the number of samples, the available time and the size of the budget.
Genome scanning methods can use “dominant” markers, (i.e., presence/absence data, where it is not possible to determine whether an individual is a homozygote or a heterozygote because only one allele is visible) such as amplified fragment length polymorphisms (AFLPs), Diversity Arrays Technology (DArT) arrays (Sansaloni et al., 2010) or the innovative DArTseq (Sansaloni et al., 2011) and/or RADseq (restriction associated DNA; Davey & Blaxter, 2010) methods. To date, only AFLP dominant

12 Adaptation to climate in widespread eucalypt species
markers have been used for studies of adaptation (e.g., see Strasburg et al. (2012) and references therein); there are not yet any published studies that use DArT, DArTseq or RADseq. Co-dominant markers such as simple sequence repeats (SSRs, Sork et al., 2010; also known as "microsatellites") and single nucleotide polymorphisms (SNPs (see below)) are more information-rich and less complicated to analyse than dominant markers, but the numbers used in genome scans to date have been relatively small (see Strasburg et al. 2012).
The application of SSRs to the detection of signals of selection is rarely ideal, especially in non-model organisms. The development of SSR primers is generally required for individual species and, if assumptions of neutrality are correct (Selkoe & Toonen, 2006), SSRs are generally not subject to selection unless they are closely linked to a region of the genome that is under selection (however, some studies use SSRs developed from EST databases that are, by their very nature, linked to genes). The number of SSR loci available for use in most non-model organisms is low (usually fewer than 100) and the likelihood of finding a marker that is linked to an adaptive locus is very small indeed.
Although AFLPs need only a small amount of optimisation for each study, repeatability can be problematic and they are not amenable to high-throughput applications. Hence, sample sizes tend to be limited and the number of markers in a study tends to be relatively small (fewer than 1000). Because each marker is characterised by size, homology assessments can be difficult and transferability of data between studies is problematic. Furthermore, their “anonymous” nature (i.e., no DNA sequence data are available) means that even if a marker appears to be under selection, the nature of the underlying genomic region remains unknown.
SNP analysis (screening SNPs in “candidate” genes) is a favoured method of identifying signals of selection (e.g. Edelist et al., 2006; Kane & Rieseberg, 2007; Namroud et al., 2008; Eckert et al., 2010; Prunier et al., 2011; Mosca et al., 2012; Tsumura et al., 2012). However, identification of SNP markers requires a lot of information a priori (e.g., EST databases or multiple genome sequences) and makes assumptions about which genes are likely to be under selection. Most SNP-based studies are limited to a relatively small number of molecular markers, usually tens or hundreds (Holderegger et al., 2008). Considering the complex interactions that occur in the real world, between an organism and its biotic and physical environments, an a priori, “bottom-up” approach such as this is likely to miss many signals of selection that may, for example, lie in genes that are not included in the study or non-coding regions that affect gene expression (e.g., promoter regions or micro-RNAs). Since adaptation is likely to involve numerous changes throughout a genome, identifying signals of selection may be more successful through a random “top-down” process of intensive screening, with no a priori assumptions about which genes are likely to be involved. This said, technology is now being developed that allows the screening of SNPs from all known genes in a genome.
Two very new “genome scanning” techniques that offer a random, top-down approach, without the requirement of extensive genomic resources, are RADseq (Davey & Blaxter, 2010) and DArTseq (Sansaloni et al., 2011) markers. Both types of marker make use of recent advances in next-generation sequencing (NGS) technology. Tens to hundreds of thousands of markers can be developed from across the genome of any organism without the need for prior genomic resources. Each marker is identifiable by a short stretch of DNA sequence, so that “outlying” markers of interest can be screened against a DNA database (e.g., a genome sequence or GenBank) to identify the region of the genome that may be under selection.

Adaptation to climate in widespread eucalypt species 13
2.5.2 Method Due to quarantine issues arising from the occurrence of myrtle rust in eastern Australia, leaf samples of E. tricarpa were sent to the Australian Genome Research Facility (AGRF, Adelaide, Australia) where DNA was extracted using an in-house CTAB protocol. DNA was extracted from E. salubris in the Laboratory of the Department of Environment and Conservation following the method outlined by Byrne et al. (1998). DNA samples were tested for digestibility with restriction enzymes (a prerequisite for the DArTseq procedure). The concentration of DNA from each tree was standardised to approximately 50 ng μl-1 and was sent to Diversity Arrays Technology Pty. Ltd. (DArT P/L, Canberra, Australia) for genotyping using DArTseq technology. The DArTseq procedure involves a ‘complexity reduction’ step whereby genomic DNA is cut with two restriction enzymes: a methylation-sensitive rare cutter such as Pst I that targets gene regions of the DNA, and a frequent cutter such as Taq I. The subset of fragments with two Pst I ends are amplified using PCR (i.e., fragments that have been cut at one or both ends by Taq I do not get amplified). This set of amplified fragments (ranging in size from 300 bp to 1000 bp) constitutes the ‘genomic representation’ of each sample which is then used for generating the DArTseq data sets. Using a next generation (i.e., rapid, high throughput, relatively cheap) sequencing platform, the first 60 bp of DNA fragments in each genomic representation are sequenced. A sophisticated analytical pipeline (Sansaloni et al., 2011) is used to sort and align all the sequences and determine which samples have which fragments in common. Two large data sets are then produced: the first comprises presence/absence data (dominant markers) for each sample; the second comprises single nucleotide polymorphisms (SNPs) for the 60 bp of sequence data that is provided for each fragment in a sample. DArTseq has many of the same qualities as traditional DArT markers: the markers are dispersed more or less randomly across the eucalypt genome and a large proportion come from coding regions (Petroli et al., 2012).
2.6 Statistical analysis Analysis of the morphological and physiological traits was performed in R version 2.14.2 (R Development Core Team, 2012). Relationships among traits and environmental parameters were analysed by linear regression, and relationships were compared among common gardens and the natural forests using ANCOVA, by including planting site as a covariate. Each trait was regressed against 41 environmental variables (long- and short-term climate and soil data). Due to the large number of tests performed, some would be expected to reach the significance threshold by chance alone, therefore the findings from these regressions were interpreted conservatively. For the number of stems per tree trait, quasi-poisson GLMs were fitted, as appropriate for count data of this type (Zeileis et al., 2007). For all other traits, ordinary linear models were fitted to the provenance means when assessing correlations with environmental parameters, since our focus was on the variation in traits among provenances and sites. When examining correlations among traits, the individual tree data were used. Relationships are reported as significant where P < 0.05.
For this study, only the fragment presence/absence component of the DArTseq data was used (the SNP data were not used). To ensure that all DArTseq markers were of high quality (i.e. highly reproducible), only those with a ‘Q’ (quality) value > 2.5 and a Call Rate >= 90% were included in the final data set. A screen of the E. salubris data to identify outlying individuals (that did not cluster with the other individuals from the same provenance) was carried out using Splitstree4 (Huson & Bryant, 2006). The E. tricarpa data were screened in a similar manner using a Principal Coordinates Analysis

14 Adaptation to climate in widespread eucalypt species
(in GenAIEx; Peakall & Smouse, 2006; see below). Outlying individuals were excluded from all further analyses.
Outlier loci (i.e., loci whose allele frequencies differ more among populations than would be expected through drift alone) were identified using Bayescan v. 2.0 (Foll & Gaggiotti, 2008). For the Bayescan analysis, markers with a ‘1-Ratio’ (i.e. ‘allele’ or ‘band’ frequency) of < 0.10 or > 0.90 were excluded. Default parameters were used for the Bayescan searches, except that the thinning interval was sometimes increased from 10 to 20 (depending on the size of the data set), prior odds for the neutral model were set to 100 or 200 (depending on the size of the data set) and the FIS prior was set to ‘uniform between 0.0 and 0.3’ in accordance with typical values of this inbreeding statistic for eucalypts (Byrne, 2008).
The full DArTseq data set and the outlier loci data set for each species were analysed in a population genetics framework using several software packages. GenAlEx 6.1 (Peakall & Smouse, 2006) was used for: Analyses of Molecular Variances (AMOVAs); Mantel tests for correlation between population-level genetic distance and geographic distance; and for generating matrices of pairwise genetic distances between individuals (Nei, 1972).
Pairwise genetic distance matrices were used for further analyses in the combined PRIMER-E (Clarke & Gorley, 2006) + Permanova (Anderson et al., 2008) software package. Thirty-five climatic variables for each tree (based on GPS coordinates) were derived from climatic surfaces in the ANUCLIM 6.1 software package (Xu & Hutchinson, 2011) and normalised using Primer-E. To reduce computer memory requirements and analysis time, draftsman plots were used to identify sets of highly correlated climatic variables (for each species); a subset of variables representing (i) temperature, (ii) rainfall, (iii) radiation and (iv) moisture indices, was used in subsequent analyses. Descriptions of the climatic variables and their abbreviations are given in Appendix 1.
Principal coordinates analyses (PCoAs) and canonical analyses of principal coordinates (CAP; Anderson & Robinson, 2003; Anderson & Willis, 2003) were done with Permanova. The purpose of the CAP was to find axes through the multivariate cloud of points (corresponding to the genetic variation in the species) that have the strongest correlation with another set of continuous variables. This was done for climatic variables and, in the case of E. tricarpa, soil properties. CAP can be used for predictive purposes. In this case, we used an aridity index (see below) based on the CAP scores derived from wild populations to predict genotypes that would perform well in the two E. tricarpa provenance trials. An aridity index for each of the collection sites and the two E. tricarpa provenance trials was derived from the canonical eigenvector value of the climatic variables (CAP1) using the following algorithm (adapted from equation 5.14 in Permanova manual):
Aridity Index (AI) = Σaibi
where a = normalised climatic variable X, and b = canonical eigenvector value of climatic variable X. The aridity indices of the trial sites were used – through site matching – to predict which of the provenances should be performing best in each trial.
The process of identifying associations between outlying markers, climatic variables and phenotypic traits involved a number of complementary analyses.
1. Analysis of Variance (ANOVA): We asked “Is there a significant difference in the state of a trait among populations in the wild and/or among populations in a common

Adaptation to climate in widespread eucalypt species 15
garden?” We tested for the effect of population on morphometric and physiological traits measured in wild populations and in each of the two trials using the PROC GLM procedure of SAS (SAS Institute; Version 9.1) with a one-factor fixed effects model. To account for multiple testing, for each class of response variables (i.e., within ‘wild populations’, ‘Lake Tyers Trial’ and ‘Huntly Trial’), probabilities were corrected for 5% False Discovery Rate (FDR) using the standard FDR method (Benjamini & Hochbert, 1995) and a more conservative “dependent” FDR method that allows for correlation between tests (DFDR; Benjamini & Yekateuli, 2001). These corrections were done using PROC MULTTEST of SAS with the FDR and DFDR options.
2. Linear regression analysis – environmental variables. We asked “Is the molecular genetic index (CAP1) correlated with a climatic variable?”. In this case the dependent variable was CAP1 and the independent variable was the environmental variable. The environmental variables were divided into classes based on (a) ESOCLIM climate variables for temperature, rainfall, radiation; (b) the moisture index; and (c) soil variables describing chemistry and soil particle size. Linear regression analysis was done using the PROC REG procedure of SAS. FDR and DFDR corrections for multiple testing were made within each of these classes as described above (1).
3. Linear regression analysis – physiological/morphometric traits. We asked: “Is a (morphological/physiological) trait correlated with the molecular genetic index (CAP1)?” Here, the independent variable was CAP1 and the dependent variable was the trait. We divided the traits into classes and controlled for multiple testing and 5% FDR (using the FDR and DFDR procedures of SAS) within each of the three sets of measurements (i.e., within ‘wild populations’, ‘Lake Tyers Trial’ and ‘Huntly Trial’).
4. Linear regression analysis – plasticity traits. We asked: “Are any of the traits that showed adaptive plasticity in the field trials correlated with the adaptive genetic index (CAP1)?” Plastic traits were identified through correlating RTR values (see section 2.4, above) with mean annual precipitation (MAP) of the site of origin (see Results section). We controlled for multiple testing using a 5% FDR and DFDR, as above.
Where significant differentiation of physiological/morphometric traits were found among wild provenances (ANOVA) and/or linear regression analysis detected a significant correlation between the adaptive genetic index (CAP1) and a climatic variable or trait, the variable/trait was tested (using linear regression analysis) against each of the outlying loci to find regions of the genome that might be associated with adaptation. For each trait tested we controlled for multiple marker testing using a 5% FDR, as above. Variables that did not show significant differentiation among wild provenances (ANOVA) and/or significant correlations with CAP1 (linear regression analysis) were excluded from further analyses.
Eucalyptus salubris was not subjected to this level of analysis because of the strong, cryptic, within-species genetic structure (see Results). The species comprised two distinct genetic lineages: ‘Lineage 1’ comprised the three populations from the arid zone, one ‘interzone’ (IZ) population and one population from the relatively wet southwestern botanical province (SWP); ‘Lineage 2’ comprised one population from the IZ and three from the SWP. We conducted some analyses on the larger of the two lineages (Lineage 1) that included all populations from the drier end of the environmental gradient. However, because of the small number of populations in the intermediate IZ and the wetter SWP, the statistical significance of the findings was compromised.

16 Adaptation to climate in widespread eucalypt species
3. RESULTS AND OUTPUTS
3.1 Results of Eucalyptus tricarpa study 3.1.1 Environmental variation along the gradient The nine study populations were selected across a precipitation gradient traversing approximately 480 km, from 460 mm mean annual precipitation (MAP) at Tarnagulla in central Victoria, to 1040 mm at Martins Creek in the southeast (Figure 1, Table 1). Several other climate parameters co-varied with precipitation across the gradient; summer precipitation, annual evaporation and annual solar radiation of the sampling sites. These were all strongly correlated with one another and with MAP (R2 > 0.62). Thus, while the climate gradient is discussed primarily in terms of MAP throughout this report, the effects on tree functioning and genetic adaptation might also be mediated by the other co-varying aspects of climate. Variation in temperature was small; sites were within 1°C of each other in mean annual temperature, and within 2°C in mean annual maximum and minimum temperatures. The climate during the 3, 6 and 12 months immediately before sampling were all strongly correlated with the long term averages (R2 = 0.50-0.99 for all variables, data not shown), and so only long term climate data were considered further, in correlating tree morphology and physiology with environmental variation.
The climates of the two common gardens were similar to those experienced by the nearest wild study populations (Figure 1, Table 1). The Huntly common garden was very similar in all climate parameters to the driest of the sample populations at Tarnagulla, 44 km away, although temperatures at Huntly were slightly warmer. The Lake Tyers common garden was 11 km from the fourth-wettest population at Mt Nowa Nowa, precipitation was very similar, but minimum temperatures were slightly higher at Lake Tyers due to its coastal location.
Most of the soil parameters did not vary substantially among the sites, and differences did not correlate with the climate gradient (Appendix 2). The differences in levels of the key nutrients nitrogen and phosphorus were minimal, as were differences in pH and organic carbon. However, soil in the Lake Tyers common garden had a higher clay content at 42% (w/w), compared with 11-24% at all other sites. The coarse sand content was also quite variable among sites, ranging from 6% at Lake Tyers and Christmas Hills, to 50% at Mt Nowa Nowa.
3.1.2 Morphology and physiology along the rainfall gradient Most of the measured traits varied along the rainfall gradient in the natural forests (Figure 3). Leaf density decreased as MAP increased, varying by 50 mg cm-3 across the gradient. The relationship between leaf size and MAP was marginally non-significant (P = 0.06), but leaf size did correlate significantly with annual solar radiation (P = 0.008, R2 = 0.65) and summer precipitation (P = 0.04, R2 = 0.63), with larger leaves occurring at the wetter, lower irradiance sites. More trees were multi-stemmed at the low rainfall sites, and the incidence of single stemmed individuals increased with MAP (Figure 3f). Highly branched stems are associated with hydraulic redundancy, a characteristic which may improve tree survival and functioning in dry conditions, but which can reduce water transport efficiency in high rainfall environments (Schenk et al., 2008). Multi-stemmed trees were most common at the second driest site (Mt Bealiba), where approximately 50% of trees were multi-stemmed, while at the three highest rainfall sites, 10% or fewer trees were multi-stemmed.

Adaptation to climate in widespread eucalypt species 17
Figure 3: Relationships between functional traits of nine Eucalyptus tricarpa provenances and the mean annual precipitation (MAP) at their site of origin, when growing in two common gardens (at Huntly with 470 mm MAP, and at Lake Tyers with 840 mm MAP), and in their natural habitat (Wild). (a) Foliage cellulose δ13C, (b) leaf tissue density, (c) leaf lamina thickness, (d) specific leaf area (SLA), (e) leaf size (area per leaf), (f) proportion of multistemmed trees, (g) leaf nitrogen content on a dry mass basis (Nmass), (h) leaf nitrogen content on a leaf area basis (Narea). Data points are mean ± standard error of ten trees.

18 Adaptation to climate in widespread eucalypt species
The only measured trait showing no correlation with the rainfall gradient in the wild was leaf nitrogen content (Figure 3g, h). The differences among sites in leaf N content were small, ranging from 11.4 to 13.6 mg g-1 dry mass, and 0.30 to 0.38 mg cm-2 leaf area. Leaf Narea is usually of greater functional importance in gas exchange than leaf Nmass (e.g. Wright et al., 2001). Leaf N on a dry mass basis (Nmass) did not correlate significantly with any of the measured climate or soil parameters. However, N content on a leaf area basis (Narea) showed a significant linear correlation with the mean minimum temperature, with higher N levels occurring under colder minimums (R2 = 0.51, P = 0.03).
Leaf thickness, specific leaf area (SLA) and leaf cellulose 13C content displayed strong quadratic correlations with MAP. Trees at the intermediate rainfall sites had the thinnest leaves and the largest SLA, with leaves thickening by up to 50 μm toward both extremes of the rainfall gradient. The lowest δ13C values occurred in intermediate provenances, indicating a higher water use efficiency in trees at each extreme of the rainfall gradient. Thicker leaves and high water use efficiency are adaptations associated with low water availability (e.g. Niinemets, 2001; Aranda et al., 2010); the thicker leaves and higher 13C at the highest rainfall sites suggest that factors other than water availability may be affecting aspects of leaf morphology and physiology at these sites.
3.1.3 Variation among provenances in the common gardens In the common gardens, the different traits showed a range of patterns with respect to the MAP of the sites of origin. Leaf 13C content and leaf density differed between the two common gardens, but showed relatively little variation among provenances within either common garden (Figure 3a & 3b). This response pattern indicates a high degree of plasticity in leaf density and photosynthetic water use efficiency in all provenances.
In contrast, leaf thickness decreased with MAP at the site of origin in both common gardens, with a steeper relationship evident at the low rainfall common garden (Figure 3c). For provenances originating from the drier and intermediate forests, leaves became thinner when planted under wetter conditions, showing phenotypic plasticity in this trait. However, leaf thickness of the higher rainfall provenances was not plastic, and did not respond when planted in drier conditions, with no difference observed between the two common gardens. The leaves of the high rainfall provenances were thicker in the wild than at either planting site, again suggesting that factors other than rainfall were influencing thickness in the wild at the high rainfall sites. The patterns observed among sites and provenances in leaf thickness were also evident in SLA; SLA is a composite of leaf thickness and density, but variation in SLA among the E. tricarpa populations appears to be dominated by leaf thickness (Figure 3d).
Leaf size also correlated with MAP of the site of origin in both the common gardens (Figure 3e). However, for provenances originating from drier sites, leaf size did not respond substantially to planting in wetter conditions. Concurrently, leaf size was plastic for provenances originating from wetter sites, with larger leaves produced when growing at the higher rainfall common garden, than at the low rainfall common garden.
Leaf Nmass was higher at the high rainfall planting site in all provenances (Figure 3g). However, Narea was slightly higher at the dry planting site in most provenances (Figure 3h), due to the differences in leaf thickness and density observed between the common gardens. Leaf nitrogen content in the high rainfall common garden showed a quadratic relationship with MAP of origin, with lower N in intermediate provenances, on both a dry mass and leaf area basis (Figure 3g, h). In the low rainfall common garden,

Adaptation to climate in widespread eucalypt species 19
leaf Nmass was fairly constant among all provenances, while leaf Narea decreased with MAP of origin, due to the concurrent decrease in leaf thickness.
A greater proportion of trees were multi-stemmed in the low rainfall common garden, than under high rainfall (Figure 3f). Most trees of all provenances were single stemmed under high rainfall. When grown at the low rainfall site, the greatest incidence of multi-stemmed habit and the greatest average number of stems per tree occurred in the provenances originating from intermediate rainfall sites. Provenances originating from low rainfall sites were frequently multi-stemmed in the wild, but were primarily single stemmed within the low rainfall common garden. The selection of single stemmed trees during seed collection (Stackpole & Tibbits, 2000; Stackpole & Harwood, 2001) may have led to greater numbers of single stemmed progeny within the common gardens. Alternatively, other factors at the wild sites, such as fire and herbivory damage to seedlings or logging history, may have induced a higher incidence of multi-stemmed habit in the wild.
Different traits showed different patterns of plasticity among the provenances, as calculated from the common garden data (Figure 4). Therefore, genetic variation for plasticity may exist across the rainfall gradient, with plasticity potentially controlled by different genes for each trait. Plasticity of leaf size and thickness varied in opposite directions across the rainfall gradient, with provenances originating from drier sites having high plasticity for leaf thickness but low plasticity for leaf size, and provenances originating from wetter sites having low plasticity for leaf thickness but high plasticity for leaf size. In contrast, leaf density and 13C content were highly plastic in most provenances, and plasticity did not significantly correlate with MAP of origin. Plasticity of stem branching appeared to be quadratically related to MAP of origin, with intermediate-rainfall provenances having greatest plasticity. However, the provenances originating from low rainfall sites had higher levels of stem branching in the wild than in either of the common gardens, suggesting that the actual plasticity of these provenances is likely to be higher than the range captured in the common gardens.
3.1.4 Growth rate of trees in the common gardens
The trees in the two common gardens were all planted at approximately the same time, and thus their size at the time of sampling represents growth over the 12 years since planting. Based on the trees sampled for this study, for each provenance, growth appears to have been greatest at the common garden with climate most similar to the climate of origin (Figure 5). At the low rainfall common garden, provenances from low rainfall sites tended to have larger stem cross sectional areas and to be taller than high rainfall provenances. At the high rainfall common garden, the high rainfall provenances tended to grow better than low rainfall provenance in terms of stem cross-sectional area and height. The wetter provenances grew to the same height in both trials, while the dry provenances grew taller at the dry site.
3.1.5 Genomic results An initial screening of the full E. tricarpa DArTseq data set using Principal Coordinate Analysis (PCoA) identified XH16 (Christmas Hills tree 16; a road-side tree) as an outlier, as it did not cluster with the other 29 individuals from that provenance; XH16 was therefore excluded from all further analyses.

20 Adaptation to climate in widespread eucalypt species
Figure 4: Relationships between trait plasticity (relative trait range calculated from measurements taken from the two common gardens; RTR) of nine Eucalyptus tricarpa provenances, and the mean annual precipitation (MAP) at their site of origin. (a) Leaf size and lamina thickness were two traits showing a linear correlation between plasticity and MAP, (b) foliage cellulose δ13C and leaf tissue density showed no significant relationship between plasticity and MAP, and (c) leaf nitrogen content per area (Narea) and the number of stems per tree showed quadratic relationships between plasticity and MAP. Positive values of RTR indicate a potentially adaptive trait response between the two planting sites, negative values indicate a trait response in a potentially mal-adaptive direction.
Figure 5: Size of the sampled Eucalyptus tricarpa trees in the common gardens, 12 years after planting. (a) stem cross sectional area at 1.2 m height, (b) tree height. Data are means ± standard error of ten trees. Note that the sampled trees were a random selection post-thinning (the smallest 40% of trees were previously removed from each plot).
AMOVA of the full E. tricarpa DArTseq data set (274 individual trees, 6,544 DArTseq markers; 4.6% missing data) showed that 7% of the variance could be attributed to differences among provenances, while 93% occurred within provenances. Mantel tests demonstrated a strong, highly significant correlation between geographic distance and genetic distance among provenances (Rxy = 0.851; R2 = 0.72; P = 0.001). PCoA

Adaptation to climate in widespread eucalypt species 21
(Figure 6A) also demonstrated distinct spatial partitioning of genetic variation from west to east: provenances from the dry region NW of Melbourne (i.e., 1_TG_NW, 2_BL_NW, 3_CG_NW, 4_HC_N)) formed a distinct cluster, as did the provenances from the wet coastal region east of Melbourne (i.e., 6_NN_EE, 7_MC_EE, 9_TB_EE). Two of the ‘intermediate’ populations (5_HF_E and 8_XH_NE) occupied the genetic space between the ‘wet’ and ‘dry’ clusters.
Figure 6: Principal Coordinates Analysis of Eucalyptus tricarpa DArTseq data. (A) Full DArTseq data set (6,544 DArTseq markers); (B) Outlier data set (94 outlier markers)
Bayescan identified 94 outlier loci (2.6% of the full DArTseq data set). AMOVA of the ‘outlier’ data set (274 individual trees, 94 DArTseq markers; 4.6% missing data) showed a similar partitioning of genetic variance to that found for the full data set (i.e., 6% variance among provenances; 94% of variance within provenances). There was still a moderate, highly significant correlation between provenance-level geographic

22 Adaptation to climate in widespread eucalypt species
and genetic distances (Rxy = 0.796; R2 = 0.6331; P = 0.001), but PCoA (Figure 6B) demonstrated much less marked geographic partitioning of genetic variation among the provenances. Instead, the individual trees demonstrated a more clinal west-to-east pattern of variation in the genetic space.
Draftsman’s plots were used to assess correlations among the 35 ANUCLIM climatic variables (Appendix 3). A set of 15 variables was selected to represent the overall variation in temperature (mean annual temperature, mean diurnal range, maximum temperature of the warmest period, minimum temperature of the coldest period, mean temperature of the driest quarter), precipitation (MAP, precipitation of the wettest period, precipitation of the coldest quarter), solar radiation (mean annual radiation, radiation seasonality, radiation of the driest quarter, radiation of the coldest quarter), and moisture indices (annual mean moisture index, highest period moisture index, mean moisture index of highest quarter) at each site. A complete list of climatic variables considered and their descriptions are provided in Appendix 1.
CAP analysis of the data set comprising the 94 E. tricarpa DArTseq outlier loci and the set of 15 representative ANUCLIM variables for the 274 individual trees yielded the plot in Figure 7. Here, 61% of the variance in the genetic distance matrix was explained by the maximum allowed number of PCo axes for this analysis (m=15; see Anderson et al. (2008) for explanation of how m is selected for each analysis), and the CAP1 axis provided a good model to fit the climatic data to the genetic data (squared canonical correlation, δ2 = 0.73; P = 0.001). The CAP axes are independent and represent linear combinations of PCos based on genetic distances that have maximum correlation with the climatic variables in the analysis. There was a general trend along the CAP1 axis from the wetter regions in eastern Victoria (EE, E and NE) to the drier regions to the north and northwest of Melbourne (N, NW).
The ‘Aridity Index’ (AI) was calculated for each site (Table 3) including the provenance trials at Huntly and Lake Tyers. The aridity indices were calculated from the linear combination of the 145 normalised climatic variables that correlate with the CAP axes describing genetic change. In the case of CAP1, the best correlated climatic index (AI) ranged among the wild collection sites from -2.75 at 9TB_EE (wet) to 3.5 at 1TG_NW (dry). The trial site at Huntley had an AI of 3.93, suggesting that, of the nine provenances included in this study, germplasm originating from 1TG_NW (the driest site) may perform best at Huntley. The trial site at Lake Tyers had an AI of -0.71, suggesting that germplasm from an intermediate rainfall site such as 4HC_N (AI = 1.02) or 5HF_E (AI = -1.14) might perform best here. These predictions are relatively consistent with the plots shown in Figure 5. 1TG_NW (MAP 460 mm) was one of the best performers at Huntly (MAP 472 mm) in both stem cross-sectional area and height at age 12; and the 4HF_N population (MAP of 683 mm) was the second best performer at Lake Tyers (MAP 840 mm) in terms of stem cross-sectional area at age 12, and 2nd or 3rd best in terms of height at age 12. Further analysis of establishment, growth and performance data from each of the trial sites (including data collected before the trials were thinned) is required to fully explore the relationships between AI of the original collection site and provenance performance at different sites.

Adaptation to climate in widespread eucalypt species 23
Figure 7: Plot of CAP analysis of the 94 outlier DArTseq markers from Eucalyptus tricarpa and 15 climatic variables (from ANUCLIM). Coloured shapes represent trees from particular ‘regions’. CAP1 represents the axis of genetic variation that has the strongest relationship with the 15 ANUCLIM variables. The lines represent the strength and direction of the climate vectors relative to the adaptive genetic space. ‘Regions’: E – east of Melbourne; EE – a long way east of Melbourne; N – north of Melbourne; NE – northeast of Melbourne; NW – northwest of Melbourne (see Fig. 1; see section 2 for explanation of abbreviations).
A CAP analysis fitting the physical and chemical properties of soil at each site (data normalised) to the genetic data yielded results similar to those derived from the climatic data. About 64% of the variance in the genetic matrix was explained by the maximum allowed number of PCo axes (m=15) for this analysis. The CAP1 axis provided a moderate model to fit the soil data to the genetic data (δ2 = 0.72; P = 0.001). It should be noted that the soil data were site-level data that were replicated for each individual within a provenance, thereby potentially artificially inflating the correlation. Linear regression analysis of the physical and chemical properties of the soils and the adaptive genetic index (CAP1) found no significant correlations (Appendix 4), indicating that the soil traits measured in this study were not an important driver of adaptive genetic variation in E. tricarpa.
For linear regression analysis, climatic variables were divided into four classes: Temperature, Rainfall, Radiation, Moisture Indices. The most significant associations between the adaptive genetic index (CAP1) and each class were as follows (see Appendix 9): Temperature – positive correlations were observed with the maximum
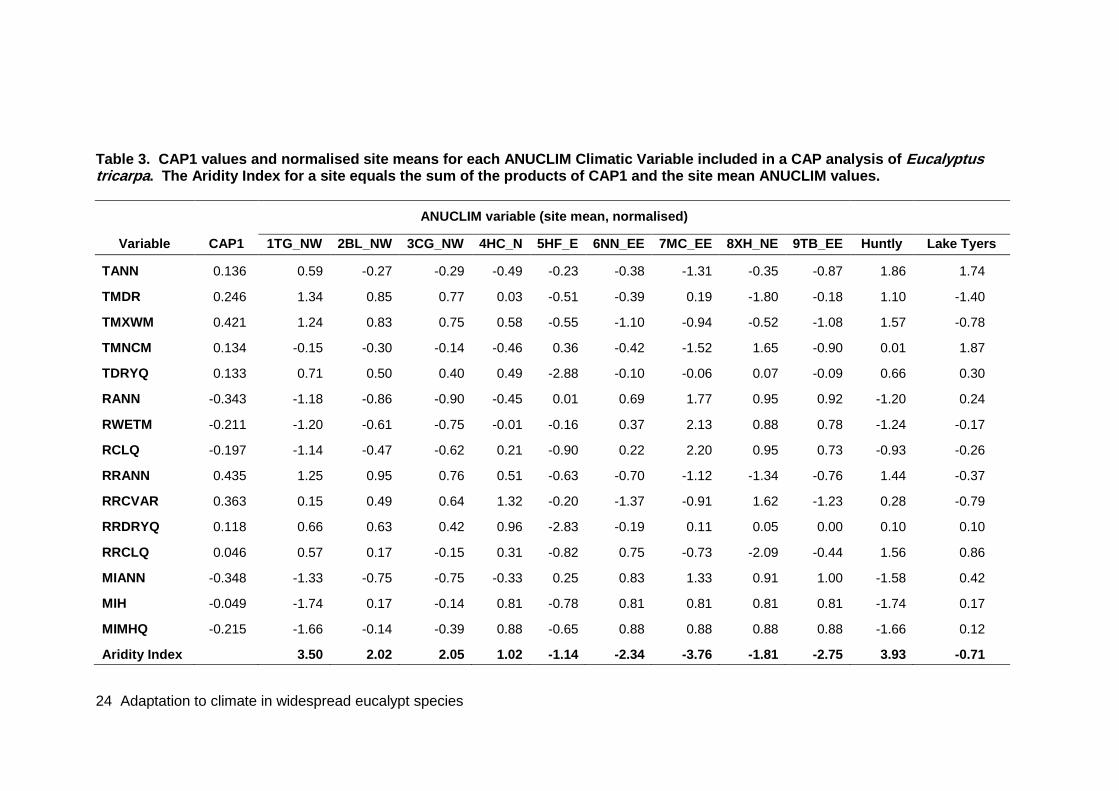
24 Adaptation to climate in widespread eucalypt species
Table 3. CAP1 values and normalised site means for each ANUCLIM Climatic Variable included in a CAP analysis of Eucalyptus tricarpa. The Aridity Index for a site equals the sum of the products of CAP1 and the site mean ANUCLIM values.
ANUCLIM variable (site mean, normalised) Variable CAP1 1TG_NW 2BL_NW 3CG_NW 4HC_N 5HF_E 6NN_EE 7MC_EE 8XH_NE 9TB_EE Huntly Lake Tyers
TANN 0.136 0.59 -0.27 -0.29 -0.49 -0.23 -0.38 -1.31 -0.35 -0.87 1.86 1.74
TMDR 0.246 1.34 0.85 0.77 0.03 -0.51 -0.39 0.19 -1.80 -0.18 1.10 -1.40
TMXWM 0.421 1.24 0.83 0.75 0.58 -0.55 -1.10 -0.94 -0.52 -1.08 1.57 -0.78
TMNCM 0.134 -0.15 -0.30 -0.14 -0.46 0.36 -0.42 -1.52 1.65 -0.90 0.01 1.87
TDRYQ 0.133 0.71 0.50 0.40 0.49 -2.88 -0.10 -0.06 0.07 -0.09 0.66 0.30
RANN -0.343 -1.18 -0.86 -0.90 -0.45 0.01 0.69 1.77 0.95 0.92 -1.20 0.24
RWETM -0.211 -1.20 -0.61 -0.75 -0.01 -0.16 0.37 2.13 0.88 0.78 -1.24 -0.17
RCLQ -0.197 -1.14 -0.47 -0.62 0.21 -0.90 0.22 2.20 0.95 0.73 -0.93 -0.26
RRANN 0.435 1.25 0.95 0.76 0.51 -0.63 -0.70 -1.12 -1.34 -0.76 1.44 -0.37
RRCVAR 0.363 0.15 0.49 0.64 1.32 -0.20 -1.37 -0.91 1.62 -1.23 0.28 -0.79
RRDRYQ 0.118 0.66 0.63 0.42 0.96 -2.83 -0.19 0.11 0.05 0.00 0.10 0.10
RRCLQ 0.046 0.57 0.17 -0.15 0.31 -0.82 0.75 -0.73 -2.09 -0.44 1.56 0.86
MIANN -0.348 -1.33 -0.75 -0.75 -0.33 0.25 0.83 1.33 0.91 1.00 -1.58 0.42
MIH -0.049 -1.74 0.17 -0.14 0.81 -0.78 0.81 0.81 0.81 0.81 -1.74 0.17
MIMHQ -0.215 -1.66 -0.14 -0.39 0.88 -0.65 0.88 0.88 0.88 0.88 -1.66 0.12
Aridity Index 3.50 2.02 2.05 1.02 -1.14 -2.34 -3.76 -1.81 -2.75 3.93 -0.71

Adaptation to climate in widespread eucalypt species 25
temperature in the warmest month (TMXWM, R2 = 0.971, P (DFDR) <0.001) and the mean temperature of the warmest quarter (TWMQ, R2 = 0.932, P (DFDR) <0.001); Rainfall – negative correlations were observed with the mean rainfall in the driest quarter (RDRYQ, R2 = 0.965, P (DFDR) <0.001) and the mean rainfall in the driest month (RDRYM, R2 = 0.959, P (DFDR) <0.001); Radiation – positive correlations were observed with mean radiation level in the highest month (RRH, R2 = 0.931, P (DFDR) <0.001) and mean radiation in the warmest quarter (RRWMQ, R2 = 0.931, P (DFDR) = 0.001); Moisture indices – negative correlations were observed with lowest period moisture index (MIL, R2 = 0.960, P (DFDR) <0.001), mean moisture index of lowest quarter (MIMLQ, , R2 = 0.965, P (DFDR) <0.001) and mean moisture index of the warmest quarter (MIMWMQ, R2 = 0.952, P (DFDR) <0.001), and positive correlations were observed with moisture index seasonality (MICVAR, R2 = 0.949, P (DFDR) <0.001). Obviously, many of the climatic variables are inter-correlated, but the main conclusion that can be drawn from these results is that the adaptive genetic index (CAP1) is strongly positively correlated with high temperatures, high irradiation and low rainfall.
The results of the ANOVAs of physiological/morphometric data are shown in Appendix 5. After correcting for a 5% DFDR, there were significant differences in 11 of the 15 traits among the provenances growing in the wild. Leaf area, leaf dry weight, number of stems and the circumference of the main stem were not significantly different among populations. However, the thickness and density of leaves, and related physiological measurements (e.g., SLA) were significantly different among wild populations. Linear regression analysis of the adaptive genetic index (CAP1) and physiological/morphometric traits measured in wild populations (Appendix 6) yielded no significant correlations, suggesting that the differences observed in these traits in the wild populations may have been influenced by a variety of environmental factors, obscuring any genetic influences that may be present.
In the Lake Tyers (wet) trial there were significant differences among provenances in seven of the 15 measured traits, including leaf size, leaf dry weight, and leaf C and N content (Appendix 5). Linear regression identified only two of these seven traits that were associated with provenance variation in the adaptive genetic index (CAP1) at this site (Appendix 7), mean leaf size (negative association, R2 = 0.817, P (DFDR) = 0.035) and mean leaf dry weight (negative correlation, R2 = 0.762, P (DFDR) = 0.035. In contrast, on the dry site (Huntly field trial) only mean leaf thickness and mean SLA were significantly different among provenances (Appendix 5). Linear regression identified that both of these traits were significantly associated with the adaptive genetic index at the dry site (Appendix 7): mean leaf thickness (positive correlation, R2 = 0.851, P (DFDR) = 0.015) and mean SLA (negative correlation, R2 = 0.832, P (DFDR) = 0.015). Hence, some genetic basis was identified for the morphological differences identified in the field trials.
The plasticity of these traits also appeared to have an adaptive genetic basis. Linear regression analysis of trait plasticity indices (RTR) found significant correlations (Appendix 8) of leaf area RTR (negative correlation, R2 = 0.613, P (DFDR) = 0.037), SLA RTR (positive correlation, R2 = 0.787, P (DFDR) = 0.010) and leaf thickness RTR (negative correlation, R2 = 0.795, P (DFDR) = 0.010) with the adaptive genetic index. There is also some indication that differential growth of the provenances on the two trial sites reflects differences in adaptation, as the RTR for tree height (Appendix 8; negative correlation, R2 = 0.772, P (DFDR) = 0.018) and stem cross sectional area (Appendix 8; negative correlation, R2 = 0.621, P (DFDR) = 0.037) were significantly associated with the adaptive genetic index.

26 Adaptation to climate in widespread eucalypt species
Of 94 outlying Tri-DArTseq markers, 11 showed significant correlations with various climatic and/or physiological/morphometric traits and the genetic index (CAP1) (Table 4). Seven markers (Tri-DArTseq 1567, Tri-DArTseq 1779, Tri-DArTseq 1783, Tri-DArTseq 2777, Tri-DArTseq 3169, Tri-DArTseq 4415 and Tri-DArTseq 5899) showed associations with both climatic variables (e.g., see Figure 8) and physiological/morphometric traits, suggesting that these markers may be linked to regions of the genome that are involved with physiological adaptation to climate. For example, the allele frequency of Tri-DArT 1567 is positively correlated with an arid climate (ie., high temperature and irradiation and low moisture and seasonality) and is also strongly positively correlated with SLA plasticity (RTR) (R2=0.868, P (FDR) = 0.012), leaf thickness at the Huntly (dry) trial site (R2=0.820, P (FDR) = 0.05) and slightly negatively correlated with mean SLA at the Huntly trial site (R2=0.884, P (FDR) = 0.016). These data suggest that Tri-DArT 1567 is linked to a region of the genome that affects plasticity of leaf thickness and SLA. Similarly, allele frequency of Tri-DArTseq 1779 is positively associated with climatic variables associated with wetter sites (ie., higher moisture, lower irradiation, lower temperatures), leaf size plasticity (RTR) and leaf size at the Lake Tyers (wet) trial site, suggesting that this marker may be involved with the plasticity of leaf size. On the other hand, as the frequency of Tri-DArTseq 5899 increases (i.e., the ‘1’ allele), the leaf size at the Lake Tyers trial decreases, as does the plasticity (RTR) of leaf size. This latter example, while perhaps counter-intuitive, may simply be an indication that the ‘0’ allele of Tri-DArTseq 5899 is positively correlated with leaf area and plasticity of leaf area.
Figure 8: The allele (band) frequency of three Eucalyptus tricarpa DArTseq markers showed a strong, highly significant (P < 0.001) correlation to the Aridity Index of each site.
0.00
0.20
0.40
0.60
0.80
1.00
1.20
-4 -2 0 2 4 6
Band
Fre
quen
cy
Aridity Index (CAP1)
TriDArTseq1567
TriDArTseq1779
TriDArTseq4415

Adaptation to climate in widespread eucalypt species 27
Table 4: Correlations between the allele frequencies of Eucalyptus tricarpa DArTseq markers and various climatic, morphological and genetic traits. R2 is the correlation coefficient. A negative regression coefficient indicates that the variable decreases in magnitude as the allele frequency (presence) of a DArTseq marker in a population increases. P (FDR) is the probability that has been corrected for a false discovery rate (FDR) of 0.05. Appendix 5
DArTmarker trait Trait type No Pops
R2 Y intercept
Regression Coeff
P (exact) P (FDR)
P (exact)
P (FDR)
Tri-DArTseq 1059 Adaptive Genetic Index (CAP1)
CAP-based trait 9 0.786 0.368 -5.400 0.002 0.034 ** *
Tri-DArTseq 1059 MIANN Climate (ANUCLIM) 9 0.750 -1.017 2.019 0.003 0.046 ** * Tri-DArTseq 1059 MICVAR Climate (ANUCLIM) 9 0.812 1.119 -0.018 0.001 0.029 *** * Tri-DArTseq 1059 MIL Climate (ANUCLIM) 9 0.817 -0.230 2.322 0.001 0.035 *** * Tri-DArTseq 1059 MIMLQ Climate (ANUCLIM) 9 0.773 -0.197 1.837 0.002 0.042 ** * Tri-DArTseq 1059 MIMWMQ Climate (ANUCLIM) 9 0.765 -0.150 1.576 0.002 0.048 ** * Tri-DArTseq 1059 RDRYM Climate (ANUCLIM) 9 0.795 -0.302 0.066 0.001 0.031 ** * Tri-DArTseq 1059 RRH Climate (ANUCLIM) 9 0.855 6.469 -0.239 0.000 0.014 *** * Tri-DArTseq 1059 TMXWM Climate (ANUCLIM) 9 0.832 3.730 -0.126 0.001 0.015 *** * Tri-DArTseq 1059 TWMQ Climate (ANUCLIM) 9 0.778 4.565 -0.225 0.002 0.039 ** * Tri-DArTseq 1079 Huntly trial leaf
thickness mean Trial population trait 9 0.780 0.449 1.627 0.002 0.050 ** *
Tri-DArTseq 1079 Huntly trial SLA mean
Trial population trait 9 0.802 1.441 -0.013 0.001 0.038 ** *
Tri-DArTseq 1567 Adaptive Genetic
Index (CAP1) CAP-based trait 9 0.879 0.752 3.449 0.000 0.018 *** *
Tri-DArTseq 1567 Aridity Index (AI) CAP-based trait 9 0.837 0.748 0.058 0.001 0.017 *** *

28 Adaptation to climate in widespread eucalypt species
DArTmarker trait Trait type No Pops
R2 Y intercept
Regression Coeff
P (exact) P (FDR)
P (exact)
P (FDR)
Tri-DArTseq 1567 MIANN Climate (ANUCLIM) 9 0.819 1.625 -1.274 0.001 0.025 *** * Tri-DArTseq 1567 MICVAR Climate (ANUCLIM) 9 0.795 0.302 0.011 0.001 0.029 ** * Tri-DArTseq 1567 MIL Climate (ANUCLIM) 9 0.790 1.106 -1.379 0.001 0.035 ** * Tri-DArTseq 1567 MIMLQ Climate (ANUCLIM) 9 0.843 1.108 -1.158 0.001 0.025 *** * Tri-DArTseq 1567 MIMWMQ Climate (ANUCLIM) 9 0.846 1.080 -1.001 0.000 0.021 *** * Tri-DArTseq 1567 RANN Climate (ANUCLIM) 9 0.841 1.291 -0.001 0.001 0.017 *** * Tri-DArTseq 1567 RDRYM Climate (ANUCLIM) 9 0.821 1.163 -0.041 0.001 0.031 *** * Tri-DArTseq 1567 RDRYQ Climate (ANUCLIM) 9 0.883 1.213 -0.003 0.000 0.009 *** ** Tri-DArTseq 1567 RRH Climate (ANUCLIM) 9 0.744 -2.686 0.135 0.003 0.043 ** * Tri-DArTseq 1567 RWETQ Climate (ANUCLIM) 9 0.807 1.386 -0.003 0.001 0.031 ** * Tri-DArTseq 1567 TMXWM Climate (ANUCLIM) 9 0.809 -1.249 0.075 0.001 0.018 *** * Tri-DArTseq 1567 TWMQ Climate (ANUCLIM) 9 0.808 -1.831 0.139 0.001 0.031 *** * Tri-DArTseq 1567 SLA RTR Plastic population trait 9 0.868 0.322 0.861 0.000 0.012 *** * Tri-DArTseq 1567 Huntly trial leaf
thickness mean Trial population trait 9 0.820 -1.276 6.611 0.001 0.050 *** *
Tri-DArTseq 1567 Huntly trial SLA mean
Trial population trait 9 0.884 2.804 -0.056 0.000 0.016 *** *
Tri-DArTseq 1779 Adaptive Genetic
Index (CAP1) CAP-based trait 9 0.848 0.605 -5.006 0.000 0.020 *** *
Tri-DArTseq 1779 Aridity Index (AI) CAP-based trait 9 0.911 0.611 -0.090 0.000 0.006 *** ** Tri-DArTseq 1779 MIANN Climate (ANUCLIM) 9 0.890 -0.742 1.963 0.000 0.006 *** ** Tri-DArTseq 1779 MICVAR Climate (ANUCLIM) 9 0.801 1.271 -0.016 0.001 0.029 ** * Tri-DArTseq 1779 MIL Climate (ANUCLIM) 9 0.821 0.071 2.077 0.001 0.035 *** *

Adaptation to climate in widespread eucalypt species 29
DArTmarker trait Trait type No Pops
R2 Y intercept
Regression Coeff
P (exact) P (FDR)
P (exact)
P (FDR)
Tri-DArTseq 1779 MIMCLQ Climate (ANUCLIM) 9 0.857 -3.089 3.954 0.000 0.012 *** * Tri-DArTseq 1779 MIMLQ Climate (ANUCLIM) 9 0.839 0.080 1.707 0.001 0.025 *** * Tri-DArTseq 1779 MIMWMQ Climate (ANUCLIM) 9 0.828 0.125 1.463 0.001 0.021 *** * Tri-DArTseq 1779 RANN Climate (ANUCLIM) 9 0.838 -0.191 0.001 0.001 0.017 *** * Tri-DArTseq 1779 RDRYM Climate (ANUCLIM) 9 0.874 -0.022 0.062 0.000 0.021 *** * Tri-DArTseq 1779 RDRYQ Climate (ANUCLIM) 9 0.877 -0.076 0.005 0.000 0.009 *** ** Tri-DArTseq 1779 RRH Climate (ANUCLIM) 9 0.747 5.695 -0.200 0.003 0.043 ** * Tri-DArTseq 1779 RWETQ Climate (ANUCLIM) 9 0.855 -0.361 0.004 0.000 0.021 *** * Tri-DArTseq 1779 TMXWM Climate (ANUCLIM) 9 0.880 3.688 -0.115 0.000 0.015 *** * Tri-DArTseq 1779 TWMQ Climate (ANUCLIM) 9 0.915 4.666 -0.218 0.000 0.005 *** ** Tri-DArTseq 1779 Leaf area RTR Plastic population trait 9 0.799 0.334 0.819 0.001 0.036 ** * Tri-DArTseq 1779 Lake Tyers trial
leaf area mean Trial population trait 9 0.792 -0.669 0.074 0.001 0.034 ** *
Tri-DArTseq 1783 MIANN Climate (ANUCLIM) 9 0.729 1.441 -0.942 0.003 0.046 ** * Tri-DArTseq 1783 MIMCLQ Climate (ANUCLIM) 9 0.771 2.653 -1.989 0.002 0.036 ** * Tri-DArTseq 1783 RWETQ Climate (ANUCLIM) 9 0.783 1.285 -0.002 0.002 0.036 ** * Tri-DArTseq 1783 SLA RTR Plastic population trait 9 0.867 0.458 0.674 0.000 0.012 *** * Tri-DArTseq 1783 Huntly trial SLA
mean Trial population trait 9 0.796 2.322 -0.042 0.001 0.038 ** *
Tri-DArTseq 2049 Huntly trial leaf
thickness mean Trial population trait 9 0.795 -0.646 4.591 0.001 0.050 ** *

30 Adaptation to climate in widespread eucalypt species
DArTmarker trait Trait type No Pops
R2 Y intercept
Regression Coeff
P (exact) P (FDR)
P (exact)
P (FDR)
Tri-DArTseq 2049 Huntly trial SLA mean
Trial population trait 9 0.770 2.113 -0.037 0.002 0.044 ** *
Tri-DArTseq 2777 MICVAR Climate (ANUCLIM) 9 0.776 1.143 -0.011 0.002 0.031 ** * Tri-DArTseq 2777 MIL Climate (ANUCLIM) 9 0.763 0.326 1.397 0.002 0.035 ** * Tri-DArTseq 2777 RRH Climate (ANUCLIM) 9 0.753 4.249 -0.140 0.002 0.043 ** * Tri-DArTseq 2777 Lake Tyers trial
leaf area mean Trial population trait 9 0.785 -0.199 0.051 0.002 0.034 ** *
Tri-DArTseq 3169 MIANN Climate (ANUCLIM) 9 0.737 0.852 -1.037 0.003 0.046 ** * Tri-DArTseq 3169 MIMCLQ Climate (ANUCLIM) 9 0.903 2.342 -2.355 0.000 0.008 *** ** Tri-DArTseq 3169 RWETQ Climate (ANUCLIM) 9 0.760 0.670 -0.002 0.002 0.041 ** * Tri-DArTseq 3169 Leaf area RTR Plastic population trait 9 0.807 0.300 -0.478 0.001 0.036 *** * Tri-DArTseq 4415 Adaptive Genetic
Index (CAP1) CAP-based trait 9 0.748 0.777 2.046 0.003 0.049 ** *
Tri-DArTseq 4415 Aridity Index (AI) CAP-based trait 9 0.851 0.775 0.038 0.000 0.017 *** * Tri-DArTseq 4415 MIANN Climate (ANUCLIM) 9 0.920 1.373 -0.869 0.000 0.004 *** ** Tri-DArTseq 4415 MICVAR Climate (ANUCLIM) 9 0.821 0.483 0.007 0.001 0.029 *** * Tri-DArTseq 4415 MIL Climate (ANUCLIM) 9 0.781 1.004 -0.882 0.002 0.035 ** * Tri-DArTseq 4415 MIMCLQ Climate (ANUCLIM) 9 0.851 2.380 -1.715 0.000 0.012 *** * Tri-DArTseq 4415 MIMLQ Climate (ANUCLIM) 9 0.804 1.001 -0.728 0.001 0.033 ** * Tri-DArTseq 4415 MIMWMQ Climate (ANUCLIM) 9 0.837 0.987 -0.640 0.001 0.021 *** * Tri-DArTseq 4415 RANN Climate (ANUCLIM) 9 0.837 1.123 -0.001 0.001 0.017 *** *

Adaptation to climate in widespread eucalypt species 31
DArTmarker trait Trait type No Pops
R2 Y intercept
Regression Coeff
P (exact) P (FDR)
P (exact)
P (FDR)
Tri-DArTseq 4415 RDRYM Climate (ANUCLIM) 9 0.792 1.037 -0.026 0.001 0.031 ** * Tri-DArTseq 4415 RDRYQ Climate (ANUCLIM) 9 0.792 1.058 -0.002 0.001 0.041 ** * Tri-DArTseq 4415 RRANN Climate (ANUCLIM) 9 0.905 -1.703 0.159 0.000 0.007 *** ** Tri-DArTseq 4415 RRH Climate (ANUCLIM) 9 0.848 -1.582 0.093 0.000 0.014 *** * Tri-DArTseq 4415 RWETQ Climate (ANUCLIM) 9 0.847 1.195 -0.002 0.000 0.021 *** * Tri-DArTseq 4415 TMXWM Climate (ANUCLIM) 9 0.830 -0.527 0.049 0.001 0.015 *** * Tri-DArTseq 4415 TSPAN Climate (ANUCLIM) 9 0.858 -0.447 0.050 0.000 0.032 *** * Tri-DArTseq 4415 TWMQ Climate (ANUCLIM) 9 0.833 -0.910 0.091 0.001 0.028 *** * Tri-DArTseq 4415 Lake Tyers trial
leaf area mean Trial population trait 9 0.872 1.359 -0.034 0.000 0.022 *** *
Tri-DArTseq 5899 Adaptive Genetic
Index (CAP1) CAP-based trait 9 0.792 0.704 3.728 0.001 0.034 ** *
Tri-DArTseq 5899 Aridity Index (AI) CAP-based trait 9 0.786 0.700 0.064 0.002 0.034 ** * Tri-DArTseq 5899 MIANN Climate (ANUCLIM) 9 0.783 1.677 -1.418 0.002 0.036 ** * Tri-DArTseq 5899 MICVAR Climate (ANUCLIM) 9 0.767 0.202 0.012 0.002 0.031 ** * Tri-DArTseq 5899 MIL Climate (ANUCLIM) 9 0.759 1.100 -1.539 0.002 0.035 ** * Tri-DArTseq 5899 MIMCLQ Climate (ANUCLIM) 9 0.768 3.399 -2.885 0.002 0.036 ** * Tri-DArTseq 5899 RDRYM Climate (ANUCLIM) 9 0.776 1.159 -0.045 0.002 0.032 ** * Tri-DArTseq 5899 RRH Climate (ANUCLIM) 9 0.853 -3.487 0.164 0.000 0.014 *** * Tri-DArTseq 5899 TMXWM Climate (ANUCLIM) 9 0.831 -1.606 0.087 0.001 0.015 *** * Tri-DArTseq 5899 Leaf area RTR Plastic population trait 9 0.835 0.918 -0.645 0.001 0.036 *** * Tri-DArTseq 5899 Lake Tyers trial
leaf area mean Trial population trait 9 0.834 1.711 -0.058 0.001 0.028 *** *

32 Adaptation to climate in widespread eucalypt species
3.2 Results of Eucalyptus salubris study
3.2.1 Environmental variation along the gradient
The nine study populations were selected across an aridity gradient, with variation in both rainfall and temperature contributing to the variation in aridity. Across the study sites, the aridity index (ratio of MAP to mean annual potential evaporation; P/PE) correlated strongly with long term MAP, mean winter precipitation, mean annual temperature, and mean annual evaporation (R2 > 0.8). However, the climate during the 3, 6 and 12 months immediately prior to sampling did not correlate well with the corresponding long term averages (R2 < 0.15 for all variables).
Soil parameters also varied among the study sites. Nitrate levels were slightly higher at the Kangaroo Hills and Bruce Rock sites, with 15 and 20 mg kg-1 compared with < 4 mg kg-1 at all other sites (Appendix 2). Phosphorus levels were also slightly elevated at Bruce Rock, but ammonium levels were low at all sites. Soil pH varied from mildly acidic at some intermediate and low aridity sites, through to highly alkaline (pH > 8) at other sites. Soil particle size composition varied among sites, but did not correlate with the aridity gradient. Most sites had primarily sandy soils, except at Kangaroo Hills and Ravensthorpe (sites 4 and 9) which had high clay content, and at Credo Station (3) where the soil was a fairly even mix of clay, silt and sands.
3.2.2 Morphology and physiology along the gradient
The E. salubris populations showed little indication of functional response to climate along the gradient (Figure 9). The only measured trait to correlate significantly with aridity was the number of stems per tree (Figure 9a). The number of stems also correlated significantly with MAP, mean annual evaporation, soil ammonium content and soil pH (Table 5). Leaf nitrogen content (on a per dry mass basis) did not correlate with aridity, but did correlate with other climate parameters including MAP, mean, minimum and maximum temperatures, mean annual irradiance and mean annual evaporation, as well as soil phosphorus content (Table 5). In contrast, leaf N content per area and leaf density showed little difference among provenances, and did not correlate significantly with any of the measured climate or soil parameters (Figure 9b, c).
Other traits appeared to correlate with aspects of the environment, but upon closer inspection the relationships seemed unlikely to be causal. Leaf size and tree height correlated only with soil nitrate content (Table 5), but this was due only to a single outlier site (6. Bruce Rock) having elevated nitrate levels with slightly taller trees and larger leaves. When the Bruce Rock site was removed from the dataset, leaf size and tree height across the other eight populations did not correlate with soil nitrate content or with any other environmental variable. Leaf size and tree height of the E. salubris populations therefore does not appear to be related to any of the environmental parameters included in this study.
Leaf thickness and SLA measured in the wild showed considerable variation among provenances and appeared to correlate with several long term climatic parameters, including mean daily maximum temperature, mean annual solar irradiance and MAP (Figure 9c, Table 5). However, thicker leaves and lower SLA were associated with lower temperatures, lower solar irradiance and higher rainfall conditions, the opposite of the usual relationship of these traits with climate. Leaf thickness and SLA also
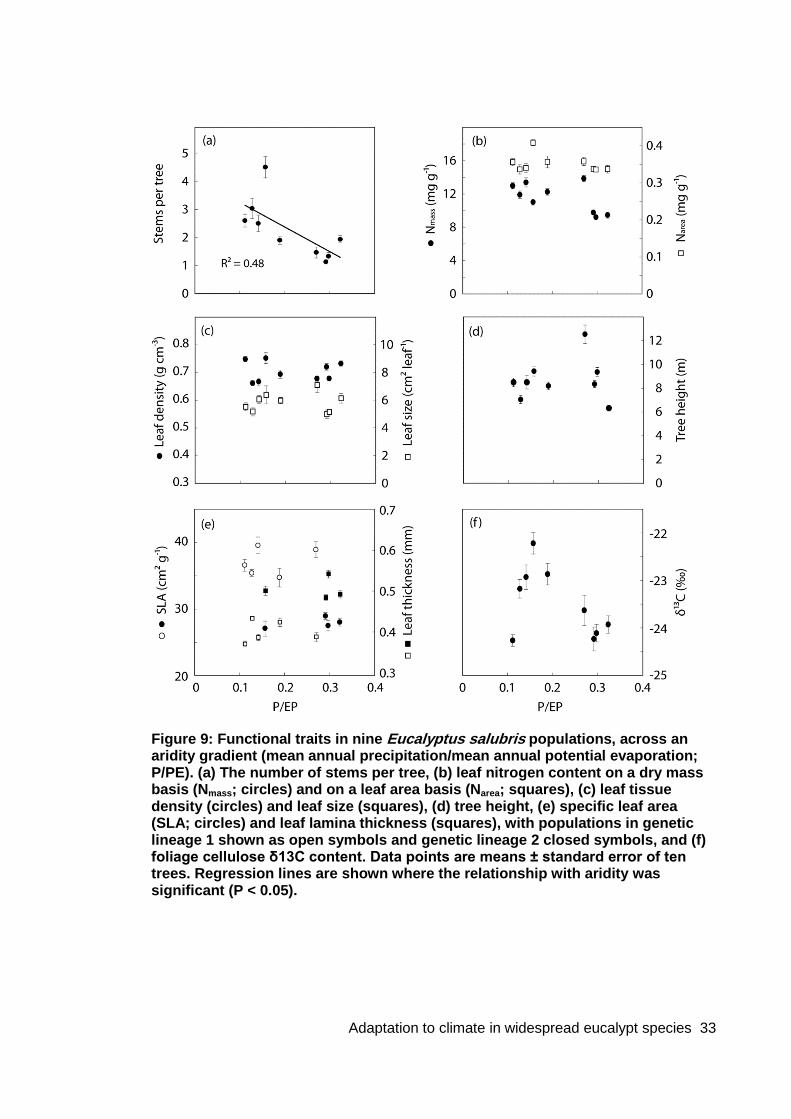
Adaptation to climate in widespread eucalypt species 33
Figure 9: Functional traits in nine Eucalyptus salubris populations, across an aridity gradient (mean annual precipitation/mean annual potential evaporation; P/PE). (a) The number of stems per tree, (b) leaf nitrogen content on a dry mass basis (Nmass; circles) and on a leaf area basis (Narea; squares), (c) leaf tissue density (circles) and leaf size (squares), (d) tree height, (e) specific leaf area (SLA; circles) and leaf lamina thickness (squares), with populations in genetic lineage 1 shown as open symbols and genetic lineage 2 closed symbols, and (f) foliage cellulose δ13C content. Data points are means ± standard error of ten trees. Regression lines are shown where the relationship with aridity was significant (P < 0.05).

34 Adaptation to climate in widespread eucalypt species
Table 5: Environmental variables giving the best (highest R2) correlations with each of the measured traits in Eucalyptus salubris across an aridity gradient. The slope and y-intercept (± standard errors) of each relationship is shown and t-test probability (P) for the slope of each relationship is provided.
Trait Environmental parameter R2 P Slope Intercept
Leaf size (cm2) *soil nitrate (mg kg-1) 0.52 0.027 0.07 ± 0.02 5.4 ± 0.2
Leaf density (g cm-3)
no significantly correlating parameters
Leaf thickness (mm)
mean daily maximum temperature (°C)
0.67 0.007 -0.031 ± 0.008 1.20 ± 0.20
mean annual solar radiation (MJ m-2)
0.58 0.017 -0.004 ± 0.001 1.3 ± 0.28
SLA (cm2 g-1)
soil phosphorus (mg kg-1) 0.72 0.004 1.5 ± 0.3 25 ± 2
mean daily maximum temperature (°C) 0.57 0.018 2.4 ± 0.8 -25 ± 19
Foliage δ13C (‰)
precipitation during prior 12 months (mm) 0.83 0.001 -0.010 ± 0.002 -19.4 ± 0.7
potential evaporation during prior 3 months (mm) 0.56 0.02 0.003 ± 0.001 -25.1 ± 0.6
Leaf N content (mass) (% w/w)
mean daily maximum temperature (°C) 0.71 0.004 0.09 ± 0.02 -1.1 ± 0.5
mean annual solar radiation (MJ m-2) 0.70 0.005 0.012 ± 0.003 -1.6 ± 0.7
soil phosphorus (mg kg-1) 0.69 0.005 0.05 ± 0.01 0.87 ± 0.08
Leaf N content (area) (mg cm-2)
no significantly correlating parameters
Number of stems
soil ammonium (mg kg-1) 0.54 0.024 -0.54 ± 0.06 3.3 ± 0.3
P/PE 0.48 0.038 -4.0 ± 0.5 1.6 ± 0.1
Tree height (m) *soil nitrate (mg kg-1) 0.58 0.018 0.19 ± 0.06 7.7 ± 0.5
* Correlations with soil nitrate were due only to a single outlying study site (6. Bruce Rock). When this site was removed, leaf size and tree height did not correlate with any environmental parameter.
P/PE; ratio of mean annual precipitation to mean annual potential evaporation

Adaptation to climate in widespread eucalypt species 35
correlated with the soil parameters of phosphorus and clay content, with thicker, lower SLA leaves occurring with higher clay content and lower phosphorus levels. However the magnitude of the variation in these soil parameters was fairly small, and it is unclear whether they may be causally related to the variation in leaf thickness and SLA. Leaf thickness and SLA do correspond well with the two genetic lineages of E. salubris identified in this study (see section 3.2.3, genomic results, below), with each lineage having a fairly uniform leaf thickness (Figure 9e). Genetically fixed differences between lineages is a likely explanation for the observed variation in leaf thickness and SLA. In addition, leaf thickness and N content per dry mass were very strongly correlated, with thinner leaves having a higher N content (Figure 10). The two traits offset each other, and result in fairly equal N levels per leaf area among provenances. Since N per leaf area is usually of greater functional importance than N per leaf dry mass or leaf thickness, the higher tissue N levels might compensate for thinner leaves in the more arid provenances.
Figure 10: Relationship between leaf nitrogen content per dry mass (Nmass) and leaf lamina thickness, in nine populations of Eucalyptus salubris across an aridity gradient. Closed circles indicate populations of genetic “lineage 1” and open squares genetic “lineage 2” (see text for further details). Data are means ± standard error of ten trees.
Water use efficiency, as determined by foliage cellulose 13C content, was strongly related to the recent climatic conditions in E. salubris. The foliage 13C content correlated very strongly with precipitation during the 12 months immediately prior to sampling (Table 5, Figure 11), and also correlated more weakly with several other recent climate variables (including potential evaporation and solar radiation during the previous 6 months, and during the previous 3 months). The 13C content did not correlate significantly with any long term climate or soil parameter. None of the other functional traits correlated significantly with 13C content or recent climate.

36 Adaptation to climate in widespread eucalypt species
Figure 11: Relationship between foliage cellulose 13C content and precipitation during the 12 months immediately prior to sampling, in nine populations of Eucalyptus salubris across an aridity gradient. Data points are means ± standard error of ten trees.
3.2.3 Genomic results
An initial screening of the E. salubris DArTseq data using Splitstree4 (Huson and Bryant 2006) identified two ‘outlying’ samples - QV23 and KH18 - that did not cluster with the other samples from the relevant collection sites; these trees were excluded from all further analyses. The full DArTseq data set for E. salubris comprised 268 samples and 16,122 DArTseq markers (1.6% missing data).
An AMOVA of the full data set showed that 15% of the variance was due to among-provenance differences and 85% was variance that occurred within provenances. PCoA showed that 59.4% of the variance could be accounted for along PCo1 (X axis), and 10% along PCo2 (Y axis). Figure 12 shows the distinct geographic partitioning of genetic variance among provenances. Three of the four provenances from the relatively wet Southwest Botanical Province (SWP) of Western Australia formed a tight cluster that is separated along PCo1 from the provenances from the dry Eremaean Zone (E), one of the two botanical ‘interzone’ provenances (5_LJ_IZ) and one SWP provenance (6_BR_SWP). Kangaroo Hills (4_KH_IZ) was intermediate between the two extreme clusters, but was closer to the populations from the SWP. The intermediate position of the Kangaroo Hills provenance (4_KH_IZ) in Figure 11 is suggestive of a possible hybrid origin for this population (see Steane et al., 2011). Because of the extreme separation of three of the four SWP provenances (i.e., 7_DR_SWP, 8_LR_SWP, 9_RT_SWP) and the ‘interzone’ population at Kangaroo Hills (4_KH_IZ) from the other provenances, we hypothesised that there are two distinct genetic lineages within E. salubris (possibly cryptic species). We named the two lineages ‘Lineage 1’ (i.e., 1_QV_E, 2_BH_E, 3_CR_E, 5_LJ_IZ, 6_BR_SWP) and ‘Lineage 2’ (i.e., 4_KH_IZ, 7_DR_SWP, 8_LR_SWP, 9_RT_SWP) and analysed them separately. The populations in Lineage 1 were spread along PCo2, from relatively wet (6_BR_SWP) to relatively dry (1_QV_E) (Figure 11), whereas there was no separation of lineage 2 populations along PCO2. Due to time constraints, only the larger group of provenances that included the provenances from the Eremaean (dry) zone was analysed further.

Adaptation to climate in widespread eucalypt species 37
Figure 12: Principal Coordinates Plot of the full Eucalyptus salubris DArTseq data set (268 samples, 16122 DArTseq markers). PCo1 accounts for 16.9% of the total genetic variance. Two distinct genetic lineages are apparent.
AMOVA of the E. salubris ‘Lineage 1’ full data set (149 samples, 16,122 DArTseq markers) indicated that 6% of the genetic variance could be accounted for by differences among provenances; 94% of variance occurred within provenances. PCoA (Figure 13) demonstrated that genetic variance is partitioned spatially (by provenance) along a rainfall gradient, from 6_BR_SWP (relatively wet), sequentially through to 1_QV_E (the site with the lowest MAP). The separation observed here also corresponded to a general trend from west to east (see Figure 2). There was a strong correlation between genetic distance and geographic distance among ‘Lineage 1’ provenances (Rxy = 0.917, R2 = 0.84; Figure 14), but this trend was only weakly significant (P = 0.025), which may be due to the small sample size in ‘Lineage 1’.
The 1,173 markers with low allele frequencies were excluded from the Bayescan analysis. Of the remaining 14,949 DArTseq markers, only 18 (0.1%) were identified as ‘outlier loci’. AMOVA of ‘Lineage 1’ outlier loci indicated that 45% of the genetic variance could be accounted for by differences among provenances; 55% of the variance occurred within provenances. The PCoA (Figure 15) showed that 55% of the genetic variance was encompassed by PCo1 and, as was observed with the full ‘Lineage 1’ data set, the provenances were separated reasonably uniformly along PCo1 in order of MAP, although 1_QV_E and 2_BH_E were interspersed with one another. There was no significant correlation between genetic and geographic distances among provenances in this adaptive molecular space (Rxy = 0.398, R2 = 0.16; P = 0.23).
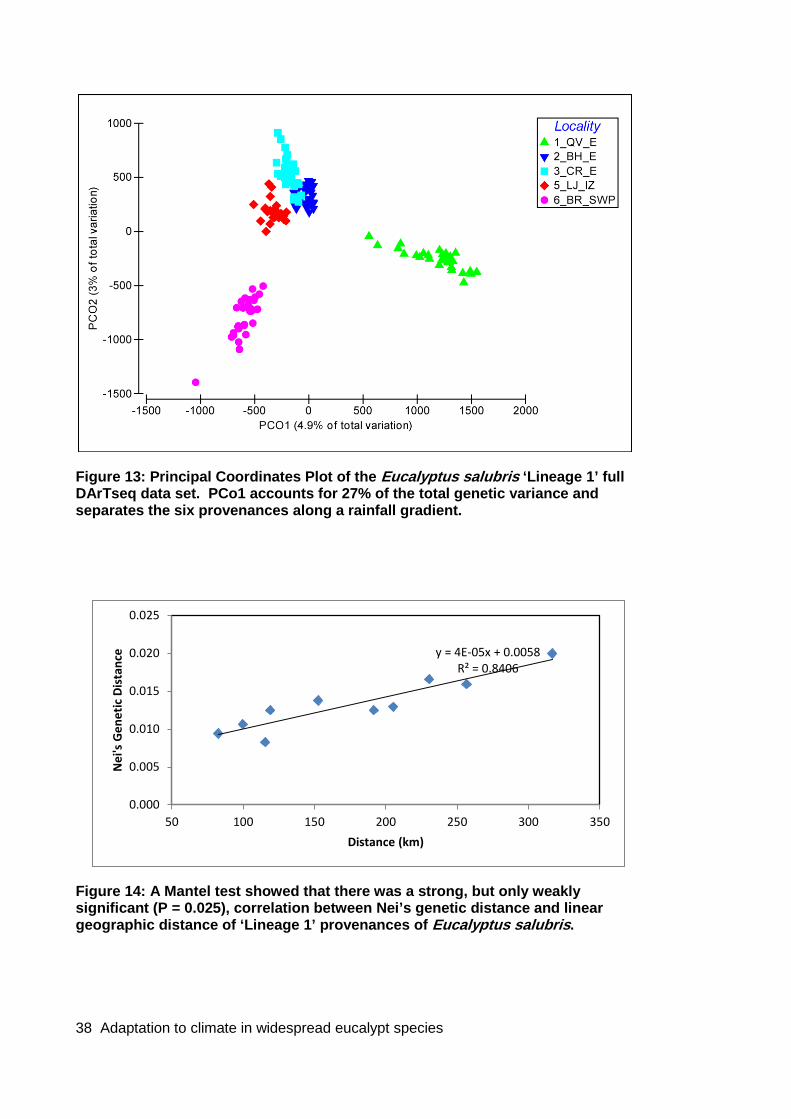
38 Adaptation to climate in widespread eucalypt species
Figure 13: Principal Coordinates Plot of the Eucalyptus salubris ‘Lineage 1’ full DArTseq data set. PCo1 accounts for 27% of the total genetic variance and separates the six provenances along a rainfall gradient.
Figure 14: A Mantel test showed that there was a strong, but only weakly significant (P = 0.025), correlation between Nei’s genetic distance and linear geographic distance of ‘Lineage 1’ provenances of Eucalyptus salubris.
y = 4E-05x + 0.0058 R² = 0.8406
0.000
0.005
0.010
0.015
0.020
0.025
50 100 150 200 250 300 350
Nei
's G
enet
ic D
ista
nce
Distance (km)

Adaptation to climate in widespread eucalypt species 39
Figure 15: Principal Coordinates Plot of Eucalyptus salubris ‘Lineage 1’ outlier Sal-DArTseq data set (149 samples, 18 loci). There is a general trend from wet (SWP, Southwestern Botanical Province) through the “interzone” (IZ) to dry localities (E, Eremaean zone).
Of 35 climatic variables downloaded from ANUCLIM, 15 were selected to represent: temperature (mean annual temperature, mean temperature of the wettest quarter, mean temperature of the driest quarter, mean temperature of the coldest quarter) precipitation (annual precipitation, precipitation of the wettest period, precipitation of the driest period, precipitation of the wettest quarter, precipitation of the driest quarter), solar radiation (mean annual radiation, radiation of the wettest quarter, radiation of the driest quarter), and moisture indices (mean annual moisture index, moisture index seasonality, mean moisture index of the warmest quarter) (see Appendix 1 for descriptions of climatic variables and Appendix 10 for correlations between climatic variables in E. salubris). In the CAP analysis of the ‘Lineage 1’ outlier markers (Figure 16), the first five canonical axes explained 99.9% of the variability in the genetic distance matrix amongst individuals; correlation between the genetic data and the climatic variables was strong (CAP1; δ2= 0.91, p=0.001). The CAP axes represent linear combinations of PCos based on genetic distances that have maximum correlation with the climatic variables in the analysis. Figure 15 shows the progression along CAP1 from the wettest site in the SWP through the intermediate IZ site to the dry sites in the Eremaean zone (_E). There appears to be a suite of climatic variables contributing to this, although mean temperature of the coldest quarter, mean annual moisture index and temperature of the driest quarter correlate most strongly with CAP1 (Figure 16, Table 6).

40 Adaptation to climate in widespread eucalypt species
Table 6: CAP1 values and normalised site means for each ANUCLIM Climatic Variable included in a CAP analysis of Eucalyptus salubris ‘Lineage 1’. The Aridity index for a site equals the sum of the products of weighting on CAP1 and the site mean ANUCLIM values.
Normalised ANUCLIM Value (site mean)
Variable CAP1 1_QV_E 2_BH_E 3_CR_E 5_LJ_IZ 6_BR_SWP
TANN 0.24 0.81 0.49 0.84 -1.26 -0.89
TWETQ 0.18 1.78 -0.36 -0.37 -0.51 -0.55
TDRYQ -0.30 -0.96 -0.75 -0.33 0.60 1.44
TCLQ 0.35 1.20 0.64 0.18 -0.80 -1.22
RANN -0.27 -0.93 -0.66 -0.31 0.30 1.59
RWETM -0.27 -0.64 -0.73 -0.27 -0.08 1.72
RDRYM -0.24 -0.74 -0.32 -0.30 1.76 -0.41
RWETQ -0.29 -0.66 -0.70 -0.34 -0.02 1.72
RDRYQ -0.20 -0.69 -0.41 -0.40 1.77 -0.27
RRANN 0.26 0.83 0.50 0.83 -1.21 -0.95
RRWETQ 0.13 1.78 -0.37 -0.34 -0.55 -0.53
RRDRYQ -0.29 -1.15 -0.73 -0.14 0.85 1.18
MIANN -0.34 -0.93 -0.60 -0.43 0.40 1.56
MICVAR -0.16 -1.24 -0.39 0.19 -0.07 1.51
MIMWMQ 0.26 0.45 0.45 0.45 0.45 -1.79
Aridity Index 3.55 1.91 1.15 -2.33 -4.28
The values of CAP1 for each of the 15 environmental variables were used to calculate the ‘Aridity Index’ for each site (Table 6). The ranking of each provenance based on AI is the same as that based on MAP (i.e., compare prefix numbers of population codes (1-6) to the relative magnitude of AI).
Linear regression of the adaptive genetic index (CAP1) against climatic variables and indices, corrected for a dependent false discovery rate (DFDR) of 5%, yielded no significant correlations (Appendix 11). This may be because the climate has not had a
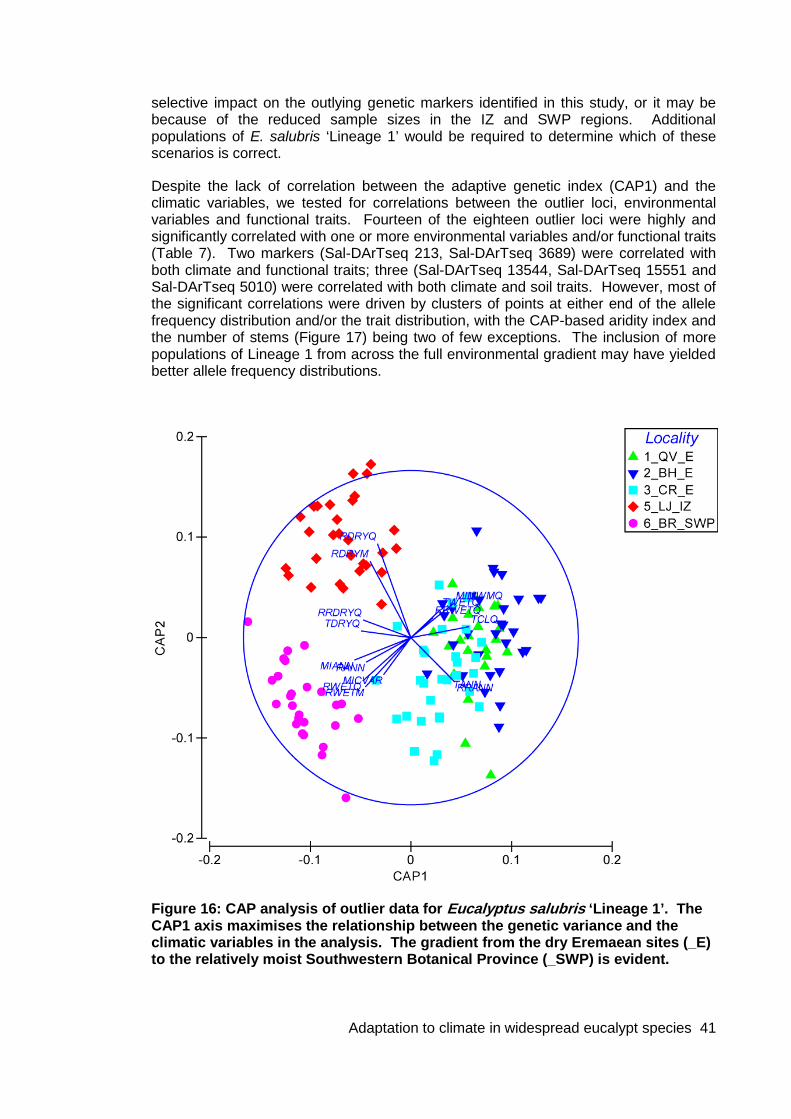
Adaptation to climate in widespread eucalypt species 41
selective impact on the outlying genetic markers identified in this study, or it may be because of the reduced sample sizes in the IZ and SWP regions. Additional populations of E. salubris ‘Lineage 1’ would be required to determine which of these scenarios is correct.
Despite the lack of correlation between the adaptive genetic index (CAP1) and the climatic variables, we tested for correlations between the outlier loci, environmental variables and functional traits. Fourteen of the eighteen outlier loci were highly and significantly correlated with one or more environmental variables and/or functional traits (Table 7). Two markers (Sal-DArTseq 213, Sal-DArTseq 3689) were correlated with both climate and functional traits; three (Sal-DArTseq 13544, Sal-DArTseq 15551 and Sal-DArTseq 5010) were correlated with both climate and soil traits. However, most of the significant correlations were driven by clusters of points at either end of the allele frequency distribution and/or the trait distribution, with the CAP-based aridity index and the number of stems (Figure 17) being two of few exceptions. The inclusion of more populations of Lineage 1 from across the full environmental gradient may have yielded better allele frequency distributions.
Figure 16: CAP analysis of outlier data for Eucalyptus salubris ‘Lineage 1’. The CAP1 axis maximises the relationship between the genetic variance and the climatic variables in the analysis. The gradient from the dry Eremaean sites (_E) to the relatively moist Southwestern Botanical Province (_SWP) is evident.
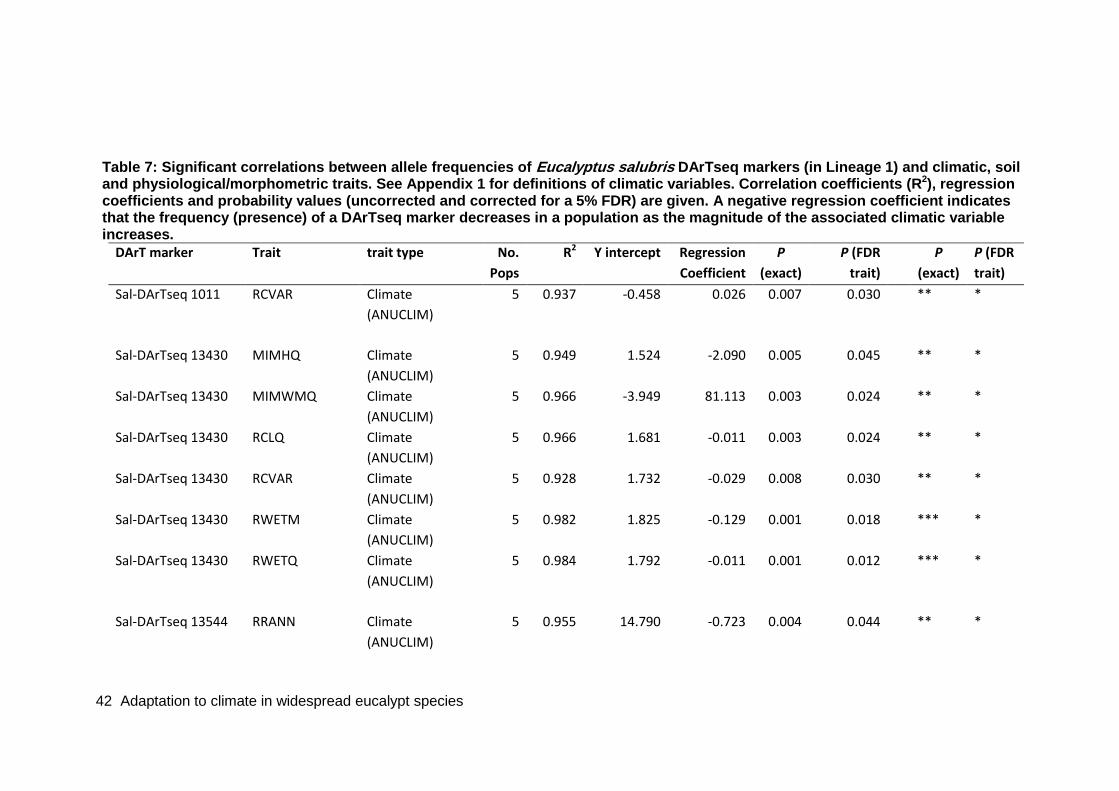
42 Adaptation to climate in widespread eucalypt species
Table 7: Significant correlations between allele frequencies of Eucalyptus salubris DArTseq markers (in Lineage 1) and climatic, soil and physiological/morphometric traits. See Appendix 1 for definitions of climatic variables. Correlation coefficients (R2), regression coefficients and probability values (uncorrected and corrected for a 5% FDR) are given. A negative regression coefficient indicates that the frequency (presence) of a DArTseq marker decreases in a population as the magnitude of the associated climatic variable increases.
DArT marker Trait trait type No. Pops
R2 Y intercept Regression Coefficient
P (exact)
P (FDR trait)
P (exact)
P (FDR trait)
Sal-DArTseq 1011 RCVAR Climate (ANUCLIM)
5 0.937 -0.458 0.026 0.007 0.030 ** *
Sal-DArTseq 13430 MIMHQ Climate
(ANUCLIM) 5 0.949 1.524 -2.090 0.005 0.045 ** *
Sal-DArTseq 13430 MIMWMQ Climate (ANUCLIM)
5 0.966 -3.949 81.113 0.003 0.024 ** *
Sal-DArTseq 13430 RCLQ Climate (ANUCLIM)
5 0.966 1.681 -0.011 0.003 0.024 ** *
Sal-DArTseq 13430 RCVAR Climate (ANUCLIM)
5 0.928 1.732 -0.029 0.008 0.030 ** *
Sal-DArTseq 13430 RWETM Climate (ANUCLIM)
5 0.982 1.825 -0.129 0.001 0.018 *** *
Sal-DArTseq 13430 RWETQ Climate (ANUCLIM)
5 0.984 1.792 -0.011 0.001 0.012 *** *
Sal-DArTseq 13544 RRANN Climate
(ANUCLIM) 5 0.955 14.790 -0.723 0.004 0.044 ** *

Adaptation to climate in widespread eucalypt species 43
Sal-DArTseq 13544 RRCLQ Climate (ANUCLIM)
5 0.996 12.002 -0.955 0.000 0.002 *** *
Sal-DArTseq 13544 RRCVAR Climate (ANUCLIM)
5 0.990 -9.076 0.286 0.000 0.008 *** *
Sal-DArTseq 13544 RRL Climate (ANUCLIM)
5 0.989 6.922 -0.635 0.001 0.009 *** *
Sal-DArTseq 13544 fine sand Soil trait 5 0.974 1.745 -0.053 0.002 0.032 ** *
Sal-DArTseq 15197 MIMHQ Climate (ANUCLIM)
5 0.963 1.422 -2.116 0.003 0.045 ** *
Sal-DArTseq 15197 MIMWMQ Climate (ANUCLIM)
5 0.941 -4.023 80.460 0.006 0.037 ** *
Sal-DArTseq 15197 RCLQ Climate (ANUCLIM)
5 0.966 1.574 -0.011 0.003 0.024 ** *
Sal-DArTseq 15197 RWETM Climate (ANUCLIM)
5 0.965 1.708 -0.128 0.003 0.024 ** *
Sal-DArTseq 15197 RWETQ Climate (ANUCLIM)
5 0.979 1.682 -0.011 0.001 0.012 ** *
Sal-DArTseq 15551 Adaptive genetic index (Lin 1 CAP1)
CAP-based trait 5 0.963 0.367 3.572 0.003 0.028 ** *
Sal-DArTseq 15551 Aridity index (Lin 1)
CAP-based trait 5 0.986 0.369 0.093 0.001 0.013 *** *
Sal-DArTseq 15551 RRCVAR Climate (ANUCLIM)
5 0.984 7.645 -0.217 0.001 0.008 *** *

44 Adaptation to climate in widespread eucalypt species
Sal-DArTseq 15551 RRDRYQ Climate (ANUCLIM)
5 0.973 4.841 -0.175 0.002 0.017 ** *
Sal-DArTseq 15551 RRL Climate (ANUCLIM)
5 0.954 -4.379 0.473 0.004 0.036 ** *
Sal-DArTseq 15551 TDRYQ Climate (ANUCLIM)
5 0.963 3.412 -0.152 0.003 0.030 ** *
Sal-DArTseq 15551 fine sand Soil trait 5 0.933 -0.519 0.039 0.008 0.049 ** * Sal-DArTseq 213 RCVAR Climate
(ANUCLIM) 5 0.935 1.530 -0.025 0.007 0.030 ** *
Sal-DArTseq 213 RWETM Climate (ANUCLIM)
5 0.956 1.594 -0.110 0.004 0.024 ** *
Sal-DArTseq 213 RWETQ Climate (ANUCLIM)
5 0.934 1.555 -0.009 0.007 0.035 ** *
Sal-DArTseq 213 Tree height mean
Wild population trait
4 0.996 2.003 -0.149 0.002 0.039 ** *
Sal-DArTseq 2238 MICVAR Climate
(ANUCLIM) 5 0.977 -1.565 0.027 0.002 0.028 ** *
Sal-DArTseq 3638 Leaf area mean Wild population
trait 5 0.966 2.964 -0.418 0.003 0.049 ** *
Sal-DArTseq 3689 Adaptive genetic index (Lin 1 CAP1)
CAP-based trait 5 0.984 0.401 -4.884 0.001 0.016 *** *

Adaptation to climate in widespread eucalypt species 45
Sal-DArTseq 3689 Aridity index (Lin 1)
CAP-based trait 5 0.963 0.399 -0.124 0.003 0.027 ** *
Sal-DArTseq 3689 RRDRYQ Climate (ANUCLIM)
5 0.980 -5.673 0.238 0.001 0.017 ** *
Sal-DArTseq 3689 TDRYQ Climate (ANUCLIM)
5 0.961 -3.713 0.206 0.003 0.030 ** *
Sal-DArTseq 3689 No. stems Wild population trait
4 0.999 1.770 -0.572 0.001 0.011 *** *
Sal-DArTseq 4061 RCVAR Climate
(ANUCLIM) 5 0.940 -0.395 0.025 0.006 0.030 ** *
Sal-DArTseq 437 MIMWMQ Climate
(ANUCLIM) 5 0.995 -3.936 81.673 0.000 0.003 *** *
Sal-DArTseq 437 RCVAR Climate (ANUCLIM)
5 0.971 1.792 -0.029 0.002 0.030 ** *
Sal-DArTseq 437 RWETM Climate (ANUCLIM)
5 0.938 1.837 -0.125 0.007 0.030 ** *
Sal-DArTseq 437 RWETQ Climate (ANUCLIM)
5 0.931 1.801 -0.011 0.008 0.035 ** *
Sal-DArTseq 4430 No. stems Wild population
trait 4 0.993 1.393 -0.332 0.004 0.034 ** *

46 Adaptation to climate in widespread eucalypt species
Sal-DArTseq 5010 Adaptive genetic index (Lin 1 CAP1)
CAP-based trait 5 0.936 0.407 -5.785 0.007 0.043 ** *
Sal-DArTseq 5010 RRANN Climate (ANUCLIM)
5 0.950 18.091 -0.898 0.005 0.044 ** *
Sal-DArTseq 5010 RRCVAR Climate (ANUCLIM)
5 0.946 -11.318 0.349 0.005 0.033 ** *
Sal-DArTseq 5010 RRL Climate (ANUCLIM)
5 0.943 8.157 -0.772 0.006 0.036 ** *
Sal-DArTseq 5010 fine sand Soil trait 5 0.929 1.859 -0.065 0.008 0.049 ** * Sal-DArTseq 5010 pH in CaCl2 Soil trait 5 0.968 3.603 -0.458 0.002 0.043 ** *
Sal-DArTseq 5010 pH in H2O Soil trait 5 0.981 4.063 -0.472 0.001 0.021 ** *

Adaptation to climate in widespread eucalypt species 47
Figure 17: In Eucalyptus salubris ‘Lineage 1’, the CAP-based Aridity Index was one of a few variables that showed a strong, significant correlation with allele frequency of an outlier locus (salDArTseq 3689) for which there was also a reasonably uniform distribution of points across the populations. Most other significant correlations were driven by a cluster of data points at either end of the allele frequency distribution.
-5.0
-4.0
-3.0
-2.0
-1.0
0.0
1.0
2.0
3.0
4.0
0.0 0.2 0.4 0.6 0.8 1.0
Mea
n N
o. S
tem
s/CA
P-ba
sed
Arid
ity
Inde
x
Band frequency
Mean No. stems
CAP-based Aridity Index

48 Adaptation to climate in widespread eucalypt species
4. DISCUSSION
Widespread tree species can be particularly useful for revegetation, as they are appropriate for planting across a wide range of locations. Whether these widespread species show local genetic adaptations, or are able to respond plastically across a range of conditions, has implications for the choice of seed sources for optimal restoration outcomes. The most effective way to assess the relative roles of genetic adaptation and plasticity in response to different environmental conditions is to use provenance trials, where provenances from across a species’ range are planted in multiple common gardens across that species’ range and measurements of morphology, growth, health and survival are taken over many years. However, such trials are expensive and time consuming. It may take 15 or 20 years to determine whether a provenance will reach reproductive maturity and produce viable seed at a particular site. Rarely is there the time, money or resources to undertake such investigations.
This project aimed to evaluate the presence of adaptation to climate across environmental gradients to determine whether this is an important component to be considered in broadscale revegetation. We also aimed to determine whether there was a detectable association between genetic signatures of adaptive variation and variation in functional traits, such that genomic tools could be used as an alternative to provenance trials to provide information about whether populations are genetically adapted to particular environmental conditions. In order to investigate this approach, we sought to answer the following questions:
1. Is there evidence of functional response to climate across the climate gradients in widespread tree species?
2. Is there genetic variation among populations across the gradients?
3. Is there evidence that the genetic variation may be adaptive (or merely attributable to isolation and drift)? If so, can we relate the genetic variation to the environmental conditions and/or to functional traits?
4. Is there an environmental variable that is highly correlated with genetic adaptation to aridity? If so, could it be used as an indicator of genetic adaptation to aridity?
These questions were examined in two Eucalyptus species, across two climatic gradients.
4.1 Functional responses to climate across the gradients
The two climate gradients studied here were of quite different types, and different responses to climate were observed in each of the study species. Eucalyptus tricarpa displayed numerous clear responses in functional traits across a gradient of relatively high rainfall variation among sites, from 460 to 1000 mm MAP. In addition, all examined provenances of E. tricarpa were highly plastic for most of the measured traits, as determined from the common garden plantings. In contrast, E. salubris displayed few adaptive responses across a narrower range of much more arid sites, from 200 mm MAP and 19°C MAT, to 400 mm MAP and 16°C MAT. Nonetheless, the high plasticity of E. tricarpa and the minimal variation in adaptive traits with climate in E. salubris, suggest that trees of both species may be adaptable to a range of climates, and seed source selection for revegetation programs may not be critical. However,

Adaptation to climate in widespread eucalypt species 49
there might still be some advantage in matching the seed source to the target climate where possible. Eucalyptus tricarpa appeared to grow more quickly during the first 12 years when planted in an environment more similar to that of the seed source. The response of E. tricarpa trees to the prevailing climate was highly- but not perfectly- plastic, and even a small degree of genetic specialisation for climate may be enough to confer an advantage to certain genotypes.
Our results from E. tricarpa highlight complex patterns of phenotypic plasticity in this species. Some functional traits were uniformly plastic among populations, while other traits showed contrasting patterns of plasticity among populations across the rainfall gradient. Much of the potentially adaptive genetic variation detected among the E. tricarpa populations may therefore relate to variation in trait plasticity, rather than variation in genes directly determining trait values. Variation in plasticity can occur through mechanisms such as genetic variation in environmental sensing and signaling proteins, and in regulatory genes that in turn influence expression of other genes, or modify proteins involved directly in functional traits (Des Marais & Juenger, 2010). Phenotypes observed in the common gardens could also have been influenced by carryover effects from the maternal environments, such as epigenetic imprinting, and seed size effects. The high plasticity seen in all provenances points away from a strong influence of the maternal environment, since seeds from the same mother tree produced divergent phenotypes in each common garden. In addition, maternal effects typically diminish as the progeny age, and since the trees in the common gardens were reproductively mature, any maternal influence upon leaf traits is likely to be minor (Lopez et al., 2003; O'Brien et al., 2007). However, it is possible that the extent of plasticity in E. tricarpa is even greater than that observed in this study, if maternal effects are constraining the trait phenotypes to some extent. Understanding plasticity in response to climate may be a crucial factor in understanding the likely impacts of climate change on natural and restored ecosystems (Nicotra et al., 2010; Benito Garzón et al., 2011).
Measurements had been conducted previously in the low rainfall common garden at Huntly, by Warren et al. (2005), when the trees were 3 years old. Our findings at the Huntly site, when the trees were 12 years of age, were similar to the patterns observed in the trees at 3 years post planting. In both studies, leaf density and 13C did not vary with MAP of origin, while leaf thickness, SLA, and Narea all showed significant correlations with MAP of origin. However, while the trait relationships with MAP were weak at 3 years (Warren et al., 2005), these same relationships appeared to have strengthened considerably by 12 years post planting. Developmental shifts and mortality selection can alter morphology and physiology as trees mature (e.g. Donovan & Ehleringer, 1991) and the selective thinning of trees from the plots might also have affected the functional traits in the case of the common gardens. However, in the case of E. tricarpa these effects appear to have been minor, with the patterns in functional traits so far remaining relatively consistent over time. The strengthening of the relationships with MAP of origin with age is the opposite of what would be expected if factors such as maternal effects or plot thinning had had a substantial effect; hence, the functional traits that displayed variation between provenances are very likely reflecting genetic differences.
The present study, along with others, show that data from provenance trials under multiple climatic conditions are important in assessing climate response. The patterns of traits across the natural forest sites in E. tricarpa did not always give a clear picture of trait response to climate. The high rainfall forest sites, in particular, yielded some unexpected results, given the apparent plasticity of these provenances when examined in the common garden plantings. Leaf thickness and 13C content were higher than expected at these high rainfall sites, possibly due to other aspects of the environment
50 Adaptation to climate in widespread eucalypt species
which can also induce leaf thickening, such as colder minimum temperatures or differences in soil type (Schulze et al., 2006a; Mediavilla et al., 2012). Leaf thickening may be a mechanism to increase the leaf Narea at sites which experience the coldest minimum temperatures, which include the highest rainfall sites, since leaf Narea was correlated with minimum temperatures across the wild E. tricarpa sites. Higher leaf N per area is commonly associated with chilling, since higher photosynthetic capacity can compensate for the inhibitory effects of cold (e.g. Weih & Karlsson, 2001). Thicker and higher N content leaves can in turn lead to higher 13C levels, via effects on the rates of CO2 diffusion and depletion within the leaf (Anderson et al., 1996). The complex environmental variation along natural gradients, and the interactions of environmental parameters with genetic differences among populations, can make interpretation more difficult. The study of E. tricarpa confirms the value of well designed provenance trials in understanding adaptation to climate, and developing genomic tools, particularly when variation among provenances may include complex variation in plasticity itself.
It was not possible to determine directly the plasticity of functional traits in E. salubris, due to the lack of common garden information. However, the fact that foliage 13C content correlated well with recent climate, but not with long term climate, strongly suggests high plasticity in water use efficiency in E. salubris. The variation in 13C among sites and its correlation with recent climate also indicate a detectable and physiologically relevant environmental difference among the study sites, at least over the previous 12 months. That other leaf traits did not correlate with recent climate or 13C content, or with long term climate, suggests that E. salubris possesses both limited plasticity and limited genetic differentiation in leaf morphology among provenances. However, trunk branching did show a relationship with climate (and was correlated with several DArT markers, see below), and other traits not measured here may differ among the populations. Allele frequencies of several outlying DArTseq markers showed correlations with climate, indicating that some degree of genetic specialisation for climate is likely in populations of this species. Provenance trials – and a better understanding of the two morphologically cryptic lineages detected in this study – would be required to determine the extent of functional plasticity and specialisation among populations of E. salubris.
Relatively few studies have addressed plasticity and local adaptation in tree species across conditions of moderate to high aridity. The study of plasticity in trees has largely focused on responses to shading and irradiance (e.g. Rozendaal et al., 2006; Portsmuth & Niinemets, 2007; Goulart et al., 2011), and studies of climate response have mostly considered temperate and boreal conditions (e.g. Aitken et al., 2008; Vitasse et al., 2010; Alberto et al., 2013). Moderate to high plasticity is typically reported across relatively cold, wet ranges of climatic conditions, such as in plantation forestry trials of northern hemisphere conifer species, including Pinus sylvestris, P. pinaster, P. contorta, Larix sukaczewii and L. sibirica, in the sense that most provenances perform well across a range of planting sites (Savolainen et al., 2007; Benito Garzón et al., 2011). However, these types of environmental variation are quite different from the more arid gradients examined in the present study, and different types of plasticity and adaptation might be expected. Nonetheless, a number of relevant studies have been conducted in tree species under more arid conditions, particularly in species from the Mediterranean and northern Australia.
Leaf physiological traits tend to be more plastic than morphological traits in studies testing response to low water availability and high temperatures in common gardens and potted seedling experiments. For example, in six populations of Quercus ilex
Adaptation to climate in widespread eucalypt species 51
originating from sites of 475-970mm MAP on the Iberian peninsula, gas exchange was highly plastic in response to drought stress in a seedling experiment, with no apparent ecotypic specialisation (Gimeno et al., 2009). Quercus ilex physiological traits were also highly plastic in response to air temperatures, while plasticity of leaf morphological traits were more variable among provenances, in a study of populations from sites in Italy of 640-880 MAP and 13.6-16.5°C MAT(Gratani et al., 2003). Similarly, Pinus pinaster populations from 350-1200 mm MAP sites in France, Spain and Morocco all displayed high plasticity in 13C content in response to rainfall and drought stress (Aranda et al., 2010; Corcuera et al., 2010). On the other hand, 13 Quercus suber populations from 430-1000 mm MAP, displayed clear local adaptation in 13C content when grown in a common garden in Spain (Ramírez-Valiente et al., 2010). Nonetheless, gas exchange physiology and WUE tend to be plastic in most species, in response to water availability and temperature.
In Eucalyptus species the findings for plasticity of WUE are more mixed. Common garden experiments comparing multiple species show that different eucalypts differ inherently in WUE, indicating a strong component of genetic specialisation (Anderson et al., 1996; Schulze et al., 2006b). Carbon isotope ratios of eucalypts are not always clearly related to climate across rainfall gradients in Australia, in contrast with the majority of studies of other species across climate gradients throughout the world (Miller et al., 2001; Schulze et al., 2006a; Turner et al., 2008; Diefendorf et al., 2010). The carbon isotope ratio captures only the intrinsic leaf WUE during periods of photosynthetic activity, and many eucalypts may respond to water stress via other mechanisms not measured in the present study, such as reducing the total leaf area. However, studies within single eucalypt species reveal greater plasticity, E. globulus appears plastic in WUE; the 13C of trees in plantations correlated strongly with water availability across a rainfall gradient in SW Australia (Macfarlane et al., 2004). In seedlings of E. camaldulensis, from sites of 340-860 mm MAP across northern Australia, the WUE of some provenances showed a strong response to water availability while others did not (Gibson et al., 1991; Gibson et al., 1995). In 12 provenances of E. microtheca originating from 200-520 mm MAP, stomatal conductance and transpiration rate showed high plasticity in all provenances, while WUE was more plastic in provenances originating from drier sites, than those from wetter sites (Li et al., 2000). WUE is clearly an important adaptive trait across aridity gradients, and frequently responds plastically to climate. However E. tricarpa may be especially plastic in this trait, with uniform plasticity across all examined provenances.
The plasticity of morphological traits in response to aridity, compared to more mesic conditions, appear to be more variable among species, and among provenances. In Quercus suber, leaf size and SLA were partly locally adapted, and partly plastic in response to rainfall (Ramírez-Valiente et al., 2010). In three Quercus ilex provenances from Italy, morphological traits were partly specialised and partly plastic in response to air temperature, with two provenances showing moderate plasticity for leaf size, while the third showed greater plasticity in SLA and leaf density (Gratani et al., 2003). Four provenances of Pinus canariensis from 330-940 mm MAP in the Canary Islands, planted in five common gardens, revealed high plasticity in needle morphology and anatomy, with little provenance differentiation (López et al., 2010). In E. camaldulensis from northern Australia, seedlings of populations from drier sites of origin tended to have higher plasticity for SLA, and leaf N content in response to water stress (Gibson et al., 1991; Gibson et al., 1995). Similarly, E. microtheca seedlings from drier sites of origin tended to have higher plasticity in SLA and root:leaf biomass ratio, while wetter

52 Adaptation to climate in widespread eucalypt species
provenances showed little response in these traits in response to water stress (Tuomela, 1997; Li, 1999; Li, 2000). The variation observed in E. tricarpa is consistent with variable plasticity observed in these other eucalypts.
Trunk branching was the only measured trait that appeared to be strongly related to climate in both study species. Trunk branching also appeared to be plastic in response to the prevailing climate in E. tricarpa. A high degree of branching is associated with hydraulic redundancy, a characteristic which may improve tree survival and functioning in dry conditions, but which can reduce water transport efficiency in high rainfall environments (Schenk et al., 2008). Variation in hydraulic traits is commonly correlated with climate and water availability, and strongly linked with tree performance and survival (e.g. Barnard et al., 2011; Poorter et al., 2012; von Arx et al., 2012). Individual trees have limited capacity to adjust stem branching in response to ongoing climatic change, although other hydraulic traits such as wood anatomy and leaf vein architecture do have the capacity for change over the lifespan of an individual. The findings of the present study suggest that hydraulic architecture could be an important aspect of climate adaptation in a variety of eucalypts, across both relatively high rainfall and more arid climatic ranges.
The variation in leaf thickness and SLA among E. salubris populations appears to be due to a fixed genetic difference between the two putative genetic lineages identified in this study. SLA is a composite of leaf thickness and density, but leaf density showed minimal variation among the E. salubris study populations, and thus the variation in SLA is due to differences in leaf thickness. This lineage difference in leaf thickness may have led to populations at some of the most arid sites having thinner leaves than populations at the least arid sites, a situation which may be mal-adaptive, since thicker leaves are often more drought resistant. The difference in leaf thickness and SLA between the lineages is fairly substantial, and similar to differences in SLA observed between different eucalypt species across a 100-400 mm rainfall gradient in SW Australia (Schulze et al., 2006a). However, leaf thickness is not necessarily of high functional importance in adaptation to water availability, rather the leaf density component of SLA may be the important factor (Niinemets, 1999; Wilson et al., 1999; Niinemets, 2001). Leaf nitrogen content per mass was also higher in the thinner leaved lineage, leading to very similar leaf Narea in both lineages. Leaf Narea can be functionally important in dry conditions, through its influence on WUE (Anderson et al., 1996; Wright et al., 2001; Weih et al., 2011). Thus, the differing leaf thickness between the lineages may be due to genetic variation arising by chance. Adjustments in leaf nitrogen content, by either physiological or genetic mechanisms, may partially offset any functional disadvantage.
The leaf morphology of E. salubris did not appear to vary in response to climate along the aridity gradient. Changes in functional traits across aridity gradients can differ considerably among species, and little or no change has been observed in other species. For example, across a gradient of 370-1500 mm MAP in NE Spain, Quercus ilex, an evergreen tree, displayed increases in leaf size, SLA, phosphorus and lignin content, and a decrease in leaf thickness with rainfall, while Q. faginea, a deciduous tree, did not show any significant correlations with rainfall in these traits (Castro-Diez 1997). Photosynthesis and growth in arid and semi-arid conditions tends to occur following rainfall events, with little activity during unfavourable periods (Huxman et al., 2004). Therefore, functional response across the range of fairly arid sites examined here might not require shifts in leaf morphology in E. salubris. However, other classes of functional traits did appear to respond to climate. The correlation of water use

Adaptation to climate in widespread eucalypt species 53
efficiency with recent rainfall indicates a physiological response to water availability, and hydraulic traits may also respond to climate in E. salubris, including stem branching.
4.2 Genomic variation across the gradients
Both E. salubris and E. tricarpa grow across aridity gradients and both species showed marked spatial partitioning of genetic variation across the range of the species, with strong suggestions of ‘isolation by distance’ – indicating that isolation and drift among provenances are significant factors contributing to the observed variation among populations. Eucalyptus salubris was especially interesting in this context because we discovered two genetically distinct lineages within an apparently morphologically uniform species. On close inspection, the morphological data were congruent with the genomic data (Figure 9c) in terms of there being a dichotomy between the two lineages in measurements of specific leaf area and leaf lamina thickness. Further genomic and morphometric analysis would be required to determine whether the two genetic lineages have diverged as a result of inter-specific hybridisation (e.g., co-occurring species could hybridise and introgress with E. salubris) or whether they are separate ‘cryptic’ species that have evolved a convergent response to selective environmental pressures.
4.2.1 Evidence of adaptive genetic variation
Demonstrating that there is adaptive variation (in addition to drift) across gradients added an extra layer of complexity to the analyses. Our approach was to accumulate several lines of evidence that, together, would build a convincing case for - or against - the presence of adaptive variation in the genomes of different provenances. The elements of this evidence were:
i. The presence of ‘outlier’ loci where allele frequency differences across provenances were more divergent than would be expected through drift (chance) alone. This is suggestive that selection may be acting on genomic regions (e.g., particular genes) in the vicinity of the outlying marker (not necessarily the marker itself). The number of outlier loci identified in E. tricarpa was much higher than that in E. salubris ‘Lineage 1’. This may relate to the stronger environmental gradient across which E. tricarpa grows; or it may relate to the limited sampling across the environmental gradient in ‘Lineage 1’ of E. salubris (i.e., three of the five populations came from the Eremaean zone) or to the lower genetic diversity within the lineage per se.
ii. A strong correlation between the genetic data and climate. The correlation of the genetic-marker-derived CAP1 to overall climate for E. salubris ‘Lineage 1’ was very strong and highly significant (δ2 = 0.91, P = 0.001), much more so than for E. tricarpa, (δ2 = 0.72, P = 0.001), where the relationship was moderate, but still highly significant. There were numerous strong, significant correlations between the adaptive genetic index (CAP1) of E. tricarpa and individual climatic variables, although there were no such significant correlations for E. salubris Lineage 1, possibly because of the low statistical power of the Lineage 1 data set.
iii. A strong correlation between allele frequencies of outlier markers at each site with relevant environmental variables. There were some very strong correlations between allele frequencies of outlier loci, climatic variables and climatic indices (e.g., CAP-based AI, moisture indices) and the CAP-derived

54 Adaptation to climate in widespread eucalypt species
Aridity Index in E. tricarpa, suggesting that climate may be acting as an adaptive driver in this species. In E. salubris ‘Lineage 1’ strong correlations were found between outlier loci and several individual climatic variables.
iv. A strong correlation between allele frequencies of outlier markers to morphometric/physiological traits that are considered to be associated with adaptation to aridity. Such associations were observed in both E. salubris and E. tricarpa, though the evidence in E. tricarpa was stronger because of the valuable data obtained from the field trials. Nevertheless, in E. salubris, the one adaptive trait (i.e., trunk branching) that, on the basis of data from wild populations, was hypothesised to be under genetic control, was also one of the few physiological/morphometric traits that were correlated with outlier allele frequencies in this species. In E. tricarpa there were strong, significant associations between several DArTseq markers and plasticity indices. For example, two markers, TriDArTseq 1779 and 5899, were correlated with leaf area plasticity and the leaf area mean in the wet Lake Tyers trial, while TriDArTseq 1567 was correlated with SLA plasticity and leaf thickness at the dry Huntly trial.
The combined data presented here support the hypothesis that different provenances of eucalypt species that grow across climatic gradients are genetically adapted to particular conditions (or range of conditions). A component of this adaptation may be genetic variation in plasticity; i.e., genetics appears to affect the ability of a provenance to modify its phenotype in response to the prevailing climate. Further research is required to establish whether this ability is adaptive. In particular, fitness measures at various life stages, and under a range of conditions, would be needed to comprehensively assess the extent of adaptation, and the adaptive value of plasticity.
4.2.2 Environmental indicators of genetic adaptation
The fourth question that we sought to answer was whether we could devise a method by which environmental managers could predict the potential outcomes of germplasm transfers between sites. Our CAP-based Aridity Index has the potential to assist with site matching for germplasm transfers. While this metric could be a little complicated for the uninitiated, there are many environmental variables that are highly correlated with the adaptive genetic index (CAP1) that could be used instead of the CAP-based aridity index (e.g., for E. tricarpa, TMXWM, RDRYM, RRH or MIMLQ; see Appendix 5). While we did not find any significant correlations between CAP1 of E. salubris and climatic variables, our CAP-based aridity index did appear to be strongly correlated with the relative aridity at each of the sampling sites (see Table 6).
To further assist with site matching we envisage the production of contour maps of a species’ adaptive variation (based on CAP1 or a surrogate environmental variable) in the landscape. Furthermore, the Aridity Index could be adjusted for future climate predictions, allowing us to predict the likely change in the adaptive surface of the target species. The climate-adjusted adaptive surface could be cross-referenced to the current adaptive surface to predict the source material that would be best adapted to future climates.
4.3 Implications for revegetation seed sourcing The aims of this project were to (1) assess the extent of plasticity and local adaptation to climate in two widespread eucalypts native to southern Australia, and (2) to test whether genomic screening may be useful in detecting the extent of local adaptation in these species, and whether it might therefore be extended as a tool for use with other

Adaptation to climate in widespread eucalypt species 55
species. Species and populations that are more plastic are more likely to be able to adjust to climatic changes in situ, while in those showing strong local adaptations, translocation is more likely to be beneficial. Knowledge of the patterns of local adaptation and plasticity in a species is therefore valuable in making seed sourcing decisions for revegetation and restoration.
The results of this study show that E. tricarpa and E. salubris both contain a mixture of local adaptation and capacity for plastic response. Populations appear likely to adjust to a range of conditions, but there is evidence in E. tricarpa that local populations may still perform better under local conditions. There is a need for further assessment of how the detected local adaptation or plasticity might translate into performance under various conditions. Nonetheless, the findings of this project are consistent with recent arguments for a move away from a strict focus on local seed sourcing, and toward the use of multiple provenance strategies (Broadhurst et al., 2008; Crowe & Parker, 2008; Breed et al., 2013; Wang et al., 2013). One recently proposed method is ‘composite provenancing’, which aims to mimic natural patterns of gene flow by mixing seed from multiple provenances, but with a larger proportion of local seed, and progressively smaller amounts of seed as the distance of the collection site from the planting site increases (Broadhurst et al., 2008). ‘Admixture provenancing’ similarly mixes provenances, but aims simply to sample a wide variety of genotypes, without regard to the location of the source population relative to the planting site (Breed et al., 2013). These existing provenancing strategies are illustrated in Figure 18a-c. However, given a changing climate, we propose a strategy of ‘climate-adjusted provenancing’, where seed sources are biased toward the direction of predicted climatic change (Figure 18d). We hypothesise that such a strategy may provide the best compromise of allowing plastic response and in situ adaptation in the local population, while also including genetic material that is likely to contribute to future climate resilience. Although future climate cannot be predicted with high certainty in all locations, the general trend of the change is often robustly projected. Since climates are becoming drier in southern Australia (Murphy & Timbal, 2008; Kirono et al., 2011), climate-adjusted provenancing would involve combining seeds sourced from across a gradient of increasingly drier sites with local germplasm (Figure 18d). This strategy should be implemented within a genetic risk framework incorporating the relative risks and benefits for each revegetation site (Byrne et al., 2011; Weeks et al., 2011). Our proposed climate-adjusted strategy requires testing, for example by setting up experimental plots within areas to be revegetated, as suggested by Breed et al. (2013).
A decision support framework for the choice of provenancing strategy is provided in Figure 19. If adaptive variation is present in a species, or in the absence of information on adaptive variation, ‘climate-adjusted provenancing’ may be the greatest-benefit/lowest-risk strategy for improving long term revegetation outcomes.
The genomic techniques used in this study appear to have the potential to form the foundation of a tool for detecting adaptive genetic variation. The methods require further testing and development, and further study of the genetic basis of plastic response to climate is particularly recommended. Provenance trials of additional species will be necessary in order to further test the applicability of genomic screening across species. Suitable provenance trials will need to contain populations from a wide climatic range, planted in multiple locations, with planting sites also spanning the climatic range of interest. Many other researchers have advocated use of provenance trial data to better inform revegetation and management under climate change (e.g. Crowe & Parker, 2008; Wang et al., 2010; Benito Garzón et al., 2011). Investment in well-designed provenance trials and controlled environment experiments will therefore facilitate multiple congruent approaches.

56 Adaptation to climate in widespread eucalypt species
Once robust genomic methods are developed and tested, our approach will reduce reliance on provenance trials and expedite the accumulation of knowledge on adaptive capacity in plant species. Ultimately, a broader predictive framework of adaptive capacity within plant species of differing taxonomic groups, distributional patterns and functional types could be developed (Figure 19). This framework could then directly inform provenancing strategies, with less need for species level screening or trials.
Figure 18: Illustrations of various provenancing strategies for revegetation. The star indicates the site to be revegetated, and the green circles represent native populations used as germplasm sources. The size of the circles indicates the relative quantities of germplasm included from each population for use at the revegetation site.
Climate gradient e.g. Increasing aridity
Direction of expected climate change at sitee.g. site likely to increase in aridity
b) Composite provenancing
c) Admixture provenancing
d) Climate-adjusted provenancing
a) Local provenancing

Adaptation to climate in widespread eucalypt species 57
Figure 19: Flow diagram illustrating the decision making framework for choice of germplasm for environmental plantings.

58 Adaptation to climate in widespread eucalypt species
5. GAPS AND FUTURE RESEARCH DIRECTIONS
Further provenance trials of key widespread species would be valuable, to verify the extent of functional plasticity and specialisation. Our research has indicated that different widespread species may respond in a different ways to climate, although species occurring across similar ranges might show more similarities. In addition, further work with provenance trials may enable better connection of the patterns of trait responses with actual performance (e.g. survival and growth rates) of provenances following planting. Seeds from the E. salubris provenances were collected while undertaking the work presented here, which could form the basis of provenance trials for this species. Provenance trials are also planned for other species, such as Corymbia variegata in Queensland. Greening Australia, in collaboration with the University of Tasmania, has established provenance trials of E. pauciflora in Tasmania, which will soon be screened for signals of genomic adaptation.
Traits involved in tree hydraulic functioning are likely to be important in climate adaptation. Relatively little is known about the plasticity of hydraulic traits, particularly the ability of individuals to respond to climatic changes over their lifespan (Fonti et al., 2010). Analysis of hydraulic traits was beyond the scope of the current one-year project, but samples of leaves and wood were collected from the E. tricarpa provenances for possible future work.
The extent to which species are plastic in response to climate is likely to dramatically influence the ecological impacts of climate change (Nicotra et al., 2010; Benito Garzón et al., 2011). Since widespread species occur across a variety of climatic environments, high adaptive plasticity might be expected in these species from a theoretical basis. However, empirical studies demonstrate that the nature of plasticity can be complex, with a number of possible costs and limitations of high plasticity which remain poorly understood (Auld et al., 2010). As a result, our ability to predict the species and functional traits that are likely to show high plasticity, and what this will mean for ecological functioning, is at present very limited (Nicotra et al., 2010). Genomic techniques, such as the DArTseq technology used in this study, have great potential for evaluating genetic mechanisms of climate adaptation (Franks & Hoffmann, 2012). Combining genomic data with physiological and morphometric data from provenance trials will facilitate the identification of genetic mechanisms underlying plasticity.
The CAP analyses showed that there is a considerable degree of overlap of the potentially adaptive genetic variation (ie., outlier loci) among provenances of E. salubris and E. tricarpa. It may be possible to use our data to model the adaptive potential of a species in the face of climate change by estimating the number of generations required under different scenarios of selective pressure (e.g., via climate change) for adaptive profiles to change from, for example, wet-adapted to interzone-adapted, or from interzone-adapted to arid-adapted. These models are complicated and are outside the time-frame of the current project, but are planned for future studies.
The genetic data that we have accumulated in this study will be used to further explore the genetic basis of adaptation. For each DArTseq marker (300-1000 basepairs (bp) long) we have 60 bp of known DNA sequence data that can be used to link the marker with the publicly available Eucalyptus grandis genome sequence. Hence, we can find the location of many of our outlier markers in the genome (e.g., which part of which chromosomes) and identify associated genes that may be candidates for selection. Thus, we may be able to identify candidate genes that are associated with, for example, the Aridity Index (or surrogate, e.g., RRDRYQ) or with a particular phenotypic

Adaptation to climate in widespread eucalypt species 59
trait (e.g., leaf thickness). We can also use these data to develop rapid screening techniques that will allow us to trace the changing allele frequencies of particular genes through a population, across an environmental gradient and/or through time. Furthermore, we can examine the distribution of markers across the genomes of different species to determine whether there are particular regions of the eucalypt genome that are ‘hotspots’ for environmental adaptation.
This study has demonstrated the potential of genomic screening to provide information about the genetic adaptation of widespread eucalypt species across environmental gradients. Combined with physiological and morphometric data we have shown that the potential for a plastic response is under genetic control, and the genetic mechanisms may vary among traits. Hence, while the research has answered some questions, it has raised even more, opening the way for many further exciting multi-disciplinary projects on adaptation.

60 Adaptation to climate in widespread eucalypt species
6. REFERENCES
Aitken SN, Yeaman S, Holliday JA, Wang T, Curtis-McLane S. 2008. Adaptation, migration or extirpation: climate change outcomes for tree populations. Evolutionary Applications 1: 95-111.
Alberto FJ, Aitken SN, Alía R, González-Martínez SC, Hänninen H, Kremer A, Lefèvre F, Lenormand T, Yeaman S, Whetten R, Savolainen O. 2013. Potential for evolutionary responses to climate change - evidence from tree populations. Global Change Biology: n/a-n/a.
Allen CD, Macalady AK, Chenchouni H, Bachelet D, McDowell N, Vennetier M, Kitzberger T, Rigling A, Breshears DD, Hogg EH, Gonzalez P, Fensham R, Zhang Z, Castro J, Demidova N, Lim J-H, Allard G, Running SW, Semerci A, Cobb N. 2010. A global overview of drought and heat-induced tree mortality reveals emerging climate change risks for forests. Forest Ecology and Management 259: 660-684.
Anderson JE, Williams J, Kriedemann PE, Austin MP, Farquhar GD. 1996. Correlations between carbon isotope discrimination and climate of native habitats for diverse eucalypt taxa growing in a common garden. Functional Plant Biology 23: 311-320.
Anderson MJ, Gorley RN, Clarke KR. 2008. Permanova+ for Primer: guide to software and statistical methods.: PRIMER-E, Plymouth.
Anderson MJ, Robinson J. 2003. Generalized discriminant analysis based on distances. Australian and New Zealand Journal of Statistics 45: 301-318.
Anderson MJ, Willis TJ. 2003. Canonical analysis of prinicipal coordinates: a useful method of constrained ordination for ecology. Ecology 84: 511-525.
Aranda I, Alía R, Ortega U, Dantas Â, Majada J. 2010. Intra-specific variability in biomass partitioning and carbon isotopic discrimination under moderate drought stress in seedlings from four Pinus pinaster populations. Tree Genetics & Genomes 6: 169-178.
Aubin-Horth N, Renn SCP. 2009. Genomic reaction norms: using integrative biology to understand molecular mechanisms of phenotypic plasticity. Molecular Ecology 18: 3763-3780.
Auld JR, Agrawal AA, Relyea RA. 2010. Re-evaluating the costs and limits of adaptive phenotypic plasticity. Proceedings of the Royal Society B: Biological Sciences 277: 503-511.
Barnard DM, Meinzer FC, Lachenbruch B, McCulloh KA, Johnson DM, Woodruff DR. 2011. Climate-related trends in sapwood biophysical properties in two conifers: avoidance of hydraulic dysfunction through coordinated adjustments in xylem efficiency, safety and capacitance. Plant, Cell & Environment 34: 643-654.
Benito Garzón M, Alía R, Robson TM, Zavala MA. 2011. Intra-specific variability and plasticity influence potential tree species distributions under climate change. Global Ecology and Biogeography 20: 766-778.

Adaptation to climate in widespread eucalypt species 61
Benjamini Y, Hochbert Y. 1995. Controlling the false discovery rate: a practical and powerful approach to multiple testing. J. Royal Stat. Soc. B (Meth.) 57: 289-300.
Benjamini Y, Yekateuli D. 2001. The control of the false discovery rate in multiple testing under dependency. Annals of Statistics 29: 1165–1188.
Breed M, Stead M, Ottewell K, Gardner M, Lowe A. 2013. Which provenance and where? Seed sourcing strategies for revegetation in a changing environment. Conservation Genetics 14: 1-10.
Broadhurst LM, Lowe A, Coates DJ, Cunningham SA, McDonald M, Vesk PA, Yates C. 2008. Seed supply for broadscale restoration: maximizing evolutionary potential. Evolutionary Applications 1: 587-597.
Byrne M 2008. Phylogeny, diversity and evolution of eucalypts. In: Sharma A, Sharma A eds. Plant Genome Biodiversity and Evolution. Part E. Phanerogams - Angiosperms: Science Publishers, Berlin, pp. 303-346.
Byrne M, Parrish T, Moran G. 1998. Nuclear RFLP diversity in Eucalyptus nitens. Heredity 81: 225-232.
Byrne M, Stone L, Millar MA. 2011. Assessing genetic risk in revegetation. Journal of Applied Ecology 48: 1365-1373.
Castro-Díez P, Villar-Salvador P, Pérez-Rontomé C, Maestro-Martínez M, Montserrat-Martí G. 1997. Leaf morphology and leaf chemical composition in three Quercus (Fagaceae) species along a rainfall gradient in NE Spain. Trees - Structure and Function 11: 127-134.
Cernusak LA, Hutley LB, Beringer J, Holtum JAM, Turner BL. 2011. Photosynthetic physiology of eucalypts along a sub-continental rainfall gradient in northern Australia. Agricultural and Forest Meteorology 151: 1462-1470.
Clarke KR, Gorley RN. 2006. Primer v6: User Manual/Tutorial: PRIMER-E, Plymouth.
Clavel J, Julliard R, Devictor V. 2010. Worldwide decline of specialist species: toward a global functional homogenization? Frontiers in Ecology and the Environment 9: 222-228.
Corcuera L, Gil-Pelegrin E, Notivol E. 2010. Phenotypic plasticity in Pinus pinaster δ13C: environment modulates genetic variation. Annals of Forest Science 67: 812.
Cordell S, Goldstein G, Mueller-Dombois D, Webb D, Vitousek PM. 1998. Physiological and morphological variation in Metrosideros polymorpha, a dominant Hawaiian tree species, along an altitudinal gradient: the role of phenotypic plasticity. Oecologia 113: 188-196.
Cornwell WK, Bhaskar R, Sack L, Cordell S, Lunch CK. 2007. Adjustment of structure and function of Hawaiian Metrosideros polymorpha at high vs. low precipitation. Functional Ecology 21: 1063-1071.
Crowe KA, Parker WH. 2008. Using portfolio theory to guide reforestation and restoration under climate change scenarios. Climatic Change 89: 355-370.

62 Adaptation to climate in widespread eucalypt species
Davey JW, Blaxter ML. 2010. RADSeq: next generation population genetics. Brief. Funct. Genomics 9: 416-423.
Dawson TE, Mambelli S, Plamboeck AH, Templer PH, Tu KP. 2002. Stable isotopes in plant ecology. Annual Review of Ecology and Systematics 33: 507-559.
Des Marais DL, Juenger TE. 2010. Pleiotropy, plasticity, and the evolution of plant abiotic stress tolerance. Annals of the New York Academy of Sciences 1206: 56-79.
Diefendorf AF, Mueller KE, Wing SL, Koch PL, Freeman KH. 2010. Global patterns in leaf 13C discrimination and implications for studies of past and future climate. Proceedings of the National Academy of Sciences 107: 5738-5743.
Donovan LA, Ehleringer JR. 1991. Ecophysiological differences among juvenile and reproductive plants of several woody species. Oecologia 86: 594-597.
Eckert AJ, Bower AD, Gonzalez-Martinez SC, Wegrzyn JL, Coop G, Beale DB. 2010. Back to nature: ecological genomics of loblolly pine (Pinus taeda, Pinaceae). Molecular Ecology 19: 3789-3805.
Edelist C, Lexer C, Dillmann C, Sicard D, Rieseberg LH. 2006. Microsatellite signature of ecological selection for salt tolerance in a wild sunflower hybrid species, Helianthus paradoxus. Molecular Ecology 15: 4623-4634.
Edmands S. 2007. Between a rock and a hard place: evaluating the relative risks of inbreeding and outbreeding for conservation and management. Molecular Ecology 16: 463-475.
Evans JR. 1989. Photosynthesis and nitrogen relationships in leaves of C3 plants. Oecologia 78: 9-19.
Foll M, Gaggiotti O. 2008. A genome scan method to identify selected loci appropriate for both dominant and codominant markers: a Bayesian perspective. Genetics 180: 977-993.
Fonti P, von Arx G, García-González I, Eilmann B, Sass-Klaassen U, Gärtner H, Eckstein D. 2010. Studying global change through investigation of the plastic responses of xylem anatomy in tree rings. New Phytologist 185: 42-53.
Franks SJ, Hoffmann AA. 2012. Genetics of climate change adaptation. Annual Review of Genetics 46: 185-208.
Ghalambor CK, McKay JK, Carroll SP, Reznick DN. 2007. Adaptive versus non-adaptive phenotypic plasticity and the potential for contemporary adaptation in new environments. Functional Ecology 21: 394-407.
Gibson A, Bachelard E, Hubick K. 1995. Relationship between climate and provenance variation in Eucalyptus Camaldulensis Dehnh. Functional Plant Biology 22: 453-460.
Gibson A, Hubick K, Bachelard E. 1991. Effects of abscisic acid on morphological and physiological responses to water stress in Eucalyptus camaldulensis seedlings. Australian Journal of Plant Physiology 18: 153-163.

Adaptation to climate in widespread eucalypt species 63
Gimeno TE, Pías B, Lemos-Filho JP, Valladares F. 2009. Plasticity and stress tolerance override local adaptation in the responses of Mediterranean holm oak seedlings to drought and cold. Tree Physiology 29: 87-98.
Goulart MF, Lovato MB, de Vasconcellos Barros F, Valladares F, Lemos-Filho JP. 2011. Which extent is plasticity to light involved in the ecotypic differentiation of a tree species from savanna and forest? Biotropica 43: 695-703.
Gouveia AC, Freitas H. 2009. Modulation of leaf attributes and water use efficiency in Quercus suber along a rainfall gradient. Trees 23: 267-275.
Gratani L, Meneghini M, Pesoli P, Crescente MF. 2003. Structural and functional plasticity of Quercus ilex seedlings of different provenances in Italy. Trees 17: 515-521.
Hereford J. 2009. A quantitative survey of local adaptation and fitness trade-offs. The American Naturalist 173: 579-588.
Hoegh-Guldberg O, Hughes L, McIntyre S, Lindenmayer DB, Parmesan C, Possingham HP, Thomas CD. 2008. Assisted colonization and rapid climate change. Science 321: 345-346.
Hof C, Levinsky I, Araújo MB, Rahbek C. 2011. Rethinking species' ability to cope with rapid climate change. Global Change Biology 17: 2987-2990.
Hoffmann AA, Sgrò CM. 2011. Climate change and evolutionary adaptation. Nature 470: 479-485.
Holderegger R, Herrmann D, Poncet B, Gugerli F, Thuiller W, Taberlet P, Gielly L, Rioux D, Brodbeck S, Aubert S, Manel S. 2008. Land ahead: using genome scans to identify molecular markers of adaptive relevance. Plant Ecol. Diversity 1: 273-283.
Hufford KM, Mazer SJ. 2003. Plant ecotypes: genetic differentiation in the age of ecological restoration. Trends in Ecology & Evolution 18: 147-155.
Huson D, Bryant D. 2006. Application of phylogenetic networks in evolutionary studies. Molecular Biology and Evolution 23: 254-267.
Huxman T, Snyder K, Tissue D, Leffler AJ, Ogle K, Pockman W, Sandquist D, Potts D, Schwinning S. 2004. Precipitation pulses and carbon fluxes in semiarid and arid ecosystems. Oecologia 141: 254-268.
Johnson LAS, Hill KD. 1991. Systematic studies in the eucalypts - 2. A revision of the gimlets and related species: Eucalyptus extracodical series Salubres and Annulatae (Myrtaceae). Telopea 4: 201-222.
Jump AS, Peñuelas J. 2005. Running to stand still: adaptation and the response of plants to rapid climate change. Ecology Letters 8: 1010-1020.
Kane NC, Rieseberg LH. 2007. Selective sweeps reveal candidate genes for adaptation to drought and salt tolerance in common sunflower, Helianthus annuus. Genetics 175: 1803–1812.

64 Adaptation to climate in widespread eucalypt species
Kelly M, Mercer D. 2005. Australia's box-ironbark forests and woodlands: saving the fragments of a threatened ecosystem. Australian Geographer 36: 19-37.
Kirono DGC, Kent DM, Hennessy KJ, Mpelasoka F. 2011. Characteristics of Australian droughts under enhanced greenhouse conditions: Results from 14 global climate models. Journal of Arid Environments 75: 566-575.
Kramer AT, Havens K. 2009. Plant conservation genetics in a changing world. Trends in Plant Science 14: 599-607.
Li C. 1999. Carbon isotope composition, water-use efficiency and biomass productivity of Eucalyptus microtheca populations under different water supplies. Plant and Soil 214: 165-171.
Li C. 2000. Population differences in water-use efficiency of Eucalyptus microtheca seedlings under different watering regimes. Physiologia Plantarum 108: 134-139.
Li C, Berninger F, Koskela J, Sonninen E. 2000. Drought responses of Eucalyptus microtheca provenances depend on seasonality of rainfall in their place of origin. Australian Journal of Plant Physiology 27: 231-238.
Lopez GA, Potts BM, Vaillancourt RE, Apiolaza LA. 2003. Maternal and carryover effects on early growth of Eucalyptus globulus. Canadian Journal of Forest Research 33: 2108-2115.
López R, Climent J, Gil L. 2010. Intraspecific variation and plasticity in growth and foliar morphology along a climate gradient in the Canary Island pine. Trees 24: 343-350.
Lunt I.D., Hellmann J., Mitchell N.J., Byrne M., Garnett S.T., Hayward M.W., Martin, T.G., McDonald-Madden E., Williams S. and Zander K.K. (2013) Using assisted colonisation to conserve biodiversity and restore ecosystem function under climate change. Biological conservation 157: 172-17.
Macfarlane C, Adams MA, White DA. 2004. Productivity, carbon isotope discrimination and leaf traits of trees of Eucalyptus globulus Labill. in relation to water availability. Plant, Cell & Environment 27: 1515-1524.
Macfarlane C, Warren CR, White DA, Adams MA. 1999. A rapid and simple method for processing wood to crude cellulose for analysis of stable carbon isotopes in tree rings. Tree Physiology 19: 831-835.
Matesanz S, Gianoli E, Valladares F. 2010. Global change and the evolution of phenotypic plasticity in plants. Annals of the New York Academy of Sciences 1206: 35-55.
Mediavilla S, Gallardo-López V, González-Zurdo P, Escudero A. 2012. Patterns of leaf morphology and leaf N content in relation to winter temperatures in three evergreen tree species. International Journal of Biometeorology 56: 915-926.
Miller JM, Williams RJ, Farquhar GD. 2001. Carbon isotope discrimination by a sequence of Eucalyptus species along a subcontinental rainfall gradient in Australia. Functional Ecology 15: 222-232.

Adaptation to climate in widespread eucalypt species 65
Mosca E, Eckert AJ, Di Pierro EA, Rocchini E, La Porta N, Belletti P, Neale DB. 2012. The geographical and environmental determinants of genetic diversity for four alpine confiers of the European Alps. Molecular Ecology 21: 5530-5545.
Murphy BF, Timbal B. 2008. A review of recent climate variability and climate change in southeastern Australia. International Journal of Climatology 28: 859-879.
Mutke S, Gordo J, Regina Chambel M, Aránzazu Prada M, Álvarez D, Iglesias S, Gil L. 2010. Phenotypic plasticity is stronger than adaptative differentiation among Mediterranean stone pine provenances. Forest Systems 19: 354-366.
Namroud M-C, Beaulieu J, Juge N, Laroche J, Bousquet J. 2008. Scanning the genome for gene single nucleotide polymorphisms involved in adaptive population differentiation in white spruce. Molecular Ecology 17: 3599-3613.
Nei M. 1972. Genetic distance between populations. American Naturalist 106: 283-292.
Nicotra AB, Atkin OK, Bonser SP, Davidson AM, Finnegan EJ, Mathesius U, Poot P, Purugganan MD, Richards CL, Valladares F, van Kleunen M. 2010. Plant phenotypic plasticity in a changing climate. Trends in Plant Science 15: 684-692.
Niinemets Ü. 1999. Research review. Components of leaf dry mass per area – thickness and density – alter leaf photosynthetic capacity in reverse directions in woody plants. New Phytologist 144: 35-47.
Niinemets Ü. 2001. Global-scale climatic controls of leaf dry mass per area, density and thickness in trees and shrubs. Ecology 82: 453-469.
O'Brien EK, Mazanec RA, Krauss SL. 2007. Provenance variation of ecologically important traits of forest trees: implications for restoration. Journal of Applied Ecology 44: 583-593.
Oleksyn J, Modrzýnski J, Tjoelker MG, Z·ytkowiak R, Reich PB, Karolewski P. 1998. Growth and physiology of Picea abies populations from elevational transects: common garden evidence for altitudinal ecotypes and cold adaptation. Functional Ecology 12: 573-590.
Peakall R, Smouse P. 2006. GENALEX 6: genetic analysis in Excel. Population genetic software for teaching and research. Molecular Ecology Notes 6: 288-295.
Petroli CD, Sansaloni CP, Carling J, Steane DA, Vaillancourt RE, Myburg AA, Bonfim da Silva O, Pappas GJ, Kilian A, Grattapaglia D. 2012. Genomic characterization of DArT markers based on high-density linkage analysis and physical mapping to the Eucalyptus genome. PLoS ONE 7: e44684. doi:44610.41371.
Poorter L, Lianes E, Moreno-de las Heras M, Zavala M. 2012. Architecture of Iberian canopy tree species in relation to wood density, shade tolerance and climate. Plant ecology 213: 707-722.
Portsmuth A, Niinemets Ü. 2007. Structural and physiological plasticity in response to light and nutrients in five temperate deciduous woody species of contrasting shade tolerance. Functional Ecology 21: 61-77.

66 Adaptation to climate in widespread eucalypt species
Prior LD, Bowman DMJS, Eamus D. 2005. Intra-specific variation in leaf attributes of four savanna tree species across a rainfall gradient in tropical Australia. Australian Journal of Botany 53: 323-335.
Prober SM, Smith FP. 2009. Enhancing biodiversity persistence in intensively used agricultural landscapes: A synthesis of 30 years of research in the Western Australian wheatbelt. Agriculture, Ecosystems & Environment 132: 173-191.
Prunier J, Laroche J, Beaulieu J, Bousquet J. 2011. Scanning the genome for gene SNPs related to climate adaptation and estimating selection at the molecular level in boreal black spruce. Molecular Ecology 20: 1702-1716.
R Development Core Team 2012. R: A language and environment for statistical computing R Foundation for Statistical Computing, Vienna, Austria. ISBN 3-900051-07-0, URL http://www.R-project.org.
Ramírez-Valiente JA, Sánchez-Gómez D, Aranda I, Valladares F. 2010. Phenotypic plasticity and local adaptation in leaf ecophysiological traits of 13 contrasting cork oak populations under different water availabilities. Tree Physiology 30: 618-627.
Raymond OL, Retter AJ, eds. 2010. Surface geology of Australia 1:1,000,000 scale, 2010 edition [Digital Dataset]: Geoscience Australia, Commonwealth of Australia, Canberra. http://www.ga.gov.au.
Rehfeldt GE. 1989. Ecological adaptations in Douglas-Fir (Pseudotsuga menziesii var. glauca): a synthesis. Forest Ecology and Management 28: 203-215.
Richter S, Kipfer T, Wohlgemuth T, Calderón Guerrero C, Ghazoul J, Moser B. 2012. Phenotypic plasticity facilitates resistance to climate change in a highly variable environment. Oecologia 169: 269-279.
Rozendaal DMA, Hurtado VH, Poorter L. 2006. Plasticity in leaf traits of 38 tropical tree species in response to light; relationships with light demand and adult stature. Functional Ecology 20: 207-216.
Sansaloni C, Petroli C, Carling J, Hudson C, Steane D, Myburg A, Grattapaglia D, Vaillancourt R, Kilian A. 2010. A high-density Diversity Arrays Technology (DArT) microarray for genome-wide genotyping in Eucalyptus. Plant Methods 6: 16.
Sansaloni C, Petroli C, Jaccoud D, Carling J, Detering F, Grattapaglia D, Kilian A. 2011. Diversity Arrays Technology (DArT) and next-generation sequencing combined: genome-wide, high throughput, highly informative genotyping for molecular breeding of Eucalyptus. BMC Proceedings 5 (Suppl. 7): P54.
Savolainen O, Pyhäjärvi T, Knürr T. 2007. Gene flow and local adaptation in trees. Annual Review of Ecology, Evolution, and Systematics 38: 595-619.
Schenk HJ, Espino S, Goedhart CM, Nordenstahl M, Cabrera HIM, Jones CS. 2008. Hydraulic integration and shrub growth form linked across continental aridity gradients. Proceedings of the National Academy of Sciences 105: 11248-11253.
Adaptation to climate in widespread eucalypt species 67
Schulze ED, Turner NC, Nicolle D, Schumacher J. 2006a. Leaf and wood carbon isotope ratios, specific leaf areas and wood growth of Eucalyptus species across a rainfall gradient in Australia. Tree Physiology 26: 479-492.
Schulze ED, Turner NC, Nicolle D, Schumachera J. 2006b. Species differences in carbon isotope ratios, specific leaf area and nitrogen concentrations in leaves of Eucalyptus growing in a common garden compared with along an aridity gradient. Physiologia Plantarum 127: 434–444.
Schulze ED, Williams RJ, Farquhar GD, Schulze W, Langridge J, Miller JM, Walker BH. 1998. Carbon and nitrogen isotope discrimination and nitrogen nutrition of trees along a rainfall gradient in northern Australia. Functional Plant Biology 25: 413-425.
Selkoe KA, Toonen RJ. 2006. Microsatellites for ecologists: a practical guide to using and evaluating microsatellite markers. Ecology Letters 9: 615-629.
Sork VL, Davis FW, Westfall R, Flint A, Ikegami M, Wang H, Grivet D. 2010. Gene movement and genetic association with regional climate gradients in California valley oak (Quercus lobata Nee) in the face of climate change. Mol. Ecol. 19: 3806-3823.
Stackpole DJ, Harwood C 2001. Eucalyptus tricarpa: genetic improvement strategy in southern Australia. Harwood C, Bulma P, Bush D, Mazanec R, Stackpole D. Australian Low Rainfall Tree Improvement Group Compendium of Hardwood Breeding Strategies. Rural Industries Research and Development Corporation Publication 01/100: 94-113, Canberra.
Stackpole DJ, Tibbits J. 2000. Eucalyptus tricarpa Seed Collections Victoria, December 1999-Febuary 2000: Centre for Forest Tree Technology, Department of Natural Resources and Environment, State Government of Victoria (Internal report).
Steane DA, Nicolle D, Sansaloni CP, Petroli CD, Carling J, Kilian A, Myburg AA, Grattapaglia D, Vaillancourt RE. 2011. Population genetic analysis and phylogeny reconstruction in Eucalyptus (Myrtaceae) using high-throughput, genome-wide genotyping. Molecular Phylogenetics and Evolution 59: 206-224.
Strasburg JL, Sherman NA, Wright KM, Moyle LC, Willis JH, Rieseberg LH. 2012. What can patterns of differentiation across plant genomes tell us about adaptation and speciation? Phil. Trans. Roy. Soc. B 367: 364-373.
Thomas CD. 2011. Translocation of species, climate change, and the end of trying to recreate past ecological communities. Trends in Ecology & Evolution 26: 216-221.
Tsumura Y, Uchiyama K, Moriguchi Y, Ueno S, Ihara-Ujino T. 2012. Genome scanning for detecting adaptive genes along environmental gradients in the Japanese conifer Cryptomeria japonica. Heredity 109: 349-360.
Tuomela K. 1997. Leaf water relations in six provenances of Eucalyptus microtheca: a greenhouse experiment. Forest Ecology and Management 92: 1-10.
Turner NC, Schulze E-D, Nicolle D, Schumacher J, Kuhlmann I. 2008. Annual rainfall does not directly determine the carbon isotope ratio of leaves of Eucalyptus species. Physiologia Plantarum 132: 440-445.

68 Adaptation to climate in widespread eucalypt species
Valladares F, Sanchez-Gomez D, Zavala MA. 2006. Quantitative estimation of phenotypic plasticity: bridging the gap between the evolutionary concept and its ecological applications. Journal of Ecology 94: 1103-1116.
Vander Mijnsbrugge K, Bischoff A, Smith B. 2010. A question of origin: Where and how to collect seed for ecological restoration. Basic and Applied Ecology 11: 300-311.
Vitasse Y, Bresson CC, Kremer A, Michalet R, Delzon S. 2010. Quantifying phenological plasticity to temperature in two temperate tree species. Functional Ecology 24: 1211-1218.
Vitasse Y, Porté AJ, Kremer A, Michalet R, Delzon S. 2009. Responses of canopy duration to temperature changes in four temperate tree species: relative contributions of spring and autumn leaf phenology. Oecologia 161: 187-198.
von Arx G, Archer SR, Hughes MK. 2012. Long-term functional plasticity in plant hydraulic architecture in response to supplemental moisture. Annals of Botany 109: 1091-1100.
Wang C, He T, Chen F. 2013. Evolutionary thinking in restoration under global environmental changes. Journal of Plant Ecology.
Wang T, O'Neill GA, Aitken SN. 2010. Integrating environmental and genetic effects to predict responses of tree populations to climate. Ecological Applications 20: 153-163.
Warren CR, Tausz M, Adams MA. 2005. Does rainfall explain variation in leaf morphology and physiology among populations of red ironbark (Eucalyptus sideroxylon subsp. tricarpa) grown in a common garden? Tree Physiology 25: 1369-1378.
Weeks AR, Sgro CM, Young AG, Frankham R, Mitchell NJ, Miller KA, Byrne M, Coates DJ, Eldridge MDB, Sunnucks P, Breed MF, James EA, Hoffmann AA. 2011. Assessing the benefits and risks of translocations in changing environments: a genetic perspective. Evolutionary Applications 4: 709-725.
Weih M, Bonosi L, Ghelardini L, Rönnberg-Wästljung AC. 2011. Optimizing nitrogen economy under drought: increased leaf nitrogen is an acclimation to water stress in willow (Salix spp.). Annals of Botany 108: 1347-1353.
Weih M, Karlsson PS. 2001. Growth response of mountain birch to air and soil temperature: is increasing leaf-nitrogen content an acclimation to lower air temperature? New Phytologist 150: 147-155.
West-Eberhard MJ. 2005. Developmental plasticity and the origin of species differences. Proceedings of the National Academy of Sciences of the United States of America 102: 6543-6549.
Wilson PJ, Thompson KEN, Hodgson JG. 1999. Specific leaf area and leaf dry matter content as alternative predictors of plant strategies. New Phytologist 143: 155-162.

Adaptation to climate in widespread eucalypt species 69
Wright IJ, Reich PB, Westoby M. 2001. Strategy shifts in leaf physiology, structure and nutrient content between species of high- and low-rainfall and high- and low-nutrient habitats. Functional Ecology 15: 423-434.
Xu T, Hutchinson M. 2011. ANUCLIM version 6.1 user guide.: The Australian National Unievsity, Fernner School of Environment and Society, Canberra.
Zeileis A, Kleiber C, Jackman S 2007. Regression models for count data in R. Research Report Series: 53. Department of Statistics and Mathematics, WU Vienna University of Economics and Business, Vienna.

70 Adaptation to climate in widespread eucalypt species
APPENDIX 1: CLIMATIC VARIABLES
ANUCLIM Climatic Variables and abbreviations 1 TANN Annual Mean Temperature 2 TMDR Mean Diurnal Range(Mean(period max-min)) 3 TIT Isothermality (= variable2/variable7 ) 4 TCVAR Temperature Seasonality (C of V) 5 TMXWM Max Temperature of Warmest Period 6 TMNCM Min Temperature of Coldest Period 7 TSPAN Temperature Annual Range (= variable 5 - variable 6) 8 TWETQ Mean Temperature of Wettest Quarter 9 TDRYQ Mean Temperature of Driest Quarter 10 TWMQ Mean Temperature of Warmest Quarter 11 TCLQ Mean Temperature of Coldest Quarter 12 RANN Annual Precipitation 13 RWETM Precipitation of Wettest Period 14 RDRYM Precipitation of Driest Period 15 RCVAR Precipitation Seasonality(C of V) 16 RWETQ Precipitation of Wettest Quarter 17 RDRYQ Precipitation of Driest Quarter 18 RWMQ Precipitation of Warmest Quarter 19 RCLQ Precipitation of Coldest Quarter 20 RRANN Annual Mean Radiation 21 RRH Highest Period Radiation 22 RRL Lowest Period Radiation 23 RRCVAR Radiation Seasonality (C of V) 24 RRWETQ Radiation of Wettest Quarter 25 RRDRYQ Radiation of Driest Quarter 26 RRWMQ Radiation of Warmest Quarter 27 RRCLQ Radiation of Coldest Quarter 28 MIANN Annual Mean Moisture Index 29 MIH Highest Period Moisture Index 30 MIL Lowest Period Moisture Index 31 MICVAR Moisture Index Seasonality (C of V) 32 MIMHQ Mean Moisture Index of High Qtr 33 MIMLQ Mean Moisture Index of Low Qtr 34 MIMWMQ Mean Moisture Index of Warm Qtr 35 MIMCLQ Mean Moisture Index of Cold Qtr

Adaptation to climate in widespread eucalypt species 71
APPENDIX 2: STUDY SITE SOIL CHARACTERISTICS
Soil characteristics at the Eucalyptus tricarpa study sites.
N (mg kg-1) pH Particle size composition (%)
Location NH4+ NO3
- P (mg kg-1)
K (mg kg-1)
S (mg kg-1)
in CaCl2
in water EC (mS m-1)
Organic carbon (%) clay silt fine
sand coarse sand
Populations:
Tarnagulla 4 3 5 233 5.2 4.0 4.8 7.3 2.6 17.8 19.9 34.5 27.8
Craigie 2 2 4 199 4.4 4.1 4.8 12.4 2.3 20.3 18.3 40.7 20.7
Mt Bealiba 3 2 5 223 6.7 4.1 5.1 7.9 2.2 16.9 23.9 34.3 24.9
Heathcote 5 2 5 152 9.7 3.9 4.8 22.1 4.2 21.2 25.4 29.9 23.5
Heyfield 5 3 7 128 5.5 3.7 4.7 5.2 3.8 12.2 17.3 25.5 45.0
Mt Nowa Nowa 5 2 7 143 2.7 4.5 5.5 4.0 3.0 10.9 14.0 25.3 49.8
Tuckerbox 4 2 5 177 3.7 4.2 4.9 10.1 2.7 20.4 30.2 32.5 16.9
Christmas Hills 4 3 6 175 2.8 4.2 5.1 4.3 3.1 17.1 25.2 51.6 6.1
Martins Creek 4 3 11 298 3.7 4.1 5.0 5.2 3.9 17.7 24.6 36.0 21.7
Common gardens:
Huntly 5 1 10 206 3.8 4.6 5.6 4.7 2.1 24.5 10.2 35.9 29.4
Lake Tyers 6 5 6 68 8.4 4.6 5.6 5.7 2.0 42.4 23.4 28.3 5.9

72 Adaptation to climate in widespread eucalypt species
Soil characteristics at the Eucalyptus salubris study sites
N (mg kg-1) pH Particle size composition (%)
Location NH4+ NO3
- P (mg kg-1)
K (mg kg-1)
S (mg kg-1)
in CaCl2
in water EC (mS m-1)
Organic carbon (%) clay silt fine
sand coarse sand
Queen Victoria Spring Res. 4 1 7 280 3.6 7.4 8.4 0.2 1.0 19 4 30 47
Bullock Holes Reserve 4 4 7 270 27.9 8.0 8.7 0.3 0.6 16 8 25 52
Credo Station 4 < 1 7 450 3.3 7.8 8.4 0.1 0.7 25 21 29 26
Coolgardie 4 15 3 323 10.4 8.0 8.6 0.4 1.3 36 13 19 31
Lake Johnston 5 < 1 5 415 5.1 6.0 6.9 0.1 1.2 15 4 16 65
Bruce Rock 6 20 12 452 10.9 5.7 6.4 0.3 2.2 22 12 14 53
Dunn Rock 5 2 3 353 63.9 6.0 7.0 0.7 2.1 28 2 18 53
Lockhart Rd (Newdegate) 5 3 3 237 23.2 5.8 6.8 0.3 2.1 21 4 22 53
Ravensthorpe 5 3 4 523 7.9 7.5 8.5 0.3 2.9 43 8 28 22

Adaptation to climate in widespread eucalypt species 73
APPENDIX 3: ANUCLIM DRAFTSMAN PLOTS OF EUCALYPTUS TRICARPA CLIMATIC VARIABLES

74 Adaptation to climate in widespread eucalypt species
APPENDIX 4: REGRESSION ANALYSIS OF THE ADAPTIVE GENETIC INDEX (CAP1) OF EUCALYPTUS TRICARPA AGAINST SOIL PROPERTIES.
R2 is the correlation coefficient. Uncorrected (exact) probability scores are given, as well as probability scores corrected for a 5% false discovery rate (FDR), and 5% dependent false discovery rate (allowing for correlation among variables, DFDR).
Dependent Variable
Independent Variable
No Pops R2 Y Intercept
Reg Coeff
P (exact) P (FDR)
P (DFDR)
P (exact) P (FDR)
P (DFDR)
Chemistry
CAP1 NH4 9 0.215 0.084 -0.021 0.209 0.545 1
ns ns ns
CAP1 NO3 9 0.027 0.034 -0.014 0.672 0.841 1
ns ns ns CAP1 P 9 0.417 0.086 -0.014 0.061 0.393 1
ns ns ns
CAP1 K 9 0.006 -0.014 0.000 0.841 0.841 1
ns ns ns CAP1 S 9 0.417 -0.067 0.013 0.060 0.393 1
ns ns ns
CAP1 Organic C 9 0.123 0.067 -0.022 0.354 0.575 1
ns ns ns CAP1 conductivity 9 0.212 -0.033 0.368 0.212 0.545 1
ns ns ns
CAP1 pH in CaCl2 9 0.182 0.362 -0.089 0.252 0.545 1
ns ns ns
CAP1 pH in H2O 9 0.185 0.399 -0.081 0.249 0.545 1
ns ns ns
Particle Size CAP1 clay 9 0.132 -0.081 0.005 0.337 0.575 1
ns ns ns
CAP1 coarse sand 9 0.018 0.011 -0.001 0.733 0.841 1
ns ns ns CAP1 finesand 9 0.016 -0.026 0.001 0.747 0.841 1
ns ns ns
CAP1 silt 9 0.010 0.019 -0.001 0.794 0.841 1 ns ns ns

Adaptation to climate in widespread eucalypt species 75
APPENDIX 5: ANALYSIS OF VARIANCE (ANOVA) OF PHYSIOLOGICAL/MORPHOMETRIC DATA IN WILD POPULATIONS AND FIELD TRIALS OF EUCALYPTUS TRICARPA.
R2 is the correlation coefficient. Uncorrected (exact) probability scores are given, as well as probability scores corrected for a 5% false discovery rate (FDR), and 5% dependent false discovery rate (allowing for correlation among variables, DFDR).
Trait R2 Df pop F pop Df err P (exact) P FDR P DFDR P(exact) P FDR P DFDR Wild Populations
Leaf thickness mean 0.326 8 4.888 81 0.000 0.001 0.002
*** *** ** Leaf area mean 0.203 8 2.577 81 0.015 0.018 0.061
* * ns
Leaf dw mean 0.124 8 1.428 81 0.197 0.211 0.702
* ns ns SLA mean 0.312 8 4.592 81 0.000 0.001 0.002
*** *** **
Leaf density mean 0.212 8 2.727 81 0.010 0.014 0.047
* * * No. stems 0.085 8 0.939 81 0.490 0.490 1.000
* ns ns
Total CSA 0.244 8 3.266 81 0.003 0.005 0.016
** ** * Circ Stem 1 0.200 8 2.536 81 0.016 0.019 0.062
* * ns
Cellulose 13C 0.242 8 3.313 83 0.003 0.005 0.015
** ** * Leaf N mass 0.287 8 4.183 83 0.000 0.001 0.003
*** *** **
Leaf 15N 0.522 8 11.331 83 0.000 0.000 0.000
*** *** *** Leaf C mass 0.217 8 2.877 83 0.007 0.011 0.035
** * *
Leaf 13C 0.294 8 4.310 83 0.000 0.001 0.002
*** *** ** Leaf N area 0.305 8 4.544 83 0.000 0.001 0.002
*** *** **
Leaf C:N ratio 0.275 8 3.934 83 0.001 0.001 0.004
*** ** **

76 Adaptation to climate in widespread eucalypt species
Lake Tyers Trial (WET)
Leaf thickness mean 0.131 8 1.429 76 0.198 0.229 0.758
* ns ns Leaf area mean 0.393 8 6.139 76 0.000 0.000 0.000
*** *** ***
Leaf dw mean 0.309 8 4.247 76 0.000 0.001 0.003
*** *** ** SLA mean 0.064 8 0.648 76 0.735 0.735 1.000
* ns ns
Leaf density mean 0.199 8 2.355 76 0.026 0.038 0.127
* * ns Circ. Stem 1 0.434 8 7.275 76 0.000 0.000 0.000
*** *** ***
Total CSA 0.433 8 7.244 76 0.000 0.000 0.000
*** *** *** Height 0.328 8 4.626 76 0.000 0.000 0.001
*** *** **
Cellulose 13C 0.213 8 2.532 75 0.017 0.028 0.094
* * ns Leaf N mass 0.149 8 1.646 75 0.126 0.172 0.571
* ns ns
Leaf 15N 0.265 8 3.383 75 0.002 0.005 0.016
** ** * Leaf C mass 0.509 8 9.711 75 0.000 0.000 0.000
*** *** ***
Leaf 13C 0.215 8 2.574 75 0.015 0.028 0.094
* * ns Leaf N area 0.113 8 1.195 75 0.314 0.336 1.000
* ns ns
Leaf C:N ratio 0.141 8 1.538 75 0.159 0.198 0.658
* ns ns Huntly Trial (DRY)
Leaf thickness mean 0.459 8 8.466 80 0.000 0.000 0.000
*** *** *** Leaf area mean 0.182 8 2.227 80 0.034 0.101 0.336
* ns ns
Leaf dw mean 0.073 8 0.789 80 0.614 0.614 1.000
* ns ns SLA mean 0.427 8 7.453 80 0.000 0.000 0.000
*** *** ***
Leaf density mean 0.136 8 1.574 80 0.146 0.228 0.755
* ns ns Circ stem 1 0.147 8 1.729 80 0.104 0.196 0.649
* ns ns
Total CSA 0.150 8 1.758 80 0.098 0.196 0.649
* ns ns Height 0.221 8 2.832 80 0.008 0.030 0.100
** * ns

Adaptation to climate in widespread eucalypt species 77
Cellulose 13C 0.129 8 1.486 80 0.175 0.228 0.755
* ns ns Leaf N mass 0.125 8 1.429 80 0.197 0.228 0.755
* ns ns
Leaf 15N 0.127 8 1.457 80 0.187 0.228 0.755
* ns ns Leaf C mass 0.127 8 1.452 80 0.188 0.228 0.755
* ns ns
Leaf 13C 0.164 8 1.957 80 0.063 0.157 0.520
* ns ns Leaf N area 0.224 8 2.880 80 0.007 0.030 0.100
** * ns
Leaf C:N ratio 0.106 8 1.189 80 0.316 0.339 1.000 * ns ns

78 Adaptation to climate in widespread eucalypt species
APPENDIX 6: REGRESSION ANALYSIS OF PHYSIOLOGICAL/MORPHOMETRIC DATA IN WILD POPULATIONS OF EUCALYPTUS TRICARPA AGAINST THE ADAPTIVE GENETIC INDEX (CAP1).
[i.e., Is there a physiological/morphometric trait that is correlated with the adaptive genetic index?] R2 is the correlation coefficient. Uncorrected (exact) probability scores are given, as well as probability scores corrected for a 5% false discovery rate (FDR), and 5% dependent false discovery rate (allowing for correlation among variables, DFDR).
Dependent Variable Independent Variable
No Pops R2 Y Intercept Reg Coeff
P (exact) P (FDR)
P (DFDR)
P (exact) P FDR P DFDR
Leaf thickness mean CAP1 9 0.275 0.324 0.187 0.148 0.147 0.148
ns ns ns Leaf area mean CAP1 9 0.246 14.357 -15.893 0.175 0.447 1.000
ns ns ns
Leaf dw mean CAP1 9 0.014 0.412 -0.090 0.766 0.935 1.000
ns ns ns SLA mean CAP1 9 0.407 35.551 -29.465 0.065 0.301 0.979
ns ns ns
Leaf density mean CAP1 9 0.539 0.884 0.275 0.024 0.171 0.555
* ns ns No. stems CAP1 9 0.591 1.169 2.215 0.016 0.171 0.555
* ns ns
Total CSA CAP1 9 0.100 1387.030 -2290.200 0.407 0.713 1.000
ns ns ns Circ Stem1 CAP1 9 0.206 123.488 -152.970 0.220 0.447 1.000
ns ns ns
Cellulose 13 C CAP1 9 0.058 -28.308 -2.538 0.534 0.830 1.000
ns ns ns Leaf N mass CAP1 9 0.003 1.241 -0.081 0.892 0.960 1.000
ns ns ns
Leaf 15N CAP1 9 0.279 -2.340 -10.056 0.144 0.447 1.000
ns ns ns Leaf C mass CAP1 9 0.012 54.607 -2.666 0.782 0.935 1.000
ns ns ns
Leaf 13C CAP1 9 0.010 -29.959 -1.086 0.802 0.935 1.000
ns ns ns Leaf N area CAP1 9 0.203 0.352 0.262 0.223 0.447 1.000
ns ns ns
Leaf C:N ratio CAP1 9 0.000 44.328 0.426 0.981 0.981 1.000 ns ns ns

Adaptation to climate in widespread eucalypt species 79
APPENDIX 7: REGRESSION ANALYSIS OF PHYSIOLOGICAL/MORPHOMETRIC DATA FROM EUCALYPTUS TRICARPA IN COMMON GARDEN FIELD TRIALS AT LAKE TYERS (WET TRIAL) AND HUNTLY (DRY TRIAL) AGAINST THE ADAPTIVE GENETIC INDEX (CAP1).
[i.e., Is there a physiological/morphometric trait that is correlated with the adaptive genetic index when different provenances are grown in a common environment?] R2 is the correlation coefficient. Uncorrected (exact) probability scores are given, as well as probability scores corrected (within each field trial) for a 5% false discovery rate (FDR), and 5% dependent false discovery rate (allowing for correlation among variables, DFDR).
Dependent Variable Independent Variable
No Pops R2
Y Intercept Reg Coeff
P (exact) P (FDR)
P (DFDR)
P (exact) P FDR
P DFDR
Lake Tyers Trial (WET)
Leaf thickness mean CAP1 9 0.768 0.281 0.150 0.002 0.011 0.035
** * * Leaf area mean CAP1 9 0.817 17.275 -59.255 0.001 0.011 0.035
*** * *
Leaf dw mean CAP1 9 0.762 0.414 -1.335 0.002 0.011 0.035
** * * SLA mean CAP1 9 0.411 42.778 -13.419 0.063 0.105 0.347
ns ns ns
Leaf density mean CAP1 9 0.344 0.845 -0.204 0.097 0.145 0.482
ns ns ns Tree Height mean CAP1 9 0.598 9.486 -22.202 0.015 0.054 0.180
* ns ns
Total CSA CAP1 9 0.486 217.545 -1384.900 0.037 0.079 0.263
* ns ns Circ Stem1 CAP1 9 0.492 49.556 -151.710 0.035 0.079 0.263
* ns ns
Cellulose 13 C CAP1 9 0.441 -29.205 -5.352 0.051 0.096 0.318
ns ns ns Leaf N mass CAP1 9 0.036 1.443 0.247 0.625 0.670 1.000
ns ns ns
Leaf 15N CAP1 9 0.514 1.689 -8.119 0.030 0.079 0.263
* ns ns Leaf C mass CAP1 9 0.071 53.661 4.792 0.489 0.564 1.000
ns ns ns
Leaf 13C CAP1 9 0.262 -30.978 -3.860 0.159 0.217 0.721
ns ns ns

80 Adaptation to climate in widespread eucalypt species
Leaf N area CAP1 9 0.214 0.339 0.153 0.210 0.263 0.872
ns ns ns Leaf C:N ratio CAP1 9 0.008 37.593 -3.092 0.825 0.825 1.000
ns ns ns
Huntly Trial (DRY) Leaf thickness mean CAP1 9 0.851 0.307 0.465 0.000 0.005 0.015
*** ** *
Leaf area mean CAP1 9 0.518 14.506 -20.653 0.029 0.093 0.308
* ns ns Leaf dw mean CAP1 9 0.000 0.402 0.011 0.959 0.959 1.000
ns ns ns
SLA mean CAP1 9 0.832 36.717 -56.408 0.001 0.005 0.015
*** ** * Leaf density mean CAP1 9 0.004 0.907 -0.019 0.865 0.927 1.000
ns ns ns
Tree Height mean CAP1 9 0.198 11.319 9.058 0.230 0.431 1.000
ns ns ns Total CSA CAP1 9 0.509 201.590 490.683 0.031 0.093 0.308
* ns ns
Circ Stem1 CAP1 9 0.459 46.400 73.773 0.045 0.113 0.373
* ns ns Cellulose 13 C CAP1 9 0.006 -26.104 -0.633 0.839 0.927 1.000
ns ns ns
Leaf N mass CAP1 9 0.165 1.311 -0.411 0.278 0.464 1.000
ns ns ns Leaf 15N CAP1 9 0.037 2.080 -1.226 0.618 0.843 1.000
ns ns ns
Leaf C mass CAP1 9 0.203 54.323 -3.515 0.223 0.431 1.000
ns ns ns Leaf 13C CAP1 9 0.014 -27.903 -0.950 0.759 0.927 1.000
ns ns ns
Leaf N area CAP1 9 0.607 0.361 0.417 0.013 0.067 0.221
* ns ns Leaf C:N ratio CAP1 9 0.104 41.814 9.648 0.396 0.595 1.000 ns ns ns

Adaptation to climate in widespread eucalypt species 81
APPENDIX 8: REGRESSION ANALYSIS OF PLASTIC TRAIT DATA FROM EUCALYPTUS TRICARPA AGAINST THE ADAPTIVE GENETIC INDEX (CAP1).
[i.e., Are any of the plastic traits correlated with the adaptive genetic index?] R2 is the correlation coefficient. Uncorrected (exact) probability scores are given, as well as probability scores corrected for a 5% false discovery rate (FDR), and 5% dependent false discovery rate (allowing for correlation among variables, DFDR).
Dependent Variable
Independent Variable
No Pops R2
Y Intercept
Reg Coeff
P (exact) P (FDR)
P (DFDR)
P (exact)
P FDR
P DFDR
Total CSA RTR CAP1 9 0.621 0.060 -7.094 0.012 0.015 0.037
* * * Height RTR CAP1 9 0.722 -0.361 -6.164 0.004 0.007 0.018
** ** *
Leaf area RTR CAP1 9 0.613 0.333 -4.643 0.013 0.015 0.037
* * * Leaf density RTR CAP1 9 0.170 -0.573 -1.721 0.270 0.270 0.661
ns ns ns
SLA RTR CAP1 9 0.787 0.499 3.531 0.001 0.004 0.010
** ** * Leaf thickness RTR CAP1 9 0.795 -0.353 -4.344 0.001 0.004 0.010 ** ** *

82 Adaptation to climate in widespread eucalypt species
APPENDIX 9: REGRESSION ANALYSIS OF THE ADAPTIVE GENETIC INDEX (CAP1) OF EUCALYPTUS TRICARPA AGAINST CLIMATIC VARIABLES.
[i.e., Is the adaptive genetic index correlated with a climatic variable?] All climatic variables come from ANUCLIM (Appendix 1) except for the “ALA aridity index” which comes from the Atlas of Living Australia. R2 is the correlation coefficient. Uncorrected (exact) probability scores are given, as well as probability scores corrected for a 5% false discovery rate (FDR), and 5% dependent false discovery rate (allowing for correlation among variables, DFDR).
Dependent Variable
Independent Variable
No Pops R2 Y Intercept Reg Coeff
P (exact) P (FDR)
P (DFDR)
P (exact) P FDR P DFDR
Temperature
CAP1 TANN 9 0.528 -0.851 0.065 0.027 0.038 0.160
* * ns CAP1 TMDR 9 0.421 -0.446 0.038 0.059 0.078 0.327
ns ns ns
CAP1 TIT 9 0.605 0.999 -2.047 0.014 0.021 0.089
* * ns CAP1 TCVAR 9 0.861 -0.362 0.243 0.000 0.001 0.003
*** *** **
CAP1 TMXWM 9 0.971 -0.596 0.022 0.000 0.000 0.000
*** *** *** CAP1 TMNCM 9 0.081 -0.036 0.015 0.458 0.471 1.000
ns ns ns
CAP1 TMNCM 9 0.081 -0.036 0.015 0.458 0.471 1.000
ns ns ns CAP1 TSPAN 9 0.762 -0.488 0.020 0.002 0.004 0.017
** ** *
CAP1 TWETQ 9 0.860 0.147 -0.014 0.000 0.001 0.003
*** *** ** CAP1 TDRYQ 9 0.156 -0.092 0.005 0.292 0.340 1.000
ns ns ns
CAP1 TWMQ 9 0.932 -0.754 0.041 0.000 0.000 0.000
*** *** *** CAP1 TCLQ 9 0.046 0.142 -0.018 0.582 0.582 1.000
ns ns ns
Rainfall
CAP1 RANN 9 0.863 0.149 0.000 0.000 0.001 0.003
*** *** ** CAP1 RWETM 9 0.710 0.163 -0.009 0.004 0.008 0.033
** ** *
CAP1 RDRYM 9 0.959 0.121 -0.012 0.000 0.000 0.000
*** *** ***

Adaptation to climate in widespread eucalypt species 83
CAP1 RCVAR 9 0.849 -0.140 0.008 0.000 0.001 0.004
*** *** ** CAP1 RWETQ 9 0.818 0.174 -0.001 0.001 0.002 0.007
*** ** **
CAP1 RDRYQ 9 0.965 0.131 -0.001 0.000 0.000 0.000
*** *** *** CAP1 RCLQ 9 0.500 0.145 -0.001 0.033 0.046 0.191
* * ns
Radiation
CAP1 RRANN 9 0.828 -1.002 0.064 0.001 0.001 0.006
*** ** ** CAP1 RRH 9 0.931 -1.045 0.041 0.000 0.000 0.000
*** *** ***
CAP1 RRL 9 0.593 -0.764 0.124 0.015 0.023 0.095
* * ns CAP1 RRCVAR 9 0.397 -1.135 0.026 0.069 0.086 0.358
ns ns ns
CAP1 RRWETQ 9 0.901 0.097 -0.007 0.000 0.000 0.001
*** *** ** CAP1 RRDRYQ 9 0.149 -0.077 0.004 0.305 0.343 1.000
ns ns ns
CAP1 RRWMQ 9 0.924 -0.886 0.039 0.000 0.000 0.001
*** *** *** CAP1 RRCLQ 9 0.106 -0.370 0.047 0.393 0.429 1.000
ns ns ns
Moisture Indices
CAP1 MIANN 9 0.904 0.250 -0.364 0.000 0.000 0.001
*** *** ** CAP1 MIH 9 0.273 0.810 -0.828 0.149 0.178 0.745
ns ns ns
CAP1 MIL 9 0.960 0.106 -0.413 0.000 0.000 0.000
*** *** *** CAP1 MICVAR 9 0.949 -0.133 0.003 0.000 0.000 0.000
*** *** ***
CAP1 MIMHQ 9 0.397 0.735 -0.759 0.069 0.086 0.358
ns ns ns CAP1 MIMLQ 9 0.965 0.104 -0.337 0.000 0.000 0.000
*** *** ***
CAP1 MIMWMQ 9 0.952 0.095 -0.289 0.000 0.000 0.000
*** *** *** CAP1 MIMCLQ 9 0.690 0.610 -0.653 0.006 0.009 0.038
** ** *
CAP1 ALA aridity index 9 0.692 0.149 -0.172 0.005 0.009 0.038 ** ** *
84 Adaptation to climate in widespread eucalypt species
APPENDIX 10: ANUCLIM DRAFTSMAN PLOTS OF EUCALYPTUS SALUBRIS CLIMATIC VARIABLES
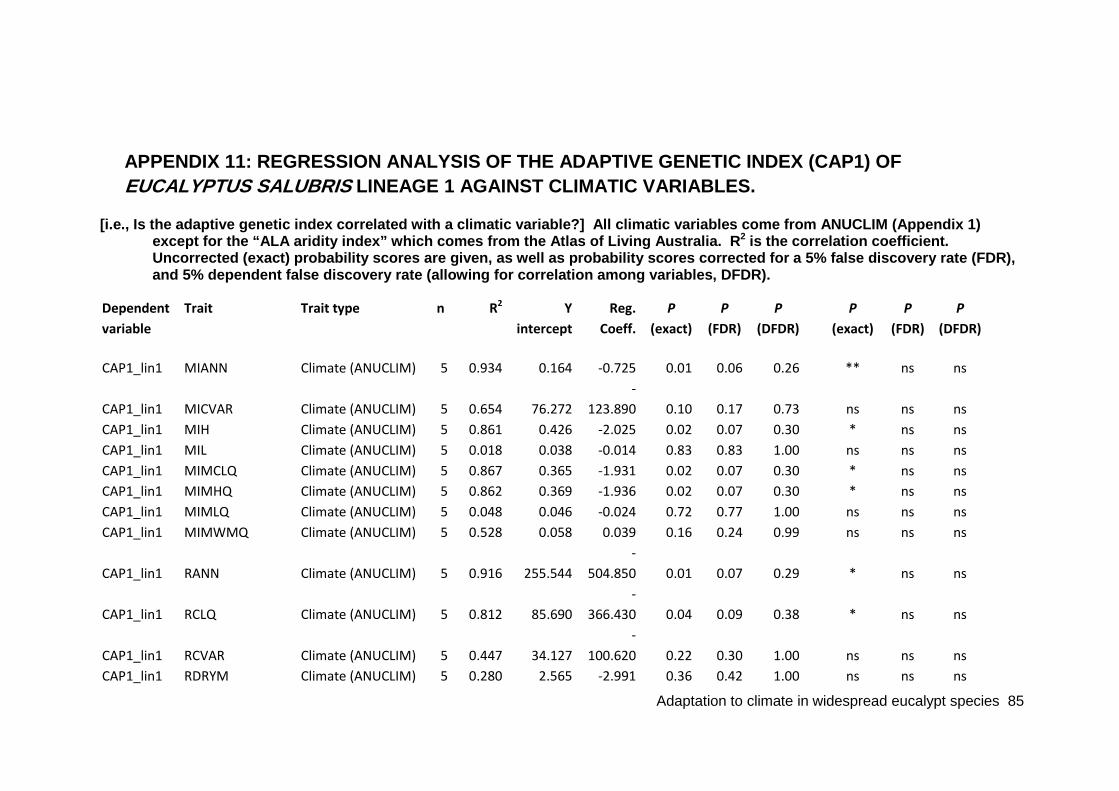
Adaptation to climate in widespread eucalypt species 85
APPENDIX 11: REGRESSION ANALYSIS OF THE ADAPTIVE GENETIC INDEX (CAP1) OF EUCALYPTUS SALUBRIS LINEAGE 1 AGAINST CLIMATIC VARIABLES.
[i.e., Is the adaptive genetic index correlated with a climatic variable?] All climatic variables come from ANUCLIM (Appendix 1) except for the “ALA aridity index” which comes from the Atlas of Living Australia. R2 is the correlation coefficient. Uncorrected (exact) probability scores are given, as well as probability scores corrected for a 5% false discovery rate (FDR), and 5% dependent false discovery rate (allowing for correlation among variables, DFDR).
Dependent variable
Trait Trait type n R2 Y intercept
Reg. Coeff.
P (exact)
P (FDR)
P (DFDR)
P (exact)
P (FDR)
P (DFDR)
CAP1_lin1 MIANN Climate (ANUCLIM) 5 0.934 0.164 -0.725 0.01 0.06 0.26
** ns ns
CAP1_lin1 MICVAR Climate (ANUCLIM) 5 0.654 76.272 -
123.890 0.10 0.17 0.73
ns ns ns CAP1_lin1 MIH Climate (ANUCLIM) 5 0.861 0.426 -2.025 0.02 0.07 0.30
* ns ns
CAP1_lin1 MIL Climate (ANUCLIM) 5 0.018 0.038 -0.014 0.83 0.83 1.00
ns ns ns CAP1_lin1 MIMCLQ Climate (ANUCLIM) 5 0.867 0.365 -1.931 0.02 0.07 0.30
* ns ns
CAP1_lin1 MIMHQ Climate (ANUCLIM) 5 0.862 0.369 -1.936 0.02 0.07 0.30
* ns ns CAP1_lin1 MIMLQ Climate (ANUCLIM) 5 0.048 0.046 -0.024 0.72 0.77 1.00
ns ns ns
CAP1_lin1 MIMWMQ Climate (ANUCLIM) 5 0.528 0.058 0.039 0.16 0.24 0.99
ns ns ns
CAP1_lin1 RANN Climate (ANUCLIM) 5 0.916 255.544 -
504.850 0.01 0.07 0.29
* ns ns
CAP1_lin1 RCLQ Climate (ANUCLIM) 5 0.812 85.690 -
366.430 0.04 0.09 0.38
* ns ns
CAP1_lin1 RCVAR Climate (ANUCLIM) 5 0.447 34.127 -
100.620 0.22 0.30 1.00
ns ns ns CAP1_lin1 RDRYM Climate (ANUCLIM) 5 0.280 2.565 -2.991 0.36 0.42 1.00
ns ns ns

86 Adaptation to climate in widespread eucalypt species
CAP1_lin1 RDRYQ Climate (ANUCLIM) 5 0.337 37.991 -45.068 0.30 0.38 1.00
ns ns ns CAP1_lin1 RRANN Climate (ANUCLIM) 5 0.831 19.686 5.914 0.03 0.08 0.35
* ns ns
CAP1_lin1 RRCLQ Climate (ANUCLIM) 5 0.838 11.993 4.594 0.03 0.08 0.35
* ns ns CAP1_lin1 RRCVAR Climate (ANUCLIM) 5 0.909 33.619 -15.906 0.01 0.07 0.29
* ns ns
CAP1_lin1 RRDRYQ Climate (ANUCLIM) 5 0.946 25.536 -19.934 0.01 0.06 0.26
** ns ns CAP1_lin1 RRH Climate (ANUCLIM) 5 0.576 28.836 3.248 0.14 0.22 0.90
ns ns ns
CAP1_lin1 RRL Climate (ANUCLIM) 5 0.872 10.035 7.020 0.02 0.07 0.30
* ns ns CAP1_lin1 RRWETQ Climate (ANUCLIM) 5 0.648 14.890 54.421 0.10 0.17 0.73
ns ns ns
CAP1_lin1 RRWMQ Climate (ANUCLIM) 5 0.743 26.765 5.750 0.06 0.12 0.49
ns ns ns CAP1_lin1 RWETM Climate (ANUCLIM) 5 0.768 8.316 -30.208 0.05 0.11 0.46
ns ns ns
CAP1_lin1 RWETQ Climate (ANUCLIM) 5 0.789 93.201 -
354.150 0.04 0.10 0.43
* ns ns CAP1_lin1 RWMQ Climate (ANUCLIM) 5 0.761 57.184 90.945 0.05 0.11 0.46
ns ns ns
CAP1_lin1 TANN Climate (ANUCLIM) 5 0.874 17.816 8.353 0.02 0.07 0.30
* ns ns CAP1_lin1 TCLQ Climate (ANUCLIM) 5 0.937 11.071 4.253 0.01 0.06 0.26
** ns ns
CAP1_lin1 TCVAR Climate (ANUCLIM) 5 0.139 1.830 0.469 0.54 0.59 1.00
ns ns ns CAP1_lin1 TDRYQ Climate (ANUCLIM) 5 0.952 20.011 -22.920 0.00 0.06 0.26
** ns ns
CAP1_lin1 TIT Climate (ANUCLIM) 5 0.284 0.478 -0.095 0.36 0.42 1.00
ns ns ns CAP1_lin1 TMDR Climate (ANUCLIM) 5 0.032 14.143 0.741 0.77 0.80 1.00
ns ns ns
CAP1_lin1 TMNCM Climate (ANUCLIM) 5 0.181 4.273 -1.274 0.47 0.54 1.00
ns ns ns CAP1_lin1 TMXWM Climate (ANUCLIM) 5 0.342 33.715 5.551 0.30 0.38 1.00
ns ns ns
CAP1_lin1 TSPAN Climate (ANUCLIM) 5 0.366 29.442 6.852 0.28 0.38 1.00
ns ns ns CAP1_lin1 TWETQ Climate (ANUCLIM) 5 0.638 15.438 54.595 0.10 0.17 0.73
ns ns ns
CAP1_lin1 TWMQ Climate (ANUCLIM) 5 0.534 24.494 8.394 0.16 0.24 0.99
ns ns ns CAP1_lin1 ALA Aridity Index Climate_INDEX 5 0.898 0.205 -1.220 0.01 0.07 0.29
* ns ns

