adaptation to climate change impact in china
TRANSCRIPT

Adaptation to Climate Change Adaptation to Climate Change Impact in ChinaImpact in China
- A Case Study on Flood Damage for InvestmentDecision-making
March 2001
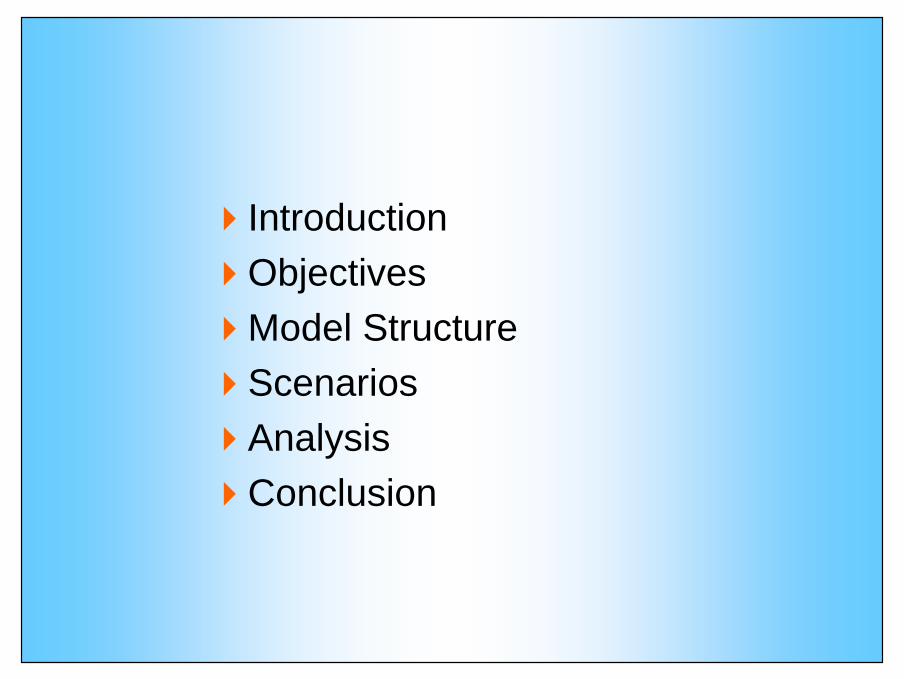
IntroductionObjectivesModel StructureScenariosAnalysisConclusion

INTRODUCTIONINTRODUCTION
Change in flood risk is frequently cited as one of the potential effects of climate change. However, there have still been relatively few studies on that topic, though there are indications that the frequency of heavy rainfall events is generally likely to increase in some regions with global warming.

Continued...
Attempts have been made to quantify changes in flood occurrence over small areas or from catchment basins. General conclusions are that both the frequency and intensity of floods may increase under changing climate in some seasons from some GCM output and that flood occurrence probability may double by the end of the next century.

Continued...Continued...
• Mechanisms of adaptation are too complex to be evaluated.
The efficiency of each adaptation strategy has not been sufficiently analyzed quantitatively to propose a detailed action plan, main limitations are derived from the following features of climate change impact and adaptation studies:
• Climate change impact is still uncertain, and most impacts, even if they occur, will not be significant before the end of the 21st
century;

OBJECTIVEOBJECTIVE
Introduce a model that adopts the standard approach of modern optimal economic growth theory and includes two discount factors from the climate sector, i.e., flood damages from climate variability and climate change. Use this model to evaluate the benefits from investment as a robust adaptation strategy in flood prevention infrastructure to adapt to projected climate change impact in China.

MODEL STRUCTUREMODEL STRUCTURE
Objective FunctionObjective Function
∑ ∏
+×= −
t i
tvi itCUMax )1())(( ρ
The fundamental assumption is that policies should be designed to maximize the generalized level of consumption now and in the future.
U is the flow of utility,Ci(t) is the flow of consumption per capita at year t,ρ is the pure rate of social time preference,i is economic sectors,ν is consumption share of each sector product.
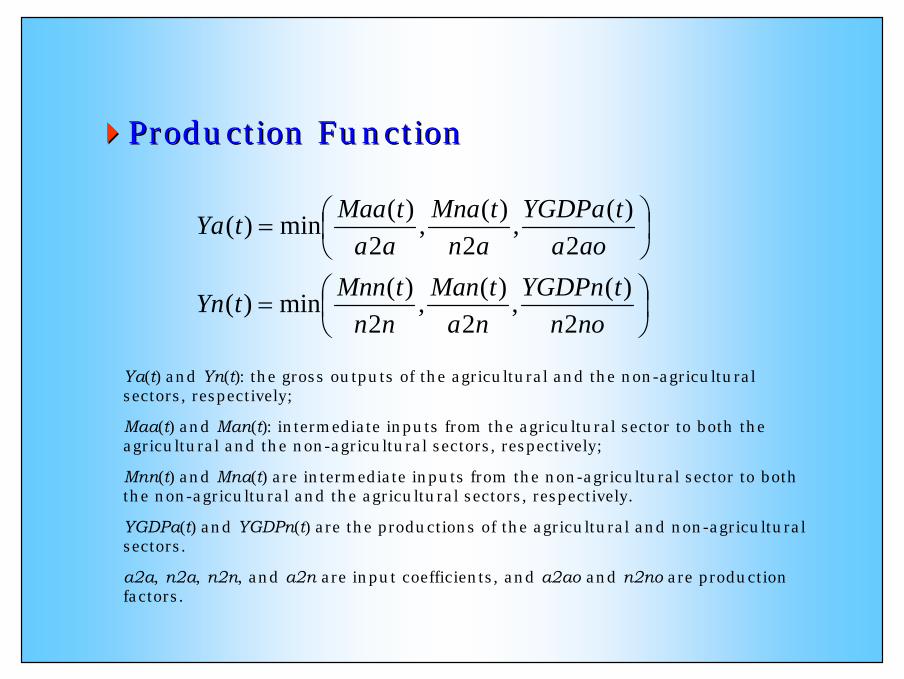
Production FunctionProduction Function
=
=
nontYGDPn
natMan
nntMnntYn
aoatYGDPa
antMna
aatMaatYa
2)(,
2)(,
2)(min)(
2)(,
2)(,
2)(min)(
Ya(t) and Yn(t): the gross outputs of the agricultural and the non-agricultural sectors, respectively;
Maa(t) and Man(t): intermediate inputs from the agricultural sector to both the agricultural and the non-agricultural sectors, respectively;
Mnn(t) and Mna(t) are intermediate inputs from the non-agricultural sector to both the non-agricultural and the agricultural sectors, respectively.
YGDPa(t) and YGDPn(t) are the productions of the agricultural and non-agricultural sectors.
a2a, n2a, n2n, and a2n are input coefficients, and a2ao and n2no are production factors.
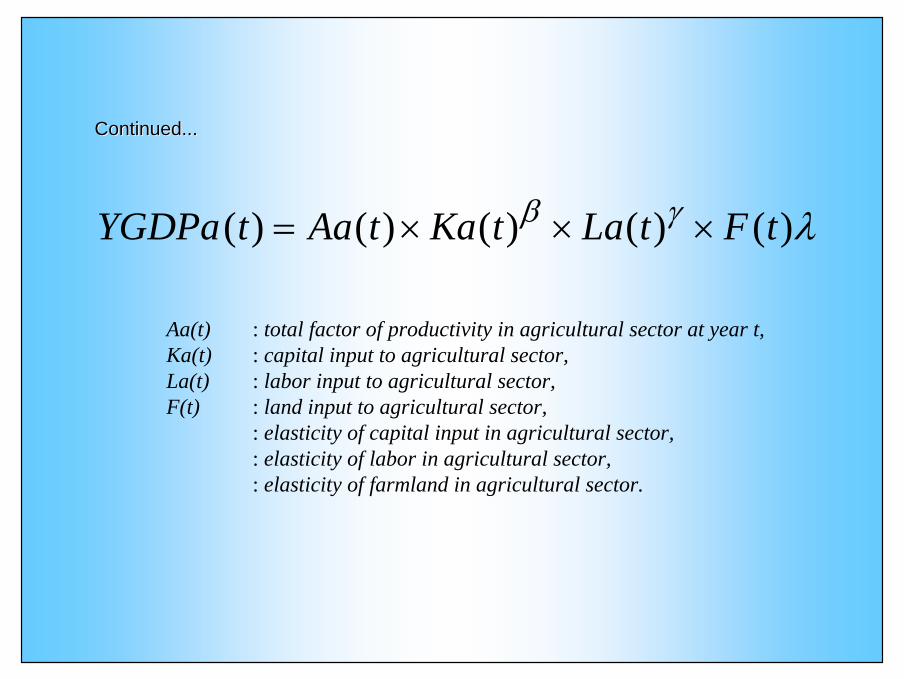
λγβ )()()()()( tFtLatKatAatYGDPa ×××=
Aa(t) : total factor of productivity in agricultural sector at year t,Ka(t) : capital input to agricultural sector,La(t) : labor input to agricultural sector,F(t) : land input to agricultural sector,β : elasticity of capital input in agricultural sector,γ : elasticity of labor in agricultural sector,λ : elasticity of farmland in agricultural sector.
Continued...Continued...

αα )()()()( 1 tLntKntAntYGDPn ××= −
α : elasticity of output with respect to capital,An(t) : total factor of productivity in non-agricultural sector,Kn(t) : capital input at year t to agricultural sector,Ln(t) : labor input at year t to agricultural sector.
Continued...Continued...

Material Balance ConstraintMaterial Balance Constraint
)()()()()()()()()()()()()()()()()(
tIADextIAextIextMnatMnntIADntIAntIntCntYntMantMaatIADatIAatIatCatYa
++++++++=+++++=
Ia(t), IAa(t) and IADa(t) are contributions of the agricultural sector to capital stock,investment for flood control, and extra investment for projected flood damage from climate change at year t.
In(t), IAn(t) and IADn(t) are contributions of the non-agricultural sector to capital stock, investment for flood control, and extra investment for projected flood damage from climate change at year t.
Iex(t), IAex(t) and IADex(t) are contributions of the non-agricultural sector to agricultural sector in capital stock, investment for flood control, and extra investment for projected flood damage from climate change at year t.
Ca(t) and Cn(t) are the consumptions of agricultural and non-agricultural goods, respectively.

Capital ConstraintsCapital Constraints
)'()'()'()'()()'()'()'()'()(
)1()1()1()()1()1()1()1()(
ttIADexttIADnttIADattINRAtINRAttIAexttIAnttIAattINRtINR
tIntKntKntIextIatKatKa
−+−+−+−=−+−+−+−=
−+−−=−+−+−−=
δδ
δ is the depreciation rate;
Ka(t) and Kn(t) are capital stocks of the agricultural and the non-agricultural sectors, respectively, at year t;
INR(t), INRA(t) are investments to infrastructure which prevent flooding from current climate variability and projected climate change at year t.
t' is the time lag of investment taking effect.
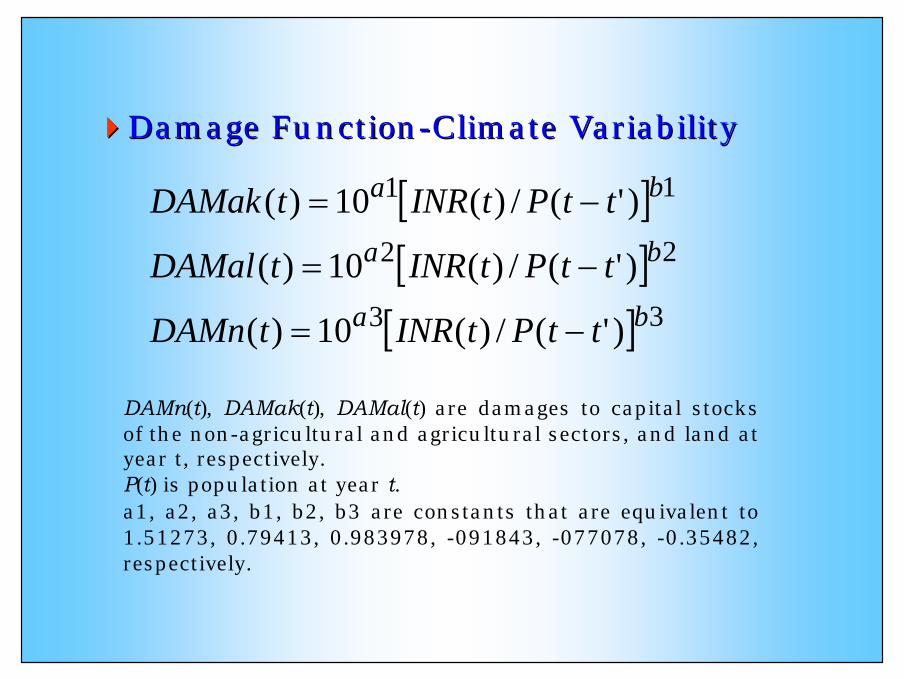
Damage FunctionDamage Function--Climate VariabilityClimate Variability
[ ][ ][ ] 33
22
11
)'(/)(10)(
)'(/)(10)(
)'(/)(10)(
ba
ba
ba
ttPtINRtDAMn
ttPtINRtDAMal
ttPtINRtDAMak
−=
−=
−=
DAMn(t), DAMak(t), DAMal(t) are damages to capital stocks of the non-agricultural and agricultural sectors, and land at year t, respectively.P(t) is population at year t.a1, a2, a3, b1, b2, b3 are constants that are equivalent to 1.51273, 0.79413, 0.983978, -091843, -077078, -0.35482, respectively.

Damage Function Damage Function -- Climate ChangeClimate Change
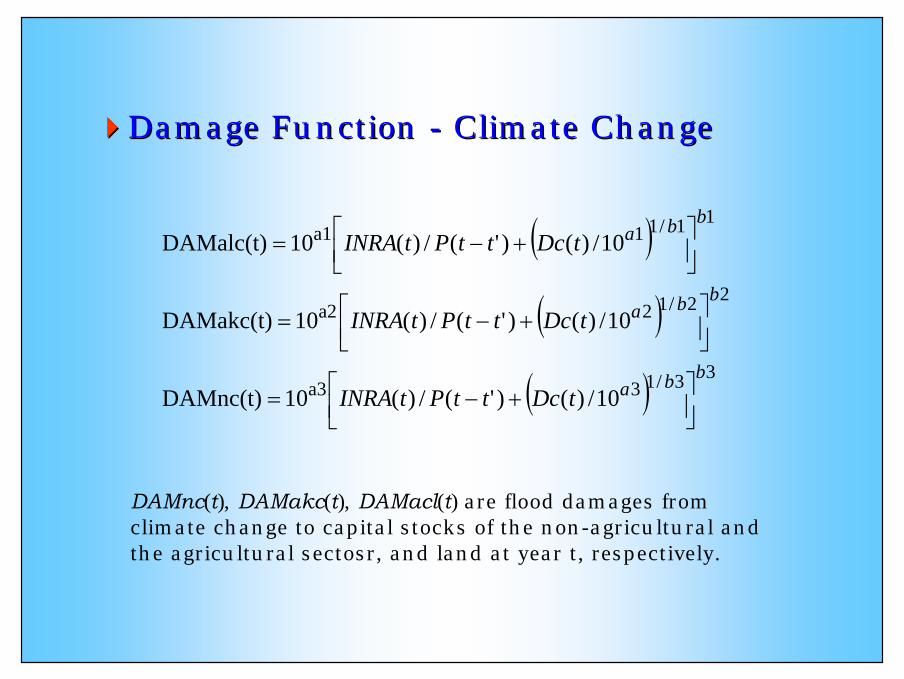
Damage Function Damage Function -- Climate ChangeClimate Change
( )
( )
( ) 33/13a3
22/12a2
11/11a1
10/)()'(/)(10DAMnc(t)
10/)()'(/)(10DAMakc(t)
10/)()'(/)(10DAMalc(t)
bba
bba
bba
tDcttPtINRA
tDcttPtINRA
tDcttPtINRA
+−=
+−=
+−=
DAMnc(t), DAMakc(t), DAMacl(t) are flood damages from climate change to capital stocks of the non-agricultural and the agricultural sectosr, and land at year t, respectively.

Annual climate change damageAnnual climate change damage
25.6)()( 2tTcDreftDc ×=
T(t) is the temperature increase in year t. Damage caused by flooding under the climate change of a 2.5oC temperature increase is assumed to be Dref, the quadratic term of temperature reflects the assumption that the damage is quadratic along with temperature increase.

Growth Rate of Technology and Total Growth Rate of Technology and Total Productivity FactorProductivity Factor
[ ][ ]
[ ][ ])(exp0)(
)(exp0)()(10)(
)(10)(
tGTnALntALntGTaALatALa
tnGTntGTn
taGTatGTat
t
×=×=
+×=
+×=−
−
ϕ
ϕ
φa(t) and φn(t) are the change rates of technology growth for theagricultural and the non-agricultural sectors, GTa(t), GTn(t), GTa0 and GTn0 are the growth rates of technolgoyof both sectors at year t and the initial year.ALa(t), ALn(t), ALa0, ALn0 are total productivity factors of agricultural and non-agricultural sector at year t and initial year
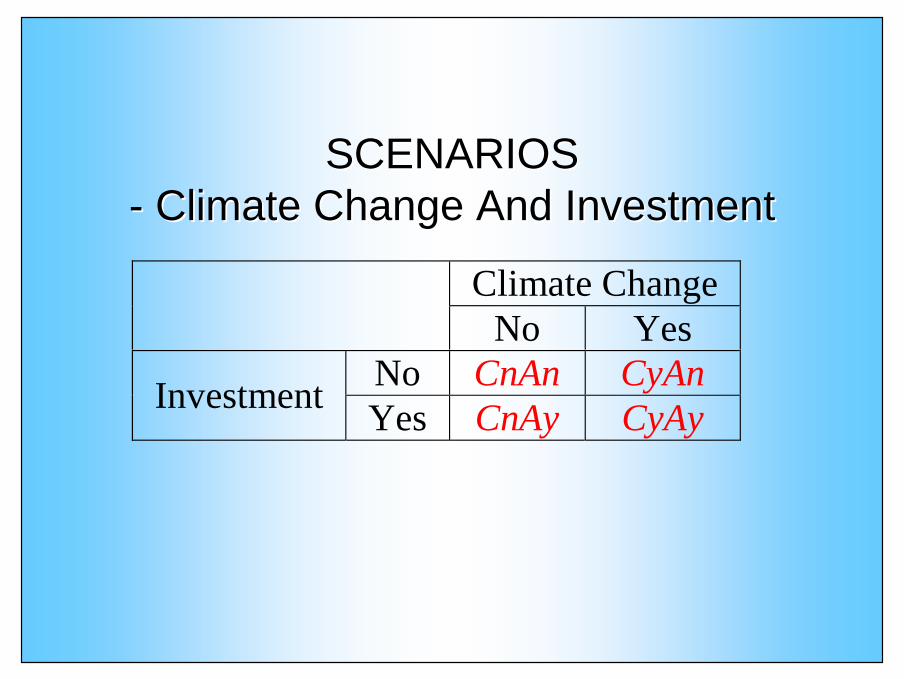
SCENARIOS SCENARIOS -- Climate Change And Investment Climate Change And Investment
Climate ChangeNo Yes
No CnAn CyAnInvestment Yes CnAy CyAy
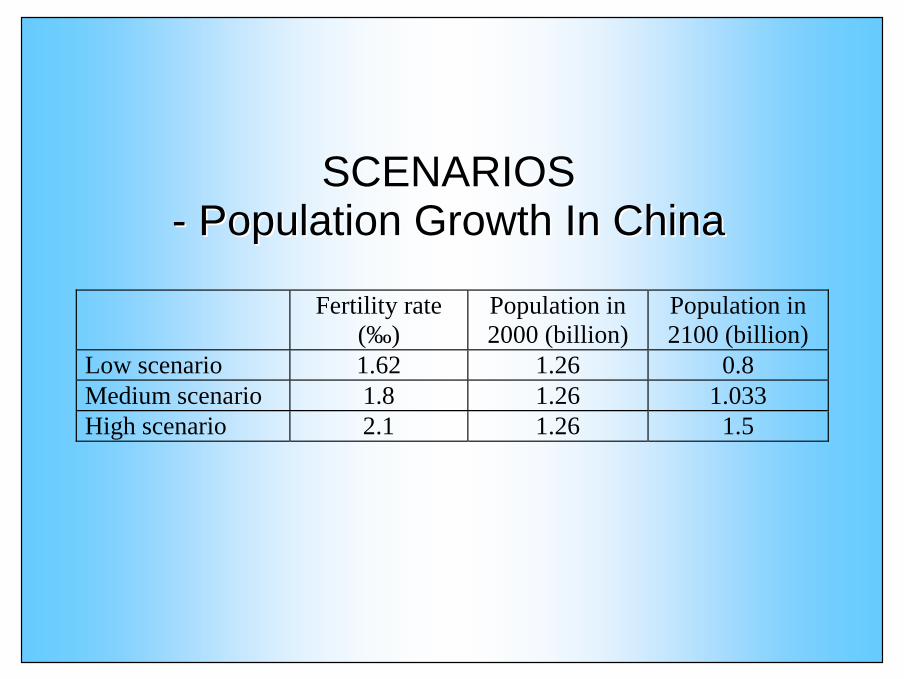
SCENARIOSSCENARIOS-- Population Growth In ChinaPopulation Growth In China
Fertility rate(‰)
Population in2000 (billion)
Population in2100 (billion)
Low scenario 1.62 1.26 0.8Medium scenario 1.8 1.26 1.033High scenario 2.1 1.26 1.5
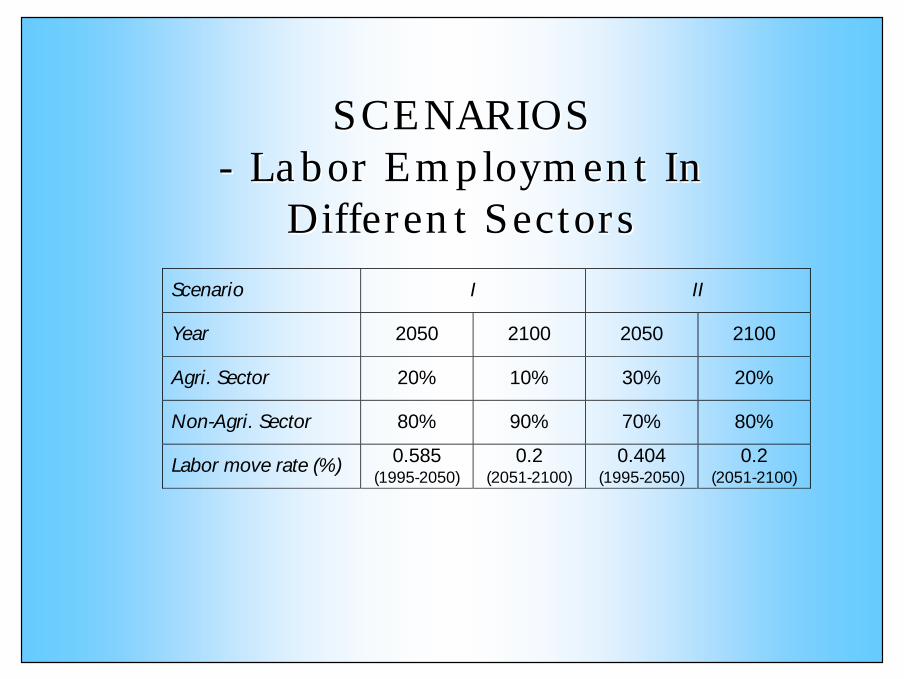
SCENARIOS SCENARIOS -- Labor Employment In Labor Employment In
Different SectorsDifferent SectorsScenario I II
Year 2050 2100 2050 2100
Agri. Sector 20% 10% 30% 20%
Non-Agri. Sector 80% 90% 70% 80%
Labor move rate (%) 0.585(1995-2050)
0.2(2051-2100)
0.404(1995-2050)
0.2(2051-2100)

Flood damage to cultivated land
BENEFIT ANALYSIS
0
0.5
1
1.5
2
2.5
3
3.519
95
2000
2005
2010
2015
2020
2025
2030
2035
2040
2045
2050
2055
2060
2065
2070
2075
2080
2085
2090
2095
2100
Year
%
CnAnCyAnCyAyCnAy

Flood Damage to capital stock of agricultural sector
BENEFIT ANALYSIS
0
0.5
1
1.5
2
2.5
3
3.5
4
4.5
1995
2000
2005
2010
2015
2020
2025
2030
2035
2040
2045
2050
2055
2060
2065
2070
2075
2080
2085
2090
2095
2100
Year
%
CnAnCyAnCyAyCnAy

Damage to capital stock of non-agricultural sector
BENEFIT ANALYSIS
0
0.5
1
1.5
2
2.5
3
3.5
4
4.5
5
1995
2000
2005
2010
2015
2020
2025
2030
2035
2040
2045
2050
2055
2060
2065
2070
2075
2080
2085
2090
2095
2100
Year
%
CnAnCyAnCyAyCnAy

GDP gain of agricultural sector
BENEFIT ANALYSIS
-0.8
-0.7
-0.6
-0.5
-0.4
-0.3
-0.2
-0.1
0
0.1
0.2
1995
2000
2005
2010
2015
2020
2025
2030
2035
2040
2045
2050
2055
2060
2065
2070
2075
2080
2085
2090
2095
2100
%CnAnCyAnCyAyCnAy
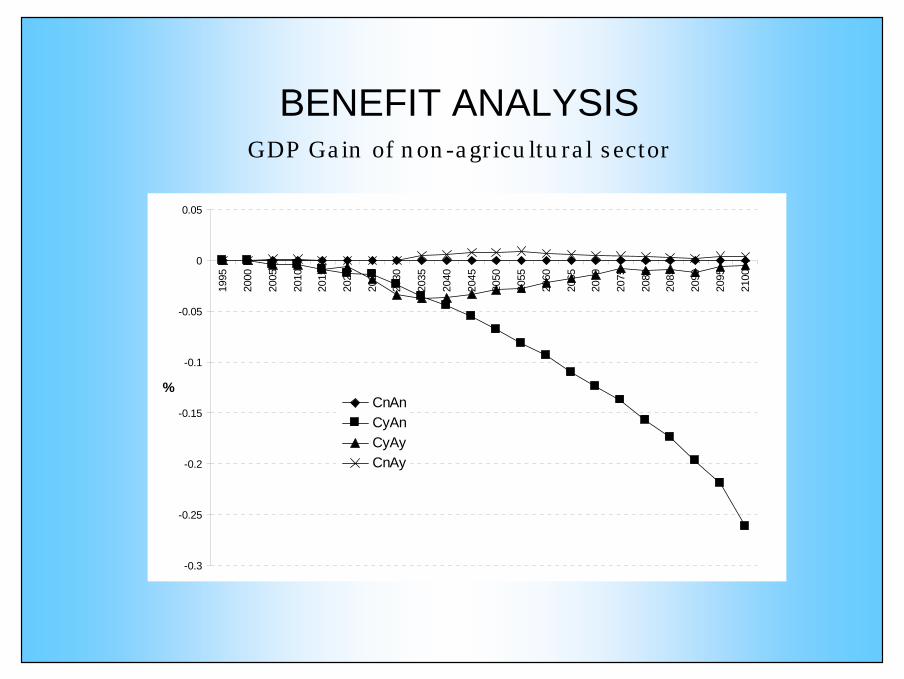
GDP Gain of non-agricultural sector
BENEFIT ANALYSIS
-0.3
-0.25
-0.2
-0.15
-0.1
-0.05
0
0.0519
95
2000
2005
2010
2015
2020
2025
2030
2035
2040
2045
2050
2055
2060
2065
2070
2075
2080
2085
2090
2095
2100
%CnAnCyAnCyAyCnAy

Consumption per capita
BENEFIT ANALYSIS
-1.20
-1.00
-0.80
-0.60
-0.40
-0.20
0.00
0.20
%
CnAnCyAnCyAyCnAy
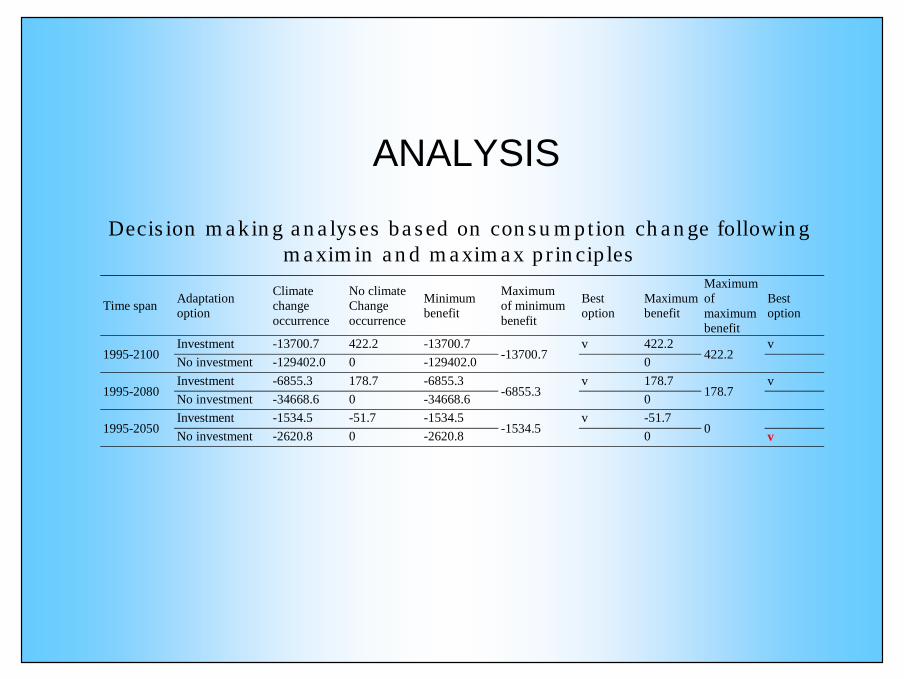
Decision making analyses based on consumption change following maximin and maximax principles
Time span Adaptationoption
Climatechangeoccurrence
No climateChangeoccurrence
Minimumbenefit
Maximumof minimumbenefit
Bestoption
Maximumbenefit
Maximumofmaximumbenefit
Bestoption
Investment -13700.7 422.2 -13700.7 v 422.2 v1995-2100 No investment -129402.0 0 -129402.0 -13700.7 0 422.2
Investment -6855.3 178.7 -6855.3 v 178.7 v1995-2080 No investment -34668.6 0 -34668.6 -6855.3 0 178.7
Investment -1534.5 -51.7 -1534.5 v -51.71995-2050 No investment -2620.8 0 -2620.8 -1534.5 0 0 v
ANALYSIS

Decision making analyses based on consumption change following minimax regret principles
Regret value
Time span Adaptationoption Climate change
occurrenceNo climatechange occurrence
Maximumregretvalue
Minimumofmaximumregretvalue
Bestoption
Investment 0 0 0 v1995-2100 No investment 115701.3 422.2 115701.3 0
Investment 0 0 0 v1995-2080 No investment 27813.3 178.7 27813.3 0
Investment 0 51.7 51.7 v
Consumption
1995-2050 No investment 1086.3 0 1086.3 51.7

ConclusionConclusion
Investments optimized ignoring climate change will cause severe damage starting about 2020 when climate change happens. Flood damage from climate change can be effectively mitigated by optimizing investment considering both climate variability and climate change.

GDP of the agricultural and non-agricultural sectors gains in scenario CnAy when investment considers both climate change and climate variability, even if climate change does not occur

The results show that investment against projected climate change is the best option, whether climate change occurs or not. Uncertainty about climate change should not be an obstacle to formulating an adaptation policy to offset the negative impact of climate change, i.e., floods in this paper. Investment in social infrastructure not only adds adaptive capacity against the impact of future climate change but also improves current society.

The model also is run to test its validity under various combinations of different scenarios of population growth, labor employment in both sectors, and marginal adaptation costs to climate change (increased by 10%, 20% and 30% compared with that to climate variability). The same conclusions can be reached for changes in patterns of GDP and consumption. Investment to mitigate projected climate change is still the best option whether climate change occurs or not.
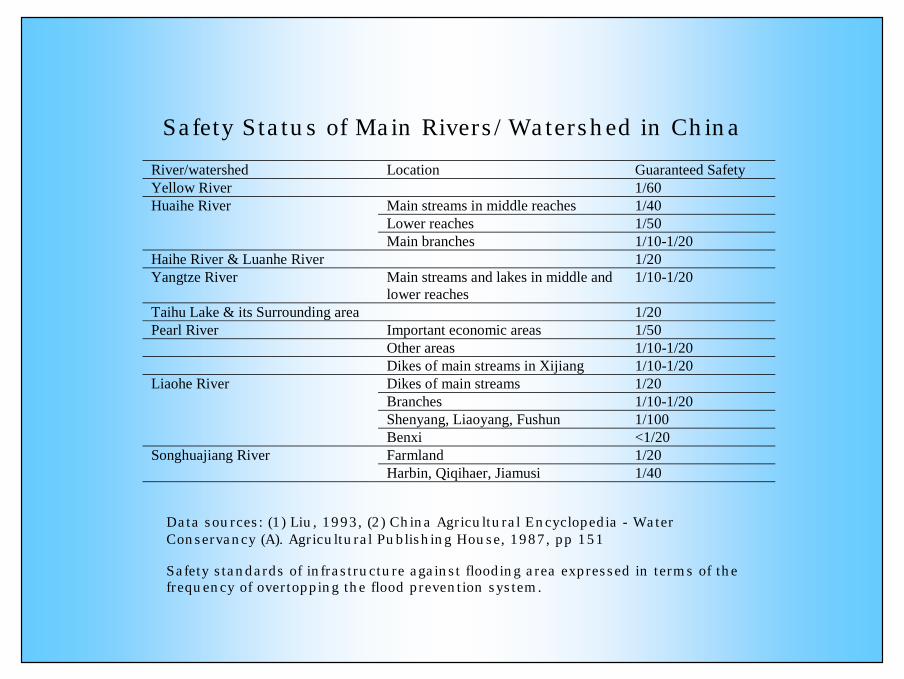
Safety Status of Main Rivers/Watershed in China
River/watershed Location Guaranteed SafetyYellow River 1/60
Main streams in middle reaches 1/40Lower reaches 1/50
Huaihe River
Main branches 1/10-1/20Haihe River & Luanhe River 1/20Yangtze River Main streams and lakes in middle and
lower reaches1/10-1/20
Taihu Lake & its Surrounding area 1/20Pearl River Important economic areas 1/50
Other areas 1/10-1/20Dikes of main streams in Xijiang 1/10-1/20Dikes of main streams 1/20Branches 1/10-1/20Shenyang, Liaoyang, Fushun 1/100
Liaohe River
Benxi <1/20Farmland 1/20Songhuajiang RiverHarbin, Qiqihaer, Jiamusi 1/40
Data sources: (1) Liu, 1993, (2) China Agricultural Encyclopedia - Water Conservancy (A). Agricultural Publishing House, 1987, pp 151
Safety standards of infrastructure against flooding area expressed in terms of the frequency of overtopping the flood prevention system.
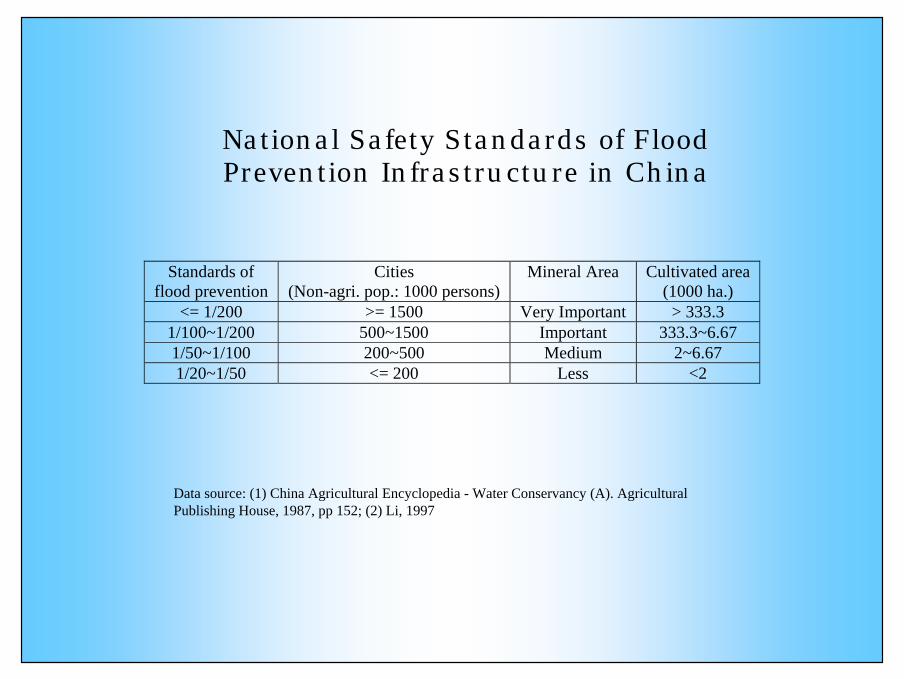
National Safety Standards of Flood Prevention Infrastructure in China
Standards offlood prevention
Cities(Non-agri. pop.: 1000 persons)
Mineral Area Cultivated area(1000 ha.)
<= 1/200 >= 1500 Very Important > 333.31/100~1/200 500~1500 Important 333.3~6.671/50~1/100 200~500 Medium 2~6.671/20~1/50 <= 200 Less <2
Data source: (1) China Agricultural Encyclopedia - Water Conservancy (A). Agricultural Publishing House, 1987, pp 152; (2) Li, 1997

Flood Damage in China
YearTotal damage from
natural disasters(billion Yuan)
Flood damage(billion Yuan)
Flood damage tototal damage (%)
Percentageequivalent to
GDP1990 61.6 24.0 39.0 1.31991 121.6 77.9 64.1 3.61992 85.4 41.3 48.4 1.51993 99.3 64.2 64.7 1.91994 187.6 179.7 95.8 3.91995 186.3 165.3 88.7 2.91996 288.2 220.8 76.6 3.31997 197.5 93 47.1 1.31998 307.2 225.1 73.3 2.9Mean 66.4 2.5
Data source: (1) Outline on water resources statistics (1949-1998). Dept. of Planning and Programming, Ministry of Water Resources, PRC. Internal Report. (2) Zhang et al., 2000, pp 79. (3) China Disaster Reduction, (1991~1999).