adaptation to change donal t. manahan professor of biological sciences university of southern...
TRANSCRIPT
Adaptation to Change
Donal T. ManahanProfessor of Biological Sciences
University of Southern California
Adaptation to Change
Genotype plus Environment = Phenotype
Genetics = Change over longer timePhysiology = Change over short time
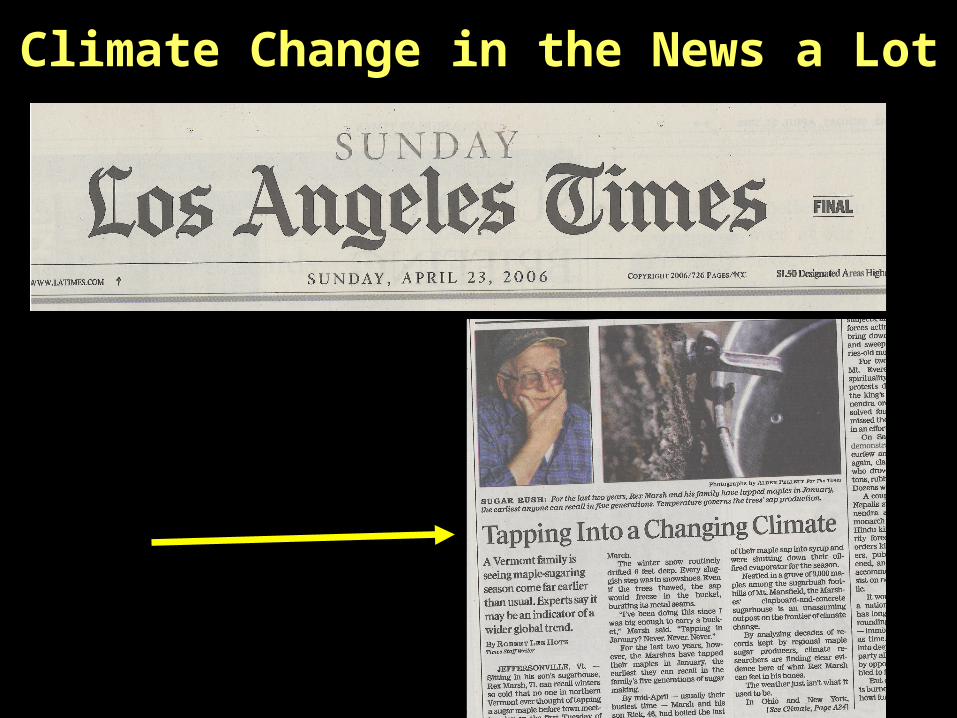
Climate Change in the News a Lot

Comprehensive study of ~400 taxa, from 1958 to 2002.(>115,000 samples)
Sir Alister Hardy Foundation for Ocean Science, The Laboratory, Citadel Hill, Plymouth, UK
Impact of climate change on marine pelagic phenology and trophic mismatch. Edwards, M. and A.J. Richardson, 2004. Nature, 430: 881.
Climate impact on plankton ecosystems in the Northeast Atlantic. Richardson, A.J. and D.S. Schoeman, 2004. Science, 305: 1609.
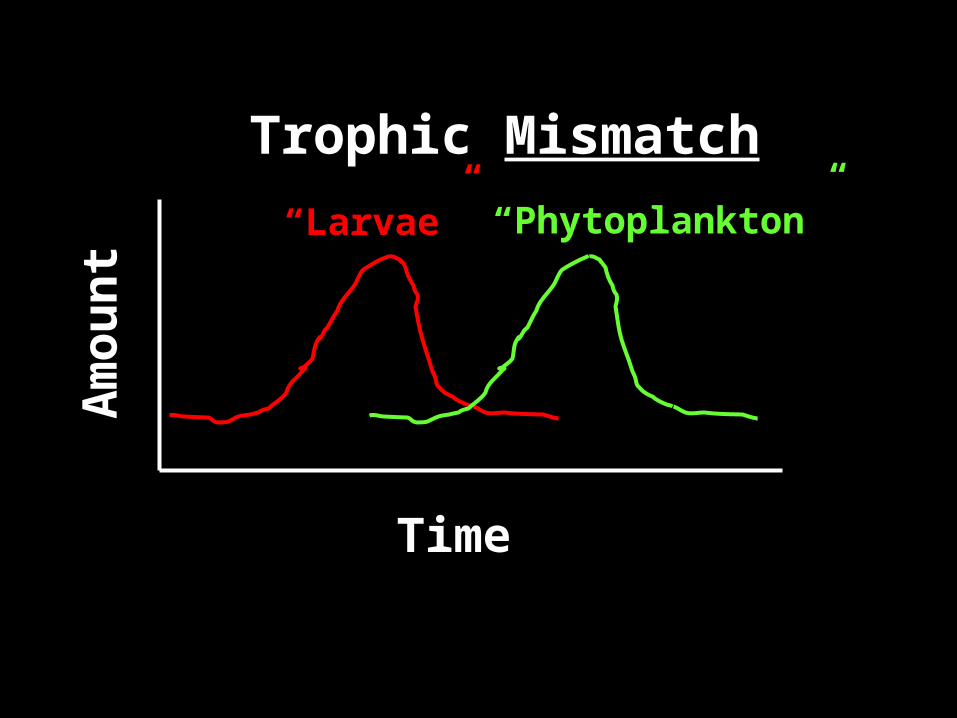
Warming of oceans: life history and trophic mismatch

Time
Am
oun
tTrophic Match
“Plant” “Animal”
Time
Am
oun
tTrophic Mismatch
“Phytoplankton”“Larvae”
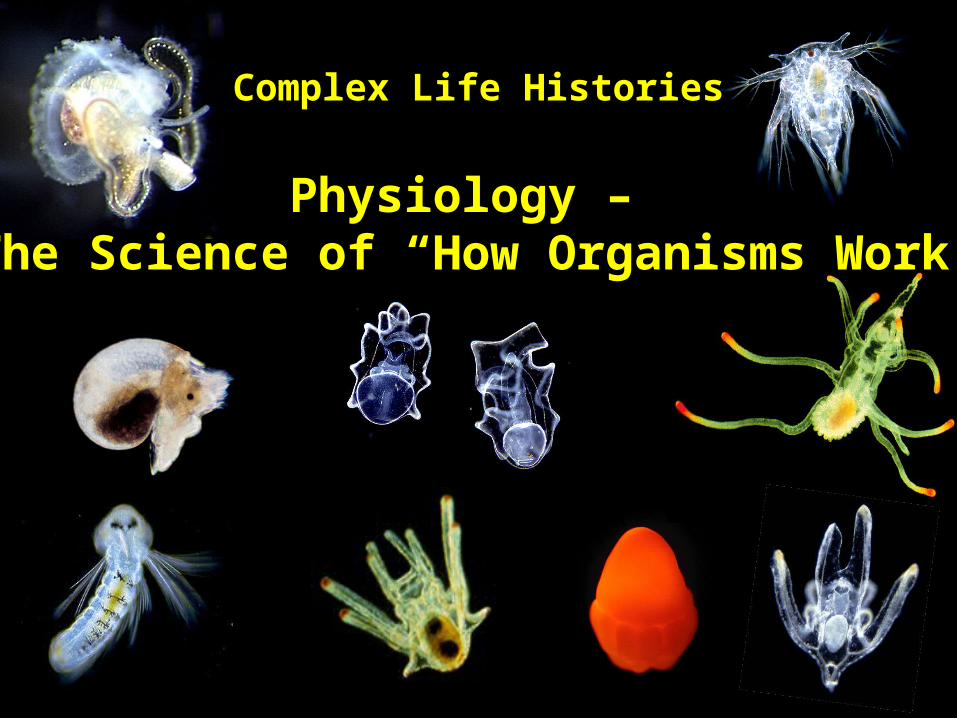
Physiology – The Science of “How Organisms Work”
Complex Life Histories

The Larval Biology “Black Box” Food limitation, predation, transport, dispersal etc.
EggsRecruitment
<<1%Larval
Mortality

Phenotype(Variation in Survival and Growth)
Genetic Crosses
Genomics Physiology
Complex Traits:Life Span
Feeding, MetabolismMeasure & Predict?
Themes for Today’s Presentation
0 5 10 15 20
2 & 3
2 & 5
3 & 5
1 & 3
1 & 5
3 & 5
2 & 5
2 & 6
5 & 6
2 & 3
2 & 5
3 & 5
Growth rate (µm day-1)
Lar
val f
amili
es c
ross
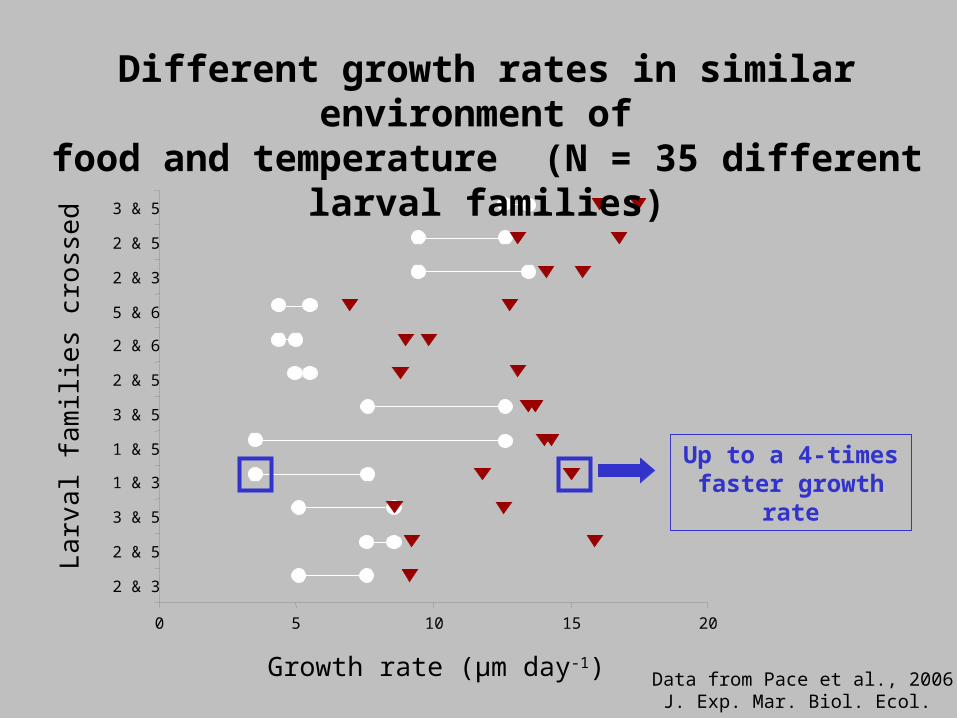
edDifferent growth rates in similar environment of
food and temperature (N = 35 different larval families)
Up to a 4-times faster growth rate
Data from Pace et al., 2006J. Exp. Mar. Biol. Ecol.
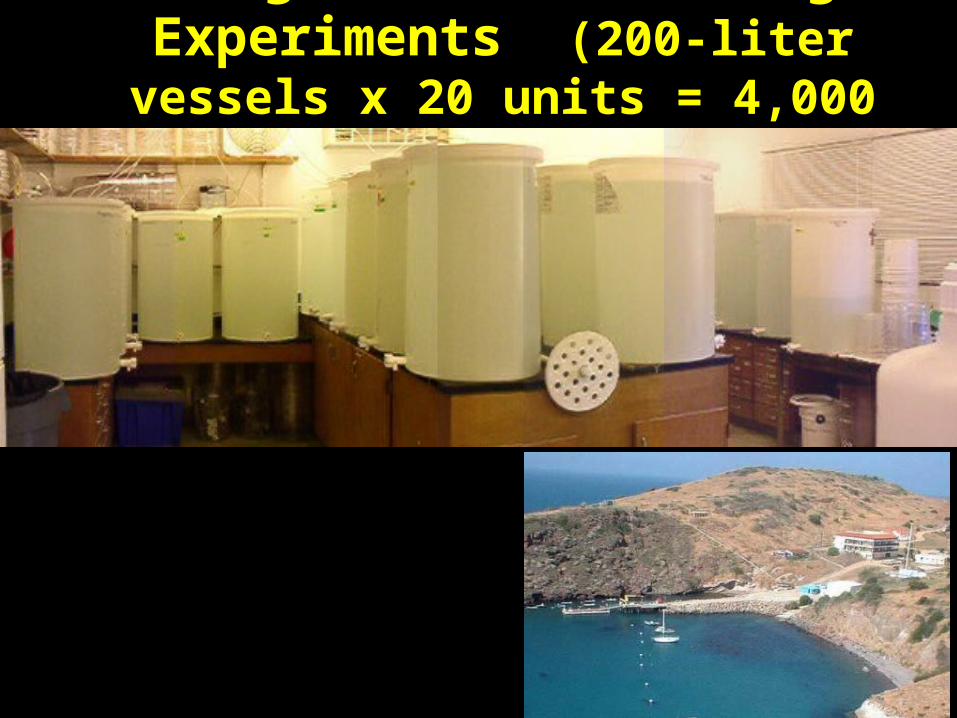
Large-scale Culturing Experiments (200-liter vessels x 20 units = 4,000 liters)
~2 million individuals of same larval family
per culture vessel
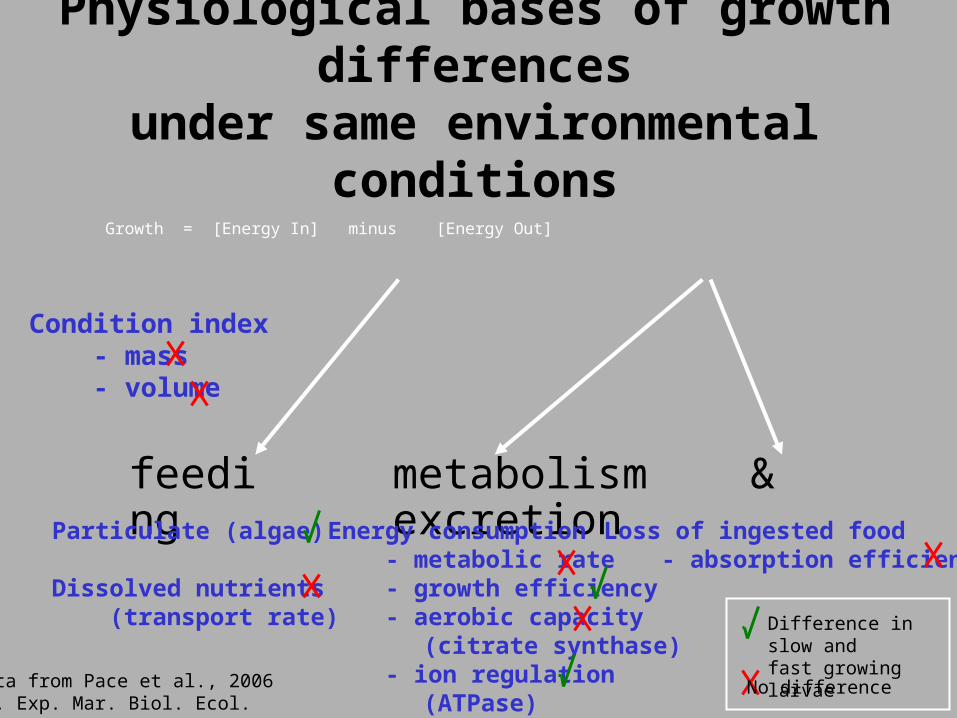
Physiological bases of growth differencesunder same environmental conditions
Growth = [Energy In] minus [Energy Out]
feeding metabolism & excretionParticulate (algae)
Dissolved nutrients (transport rate)
Energy consumption - metabolic rate - growth efficiency - aerobic capacity
(citrate synthase) - ion regulation
(ATPase)
Loss of ingested food - absorption efficiency
Difference in slow andfast growing larvae
No difference
Condition index - mass - volume
Data from Pace et al., 2006J. Exp. Mar. Biol. Ecol.
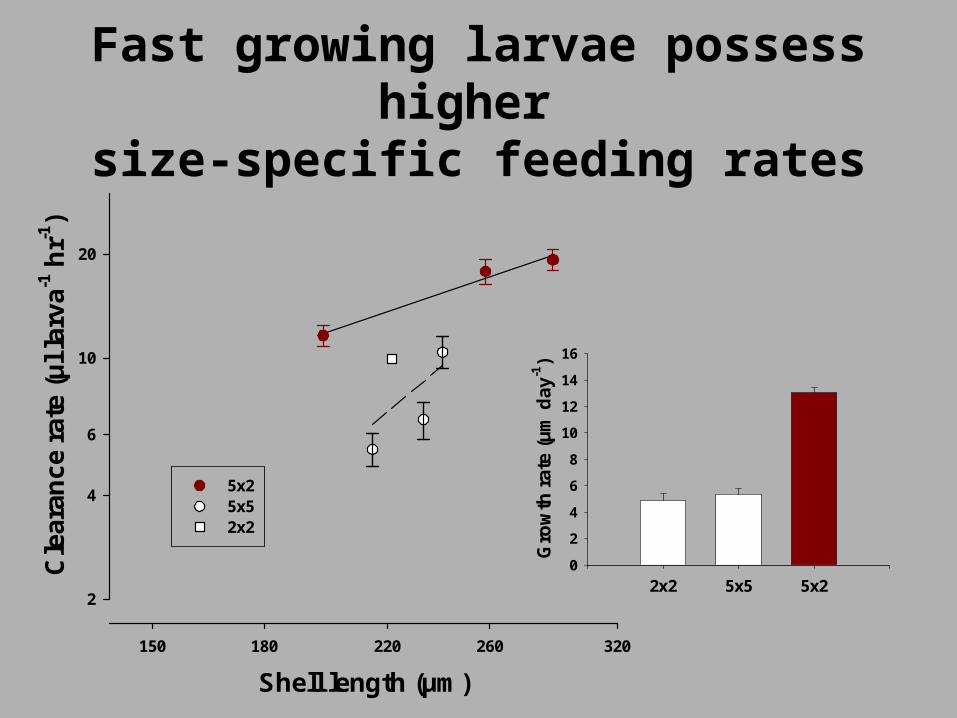
Fast growing larvae possess higher size-specific feeding rates
Shell length (µm)
150 180 220 260 320
Cle
aran
ce r
ate
(µl l
arva
-1 h
r-1)
2
4
6
10
20
5x25x52x2
2x2 5x5 5x2
Gro
wth
rat
e (µ
m d
ay-1
)0
2
4
6
8
10
12
14
16
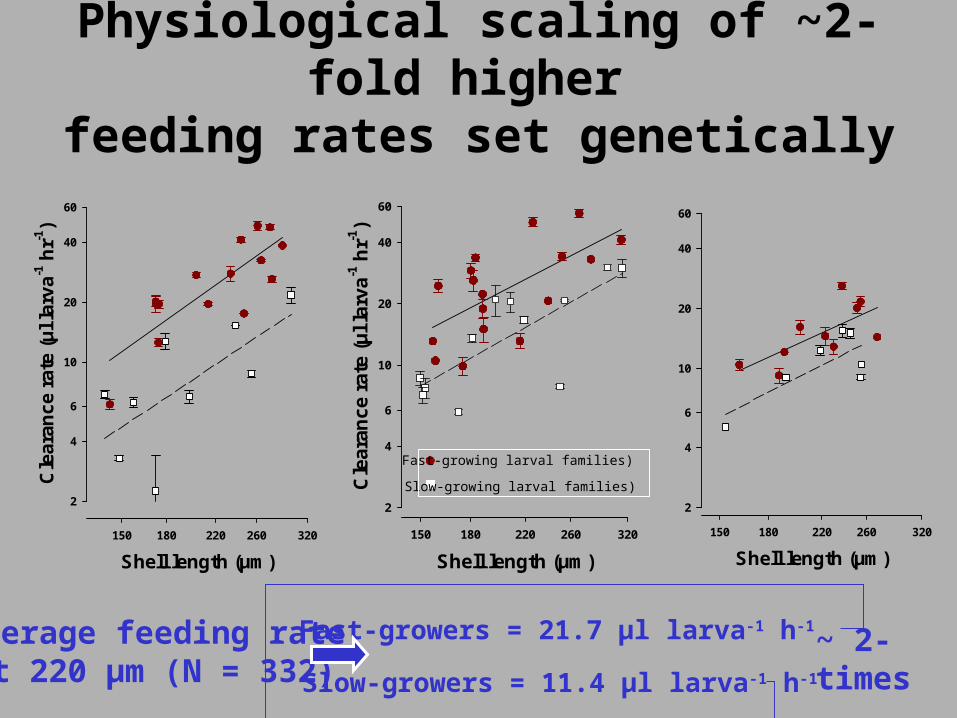
Physiological scaling of ~2-fold higher feeding rates set genetically
Shell length (µm)
150 180 220 260 320
2
4
6
10
20
40
60
Shell length (µm)
150 180 220 260 320
Cle
aran
ce r
ate
(µl l
arva
-1 h
r-1)
2
4
6
10
20
40
60
Fast-growing larval families)
Slow-growing larval families)
Shell length (µm)
150 180 220 260 320
Cle
ara
nce
ra
te (
µl l
arva
-1 h
r-1)
2
4
6
10
20
40
60
Average feeding rate at 220 µm (N = 332)
Fast-growers = 21.7 µl larva-1 h-1
Slow-growers = 11.4 µl larva-1 h-1
~ 2-times faster

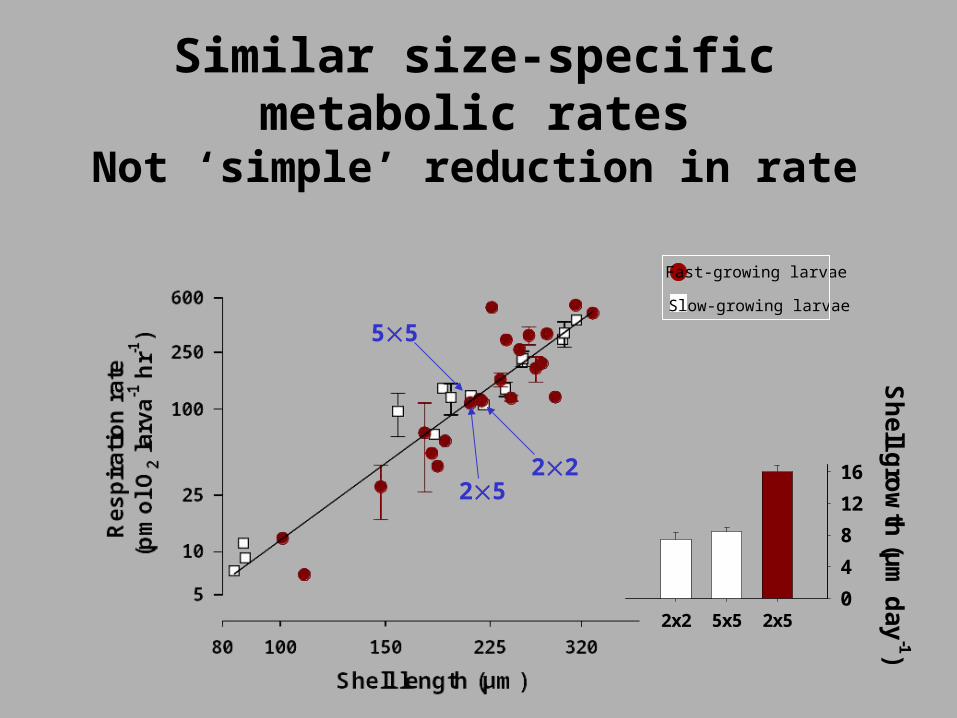
Similar size-specific metabolic ratesNot ‘simple’ reduction in rate
53
3533
3x3 5x3 3x5
Sh
ell gro
wth
(µm
day
-1)
0
4
8
12
16
Fast-growing larvae
Slow-growing larvae
2522
55
2x2 5x5 2x5
Sh
ell gro
wth
(µm
day
-1)
0
4
8
12
16
Fast-growing larvae
Slow-growing larvae
Similar size-specific metabolic ratesNot ‘simple’ reduction in rate
Physiological regulation of differential growth rates
1. Feeding: ~ 50% of growth rate variation
2. Metabolic regulation: Not total metabolic rate, but differential energy allocation efficiency (mechanism?)

The high cost of growth (protein)
Age (days)
4 6 8 10 12 14 16 18
ng
pro
tein
day
-1
0
50
100
150
200
250
Protein growth
Age (days)
4 6 8 10 12 14 16 18
ng
pro
tein
day
-1
0
50
100
150
200
250
Protein synthesis
Age (days)
4 6 8 10 12 14 16 18
ng
pro
tein
day
-1
0
50
100
150
200
250
Protein degradation
From Pace and Manahan, 2006J. Exp. Biol.
(sea urchin larvae)
Fed larva percent metabolism
Protein synthesis
75%
38 ng protein day-1

Shell length (µm)
150 180 220 260 320
Cle
aran
ce r
ate
(µl l
arva
-1 h
r-1)
2
4
6
10
20
40
60
Feeding rate
How to grow faster in the same environment?
50%
50%Metabolism: Protein depositional efficiency
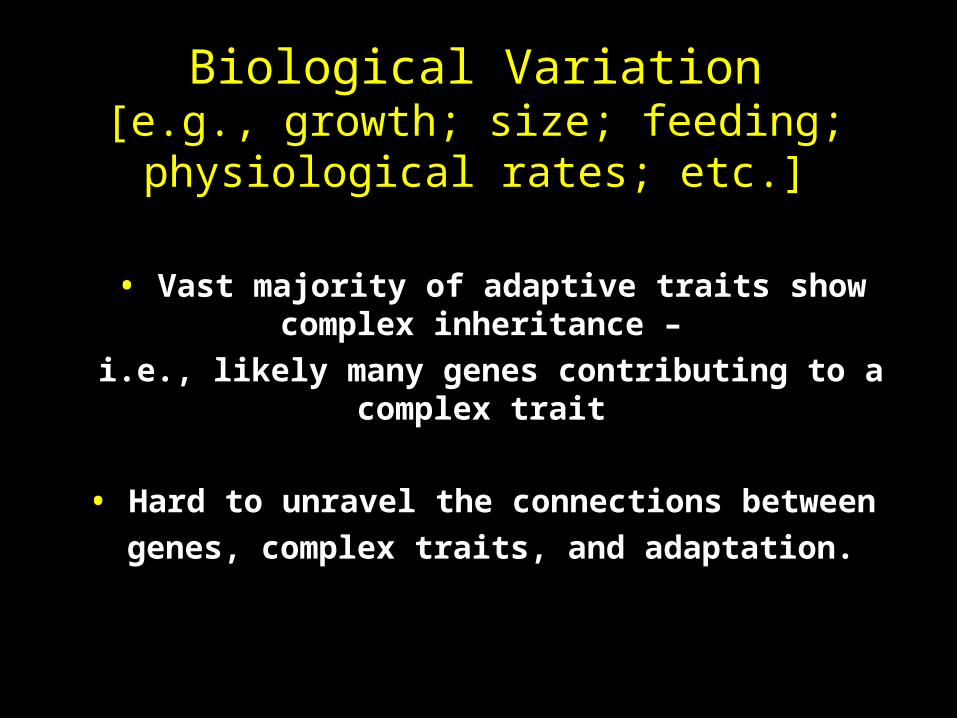
Biological Variation[e.g., growth; size; feeding; physiological rates; etc.]
• Vast majority of adaptive traits show complex inheritance –
i.e., likely many genes contributing to a complex trait
• Hard to unravel the connections between
genes, complex traits, and adaptation.
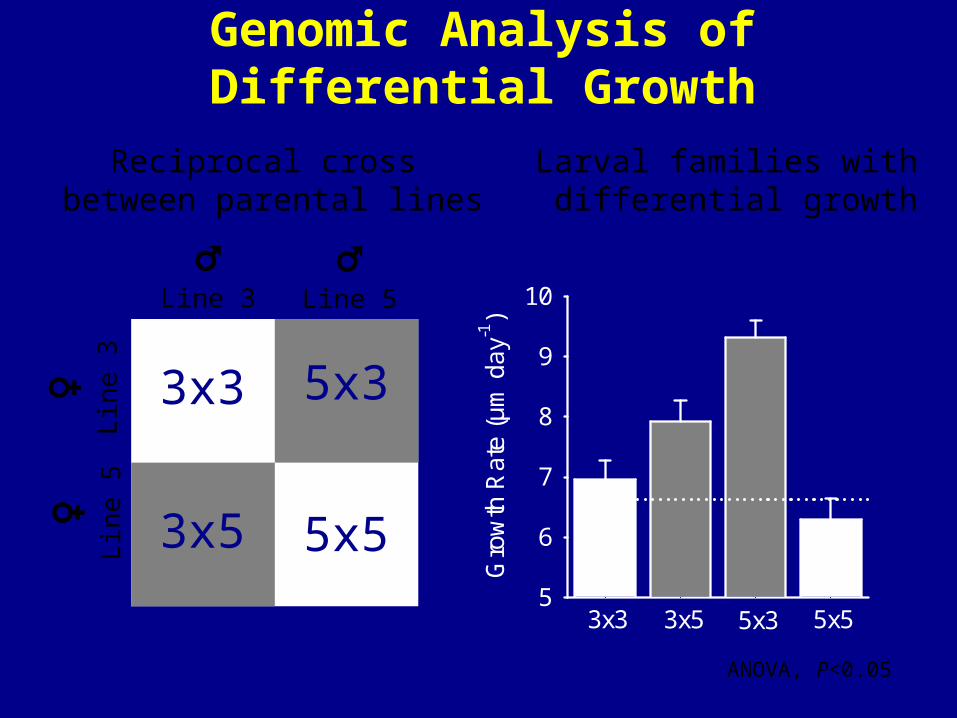
Genomic Analysis of Differential Growth
♂Line 3
♀Li
ne 5
♂Line 5
♀Li
ne 3
3x3 5x3
3x5 5x5
Reciprocal cross between parental lines
Larval families with differential growth
ANOVA, P<0.05
Gro
wth
Rat
e (µ
m d
ay-1
)
5
6
7
8
9
10
3x3 3x5 5x3 5x5

Transcriptome analysis
‘Slow-growthgenes’
‘Fast-growthgenes’
Sharedgenes
cDNAs cloned on beads
(MegaCloneTM)
Sequences read & counted
(MPSS: Massively ParallelSignature SequencingTM)
Slow-growing Fast-growing
Advantages of MPSS:
High sensitivity ( 3 tpm.)No a priori sequence neededGene ID by ‘signature sequence’
Brenner et al, 2000 Nature Biotech. 18:630
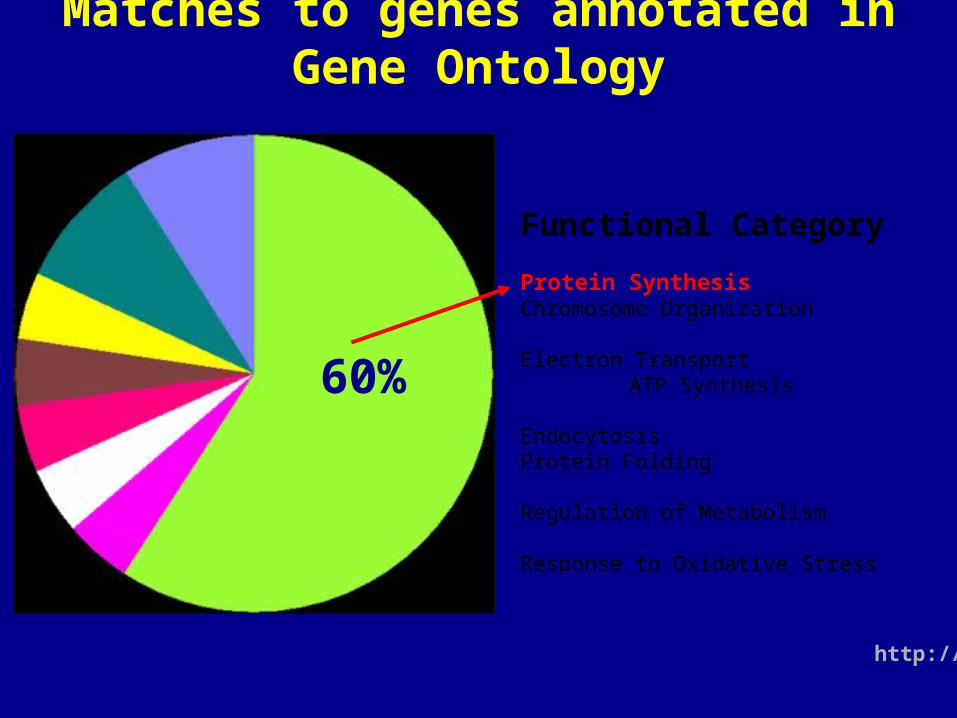
Matches to genes annotated in Gene Ontology
Its more than environment, and its more than simple additive genetics
Functional Category
Protein SynthesisChromosome OrganizationElectron Transport
ATP Synthesis
EndocytosisProtein FoldingRegulation of MetabolismResponse to Oxidative Stress
62%
http://www.GeneOntology.org/
60%
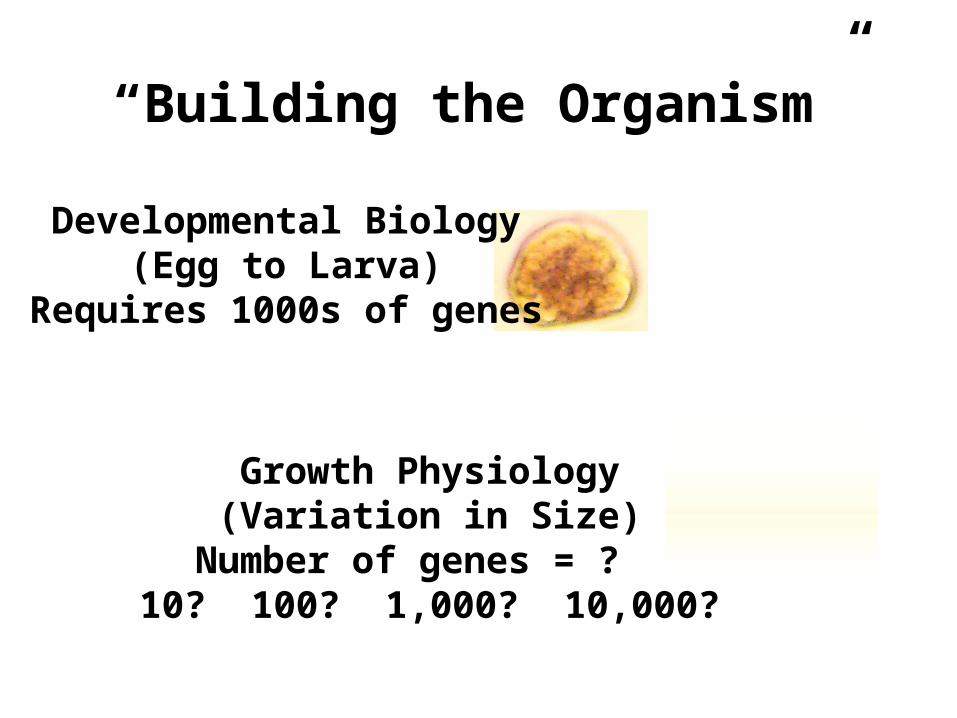
“Building the Organism”
Growth Physiology(Variation in Size)
Number of genes = ? 10? 100? 1,000? 10,000?
Developmental Biology(Egg to Larva)
Requires 1000s of genes

Highly complex metabolismWhat to measure? How to predict?
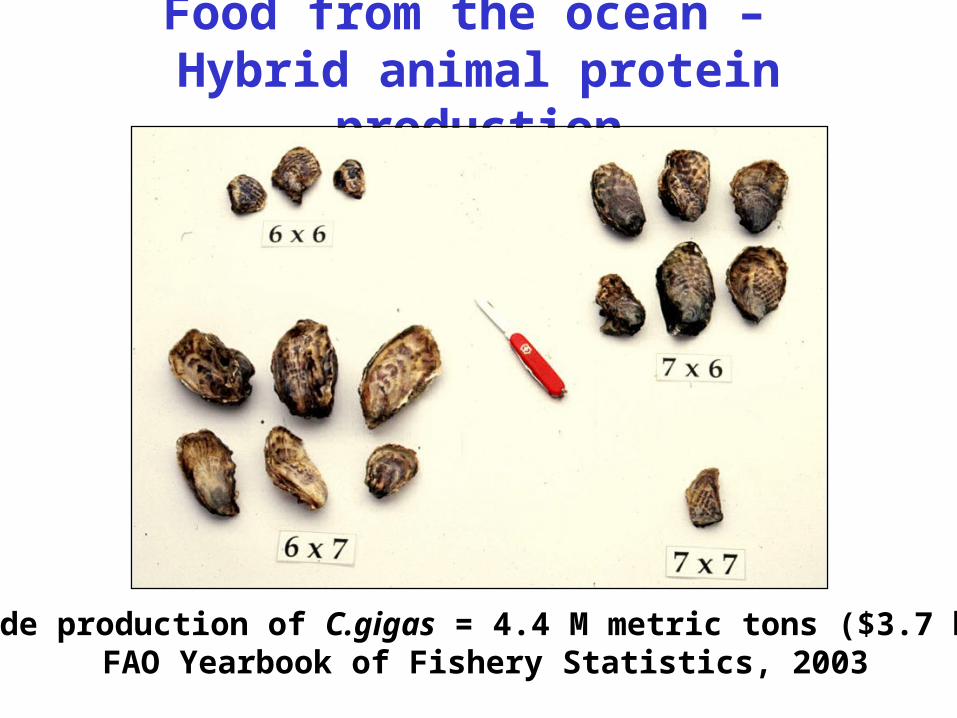
Food from the ocean – Hybrid animal protein production
Worldwide production of C.gigas = 4.4 M metric tons ($3.7 billion)FAO Yearbook of Fishery Statistics, 2003

Phenotype(Variation in Survival and Growth)
Genomics Physiology
Physiological Genomics
Define mechanisms of growth and survival based on known Phenotypic Contrasts

Recruitment: Population Connectivity and Dynamics, Species Management …
RECRUITMENT BIOLOGY
Ecology, Evolution
Physiology, Biochemistry
Cellular, Molecular
Chemical EnvironmentNutritional; chemo-sensory
Physical EnvironmentCurrents; hydrography