ad-hoc audit of the pilot phase of the europe 2020 project...
TRANSCRIPT

Ad-hoc audit of the pilot phase of the Europe 2020
Project Bond Initiative
Final Report
17 June 2014
Reliance Restricted
Tristan Dhondt
Partner
Transaction Advisory Services
T +32 2 774 60 17
M +32 497 480 486
F +32 2 774 94 64
Anton Krawchenko
Director
Franz Traxler
Senior Manager
Transaction Advisory Services Transaction Advisory Services
T +44 20 7951 6395 T +32 2 774 63 10
M +44 776 987 2450 M +32 497 597 076
F +44 20 7951 1345 F +32 2 774 94 64

Contents
ii
Reliance Restricted
Final
Executive Summary 4
1. Executive Summary 5
Introduction 11
2. Objectives and scope of the ad-hoc audit 12
3. Ad-hoc audit methodology 13
Answers to the ad-hoc audit questions 15
4. Effectiveness 16
5. Efficiency 21
6. EU added value 24
7. Additionality 26
Conclusions and recommendations 29
8. Conclusions and recommendations 30
Appendix A: Overview of the infrastructure market 32
9. Global market trends 33
10. European market trends 37
11. Financing trends 40
12. Sector focus 47
13. Regulatory impacts 52
14. EU financial instruments 55
Appendix B: Project Bond Initiative 57
15. General description 58
16. Evaluation of pilot phase 60
17. Continuation of the Project Bond Initiative in the Connecting Europe Facility 63
Appendix C: Case studies 66
18. Introduction 67
19. N33 highway 68
20. A1/A6 motorway 69
21. Zaanstad prison 71
22. University of Hertfordshire student accommodation 73
23. Holyrood student accommodation 75
24. Pendleton Together Housing 77
25. L2 ring road 79
26. Mersin International Port 81
27. Case Study : Canada 83

Contents
iii
Reliance Restricted
Final
Appendix D: Stakeholder interviews 85
28. Key findings from stakeholder interviews 86
Appendix E 93
29. Ad-hoc audit question evaluation framework 94
Appendix F 98
30. Bibliography 99
Appendix G 102
31. Abbreviations 103
Appendix H 106
32. Stakeholders' Interview Guide 107

4 Reliance Restricted Final
1. Executive Summary
Executive Summary
Executive Summary Executive Summary
Executive Summary
5 Reliance Restricted Final
Infrastructure in Europe – A basic element for economic growth
The availability of well-functioning infrastructure networks is an important element of sustainable economic growth. In the connected global economy where cities, countries and regions are competing for business and investment, the quality of infrastructure can be a differentiating factor. Well-functioning transport networks support commerce and trade; developed energy interconnections create market opportunities and increase competition; advanced communications networks are an important input to the knowledge economy; etc. Superior and well-maintained infrastructure attracts the best talent as well as dynamic businesses seeking reliable connectivity and a high quality of life for workers. At the same time, many developed economies, such as the European Union, are struggling with how to repair or refashion once-advanced, but now increasingly outmoded, infrastructure. A real and growing challenge in the face of limited funding capacity. New technologies and urban planning strategies are key for improved returns on infrastructure investment in developed markets. The choices Europe makes to upgrade its infrastructure will be a determining factor for its competitiveness versus other world regions.
Declining investment in European infrastructure
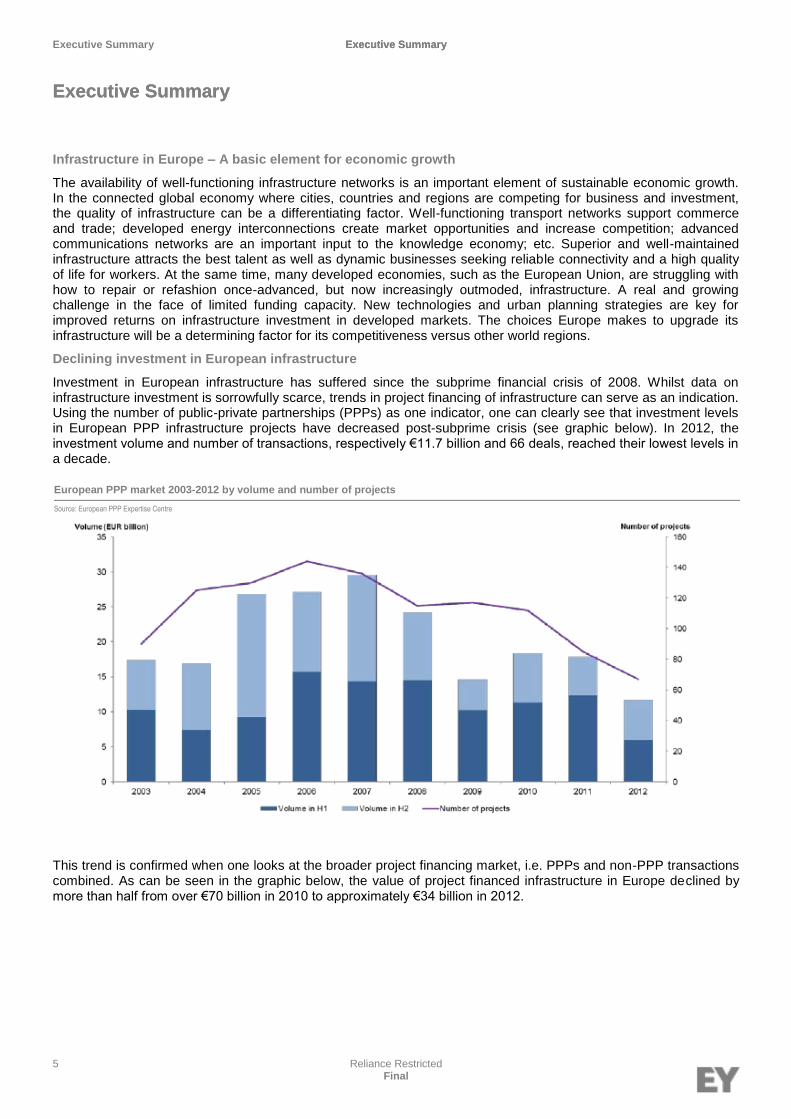
Investment in European infrastructure has suffered since the subprime financial crisis of 2008. Whilst data on infrastructure investment is sorrowfully scarce, trends in project financing of infrastructure can serve as an indication. Using the number of public-private partnerships (PPPs) as one indicator, one can clearly see that investment levels in European PPP infrastructure projects have decreased post-subprime crisis (see graphic below). In 2012, the investment volume and number of transactions, respectively €11.7 billion and 66 deals, reached their lowest levels in a decade.
This trend is confirmed when one looks at the broader project financing market, i.e. PPPs and non-PPP transactions combined. As can be seen in the graphic below, the value of project financed infrastructure in Europe declined by more than half from over €70 billion in 2010 to approximately €34 billion in 2012.
Executive Summary
Executive Summary
European PPP market 2003-2012 by volume and number of projects
Source: European PPP Expertise Centre

Executive Summary Executive Summary
Executive Summary
6 Reliance Restricted Final
The decline in infrastructure investment can be notably traced back inter alia to the following factors:
► A decrease in public sector investment due to unsustainable sovereign debt levels and measures for fiscal discipline;
► The tightening of the European credit markets in the wake of the global financial crisis and a long term (structural) shift in the attractiveness of project loans due to tighter prudential requirements (e.g. Basel 3); and
► A near standstill in economic growth in Europe due to the global economic slowdown, a decline in private sector investment (partially due to the tightened availability of credit), higher unemployment and decreased consumer spending.
The European Commission (EC) estimates that around €970 billion in investment (public and private combined) in trans-European networks will be necessary to meet its 2020 objectives. This implies an annual run-rate of approximately €140 billion per year.
Banks have stepped back from the project finance market
Infrastructure projects are often highly levered, due to the tangible nature of the underlying assets and the relatively stable cash flows they generate. Furthermore, the long lifecycle of infrastructure projects as well as the modest returns most generate make the use of debt financing even more imperative. Short-term financing solutions are not conducive to infrastructure projects, because they require the projects to generate higher cash flows (particularly in the early operational years) and/or impose a refinancing moment in the life of the project on the project sponsors or procuring authorities. Nonetheless, many banks in the European market have retreated from the long-term maturity market, as the Eurozone credit crisis has forced them to better match assets and liabilities and shore up their capital ratios. Some banks have even closed their project financing departments and/or sold their project finance portfolios.
At the same time, another group of investors continue to look for long-term assets to match their long-term liabilities. Pension funds, life insurance companies and sovereign wealth funds are looking for ways to diversify their investment portfolios and pick up additional yield versus government bonds. It is estimated that these institutional investors have around €14 trillion in assets in Europe, of which only a minor amount have been oriented towards infrastructure investments. For example, the infrastructure asset class is estimated to account for only 1-3% of pension funds’ total assets under management.
Since the involvement of a pension fund in the debt financing of the Dutch N33 PPP highway project in November 2012, a number of deals have been closed by accessing this relatively untapped source of long-term financing. The outcomes of the deals are demonstrative of the potential liquidity with this group of investors. Previously held notions about the expectations of this investor class, e.g. minimum A- rating, no construction risk exposure, no commercial risk, etc., have been overcome through innovate financial structures and different forms of credit enhancement as well as the desire for these investors - particularly the larger, sophisticated ones - to pick up additional yield. A number of deals have been structured to issue debt to pension funds and insurance companies in public issues and
Project finance infrastructure Europe
Source: Infrastructure Journal
72.6%
75.7% 84.7%
85.7%
30.9% (25.0%)
(35.2%)
0
50
100
150
200
250
300
350
400
0
10
20
30
40
50
60
70
80
2009 2010 2011 2012
Num
ber o
f dea
ls
Cur
renc
y: €
billi
on
Debt value Total deal value Deal count

Executive Summary Executive Summary
Executive Summary
7 Reliance Restricted Final
private placements. Whilst these deals have been small, i.e. less than €200 million investment value, they are setting precedents in the infrastructure financing market that can be replicated on larger projects.
The EU’s response
In the face of the investment and financing trough for infrastructure in Europe, the EU has agreed on a large package of public support for trans-European network projects. The European Parliament and European Council have agreed to allocate €33.3 billion of the EU budget to the Connecting Europe Facility (CEF) under the 2014-2020 Multi-annual Financial Framework (MFF). According the regulation establishing the CEF:
“[it] shall enable projects of common interest to be prepared and implemented within the framework of the trans- European networks policy in the sectors of transport, telecommunications and energy. It shall give priority to missing links in the transport sector. The CEF shall also contribute to supporting projects with a European added value and significant societal benefits which do not receive adequate financing from the market.”
Furthermore, the allocation of the CEF per sector according to the legislative text is €26.3 billion for transport1, €5.9
billion for energy, and €1.1 billion for telecommunications. As stated above, the objective of the CEF is to finance projects which fill the missing links in Europe's energy, transport and digital backbone. By focusing on smart, sustainable and fully interconnected transport, energy and digital networks, the Connecting Europe Facility is intended to help complete the European single market.
Initially, 10% (up to 20% if certain conditions are fulfilled) of the CEF budget will be available for financial instruments. The rationale for using financial instruments is the higher ‘multiplier effect’ that they can have versus pure grant funding. The multiplier effect is defined by the amount private finance that can be supported through the use public funds, notably through the implementation of financial instruments.
Why the EU 2020 Project Bond Initiative (PBI)?
The PBI is an initiative from the EU that has been in development since the financial crisis. The underlying idea of the PBI is to create a financial instrument that will facilitate debt capital market financing of infrastructure projects (“project bonds”) in the areas of trans-European transport networks (TEN-T), trans-European energy networks (TEN-E), ICT and broadband, thereby expanding the financing options for these projects. The financial instrument that has been jointly developed with the EIB, the Project Bond Credit Enhancement (PBCE) facility, is a subordinated instrument that supports senior project bonds issued by infrastructure project companies. The subordinated tranche functions as a protective layer to the senior tranche, thereby enhancing the credit rating of the bonds issued by the project companies. It is similar to the instrument provided by monoline insurers, who have largely retreated from the project bond market. One important difference between the PBCE and the monoline insurance products is the extent of the coverage of the credit insurance. Whereas monoline insurance products provided a guarantee backed by the credit rating of the insuring institution (typically at least AA- rated), the PBCE seeks to enhance the credit-rating of the bond only up to a level that the institutional investor market requires (for example the EIB today typically targets an A- rating). Furthermore, whereas monoline insurers can in some cases cover the full bond issuance, the target maximum coverage of the PBCE instrument is currently 20% of the bond issuance, which further reinforces its ‘credit enhancement’ (versus ‘credit wrap’) nature. In this way, the PBCE broadens financing sources and minimizes overall funding costs for the infrastructure projects it targets.
The PBI as a catalyst for infrastructure investment
The PBI pilot phase has already had some successes since the cooperation agreement was signed between the EU and the EIB in November 2012. In its first year since the de facto operating start, three PBI pilot phase projects have reached financial close with the PBCE. The take-up of the PBCE can be attributed to the its market-relevant structure, which suits the needs of investors and sponsors in several areas, such as tenor, risk coverage, subordination, etc. The refinancing of the Castor gas storage project demonstrated a ‘halo effect’ of the EIB, i.e. the ability to attract investors to a project with a higher risk profile than they would normally accept, and gave confidence to the market in its ability to execute this large deal in a short timeframe (‘signalling effect’). The Greater Gabbard OFTO acquisition financing, for which the PBCE supported a project bond issuance of `£305 million that was three times oversubscribed and priced at a very competitive 125bps over UK gilts, further confirmed the interest from investors in project bonds as well as the competitive financial terms that can be obtained. The A11 road project in Belgium was closed with a PBCE-supported project bond in March 2014, and would be the first greenfield PPP project to use this instrument. In the Castor and Greater Gabbard deals, investors were attracted to the bond issuance that would otherwise not have considered the investment without the presence of the PBCE and the EIB.
1 Of which €11.3 million is transferred from the Cohesion Fund and will be spent in line with this Regulation exclusively in Member States eligible
for funding from the Cohesion Fund.

Executive Summary Executive Summary
Executive Summary
8 Reliance Restricted Final
In addition to accessing a greater pool of liquidity in the market of “public bond” investors, the PBI pilot phase deals create important precedents that condition investors, advisors, procuring authorities and equity sponsors to more easily accept the use of this new paradigm in Europe to drive the development of infrastructure. In interviews with various stakeholders, the large majority of them believe that the PBCE is an appropriate financial instrument to address the current market needs and recognizes the fact that there has been an structural shift in the financing of European infrastructure from bank to bond financing. Although there is still little track record of deals using the PBCE, the majority of stakeholders agree with the structure of the PBCE as well as with its implementation in infrastructure deals.
The Project Bond Credit Enhancement (PBCE) facility has been a catalyst for the burgeoning project bond market in Europe and has helped develop the debt capital markets and expand the pool of liquidity for the financing of infrastructure projects. In investment grade projects, the introduction of the PBCE clearly increases the pricing tension, i.e. lowers the financing costs by accessing cheaper sources of financing than would have otherwise been available. The bond option that is supported by the PBCE appears to have a significant competitive advantage in terms of pricing versus other private finance options, as is suggested by empirical analysis of bond market spreads versus project loan spreads. This lower financing cost in transport and energy represents a saving for tax payers and releases public budgetary means that can be invested in other infrastructure.
The competitiveness of the bond solution to the traditional bank solutions is becoming more evident, whether through case examples or through empirical data analysis. The more debt capital markets develop, the more the infrastructure asset class should develop, which should draw further liquidity and normally more competitive financing terms. Some sources show that infrastructure financing margins in Europe dropped by around 70 basis points (bps) from 2012 to 2013. While some of this can be attributed to the successful mitigation of the Eurozone crisis, part of it can also be attributed to the increased competition in financing of infrastructure projects. The additional savings generated through the use of bond solutions represent a benefit for tax payers, and can be re-invested in new assets or used to retire debt, either of which has the ultimate effect (direct or indirect) to improve the budgetary and growth prospects for Europe’s citizens.
An argument for the PBCE as part of the Connecting Europe Facility (CEF)
The PBCE is a unique product in Europe, in terms of its open structure, tenor, and execution team. Furthermore, it is perhaps the only option for many trans-European projects, which are large and/or complex, to access debt capital markets. Stakeholders consider the PBCE as a good use of EU funds, and it has a much higher multiplier effect than Structural Funds or other financial instruments, such as the Marguerite Fund. The market is generally favorable to the inclusion of the PBI in the CEF if it is supported with a substantial budget allocation. The pipeline of investment grade (i.e. above BBB-rated) infrastructure projects is considered to be thin and there is currently a lot of liquidity in this segment of the market. Stakeholders believe that the EC and EIB can play a role in re-equilibrating the mismatch of demand and supply by using the PBCE to give the pool of lower-rated projects (i.e. B / BB) a rating uplift to make them investment grade. If projects meet the eligibility criteria established by the EC, the PBCE can correct true market failures for projects in riskier geographies, such as Southern and Eastern Europe, and/or industries, such as renewable energy.
Portfolio diversification increases the instrument’s effectiveness
From a portfolio risk management perspective, the way in which the EU funding for PBI pilot phase is administered appears sub-optimal. We understand the budget allocation from each Directorate General responsible for the three priority sectors, i.e. DG MOVE, DG ENER and DG CONNECT, respectively, is kept in separate trust accounts. This structure of multiple, isolated trust accounts creates a greater risk of a portfolio default because the idiosyncratic risk of projects and sectors is higher versus a large, diversified portfolio. On the other hand, establishing a single first loss piece structure from which projects in all three sectors would be provisioned for, would optimise the use of the EU budget (i.e. the same amount of money could be used to support a larger number of projects).
In addition to the potential diversification benefits that can be achieved by merging the individual first-loss piece contributions and pooling the risks, a further benefit of not creating closed funding pockets is to give flexibility to respond to market evolutions. An example of where this has not been possible during the PBI pilot phase is that only €10 million was allocated to the energy sector, whereas the first OFTO project in the pipeline required a sub-debt tranche of €50-60 million. The fortunes and structures of different sectors in Europe will certainly change over the 2014-2020 MFF period, as could also the priorities of the EU. Flexibility should be given to the PBI (and by extension to the CEF) to be able to respond to the economic and infrastructural challenges that will be faced over the next 7 years.

Executive Summary Executive Summary
Executive Summary
9 Reliance Restricted Final
Conclusions and recommendations on the PBI pilot phase
Based on the analysis and evaluation of the PBI pilot phase that we conducted between September and December 2013, we have been able to obtain a preliminary view on the success of the PBI in providing an alternative source of financing for trans-European network projects and for catalyzing debt capital markets for infrastructure projects.
Conclusions
► The PBI has served as a catalyst to generate liquidity in debt capital markets for targeted infrastructure projects. This is demonstrated by the interest from a large pool of investors that has been attracted to the two PBI pilot phase projects that have reached financial close to date.
► The PBCE is a unique financial instrument in Europe, in terms of its supranational scope, open structure and long tenor. It is largely filling the vacuum left by monoline insurers, whilst learning from some of the inherent risks that the latter were exposed to.
► The PBI is viewed positively by nearly all stakeholders. In particular, stakeholders largely believe that there has been a structural shift from bank financing to bond financing for infrastructure projects, and this is supported by the large increase in bond-financed infrastructure deals that occurred in 2013. The PBI addresses a market failure by matching the supply of infrastructure projects with the expectations of the large investor class of institutional investors.
► As has been demonstrated in the three bond issuances supported by the PBCE to date, the PBCE has been successful in both bringing debt investors to perceived risky projects as well as expanding the pool of capital for more solid projects. In either case, the obtained pricing and other terms on the debt has been improved versus the alternative financing options.
► According to stakeholders, the PBCE is well-structured, suits the market needs and has been well-executed in transactions. The EIB brings credibility and comfort to investors that cannot be matched by private financial institutions. The EU budget contribution to the PBCE is important to cover the EIB’s risk from engaging in riskier-than-normal transactions, and stakeholders view the PBCE instrument as an excellent use of EU funds.
► The EU added value of the PBI is greatest on projects that are:
– Large (i.e. greater than €300 million investment value)
– Cross-border (i.e. involve two Member States or more) for public infrastructure projects
– Non-investment grade (particularly where sovereign and/or industry risk is high)
Executive Summary Executive Summary
Executive Summary
10 Reliance Restricted Final
Recommendations
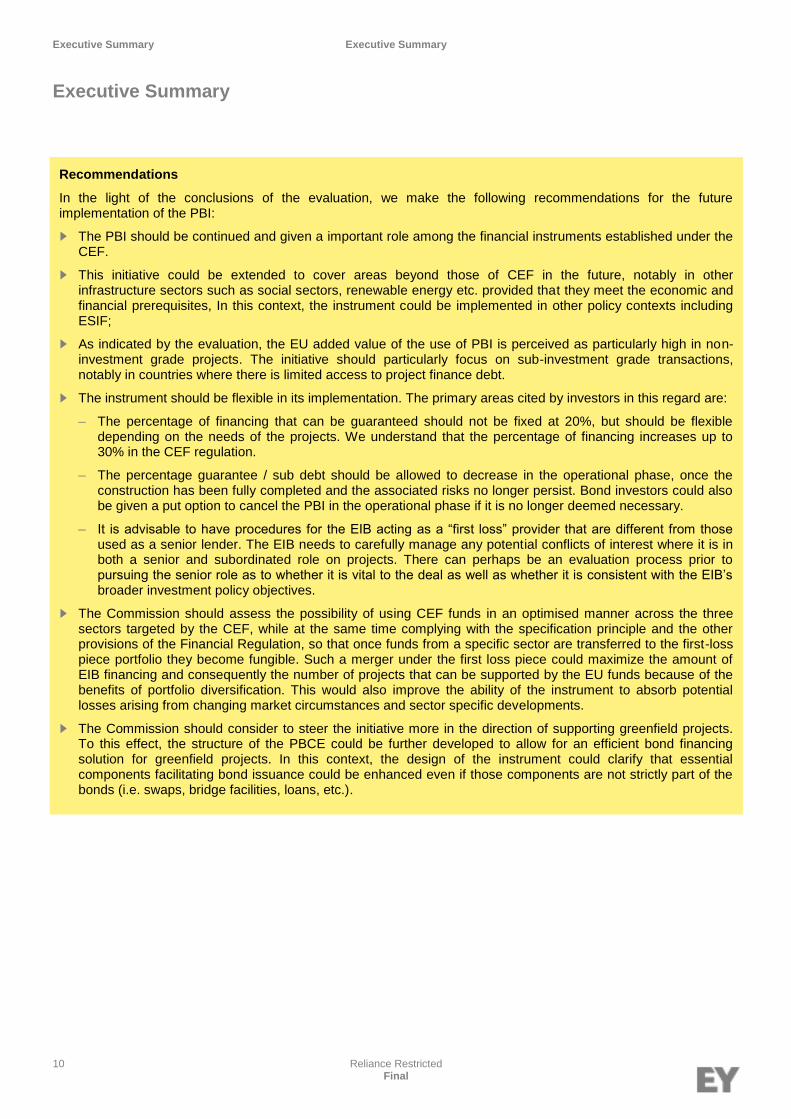
In the light of the conclusions of the evaluation, we make the following recommendations for the future implementation of the PBI:
► The PBI should be continued and given a important role among the financial instruments established under the CEF.
► This initiative could be extended to cover areas beyond those of CEF in the future, notably in other infrastructure sectors such as social sectors, renewable energy etc. provided that they meet the economic and financial prerequisites, In this context, the instrument could be implemented in other policy contexts including ESIF;
► As indicated by the evaluation, the EU added value of the use of PBI is perceived as particularly high in non-investment grade projects. The initiative should particularly focus on sub-investment grade transactions, notably in countries where there is limited access to project finance debt.
► The instrument should be flexible in its implementation. The primary areas cited by investors in this regard are:
– The percentage of financing that can be guaranteed should not be fixed at 20%, but should be flexible depending on the needs of the projects. We understand that the percentage of financing increases up to 30% in the CEF regulation.
– The percentage guarantee / sub debt should be allowed to decrease in the operational phase, once the construction has been fully completed and the associated risks no longer persist. Bond investors could also be given a put option to cancel the PBI in the operational phase if it is no longer deemed necessary.
– It is advisable to have procedures for the EIB acting as a “first loss” provider that are different from those used as a senior lender. The EIB needs to carefully manage any potential conflicts of interest where it is in both a senior and subordinated role on projects. There can perhaps be an evaluation process prior to pursuing the senior role as to whether it is vital to the deal as well as whether it is consistent with the EIB’s broader investment policy objectives.
► The Commission should assess the possibility of using CEF funds in an optimised manner across the three sectors targeted by the CEF, while at the same time complying with the specification principle and the other provisions of the Financial Regulation, so that once funds from a specific sector are transferred to the first-loss piece portfolio they become fungible. Such a merger under the first loss piece could maximize the amount of EIB financing and consequently the number of projects that can be supported by the EU funds because of the benefits of portfolio diversification. This would also improve the ability of the instrument to absorb potential losses arising from changing market circumstances and sector specific developments.
► The Commission should consider to steer the initiative more in the direction of supporting greenfield projects. To this effect, the structure of the PBCE could be further developed to allow for an efficient bond financing solution for greenfield projects. In this context, the design of the instrument could clarify that essential components facilitating bond issuance could be enhanced even if those components are not strictly part of the bonds (i.e. swaps, bridge facilities, loans, etc.).

11 Reliance Restricted Final
1. Objectives and scope of the ad-hoc audit
2. Ad-hoc audit methodology
Introduction

Introduction Objectives and scope of the ad-hoc audit
Objectives and scope of the ad-hoc audit
12 Reliance Restricted Final
The PBI pilot phase was set up by Regulation 670/2012 of 31 July 2012 as a precursor for the main phase of the PBI. The pilot phase effectively became operational after the signing of the cooperation agreement between the EIB and the European Commission (EC) on 7 November 2012. The ad-hoc audit of the PBI pilot phase will form the basis for a Commission report to the European Parliament and the Council on the implementation of the pilot phase, which is required before the end of 2013.
1. The main goals of this ad-hoc audit are:
► Assessing the effectiveness and efficiency of the PBI pilot in opening debt capital markets for infrastructure projects and providing an alternative source of debt financing to projects and increasing the volume of investments in priority projects and enhancing the efficiency of Union spending. Assessment of the actual or likely competitiveness of the product vis-à-vis other forms of financing as well as an assessment of whether the presence of this additional option introduced competitive pressure into bidding processes which would otherwise have been absent.
► Analyze and draw lessons from the implementation of this financial instrument from its establishment until the time of the audit
► Provide an overview of private or public sector initiatives in the EU which have the objective to enhance debt capital market financing for infrastructure
2. The scope of the evaluation covers the following:
► Evaluated program: Project Bond Initiative pilot phase
► Cut-off date: One year after signing of the Regulation establishing the PBI pilot phase, i.e. 31 July 2013
► Eligible area: The 28 Member States of the European Union (EU-28)
► Related programs / directorate generals: The trans-European networks (TEN-T, TEN-E), DG CONNECT (Digital Agenda), DG MOVE, DG ECFIN, DG ENERGY and the EIB. Emphasis is particularly on trans-European infrastructure, e.g. transport corridors, energy priority projects and high-speed broadband networks.
3. The main tasks of the ad-hoc audit are the following:
► Assessment of the market potential of project bonds, including an analysis of non-banking financing solutions in the infrastructure debt markets
► An analysis of the competitiveness of the PBI product versus bank financing solutions
► An analysis of the competitiveness of other non-bank financing solutions versus bank financing solutions
Objectives and scope of the ad-hoc audit
Objectives and scope of the ad-hoc audit

Introduction Ad-hoc audit methodology
Ad-hoc audit methodology
13 Reliance Restricted Final
Process
Our work on this ad-hoc audit began as from the kick-off meeting in the first week of September 2013. The ad-hoc audit methodology is broken down into three distinct phases:
► Inception Phase – four weeks
► Fieldwork Phase – four weeks
► Reporting Phase – three weeks
Inception Phase
The Inception Phase of our assignment consisted of the following steps:
► Kick-off meeting
► Documentary review of key documents
► Drafting an analytical methodology for each evaluation question
► Project assessment and benchmarking
► Preparation of the field phase and data collection tools
► Delivery of Draft Outline Report
During this phase, we relied on sources of information delivered to us by the EC and the EIB as well as third-party data sources:
1. Information provided by the EC and the EIB, including:
a. Pipeline of eligible projects for the PBCE instrument
b. Generic term sheet for the PBCE instrument (funded and unfunded)
c. Estimated investment volume achieved in the PBI pilot phase
d. Statistics on web site traffic for sites related to Project Bonds
e. Various policy documents regarding risk-sharing facilities, long-term investment funds (LTIFs), etc.
2. Third party data providers
a. Infrastructure Journal
b. Project Finance International
c. Infranews
d. Loanconnector
e. Thomson Reuters
f. Standard & Poor’s
g. Bloomberg
The evaluation methodology we set up for answering the ad-hoc audit questions is presented in Appendix A.
Fieldwork Phase
The Fieldwork Phase consisted of the following steps:
► Preparing Interview Guides for stakeholder interviews
► Conducting interviews with EC and EIB officials
► Conducting interviews with other stakeholders
Ad-hoc audit methodology
Ad-hoc audit methodology

Introduction Ad-hoc audit methodology
Ad-hoc audit methodology
14 Reliance Restricted Final
► Performing case studies on similar projects and with the Canadian bond market
► Analysis of the data collected and formulating answers to the ad-hoc audit questions
► Delivery of the Draft Final Report
We conducted five interviews with the EU institutions (EIB-DG ECFIN, DG MOVE, DG ENER, DG CONNECT, TEN-T Agency) and 13 interviews with other stakeholders. The objective of the latter interviews was to collect feedback and insights from stakeholders of the European infrastructure sector in order to answer the ad-hoc audit questions, but also to understand their experience with the PBCE and its impact on infrastructure development and investment decisions. We selected the stakeholders to interview in agreement with the European Commission and the EIB, and we were able to obtain 13 interviews with senior representatives of the European infrastructure community.
Theinterviews conducted by us with each interviewee typically lasted one and a half to two hours, and followed a structured Interview Guide.
The analysis of the data collected in the course of these interviews and our findings with relation to the ad-hoc audit questions are presented in the following section.
Reporting Phase – Next steps
The reporting phase will primarily consist of finalizing our report, based on feedback we receive from the EC. We would be happy to discuss the Draft Final Report to the steering group, as well as present our final conclusions and recommendations at a workshop organized by the EIB and/or to the European Parliament and Council steering groups.

15 Reliance Restricted Final
1. Effectiveness
2. Efficiency
3. EU added value
4. Additionality
Answers to the ad-hoc audit questions

Answers to the ad-hoc audit questions Effectiveness
The Project Bond Credit Enhancement facility has been a catalyst for the project bond market
16 Reliance Restricted Final
Question 1.1. : To what extent has the PBI helped provide or is likely to help providing additional financing for infrastructure projects in the TEN-T, TEN-E and ICT and broadband sectors?
The PBCE financial instrument was initiated by the EC and the EIB in order to address what was believed to be a market failure in the financing of infrastructure projects, namely the lack of liquidity in the markets especially with regards to long-term financing. The EC and the EIB identified that whilst the long-term tenor of infrastructure projects matched well the long-term liability profiles on the balance sheets of insurance companies and pension funds, these institutional investors were not yet involved in the financing of European infrastructure in a significant way. It was believed that the primary reasons why this was the case were that (i) the European infrastructure project finance market had been historically dominated by banks and (ii) the stand-alone credit rating of the majority of the publicly rated projects is concentrated in the ‘BBB’ and ‘BB’ categories, thus not within the investment criteria of many institutional investors. From the time when the EU institutions were initially contemplating developing capital market solutions for infrastructure financing in the 2009-2010 period until the operational start of the Project Bond Initiative pilot phase in November 2012, the infrastructure financing market continued to develop and most investors agree that liquidity has been restored in the markets. Nonetheless, whilst additional sources of project debt have become available in this period to replace bank debt and the liquidity previously available from the capital markets based on monoline guarantees, the extent of the additional debt is probably exaggerated by the limited pipeline of projects that require financing.
As can be seen in the graphic below, project financing of infrastructure in Europe over the 2010-2012 period dropped by half, due to the Eurozone crisis, softening bank balance sheets and their consequential retreat into shorter maturity and more liquid assets.
The overwhelming majority (80%) of the market participants state that the most significant trend in the European infrastructure financing market since the credit crisis is the structural shift from bank financing to bond financing, in other words, they don’t believe that long-maturity bank financing will come back in an important way in the medium term. In this context, an overwhelming majority of stakeholders also believe that the PBCE instrument has attracted additional financing to the European infrastructure sector. As can be seen in the graphic below, more than four out of five interviewees agree that the PBCE has attracted new investors to EU infrastructure investment, generally speaking, and to the Trans-European Networks, more specifically. Interviewees mention that the PBCE has increased the sources of liquidity and competitive tension for financing of infrastructure projects.
Effectiveness
The Project Bond Credit Enhancement facility has been a catalyst for the project bond market
Project finance infrastructure in Europe
Source: Infrastructure Journal
Notes to chart
1. This chart includes all sectors and all types of transactions, comprising (i) primary greenfield financing, (ii) acquisition of existing assets and (iii) refinancing of assets.
2. Please note also that the Infrastructure Journal database inflates the importance of debt as in refinancing, debt figures are always valued whilst the equity component is not.
72.6%
75.7% 84.7%
85.7%
30.9% (25.0%)
(35.2%)
0
50
100
150
200
250
300
350
400
0
10
20
30
40
50
60
70
80
2009 2010 2011 2012
Num
ber o
f dea
ls
Cur
renc
y: €
billi
on
Debt value Total deal value Deal count

Answers to the ad-hoc audit questions Effectiveness
The Project Bond Credit Enhancement facility has been a catalyst for the project bond market
17 Reliance Restricted Final
It is also important to make a distinction regarding the liquidity of financing in different sectors that Europe targets with the PBCE. Whilst the eligible projects for PBCE is restricted to a small part of the infrastructure universe, we thought it is interesting to comment on broader trends within different infrastructure sectors. Clearly, the most liquid sectors in terms of funding appetite for investors are within social infrastructure, including education, health care, and accommodation and transport, particularly for roads and rolling stock projects that are structured on availability-based PPP models. We note that the priority projects for the TEN-T network are focused primarily on low-carbon transport modes, such as waterways and railways. These transport sectors have historically relied primarily on public funding, and have been less supported by private finance. The energy sector also has a long track record of private finance, primarily in the fossil fuel and power sectors. Renewable energy projects remain very risky for many investors. Furthermore, whilst the unbundling of energy assets presents investment opportunities for new players and shakes up the business models of traditional utilities, it is unclear what will be the terms of future investment in energy infrastructure. Under the current guidelines, TEN-E projects mainly aim at connecting isolated energy markets and improving energy transmission systems. Finally, broadband/ICT infrastructure has historically been financed from corporate balance sheets, i.e. through unsecured bank or bond financing. There is so far little track record in Europe of ‘pure play’ infrastructure investors in broadband. The pipeline of projects eligible for the PBCE is restricted by the eligibility criteria applied by the Commission, which to a certain extent limits the impact of this financial instrument on the targeted infrastructure sectors.
Question 1.2. : To what extent has the PBI encouraged debt capital market financing of infrastructure projects?
According to the Infrastructure Journal, 70 infrastructure deals reached financial close in Europe during H1 2013, representing a decrease of 41% in deal count compared to H1 2012 (99 deals). Notwithstanding the decreasing number of deals, deal volume increased by 42% to €25 billion in H1 2013 versus H1 2012, due to a significant increase in the size of deals being closed. Debt represented €23 billion in H1 2013 and was mainly driven by transport (43%), telecoms (15%) and oil & gas (14%). The United Kingdom (€8 billion), France and Germany were the largest markets in the region. The evolution of privately-financed infrastructure deals in H1 2013 sends a mixed message, but it is certainly encouraging the completion of large deals. Confidence in the EU economy is slowly returning as worries about sovereign default and Eurozone contagion subside, although the markets remain wary.
An analysis of the Castor energy storage transaction and other recent infrastructure transactions in Europe is also instructive. As regards the Castor transaction, nearly all stakeholders believe that the refinancing would not have been successful had the EIB not been involved. The minority that do believe that the project could have been refinanced with bank financing, underline that it would not have covered the rest of the project period and therefore would have required an additional refinancing moment (in addition to being substantially more expensive).
PBCE has attracted additional investment to European infrastructure
Source: EY analysis
Question: In your opinion, has the PBCE attracted new investors to infrastructure investment overall in Europe? Has it attracted new investors to investment in infrastructure in the EU’s trans-European network target sectors of transport, energy and ICT/broadband?
0% 20% 40% 60% 80% 100%
General
TENs
Percentage
Yes No Not considered
There has been a structural shift from bank financing to bond financing in the European infrastructure market
Question: What do you consider to be the most important trend in the project loan market post-credit crisis?
80%
10%
10%
Structural shift from bank financing to bond financing
Long-term bank financing has decreased, but will come back in the medium term (3-5 years)
Tighter prudential regulations are discouraging infrastructure investment

Answers to the ad-hoc audit questions Effectiveness
The Project Bond Credit Enhancement facility has been a catalyst for the project bond market
18 Reliance Restricted Final
A number of project bond transactions have been funded in 2013, ranging from listed bonds to private placements to hybrid bank-bond financing structures. Most of the financed projects have been for availability-based road and social infrastructure projects (for further information on some of these transactions, we refer to Appendix C of this report). Several financing structures developed in the absence of the PBCE. However, the questionnaire reveals that more than 60% of stakeholders consider the importance of the PBCE to be very important for developing European infrastructure, whereas only 20 to 40 percent believe that private sector and national schemes are very important.
It is clear that infrastructure projects, including the PBI pilot phase projects, benefit from multiple financing options, including private placement, short- and long-term bank financing, or a blend of the bond and bank financing. Nearly all of the stakeholders interviewed believed that the current PBI pilot phase pipeline projects (excluding perhaps the Castor project) could obtain a credit enhancement from private (e.g. PEBBLE) or national (e.g. UK Guarantee) schemes. Nonetheless, in most cases investors consider the PBCE to be the credit enhancement that best suits their needs. Furthermore, many alternative credit enhancements lack the capacity of the PBCE to support large infrastructure projects, i.e. above €300 million investment value, on a recurring basis. Furthermore, when dealing with cross-border projects, the PBCE is seen as having the advantage of being distributed by a supranational entity with relationships to the procuring authorities involved, and therefore a potential option to problem resolution should issues arrive with the project. Finally, we understand that there is a large pool of investors, primarily smaller insurance companies and pension funds, that view the support of PBCE instrument structured by the EIB as a precondition to invest in project bonds. In this sense, the PBCE can be considered as a catalyst for project bond liquidity, primarily for the less sophisticated investors with little experience in the infrastructure market.
Question 1.3. : Did the EU Contribution help to attract additional sources of capital?
During the interview process, conducted between half October and half November, we only had one closed project to analyse, the Castor energy storage project in Spain, and even this project did not utilize the funds made available from the EU budget.
2 We can therefore not draw any conclusions on this point on the basis of project assessment.
The presence of the EU and the EIB is considered, however, as essential to attracting bond investors that do not have the capacities or experience to conduct extensive due diligence on infrastructure projects, such as many pension funds and small insurance companies (cfr answer to Question 1.2.). Furthermore, the EU contribution allows the EIB to support a greater amount of funding than if this support had not been there. Simply said, given the EIB’s credit guidelines, the volume of financing that could be supported by the PBCE would most certainly be lower if the EIB would fund the instrument from its own capital.
The second project, Greater Gabbard OFTO, reached the financial close on November 27, 2013. According to Project Finance International, the deal was publicly sold to a broad range of investors and was three times oversubscribed. This high level of investor interest demonstrates the attractiveness of the PBCE instrument. Through its budgetary support, the EU contribution indirectly attracted additional investors into the transaction.
Question 1.4. : Has the EU involvement in both reputational and budgetary terms increased the credibility of the PBI vis-à-vis investors?
The perception from stakeholders on the EC’s involvement is generally positive. When asked, 60% mentioned that they perceive the EU’s involvement in the PBCE as very good or excellent, whereas only 20% said it is fair or poor. Most investors associate the PBCE with the EIB, and most are very positive on the reactiveness and competencies of the team that has been put in place to implement the PBCE.
Stakeholders view the involvement of the EU in the PBI as particularly crucial in terms of reputational terms, with budgetary support clearly being a secondary impact (although the majority of the interviewees agreed or strongly agreed that this is also important). This can be explained by the fact that some respondents were unaware that the resources allocated to the pilot phase come also from the EU budget (and therefore not only from the EIB). Perhaps linked with the reputational support that the EU gives to the PBI, all of the interviewees who responded mentioned that the EU support was important in terms of certainty of delivery of the project and the financing thereof. It was particularly mentioned that the EC and EIB can speak with procuring authorities on a different level than the private sector, which gives comfort to investors in the project in case issues would arise in the execution of the project. Actually, the EC acts as a contributor of risk-sharing capital and determines the eligibility of the project to use the PBI, but it is the EIB that decides over the project suitability and viability. Many investors also mention that the
2 Indeed, the €10 million made available for energy projects in the PBI pilot phase was insufficient to cover the €200 million given the €1.4 billion
that was eventually raised to refinance the project’s debt.
Answers to the ad-hoc audit questions Effectiveness
The Project Bond Credit Enhancement facility has been a catalyst for the project bond market
19 Reliance Restricted Final
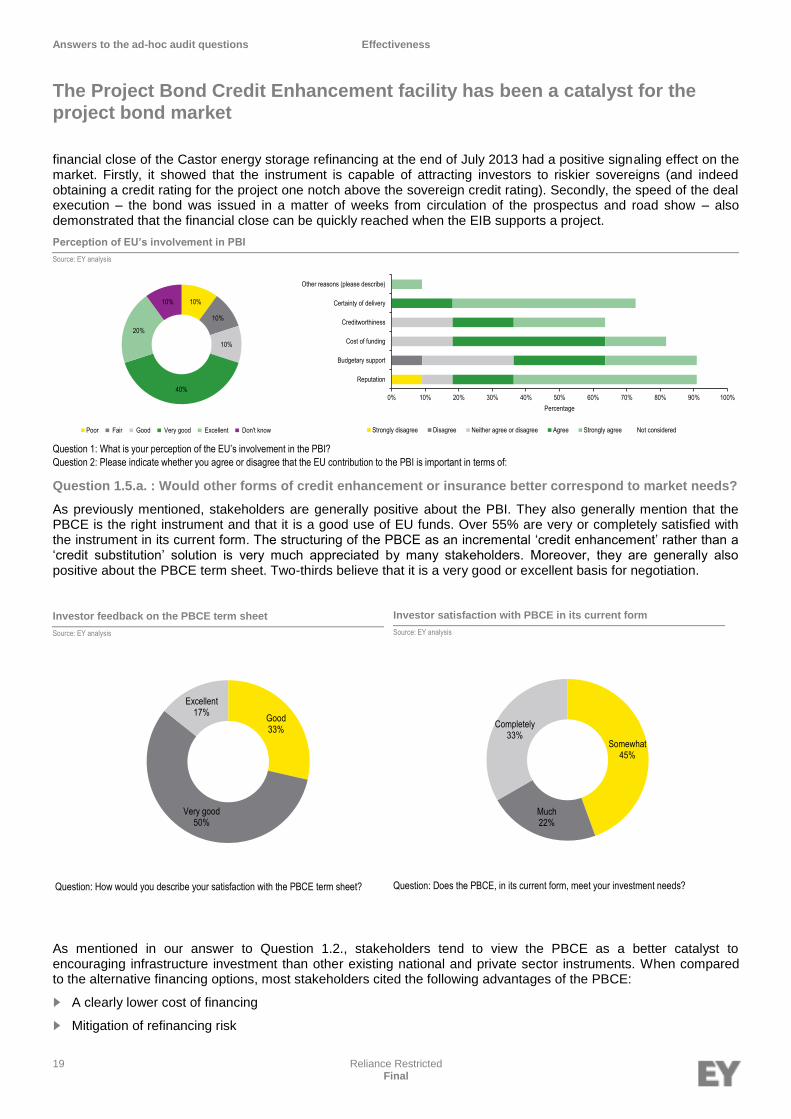
financial close of the Castor energy storage refinancing at the end of July 2013 had a positive signaling effect on the market. Firstly, it showed that the instrument is capable of attracting investors to riskier sovereigns (and indeed obtaining a credit rating for the project one notch above the sovereign credit rating). Secondly, the speed of the deal execution – the bond was issued in a matter of weeks from circulation of the prospectus and road show – also demonstrated that the financial close can be quickly reached when the EIB supports a project.
Question 1.5.a. : Would other forms of credit enhancement or insurance better correspond to market needs?
As previously mentioned, stakeholders are generally positive about the PBI. They also generally mention that the PBCE is the right instrument and that it is a good use of EU funds. Over 55% are very or completely satisfied with the instrument in its current form. The structuring of the PBCE as an incremental ‘credit enhancement’ rather than a ‘credit substitution’ solution is very much appreciated by many stakeholders. Moreover, they are generally also positive about the PBCE term sheet. Two-thirds believe that it is a very good or excellent basis for negotiation.
As mentioned in our answer to Question 1.2., stakeholders tend to view the PBCE as a better catalyst to encouraging infrastructure investment than other existing national and private sector instruments. When compared to the alternative financing options, most stakeholders cited the following advantages of the PBCE:
► A clearly lower cost of financing
► Mitigation of refinancing risk
Perception of EU’s involvement in PBI
Source: EY analysis
Question 1: What is your perception of the EU’s involvement in the PBI?
Question 2: Please indicate whether you agree or disagree that the EU contribution to the PBI is important in terms of:
10%
10%
10%
40%
20%
10%
Poor Fair Good Very good Excellent Don't know
0% 10% 20% 30% 40% 50% 60% 70% 80% 90% 100%
Reputation
Budgetary support
Cost of funding
Creditworthiness
Certainty of delivery
Other reasons (please describe)
Percentage
Strongly disagree Disagree Neither agree or disagree Agree Strongly agree Not considered
Investor feedback on the PBCE term sheet
Source: EY analysis
Question: How would you describe your satisfaction with the PBCE term sheet?
Good33%
Very good50%
Excellent17%
Investor satisfaction with PBCE in its current form
Source: EY analysis
Question: Does the PBCE, in its current form, meet your investment needs?
Somewhat45%
Much22%
Completely33%

Answers to the ad-hoc audit questions Effectiveness
The Project Bond Credit Enhancement facility has been a catalyst for the project bond market
20 Reliance Restricted Final
► Cash flow certainty
► Support on regulatory issues
► Liquidity of the investment
Many stakeholders mention that the PBCE is particularly useful on larger transactions (i.e. greater than €300 million) and cross-border projects where the EC and the EIB can play a facilitator role.
Question 1.5.b. : How, if necessary, could the PBI solution be made more attractive?
Many stakeholders believe that the PBCE is well-structured and competitive. Most investors also mentioned that they prefer the unfunded option to the funded option. The primary areas that investors cite for improvement is in the flexibility of the instrument, as mentioned below:
► The percentage of financing that can be guaranteed should not be fixed at 20%, but should be flexible depending on the needs of the projects. Lower risk projects may only need 10%, whereas other projects may need 30% or more.
► There should also be flexibility to allow the percentage guarantee / sub debt to decrease in the operational phase, once the construction has been fully completed and the associated risks no longer persist. We understand that such a step down has already been agreed / is being discussed on some of the PBI deals. The bond investors could also be given a put option to cancel the PBCE in the operational phase if it is no longer deemed necessary.
► There should be clear procedures for the EIB acting as a “first loss” provider that are different from those used as a senior lender. This will allow the PBCE to be more easily rolled out without too much hindrance from the general bank lending guidelines. Additionally, the different financial products offered by the EIB (e.g. PBCE, bank loan, etc.) should freely compete with each other so that project sponsors can choose which financial product offers them the best value for money.

Answers to the ad-hoc audit questions Efficiency
The PBCE is perceived to be a good use of EU funds with a high leverage effect
21 Reliance Restricted Final
Question 2.1. : To what extent is the PBI instrument and the resulting bonds likely to be competitive with other available sources of financing?
At the first level of analysis, we have attempted to perform a comparison of the financing costs related to long-term bank financing versus those related to long-term bond financing. The absence of a fully developed project bond market to date means that we must draw conclusions from a proxy analysis that compares project loan spreads against those of unsecured corporates in related infrastructure sectors. In our comparison, we have adjusted for several factors, including benchmark rates, credit quality and tenor.
On a corporate basis, the depth and liquidity of debt capital markets tends to compress credit spreads in comparison with bank loans. Even amongst privately placed and publicly listed bonds, the illiquidity premium for unlisted bond issuance tends to be around 30 bps. Taking into consideration all-in interest costs (that is, accounting for underlying benchmarks), the competitiveness of capital market funding tends to increase further. The graph below compares the margins for project finance loans to the spreads of bonds issued by corporates in comparable infrastructure sectors (water, power, transportation and oil and gas) between 2010 and 2013 year-to-date.
Notes to chart: 2013 year to date (September 2013)
On average, across tenors and credit quality, bank loan margins have been higher than bond credit spreads. In 2013 to date, average loan credit spreads were 87 bps higher than those for comparable corporate bonds. After adjusting for credit quality and tenor, loan credit spreads are still around 50 bps above bond spreads. Furthermore, this advantage of the all-in financing cost of bond versus bank financing is further widened when one considers that the Eurozone benchmark rate for bank finance (EURIBOR swap rate) has been consistently higher than that for bond finance (Bund yields)
3 over the past three years.
One should consider that embedded in project loan spreads is a premium for asset (concentration) risk and the highly structured nature of these financings. These features create unique credit risks that will command a premium over investment in stable operating companies funded on a corporate basis. Nevertheless, this premium cannot completely explain the material difference between project loan and bond spread. Transaction costs are typically also higher for bond financing versus bank financing, primarily because of costs related to disclosure (e.g. prospectus, ratings, etc.). However, transaction costs are minimal compared to the total financing cost (i.e. less than 10%), and therefore they do not offset the financing cost advantage of bond financing versus bank financing.
This empirical analysis was confirmed in our interviews with the infrastructure financing community. The PBCE financing alternative was consistently cited as being very interesting in terms of financing cost. When asked about the magnitude of the difference, the majority of those who considered there were other financing alternatives for the pilot phase projects said that the financing would be much more expensive (measured as a difference of more than 50bps on the all-in interest rate) if the PBCE would not have been involved. Furthermore, when compared to other
3 The German government bond (the “Bund”) is typically used as the reference benchmark rate for pricing Euro-denominated bonds, as it is the most liquid bond market in the Eurozone. For specific deals, there may be an exception to this rule and the yield on the local sovereign bond may be used, e.g. because of bond investor affinity, however the Bund is usually used to mitigate i.a. pricing uncertainty.
0
50
100
150
200
250
300
350
400
2010 2011 2012 2013
Spr
ead
to b
ench
mar
k (b
ps)
Avg. loan spread Avg. bond spread
Efficiency
The PBCE is perceived to be a good use of EU funds with a high leverage effect
Average spread by year (Bund and Euribor)
Source: Infrastructure Journal, loanconnector, Thomson Reuters

Answers to the ad-hoc audit questions Efficiency
The PBCE is perceived to be a good use of EU funds with a high leverage effect
22 Reliance Restricted Final
credit-enhancement instruments (e.g. Assured Guaranty, UK Guarantee, etc.), the PBCE is often cited as being the preferred option because it is competitively priced and does not “over-enhance” the investment in which case the additional rating uplift is offset by the loss of yield.
Question 2.2.a. : How does the PBI compare to the LGTT or other risk-sharing facilities in terms of results at a similar stage of maturity of the instrument?
The most comparable risk-sharing facility to the PBCE is the Loan Guarantee for Trans-European Transport (LGTT) instrument that was established by European legislation in 2006-7 and became operational upon signature of the cooperation agreement between the EC and EIB in January 2008. The aim of the LGTT was to mitigate revenue risk on traffic-dependent transport projects by providing a guarantee on a part of the loan financing. The instrument was limited to the first five to seven operational years of the project. The first LGTT deal was closed after more than two years from the start-up of its operations. Demand for LGTT was limited as post crisis projects have more typically been structured on an availability rather than on a traffic risk basis. Today, the LGTT is of more limited use as there is no market appetite for traffic risk on transport projects.
By comparison, the cooperation agreement establishing the PBCE was signed in November 2012. The instrument was deployed in its first project (Castor energy storage in Spain) in July 2013, a second financial close was reached in November 2013 (Greater Gabbard) and a third financial close using the PBCE is expected in the beginning of 2014. The take-up for the PBCE has therefore been faster than that for the LGTT, especially if one considers that the European infrastructure financing market is more difficult today than in the first year when the LGTT was established. Lessons were indeed drawn from the LGTT experience, nd the success of the PBCE can be attributed to several factors, including its broad risk coverage, including i.a. sovereign risk, construction risk, transition risk, etc., and its tenor which covers the full senior debt repayment period.
Question 2.2.b. : Is there sufficient awareness of the PBI?
There is a high awareness among stakeholders on the PBI. Many stakeholders mention that the EIB and the EC have been proactive in informing the market about the PBCE instrument and they were aware of the PBI when it was first being designed in 2009-2010 or even before. When asked how they became aware of the PBCE, more than 9 out of 10 mention that they discussed directly or saw presentations from representatives of the EC or EIB.
Indeed, between the beginning of 2011 and the beginning of 2013, representatives of DG ECFIN attended or presented at numerous infrastructure conferences (more than 25). Furthermore, bilateral meetings were established with investors and Member State administrations to discuss the PBI.
For the 12-month period from September to August, visits and unique visitors to the DG ECFIN website for “Financial Operations and Instruments” (where the PBI is featured) increased by 12% and 20%, respectively, versus 2012, which might result from the increased awareness and interest from the public in PBI.
How stakeholders became aware of PBI
Source: EY analysis
Question: The pilot phase of the Europe 2020 Project Bond Initiative (‘PBI’) became operational in November 2012, but was already being discussed in various forums of the EU since the fall of 2010. How did you become aware of the PBI and when (approximately)?
.
84.6%
7.7%
7.7%
Conversations with EC-EIB
EC-EIB presentation at industry event
Other presentation at industry event
Answers to the ad-hoc audit questions Efficiency
The PBCE is perceived to be a good use of EU funds with a high leverage effect
23 Reliance Restricted Final
Question 2.3. : Are there preliminary indications as to whether the EU contribution to the initiative is sufficient/appropriate to achieve EU policy objectives?
The contribution of €230 million to the PBI pilot phase until 2013 was expected to support investment of €4.5 billion. The Castor energy project alone (closed in July 2013) supported €1.1 billion in senior debt investment from external investors, without making use of the EU contribution. Besides this deal and the Greater Gabbard OFTO amounting to £305 million, one further deal utilizing the PBCE is expected to close in the coming months that could amount to an additional €0.5 billion in infrastructure investment supported by the PBI. One reason why utilization of the PBCE was not as rapid as expected is that infrastructure deals (especially greenfield deals) have a long transaction cycle - on average two years from the initial request to interest bidders to financial close. The financing solution is often discussed and structured by the consortium early in the process, and it is difficult to come in with a new alternative late in the process. Furthermore, project bonds are a new phenomenon, with a limited track record in Europe, and there is therefore reticence by bidders to be the first mover on this new solution. Last but not least, the procuring authorities have been very slow to structure their bids for public infrastructure projects to facilitate the use of the capital markets, knowing that public bond issues often require committed financing at bid stage which is unavailable in the public markets.
The feedback from stakeholders is that the part of the budget that has been allocated by the EC to the PBI pilot phase and the Connecting Europe Facility (CEF), i.e. €230 million and €33 billion, respectively, is appropriate. From the €33 billion budget of the CEF, 10% is available for financial instruments. Around fourth-fifths of the stakeholders we spoke with thought that the allocated funds are sufficient and necessary. A minority of interviewees felt that the funds allocated to the PBI pilot phase were insufficient
4 It should also be noted that the EIB can only carry out a
limited number of PBCE at its own risk, i.e. without the EU contribution, as otherwise the projects would have too much impact on its capital consumption. Hence, the value of the EU contribution lies in the fact that it makes possible a much larger deployment of PBCE operations under the PBI.
4 Indeed the €230 million is not enough to cover the ca. €1,6 billion of credit enhancement that the EIB estimates is needed to support all PBI
pipeline projects. The contributed amount can eventually be further stretched when the letter of credit (unfunded) option will be used.
Answers to the ad-hoc audit questions EU added value
The PBCE adds the most value in large, cross-border and riskier deals
24 Reliance Restricted Final
Question 3.1.a. : What is the EU added value of the PBI to TEN-T, TEN-E and ICT and broadband projects?
When speaking with stakeholders, more than 84% of the interviewees believe that there was sufficient private financing to finance the PBI pilot phase projects they were involved in without the intervention of the PBCE, and more than 90% said that the PBI pilot phase projects were also eligible for private sector or national guarantee schemes. However, for this group of interviewees, the majority said that the financing would be much more expensive (measured as a difference of more than 50bps on the all-in interest rate) if the PBCE would not have been involved. This is an important observation, because it (i) provides a genuine alternative to traditional bank financing and thus increases competition of financing solutions and (ii) it potentially allows infrastructure to get built faster because of the cheaper financing, which enables governments to deliver more to tax payers for the same amount of money. It should be emphasized, however, that the rationale for the PBCE is not only a lower financing cost. The PBCE would not be successful at being placed in the market if it was not a financial product that suited investor needs. Whilst both the Castor and Greater Gabbard transactions were refinancings, they emerged due to specificities in the projects’ financial structures rather than to simply reduce the cost of financing. Indeed, for the Castor project, the senior bank loans were reaching a maturity, and the project faced a default if a refinancing package was not proposed. The PBCE was the best (and perhaps only) solution that secured the financing for the project on a stable, long-term basis. As regards Greater Gabbard, the transaction emerged as a result of ensuring compliance with European unbundling requirements, and the PBCE provided a significantly cheaper financing package, which translated into considerable savings for the public authority (Ofgem).
The PBCE supported by the EIB is targeted at another market than other existing credit enhancements, that are often focused on one Member State. Private sector instruments, such as Assured Guaranty’s monoline instrument have limited capacity (typically deal size of €100-300 million investment value) and are focused on investment grade projects, such as availability-based PPPs in northwestern Europe. These instruments could also be complementary to the PBCE, e.g. they would be willing to piggy-back on a deal that was upgraded to investment grade by the PBCE (so investment grade of the underlying project is not sine qua non).
The PBI pilot phase project where the stakeholders thought the PBCE added the most value is the Castor project, in comparison with others such as UK OFTOs and A11 highway, because the refinancing of the project was not assured, or only at onerous terms (short tenor requiring an additional refinancing and very high credit spreads). Elements that were mentioned by stakeholders where the EU PBI adds value are the following:
► Cross-border projects, where relevant
► Large infrastructure projects (greater than €300 million)
► Infrastructure projects with construction risk, i.e. greenfields
► Non-investment grade projects (see question 4.1.a)
EU added value
The PBCE adds the most value in large, cross-border and riskier deals
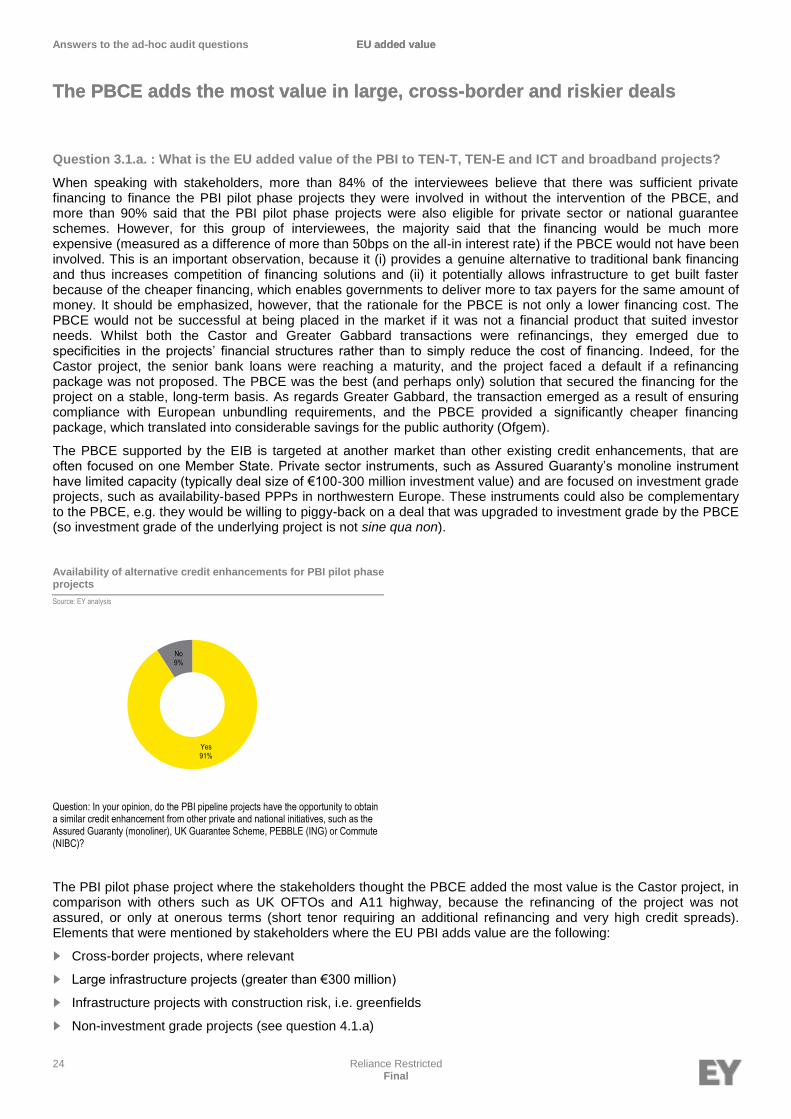
Availability of alternative credit enhancements for PBI pilot phase projects
Source: EY analysis
Question: In your opinion, do the PBI pipeline projects have the opportunity to obtain a similar credit enhancement from other private and national initiatives, such as the Assured Guaranty (monoliner), UK Guarantee Scheme, PEBBLE (ING) or Commute (NIBC)?
Yes91%
No9%

Answers to the ad-hoc audit questions EU added value
The PBCE adds the most value in large, cross-border and riskier deals
25 Reliance Restricted Final
Question 3.1.b. : To what extent and by which means can the EU added value of the instrument be maximised?
We observed that the way in which the “back office” between the EC and the EIB was structured was not optimal from risk management perspective. The choice for a First Loss Piece (FLP) model, in which the EC absorbs the first losses on the PBCE portfolio, appears to be a good one in terms of maximizing the amount of investment that can be supported by the available funds. However, we understand that for the PBI pilot phase, the budget allocation from each Directorate General responsible for the three priority sectors, i.e. DG MOVE, DG ENER and DG CONNECT, respectively, is kept in separate trust accounts. This structure of multiple, isolated trust accounts diminishes the potential to minimize portfolio risk.
Indeed, portfolio diversification is achieved by adding assets to a portfolio, and minimization of risk is optimized by combining assets with low correlation coefficients. Applied to risk-sharing instruments, the combination of the increasing number of projects and sector diversification make the probability of default of the portfolio lower.
The current arrangement in the PBI pilot phase where first-loss provision for each sector is managed in separate trust accounts is therefore sub-optimal from a risk management point of view. Establishing a single first loss piece structure from which projects in all three sectors would be provisioned for, would optimise the use of the EU budget (i.e. the same amount of money could be used to support a larger number of projects). Each sector has different market dynamics and interaction with the overall economy. The broadband sector has in the past been more cyclical than the transport or utilities sectors.
In addition to the potential diversification benefits that can be achieved by merging the individual first-loss piece contributions and pooling the risks, a further benefit of not creating closed funding pockets is to give flexibility to respond to market evolutions. An example of where this has not been possible during the PBI pilot phase is that only €10 million was allocated to the energy sector, whereas the first OFTO project in the pipeline required a sub-debt tranche of €50-60 million. The fortunes and structures of different sectors in Europe will certainly change over the 2014-2020 MFF period, as could also the priorities of the EU. Flexibility should be given to the PBI (and by extension to the CEF) to be able to respond to the economic and infrastructural challenges that will be faced over the next 7 years, with the caveat that the availability of EU funds depends on compliance with the EU Financial Regulation No. 1316/2013.
Answers to the ad-hoc audit questions Additionality
The PBCE should focus on sectors and geographies where market failure exists
26 Reliance Restricted Final
Question 4.1.a. : Has the principle of additionality been respected, i.e. has private financing been attracted?
We understand that in the refinancing of the Castor project, nearly 30 investors from around Europe participated in the bond issuance. There is unanimity that most, if not all, of these investors would not have considered buying the bond without the PBCE and EIB involvement. In this project, the PBCE therefore clearly attracted private financing. It is a good example of how the PBCE instrument induces a larger pool of investors to participate, and particularly those who do not have the due diligence capacity for such projects, such as smaller insurance companies and pension schemes.
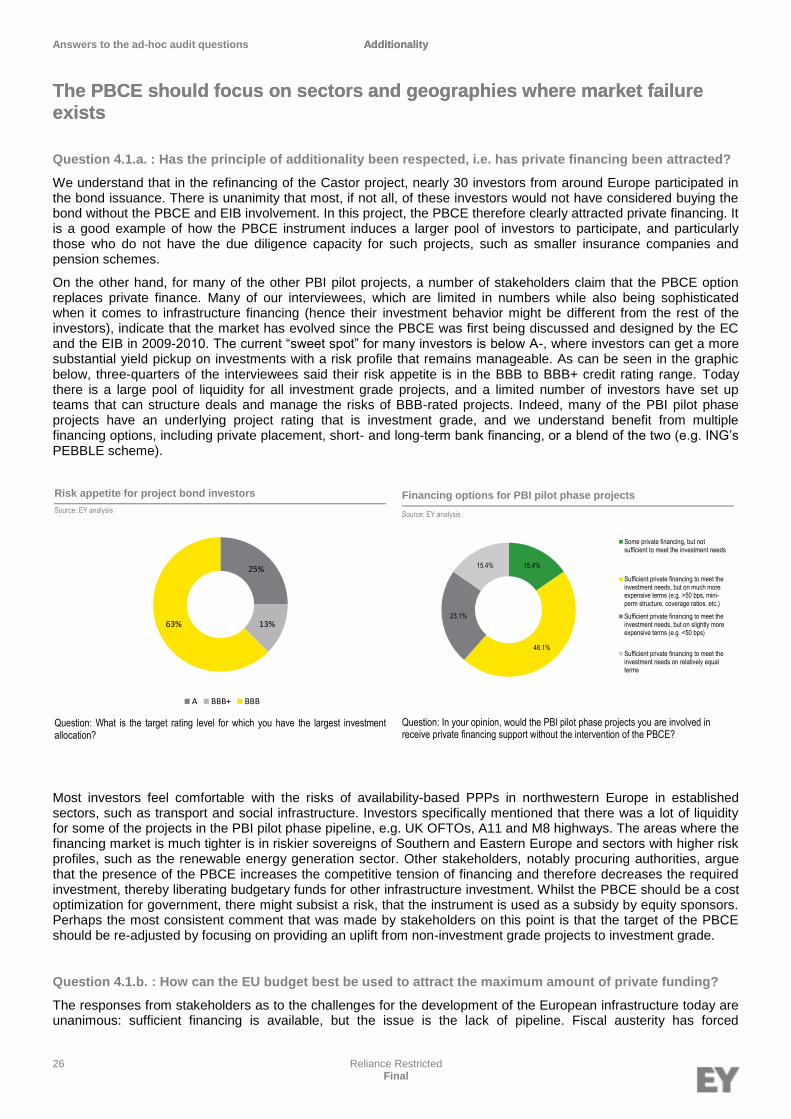
On the other hand, for many of the other PBI pilot projects, a number of stakeholders claim that the PBCE option replaces private finance. Many of our interviewees, which are limited in numbers while also being sophisticated when it comes to infrastructure financing (hence their investment behavior might be different from the rest of the investors), indicate that the market has evolved since the PBCE was first being discussed and designed by the EC and the EIB in 2009-2010. The current “sweet spot” for many investors is below A-, where investors can get a more substantial yield pickup on investments with a risk profile that remains manageable. As can be seen in the graphic below, three-quarters of the interviewees said their risk appetite is in the BBB to BBB+ credit rating range. Today there is a large pool of liquidity for all investment grade projects, and a limited number of investors have set up teams that can structure deals and manage the risks of BBB-rated projects. Indeed, many of the PBI pilot phase projects have an underlying project rating that is investment grade, and we understand benefit from multiple financing options, including private placement, short- and long-term bank financing, or a blend of the two (e.g. ING’s PEBBLE scheme).
Most investors feel comfortable with the risks of availability-based PPPs in northwestern Europe in established sectors, such as transport and social infrastructure. Investors specifically mentioned that there was a lot of liquidity for some of the projects in the PBI pilot phase pipeline, e.g. UK OFTOs, A11 and M8 highways. The areas where the financing market is much tighter is in riskier sovereigns of Southern and Eastern Europe and sectors with higher risk profiles, such as the renewable energy generation sector. Other stakeholders, notably procuring authorities, argue that the presence of the PBCE increases the competitive tension of financing and therefore decreases the required investment, thereby liberating budgetary funds for other infrastructure investment. Whilst the PBCE should be a cost optimization for government, there might subsist a risk, that the instrument is used as a subsidy by equity sponsors. Perhaps the most consistent comment that was made by stakeholders on this point is that the target of the PBCE should be re-adjusted by focusing on providing an uplift from non-investment grade projects to investment grade.
Question 4.1.b. : How can the EU budget best be used to attract the maximum amount of private funding?
The responses from stakeholders as to the challenges for the development of the European infrastructure today are unanimous: sufficient financing is available, but the issue is the lack of pipeline. Fiscal austerity has forced
Additionality
The PBCE should focus on sectors and geographies where market failure exists
Risk appetite for project bond investors
Source: EY analysis
Question: What is the target rating level for which you have the largest investment allocation?
25%
13%63%
A BBB+ BBB
Financing options for PBI pilot phase projects
Source: EY analysis
Question: In your opinion, would the PBI pilot phase projects you are involved in receive private financing support without the intervention of the PBCE?
15.4%
46.1%
23.1%
15.4%
Some private financing, but notsufficient to meet the investment needs
Sufficient private financing to meet theinvestment needs, but on much moreexpensive terms (e.g. >50 bps, mini-perm structure, coverage ratios, etc.)
Sufficient private financing to meet theinvestment needs, but on slightly moreexpensive terms (e.g. <50 bps)
Sufficient private financing to meet theinvestment needs on relatively equalterms

Answers to the ad-hoc audit questions Additionality
The PBCE should focus on sectors and geographies where market failure exists
27 Reliance Restricted Final
governments to suspend or cancel investments, and too few projects are sufficiently well prepared to be ready for private financing (i.e. bankability).
Primary obstacles to realizing investments in European infrastructure projects
Source: EY analysis
Question 22: Please list the primary obstacles to realizing investments in European infrastructure projects from most to least important?
As can be seen in the graph above, lack of financing is not considered as an issue for the development of European infrastructure, but rather lack of funding and project preparation. This being said, more than 60% of stakeholders think that the PBCE plays an important role in helping Europe to reach its infrastructure investment objectives, and plays a much more important role in this sense than private or national schemes to support the financing of European infrastructure. Stakeholders do retain two other elements, however, as being even more important, namely (i) the European Commission’s role, which aims at promoting prudential regulations that ensure economic and financial stability, in making regulation that will not negatively impact infrastructure investment (e.g. provisions in Solvency 2) and (ii) its contribution in supporting Public-Private Partnerships (PPPs) around Europe.
Regarding the former, stakeholders encourage efforts to reduce the capital charge and balance sheet treatment that would be applied to project bonds under Solvency 2. They applaud initiatives, such as the proposed Matching Adjustment, that take into account the “buy and hold” strategy of most project bond investors. For this reason, many stakeholders argue that the treatment for infrastructure project bonds in Solvency 2 should be different than for corporate bonds. In particular, the focus for assessing the capital charge should not be on the yield risk but rather on the default risk, and should take into account the default rates and recovery rates for privately financed infrastructure assets.
Public-Private Partnerships (PPPs) can be useful for delivering good projects on time in Europe. PPPs can also create a dynamic for competition of private finance in infrastructure development. Rather than viewing PPPs as privatization, procuring authorities should educate themselves on the topic and always consider to do a PPP when they have an infrastructure project, e.g. by doing a “Value for Money” (or Public-Private Comparator) analysis. To promote PPPs around Europe, investors and stakeholders emphasise the importance of standardized project documentation. Furthermore, tender documentation should also be appropriate to allow for a project bond issuance, e.g. not requiring committed financing before Preferred Bidder stage, including “make whole” clauses, etc. The EC and EIB are already helping educate public authorities, for example through the European PPP Expertise Centre (EPEC), through organization of workshops, sharing of best practices, etc. This is already assisting in increasing the supply of finance-ready infrastructure projects, but more is still needed to be done. Financial advisors also have a role to play, given their experience in providing impartial advice to public authorities, private investors and senior lenders, and in developing innovative financial solutions for developing projects.
Question 4.2. : To what extent is the PBI coherent with other relevant EU policies and financial instruments? Are there any overlaps or contradictions?
The PBI appears to be coherent and complementarity with other EU policies and financial instruments. The target of the PBCE – increasing capital market solutions for the financing of infrastructure – is not being addressed by any other EU financial instrument. Other risk-sharing instruments address other needs – the LGTT is for bank financing
0% 10% 20% 30% 40% 50% 60% 70% 80% 90% 100%
National and local governments do not support these projects
Lack of a clear project pipeline
There are too many legal and regulatory barriers (at which level?)
There is too little cooperation between public authorities of Member States
Public opposition is too strong for these projects
Percentage
Rank 1 Rank 2

Answers to the ad-hoc audit questions Additionality
The PBCE should focus on sectors and geographies where market failure exists
28 Reliance Restricted Final
in the transport sector and the Marguerite Fund is an equity fund. Initiatives that the EU is engaged in, such as adapting Solvency 2 and work on PPP procurement processes, are complementary and supportive of the PBI as well as capital market development for infrastructure finance. Furthermore, as already stated above (cfr question 1.2.), no other credit enhancement provided by national governments or the private sector sufficiently addresses the market segment target by the PBCE, i.e. large, cross-border transactions. In this regard, the PBCE is complementarity to other instruments available in the European market, and can even conceivably sit alongside these other instruments in the financing structure of a project.
One area mentioned by some stakeholders is a potential contradiction or conflict of interest when the EIB is both offering the PBCE and senior lending to an infrastructure deal. For example, in the Castor deal the EIB took over 21% of the bond issue, and if their stake would increase to over 25%, they would be able to block any special resolutions. In this case, it is not clear whether the EIB will play its role as the senior tranche or as the subordinated tranche lender. Furthermore, a number of stakeholders express concern of the EIB crowding out other investors in their role as a senior lender. Many stakeholders remark that the EIB should act as a true “first loss” lender, with strong inter-creditor agreements in place.

29 Reliance Restricted Final
1. Conclusions and recommendations
Conclusions and recommendations

Conclusions and recommendations Conclusions and recommendations
Conclusions and recommendations
30 Reliance Restricted Final
Conclusions
The pilot phase of the Project Bond Initiative (PBI) has helped develop the debt capital markets and expanded the pool of liquidity for the financing of infrastructure projects. The Project Bond Credit Enhancement (PBCE) facility has been a catalyst for the burgeoning project bond market in Europe. The take-up of the PBCE can be attributed to the its market-relevant structure, which suits the needs of investors and sponsors in several areas, such as tenor, risk coverage, subordination, etc. The PBCE additionally benefits from the credibility of the European Commission (EC) and the EIB, particularly in the financing of projects perceived as very risky, such as the Castor project. In other projects that are investment grade, the introduction of the PBCE has clearly increased the pricing tension, i.e. lowered the financing costs by accessing cheaper sources of financing than would have otherwise been available. The PBCE - implemented by the EC and the EIB - is a unique product in Europe, in terms of its open structure, tenor, and execution team. The bond option that is supported by the PBCE appears to have a significant competitive advantage in terms of pricing versus other private finance options, as is suggested by empirical analysis of bond market spreads versus project loan spreads. This lower financing cost in transport and energy represents a saving for tax payers and releases public budgetary means that can be invested in other infrastructure.
The large majority of stakeholders believe the PBCE is an appropriate financial instrument to address the current market needs and recognizes the fact that there has been an structural shift in the financing of European infrastructure from bank to bond financing. Although there is still little track record of deals using the PBCE, the majority of stakeholders agree with the structure of the PBCE as well as its implementation in infrastructure deals. The Castor refinancing demonstrated a ‘halo effect’, i.e. the ability to attract investors to a project with a higher risk profile than they would normally accept, and gave confidence to the market in its ability to execute this large deal in a short timeframe (‘signalling effect’). The Greater Gabbard OFTO acquisition financing, for which the PBCE supported a project bond issuance of `£305 million that was three times oversubscribed and priced at a very competitive 125bps over UK gilts, further confirmed the interest from investors in project bonds as well as the competitive financial terms that can be obtained. The A11 road project in Belgium closed with a PBCE-supported project bond in March 2014, and is the first greenfield PPP project to use this instrument. These deals are already catalysing the market, meaning that investors, advisors, procuring authorities and equity sponsors will be more ready to use this new paradigm in Europe to drive the development of infrastructure.
Stakeholders consider the PBCE as a good use of EU funds, and it has a much higher multiplier effect than Structural Funds or other financial instruments, such as the Marguerite Fund. The market is generally favorable to the inclusion of the PBI in the Connecting Europe Facility (CEF) if it is supported with a substantial budget allocation. The pipeline of investment grade (i.e. above BBB-rated) infrastructure projects is considered to be running empty and there is currently a lot of liquidity in this segment of the market. Stakeholders believe that the EC and EIB can play a role in re-equilibrating the mismatch of demand and supply by using the PBCE to give the pool of lower-rated projects (i.e. B / BB) a rating uplift to make them investment grade.
Recommendations
In the light of the conclusions of the evaluation, we make the following recommendations for the future implementation of the PBI:
► The PBI should be continued and given a important role among the financial instruments established under the CEF.
► This initiative could be extended to cover areas beyond those of CEF in the future, notably in other infrastructure sectors such as social sectors, renewable energy etc. provided that they meet the economic and financial prerequisites, In this context, the instrument could be implemented in other policy contexts including ESIF;
► As indicated by the evaluation, the EU added value of the use of PBI is perceived as particularly high in non-investment grade projects. The initiative should particularly focus on sub-investment grade transactions, notably in countries where there is limited access to project finance debt.
► The instrument should be flexible in its implementation. The primary areas cited by investors in this regard are:
– The percentage of financing that can be guaranteed should not be fixed at 20%, but should be flexible depending on the needs of the projects. We understand that the percentage of financing increases up to 30% in the CEF regulation.
– The percentage guarantee / sub debt should be allowed to decrease in the operational phase, once the construction has been fully completed and the associated risks no longer persist. Bond investors could also be given a put option to cancel the PBI in the operational phase if it is no longer deemed necessary.
Conclusions and recommendations
Conclusions and recommendations

Conclusions and recommendations Conclusions and recommendations
Conclusions and recommendations
31 Reliance Restricted Final
– It is advisable to have clear procedures for the EIB acting as a “first loss” provider that are different from those used as a senior lender. The EIB needs to carefully manage any potential conflicts of interest where it is in both a senior and subordinated role on projects. There can perhaps be an evaluation process prior to pursuing the senior role as to whether it is vital to the deal as well as whether it is consistent with the EIB’s broader investment policy objectives.
► The Commission should assess the possibility of using CEF funds in an optimised manner across the three sectors targeted by the CEF, while at the same time complying with the specification principle and the other provisions of the Financial Regulation, so that once funds from a specific sector are transferred to the first-loss piece portfolio they become fungible. Such a merger under the first loss piece could maximize the amount of EIB financing and consequently the number of projects that can be supported by the EU funds because of the benefits of portfolio diversification. This would also improve the ability of the instrument to absorb potential losses arising from changing market circumstances and sector specific developments.
► The Commission should consider to steer the initiative more in the direction of supporting greenfield projects. To this effect, the structure of the PBCE could be further developed to allow for an efficient bond financing solution for greenfield projects. In this context, the design of the instrument could clarify that essential components facilitating bond issuance could be enhanced even if those components are not strictly part of the bonds (i.e. swaps, bridge facilities, loans, etc.).

32 Reliance Restricted Final
1. Global market trends
2. European market trends
3. Financing trends
4. Sector focus
5. Regulatory impacts
6. EU financial instruments
Appendix A: Overview of the infrastructure market

Appendix A: Overview of the infrastructure market
Global market trends
Successive banking and sovereign debt crises have crippled infrastructure investment
33 Reliance Restricted Final
Introduction
Against the backdrop of the global credit crisis and the sovereign debt crisis in Europe, global infrastructure markets have been on general decline. Indeed, Europe, which has historically been the largest infrastructure project finance market in terms of number and volume of transactions, has been particularly hard hit due to the confluent effects of fiscal tightening and retreating credit markets. Most other regions have also seen a decline in infrastructure investment, and though not as steep as in Europe, it has led to an overall decline in investment in the sector from 2010 to 2012. During H1 2013, the US and Europe infrastructure markets have continued to decline, whilst emerging markets in Asia and Africa have been more vibrant.
Global market trends in infrastructure project finance
The chart below presents key indicators for the infrastructure project finance market throughout the world for the period 2009-2012. The market significantly deteriorated in 2012 as both global volume and deal count reached their lowest levels in four years. Debt financing, i.e. loans and bonds, as a percentage of the total value amounted to 70.1% in 2012, compared to 72.8% the year before.
Global market trends
Successive banking and sovereign debt crises have crippled infrastructure investment
Project finance infrastructure
Source: Infrastructure Journal
Notes to chart
1. This chart includes all sectors and all types of transactions, comprising (i) primary greenfield financing, (ii) acquisition of existing assets and (iii) refinancing of assets.
2. Please note also that the Infrastructure Journal database inflates the importance of debt as in refinancing, debt figures are always valued whilst the equity component is not.
68.0%
70.0% 72.8%
70.1%
20.9% (11.9%)
(25.8%)
0
100
200
300
400
500
600
700
0
20
40
60
80
100
120
140
160
180
200
2009 2010 2011 2012
Num
ber o
f dea
ls
Cur
renc
y: €
billi
on
Debt value Total deal value Deal count
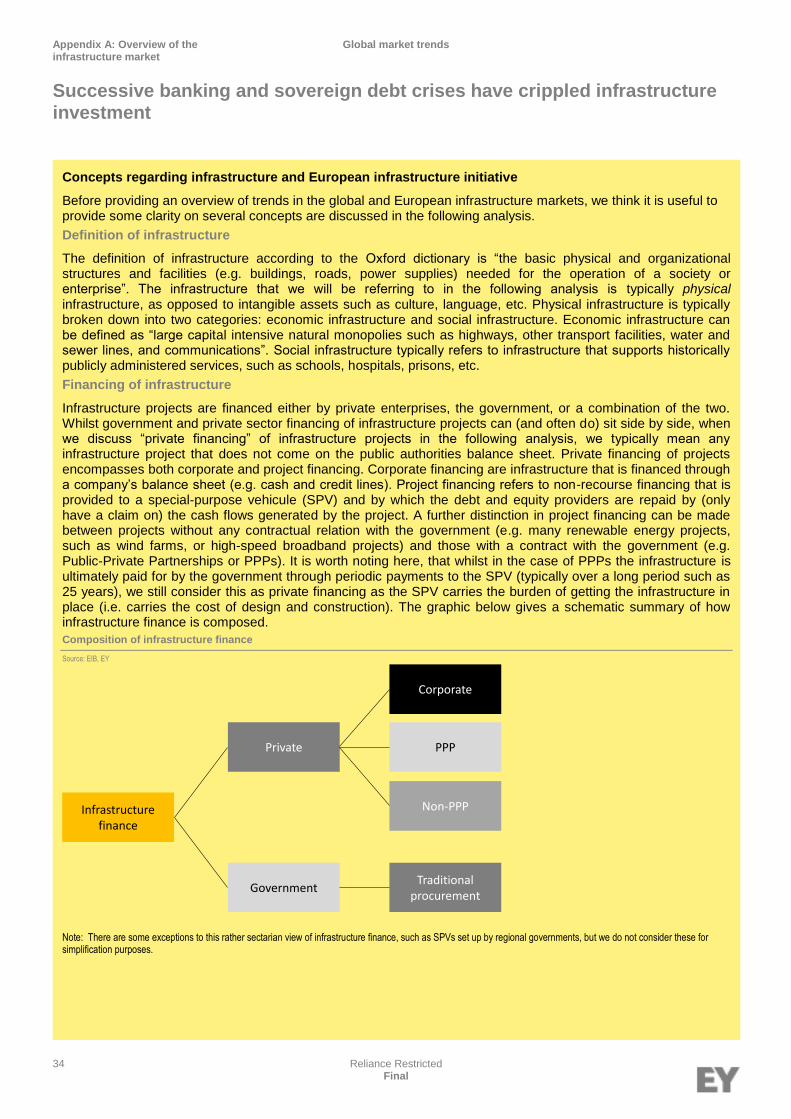
Appendix A: Overview of the infrastructure market
Global market trends
Successive banking and sovereign debt crises have crippled infrastructure investment
34 Reliance Restricted Final
Concepts regarding infrastructure and European infrastructure initiative
Before providing an overview of trends in the global and European infrastructure markets, we think it is useful to provide some clarity on several concepts are discussed in the following analysis.
Definition of infrastructure
The definition of infrastructure according to the Oxford dictionary is “the basic physical and organizational structures and facilities (e.g. buildings, roads, power supplies) needed for the operation of a society or enterprise”. The infrastructure that we will be referring to in the following analysis is typically physical infrastructure, as opposed to intangible assets such as culture, language, etc. Physical infrastructure is typically broken down into two categories: economic infrastructure and social infrastructure. Economic infrastructure can be defined as “large capital intensive natural monopolies such as highways, other transport facilities, water and sewer lines, and communications”. Social infrastructure typically refers to infrastructure that supports historically publicly administered services, such as schools, hospitals, prisons, etc.
Financing of infrastructure
Infrastructure projects are financed either by private enterprises, the government, or a combination of the two. Whilst government and private sector financing of infrastructure projects can (and often do) sit side by side, when we discuss “private financing” of infrastructure projects in the following analysis, we typically mean any infrastructure project that does not come on the public authorities balance sheet. Private financing of projects encompasses both corporate and project financing. Corporate financing are infrastructure that is financed through a company’s balance sheet (e.g. cash and credit lines). Project financing refers to non-recourse financing that is provided to a special-purpose vehicule (SPV) and by which the debt and equity providers are repaid by (only have a claim on) the cash flows generated by the project. A further distinction in project financing can be made between projects without any contractual relation with the government (e.g. many renewable energy projects, such as wind farms, or high-speed broadband projects) and those with a contract with the government (e.g. Public-Private Partnerships or PPPs). It is worth noting here, that whilst in the case of PPPs the infrastructure is ultimately paid for by the government through periodic payments to the SPV (typically over a long period such as 25 years), we still consider this as private financing as the SPV carries the burden of getting the infrastructure in place (i.e. carries the cost of design and construction). The graphic below gives a schematic summary of how infrastructure finance is composed.
Composition of infrastructure finance
Source: EIB, EY
Note: There are some exceptions to this rather sectarian view of infrastructure finance, such as SPVs set up by regional governments, but we do not consider these for simplification purposes.
Infrastructurefinance
Private
GovernmentTraditional
procurement
PPP
Non-PPP
Corporate

Appendix A: Overview of the infrastructure market
Global market trends
Successive banking and sovereign debt crises have crippled infrastructure investment
35 Reliance Restricted Final
The availability of long term debt is a substantial obstacle for infrastructure project finance development. In addition, the budget restrictions experienced by governments negatively impacted the realisation of investment in infrastructure, which had a significant bearing also on PPPs. These hurdles require governments and financial institutions to find innovative ways to ensure that funding is directed towards infrastructure investment.
From a geographical standpoint, Latin America was the only region that recorded an overall rise in deal value whilst Asia Pacific was most resilient to the global downturn. As private infrastructure investment to Europe saw a steep decline, the American continent was the top region for private investment in infrastructure in 2012. The Asia Pacific region was the second largest (in terms of value) for private infrastructure investment. However, this was primarily due to the €9 billion Australia Pacific LNG deal, which accounted for more than 20% of the region’s value. Overall, there was a fall in the number of greenfield, brownfield and M&A deals.
Concepts regarding infrastructure and European infrastructure initiative (cont.)
European networks infrastructure
In order to support the Europe 2020 Strategy, the EU has made a policy choice to further integrate the internal market by financially supporting trans-European infrastructure projects in the sectors of transport, energy and telecommunications. The Connecting Europe Facility (CEF), operational since the beginning of 2014, will be the primary funding instrument to support the development of trans-European networks. The regulation establishing the CEF outlines the priorities of projects to be funded, as described below:
“Given the resources available at Union level, concentration on projects with the highest European added value is necessary in order to achieve the desired impact. Support should therefore be focused on the core network and on projects of common interest in the field of traffic management systems, in particular the air traffic management systems resulting from the new-generation European air traffic management system (SESAR system), which require Union budgetary resources of about EUR 3 000 million, as well as the Intelligent Transport System (ITS), Vessel Traffic Monitoring and Information Systems (VTMIS), River Information Services (RIS) and the European Rail Traffic Management System (ERTMS). In the energy sector, financial assistance should focus on completing the internal energy market, ensuring security of supply, promoting sustainability, inter alia by ensuring the transmission of renewable electricity from generation to centres of demand and storage, and attracting public and private investment. In the telecommunications sector, financial assistance should be targeted primarily at projects that will generate demand for broadband, including the building of a European digital service infrastructure, which should in turn stimulate investment in broadband network deployment.”
The targeted infrastructure projects fall within the category of “economic infrastructure” as described above, but will likely involved a mix of physical infrastructure (which are typically included in data on infrastructure investment) and intangible assets, such as software (which are often not included in this data set). Whereas the focus on the energy and telecommunications sectors appears to be clearly on physical infrastructure (e.g. electricity transmission lines, broadband cables, etc.), in the transport sector there is a large focus on information systems. Nonetheless, in transport as well, physical infrastructure (the “core network”) will continue to be heavily supported by EU funds to support priority projects in rail, mixed rail-road and waterway projects. The following analysis on trends in the European infrastructure market therefore seems relevant for providing a context for the development of the trans-European networks.

Appendix A: Overview of the infrastructure market
Global market trends
Successive banking and sovereign debt crises have crippled infrastructure investment
36 Reliance Restricted Final
In H1 2013, the global project finance market has developed very differently in the various parts of the world. Traditional Western economies, both Europe and the US, experienced a decrease in deal count compared to the same period in 2012, mainly driven by the weak financial environment. Americas and Europe have respectively closed 51 deals amounting to €21 billion and 69 deals for €25 billion. Other regions saw an overall rise in both deal volume and deal value, amounting to 51 deals representing €36 billion in Asia Pacific and 28 deals amounting to €26 billion in Africa and Middle East. Global deal activity has therefore decreased from 230 in H1 2012 to 199 in H1 2013 whilst the global volume was up 32% due to a small number of significant deals such as the €15 billion Ichthys LNG project and the €13 billion Sahara complex. This increase has been predominantly supported by debt volume which has risen by around 38%. Bond financing was also popular during H1 2013, especially in Europe, as the EIB and other Member States such as the UK issued project bonds. In France, Music City of Seguin Island project in Paris reached a fast financial close (within a few weeks of preferred bidder anointment) in July 2013 with an innovative financing structure in which insurance company Allianz Global Investors will refinance a short-term bank loans after the construction phase.
Looking at infrastructure project finance by sector, oil & gas and water & sewage managed to reverse the downturn from 2011 to 2012. The increase in oil & gas is explained by the need to secure LNG supplies in the Pacific whereas the Sydney desalination project boosted the water & sewage sector. Despite a substantial decline in that year, the largest sectors by deal volume in 2012 remain oil & gas, power, transport and renewables.
In H1 2013, oil and gas deals numbered 35, representing €55 billion in investment, but supported by two important deals, Ichthys LNG project and the Sahara complex. Whilst the power sector secured 26 deals for €4 billion, transport and renewables transactions decreased respectively from 30 in H1 2012 to 21 in H1 2013 (€18 billion volume) and from 102 to 87 (€13 billion volume). The increase in telecom deals from €0.4 billion in H1 2012 to €4 billion in H1 2013 is entirely due to €3.6 billion OTAS Turk Telekom refinancing transaction in Turkey. In conclusion, whilst the number of infrastructure transactions is generally in decline, average transaction size is increasing, which is a positive sign for credit liquidity returning to the market, but in particular for big ticket transactions.
Global PF infrastructure investment by region
Source: Infrastructure Journal
0
50
100
150
200
250
300
350
0
10
20
30
40
50
60
70
80
90
2009 2010 2011 2012 2009 2010 2011 2012 2009 2010 2011 2012 2009 2010 2011 2012 2009 2010 2011 2012 2009 2010 2011 2012 2009 2010 2011 2012
Africa & ME Asia Pacific Eastern Europe Latin America North America Subcontinent Western Europe
Num
ber o
f dea
ls
Vol
ume:
e b
n
Debt Value Total deal value Deal count
Global PF infrastructure investment by sector
Source: Infrastructure Journal
0
50
100
150
200
250
300
0
10
20
30
40
50
60
70
80
2009 2010 2011 2012 2009 2010 2011 2012 2009 2010 2011 2012 2009 2010 2011 2012 2009 2010 2011 2012 2009 2010 2011 2012 2009 2010 2011 2012 2009 2010 2011 2012
Mining Oil & Gas Power Renewables Social Infrastructure Telecoms Transport Water & Sewage
Num
ber o
f dea
ls
Vol
ume:
e b
n
Debt Value Total deal value Deal count

Appendix A: Overview of the infrastructure market
European market trends
Europe has seen the steepest decline in infrastructure investment, particularly in the South
37 Reliance Restricted Final
European market trends
Overall infrastructure investment
One of the effects of the current economic and financial crisis in Europe has been the decrease of investments in infrastructure projects. Public sector funding has become more important in comparison with private sources of financing, which are impacted by the anticipation of tighter prudential requirements (Solvency 2, Basel III…). However, the EC has identified that around €2 trillion will be required in infrastructure (transport, energy and ICT) by 2030.
A recent study by McKinsey indicates that infrastructure spending in the EU amounted to an average of 2,6% of GDP from 1992 to 2011. The research implied that the total investment in infrastructure in the EU amounted to about €300 billion in 2010, split as follows
As can be seen in the graphic above, the sectors covered by the CEF of transport, energy and telecommunications represented 80% (or approximately €240 billion) of all European infrastructure investment in 2010.
Furthermore, based on various studies conducted by international organizations, the following estimates have been made concerning historical infrastructure investments in Europe in the three sectors targeted by the CEF:
► Transport: Between 2006 and 2010, total investments in transport infrastructure in the Member States amounted to €584,5 billion, as presented in the graph below:
► Energy: Between 2005 and 2009, European TSOs have invested around €9.1 million per year in network extensions and refurbishments (€5.8 million and €3.3 million for electricity projects and natural gas, respectively)
5.
► Broadband: investment in broadband in the EU amounted to €45,6 billion and €39,1 billion in 2011 and 2012, respectively.
6
5 Source: Study made by Roland Berger for DG ENER (2011).
European market trends
Europe has seen the steepest decline in infrastructure investment, particularly in the South
Total investment in infrastructure in the EU in 2010
Source: McKinsey
Transport38%
Energy23%
Water20%
Telecom19%
Total investment in EU transport infrastructure from 2006 to 2010 - values in billion and year-on-year growth
Source: OECD and EY analysis
0
10
20
30
40
50
60
70
80
2006 2007 2008 2009 2010
Cur
renc
y: €
billi
on
Road Rail Airport Ports Inland waterway
-50
-40
-30
-20
-10
0
10
20
30
40
2006 2007 2008 2009 2010
Per
cent
age
Road Rail Airport Ports Inland waterway
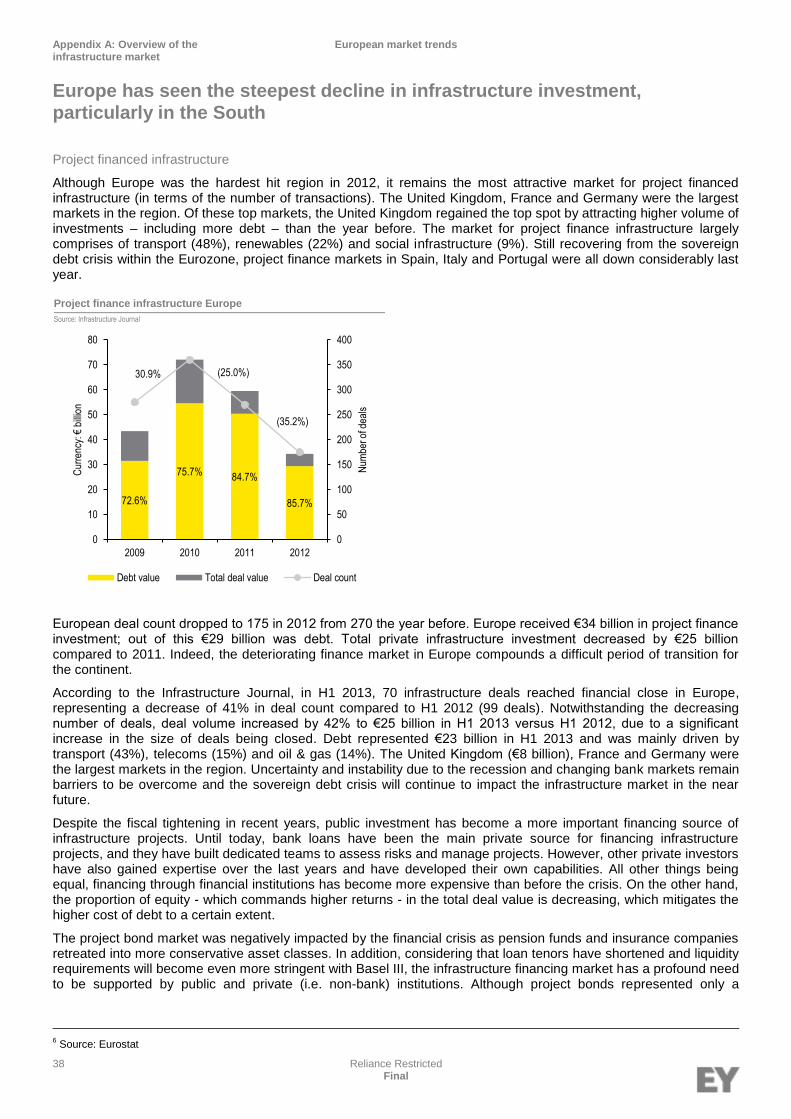
Appendix A: Overview of the infrastructure market
European market trends
Europe has seen the steepest decline in infrastructure investment, particularly in the South
38 Reliance Restricted Final
Project financed infrastructure
Although Europe was the hardest hit region in 2012, it remains the most attractive market for project financed infrastructure (in terms of the number of transactions). The United Kingdom, France and Germany were the largest markets in the region. Of these top markets, the United Kingdom regained the top spot by attracting higher volume of investments – including more debt – than the year before. The market for project finance infrastructure largely comprises of transport (48%), renewables (22%) and social infrastructure (9%). Still recovering from the sovereign debt crisis within the Eurozone, project finance markets in Spain, Italy and Portugal were all down considerably last year.
European deal count dropped to 175 in 2012 from 270 the year before. Europe received €34 billion in project finance investment; out of this €29 billion was debt. Total private infrastructure investment decreased by €25 billion compared to 2011. Indeed, the deteriorating finance market in Europe compounds a difficult period of transition for the continent.
According to the Infrastructure Journal, in H1 2013, 70 infrastructure deals reached financial close in Europe, representing a decrease of 41% in deal count compared to H1 2012 (99 deals). Notwithstanding the decreasing number of deals, deal volume increased by 42% to €25 billion in H1 2013 versus H1 2012, due to a significant increase in the size of deals being closed. Debt represented €23 billion in H1 2013 and was mainly driven by transport (43%), telecoms (15%) and oil & gas (14%). The United Kingdom (€8 billion), France and Germany were the largest markets in the region. Uncertainty and instability due to the recession and changing bank markets remain barriers to be overcome and the sovereign debt crisis will continue to impact the infrastructure market in the near future.
Despite the fiscal tightening in recent years, public investment has become a more important financing source of infrastructure projects. Until today, bank loans have been the main private source for financing infrastructure projects, and they have built dedicated teams to assess risks and manage projects. However, other private investors have also gained expertise over the last years and have developed their own capabilities. All other things being equal, financing through financial institutions has become more expensive than before the crisis. On the other hand, the proportion of equity - which commands higher returns - in the total deal value is decreasing, which mitigates the higher cost of debt to a certain extent.
The project bond market was negatively impacted by the financial crisis as pension funds and insurance companies retreated into more conservative asset classes. In addition, considering that loan tenors have shortened and liquidity requirements will become even more stringent with Basel III, the infrastructure financing market has a profound need to be supported by public and private (i.e. non-bank) institutions. Although project bonds represented only a
6 Source: Eurostat
Project finance infrastructure Europe
Source: Infrastructure Journal
72.6%
75.7% 84.7%
85.7%
30.9% (25.0%)
(35.2%)
0
50
100
150
200
250
300
350
400
0
10
20
30
40
50
60
70
80
2009 2010 2011 2012
Num
ber o
f dea
ls
Cur
renc
y: €
billi
on
Debt value Total deal value Deal count

Appendix A: Overview of the infrastructure market
European market trends
Europe has seen the steepest decline in infrastructure investment, particularly in the South
39 Reliance Restricted Final
negligible part of the market in H1 2013, there have been several deals closed with project bonds (public issue or private placement) in Q3 2013, signaling an uplift in this type of financing.
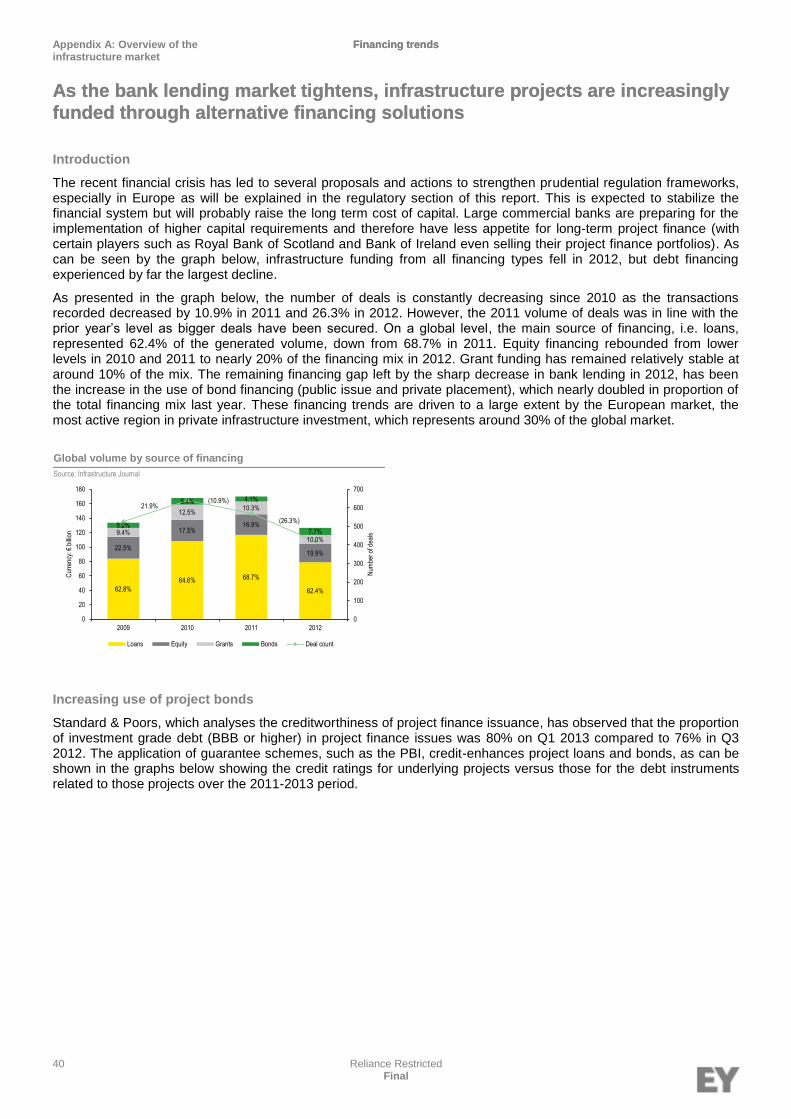
Appendix A: Overview of the infrastructure market
Financing trends
As the bank lending market tightens, infrastructure projects are increasingly funded through alternative financing solutions
40 Reliance Restricted Final
Introduction
The recent financial crisis has led to several proposals and actions to strengthen prudential regulation frameworks, especially in Europe as will be explained in the regulatory section of this report. This is expected to stabilize the financial system but will probably raise the long term cost of capital. Large commercial banks are preparing for the implementation of higher capital requirements and therefore have less appetite for long-term project finance (with certain players such as Royal Bank of Scotland and Bank of Ireland even selling their project finance portfolios). As can be seen by the graph below, infrastructure funding from all financing types fell in 2012, but debt financing experienced by far the largest decline.
As presented in the graph below, the number of deals is constantly decreasing since 2010 as the transactions recorded decreased by 10.9% in 2011 and 26.3% in 2012. However, the 2011 volume of deals was in line with the prior year’s level as bigger deals have been secured. On a global level, the main source of financing, i.e. loans, represented 62.4% of the generated volume, down from 68.7% in 2011. Equity financing rebounded from lower levels in 2010 and 2011 to nearly 20% of the financing mix in 2012. Grant funding has remained relatively stable at around 10% of the mix. The remaining financing gap left by the sharp decrease in bank lending in 2012, has been the increase in the use of bond financing (public issue and private placement), which nearly doubled in proportion of the total financing mix last year. These financing trends are driven to a large extent by the European market, the most active region in private infrastructure investment, which represents around 30% of the global market.
Increasing use of project bonds
Standard & Poors, which analyses the creditworthiness of project finance issuance, has observed that the proportion of investment grade debt (BBB or higher) in project finance issues was 80% on Q1 2013 compared to 76% in Q3 2012. The application of guarantee schemes, such as the PBI, credit-enhances project loans and bonds, as can be shown in the graphs below showing the credit ratings for underlying projects versus those for the debt instruments related to those projects over the 2011-2013 period.
Financing trends
As the bank lending market tightens, infrastructure projects are increasingly funded through alternative financing solutions
Global volume by source of financing
Source: Infrastructure Journal
62.8%
64.6% 68.7%
62.4%
22.5%
17.5% 16.9%
19.9%
9.4%
12.5% 10.3%
10.0%
5.2%
5.4% 4.1%
7.7%
21.9%(10.9%)
(26.3%)
0
100
200
300
400
500
600
700
0
20
40
60
80
100
120
140
160
180
2009 2010 2011 2012
Num
ber o
f dea
ls
Cur
renc
y: €
billi
on
Loans Equity Grants Bonds Deal count

Appendix A: Overview of the infrastructure market
Financing trends
As the bank lending market tightens, infrastructure projects are increasingly funded through alternative financing solutions
41 Reliance Restricted Final
Europe/Middle Eastern Project Finance Underlying Ratings Distribution 2011-20131
Source: S&P project finance report
Europe/Middle Eastern Project Finance Long-Term Issue Ratings Distribution 2011-20131
Source: S&P project finance report
1. 95% of all S&P EMEA project finance ratings are located in Europe.
Debt capital markets - Cost of funds comparison to loans
As we will try to show in the following sections, debt capital market funding (bonds) tends to be cheaper than bank loan funding in normal market conditions. If European infrastructure capex can be funded with lower credit spreads simply by accessing a deeper and more liquid pool of capital, billions of euros can be saved for reinvestment in new infrastructure projects rather than expended as a finance expense.
Comparing credit spreads
On a corporate basis, the depth and liquidity of debt capital markets tends to compress credit spreads in comparison with bank loans. Even amongst privately placed and publicly listed bonds, the illiquidity premium for unlisted bond issuance tends to be around 30 bps. Taking into consideration all-in interest costs (that is, accounting for underlying benchmarks), the competitiveness of capital market funding tends to increase further. (See section entitled “Adjusting spreads for benchmark rates”, below).
Given the lack of available data on project bonds in Europe, we have used issuances of corporate bonds by companies operating in comparable infrastructure sectors (water, power, transportation and oil and gas) as a proxy for this analysis. It is beyond the remit of this study to examine the full range of factors influencing the credit spreads of project loans and comparable corporate bonds. However, a comparison of the two is instructive to better ascertain the potential cost advantage that project bonds may represent versus traditional project financing. The graph below compares the margins for project finance loans to the spreads of bonds issued by corporates in Europe between 2010 and 2013 year-to-date.
On average, across tenors and credit quality, bank loan margins have been higher than bond credit spreads. In 2013 to date, average loan credit spreads were 87 bps higher than those for comparable corporate bonds.
0
10
20
30
40
50
60
70
AAA AA A BBB BB B CCC CC C D
Num
ber o
f iss
ues
Q1 2013 Q4 2012 Q3 2012 Q2 2012 Q1 2012 Q4 2011 Q3 2011 Q2 2011 Q1 2011
0
10
20
30
40
50
AAA AA A BBB BB B CCC CC C D
Num
ber o
f iss
ues
Q1 2013 Q4 2012 Q3 2012 Q2 2012 Q1 2012 Q4 2011 Q3 2011 Q2 2011 Q1 2011

Appendix A: Overview of the infrastructure market
Financing trends
As the bank lending market tightens, infrastructure projects are increasingly funded through alternative financing solutions
42 Reliance Restricted Final
Notes to chart: 2013 year-to-date (September 2013)
Adjusting spreads for credit quality
The credit quality of the infrastructure-related corporate bonds we have analyzed is spread as follows:
Average spread by credit rating Average spread by year (BBB bond rating category only)
Source: Thomson Reuters Source: Infrastructure Journal, loanconnector, Thomson Reuters
Notes to chart: 2013 year to date (September 2013)
Even where corporate bond credit spreads are conservatively adjusted for credit quality, they have remained on average 47 bps lower than project loan spreads, as presented in the chart above to the right. Most non-recourse projects are structured to a low investment grade (‘BBB’/‘Baa’ category) rating level, but many are then fully or partially credit enhanced to at least an ‘A’ category or above by monoline insurance or government support. Indeed, as of Q1 2013, S&P maintained 44 project finance long-term issue ratings in the ‘BBB’ category, 15 in the ‘A’ category and 26 in the ‘AA’ category. Where we conservatively compare all project loans (including those in the ‘A’ and ‘AA’ categories) to bonds issued by infrastructure-related corporates only in the ‘BBB’/‘Baa’ ratings category, bond credit spreads are still on average lower by 47 bps over the past four years.
If we consider an typical infrastructure debt investment with an average bullet tenor of 20 years, this 47 bps credit spread reduction presents a cash savings of 9,4% versus bank financing (unadjusted for inflation or the time value of money). Considering that the annual value of European project finance deals in the CEF sectors of transport, energy networks and telecoms has over the last years been between €20 and €40 billion, the potential annual savings of financing these projects with bonds amounts in the billions of euros. This is money (avoided financial expense) that lowers projects’ weighted average cost of capital and should lead directly to lower costs to individuals as consumers (e.g. through lower infrastructure usage charges) or as taxpayers (through reduced levels of support from the public sector).
Whilst we have not adjusted for loan amortisation, we note that such amortisation shortens average loan life compared to 20 year bullet maturity bonds. Given that average loan life is often used to estimate the reference rate for pricing, the bonds look even ‘cheaper’ on a risk-adjusted basis. In other words, the credit spreads on bonds tend to be tighter than for project loans even though there is an inherent higher ‘tail’ risk versus the latter.
0
50
100
150
200
250
300
350
400
2010 2011 2012 2013
Spr
ead
to b
ench
mar
k (b
ps)
Avg. loan spread Avg. bond spread
0
50
100
150
200
250
300
350
400
2010 2011 2012 2013
Spr
ead
to b
ench
mar
k (b
ps)
Avg. loan spread Avg. bond spread
0
50
100
150
200
250
300
A+ A A- BBB+ BBB BBB-
Spr
ead
to b
ench
mar
k (b
ps)
Avg. spread to benchmark
Average spread by year
Source: Infrastructure Journal, loanconnector, Thomson Reuters

Appendix A: Overview of the infrastructure market
Financing trends
As the bank lending market tightens, infrastructure projects are increasingly funded through alternative financing solutions
43 Reliance Restricted Final
Adjusting spreads for tenor
In examining bond and loan spreads by tenor, bonds still demonstrate a marked cost advantage across the maturity spectrum. The illustration below reflects loans and bonds issued from 2010 to 2013. In the 10-15 year category, loan spreads are 163 bps above those of comparable bonds. On average, from 2010 to 2013, across all tenors (not weighted by issue size), loan spreads were 97 bps above those of comparable bonds.
Again, conservatively adjusting for credit quality by restricting the analysis to bonds issued by ‘BBB’ category rated corporates, we note that whilst spread differentials flattened, they were still 54 bps on average across all tenors.
We note that loan spreads are marginally lower for the ‘BBB’ category in the 15-20 year tenor. However, we must emphasize that in this illustration we are conservatively comparing only ‘BBB’ category bond spreads to loan spreads of all rating categories (including higher rated loans).
Adjusting spreads for benchmark rates7
In our analysis above, we have only considered the credit spread differentials for bonds and loans. When we also consider the differential in underlying benchmarks – sovereign rates (yield on sovereign bonds) and swap rates (i.e. short term interbank rates swapped to longer durations) – the cost advantage of bond funding increases further for euro-denominated and short- to medium-term sterling denominated funding.
We note from the euro graph below that the spread between the euro swap rates and Bund yields8 is consistently
positive. In other words, using EURIBOR as a benchmark is consistently more expensive than the Eurozone bond
7 We have performed this comparison for Euro-denominated and Sterling-denominated transactions, which represent ca. 90% of the datasets used for the project loan data and corporate bond data for the credit spread analysis, respectively. Given the limited scope of this analysis, we have not fully adjusted for the specific geographic spread of the two datasets, however they are in our opinion sufficiently comparable.
0
50
100
150
200
250
300
350
400
0 - 5 yrs 5 - 10 yrs 10 - 15 yrs 15 - 20 yrs 20 - 25 yrs 25 - 30 yrs
Spr
ead
to b
ench
mar
k (b
ps)
Avg. loan spread Avg. bond spread
0
50
100
150
200
250
300
350
400
0 - 5 yrs 5 - 10 yrs 10 - 15 yrs 15 - 20 yrs 20 - 25 yrs 25 - 30 yrs
Spr
ead
to b
ench
mar
k (b
ps)
Avg. loan spread Avg. bond spread
Average spread by tenor
Source: Infrastructure Journal, loanconnector, Thomson Reuters
Average spread by tenor (BBB bond rating category only)
Source: Infrastructure Journal, loanconnector, Thomson Reuters

Appendix A: Overview of the infrastructure market
Financing trends
As the bank lending market tightens, infrastructure projects are increasingly funded through alternative financing solutions
44 Reliance Restricted Final
benchmark (Bund), even at the very long end of the swap curve. At the 15 year tenor, the sovereign rate applicable to bond pricing is 23 bps tighter than the euro swap rate used by project loans. The differential becomes even larger when one considers the swap margin applied by banks on project loans. This exacerbates the all-in pricing differential between bank loans and bond financing for infrastructure.
The sovereign rates curve we use in the illustration below (“EUR Sovereign Curve”) is the yield curve for Bunds. The Euro Swaps Curve used in the illustration below represents the fixed rate obtained when swapping EURIBOR at the different tenors noted.
Historically, we note a high degree of volatility in the Euro swap spread (i.e. difference with Bund yields). However, in examining the trend in Euro swap rates since January 2011 across different tenors (5, 10, 15, 20 and 30 years, illustrated in the graph below), we see that over the course of the past 33 months the Euro swap spread has only been negative for very brief periods (a matter of days) for the 20 and 30 year tenors. This historical analysis lends support to our conclusion that all-in bond pricing for infrastructure corporate debt is consistently less than that for project loans of comparable tenor and credit quality.
The evidence on the Sterling swap spread is less conclusive. When considering Sterling swap spreads over the past two years, in general swap spreads have been positive for 15 year tenors and shorter, but the relationship inverts, i.e. the Pound swaps curve is less expensive than the yield on the UK Gilt, for tenors longer than 15 years. Over the past 12 months, the swap spread differentials have tightened, and the cost advantage of the sovereign benchmark rate versus the swap rate has significantly diminished to a point where the difference between the two is minimal, particularly for 10-20 year tenors where most infrastructure projects are financed.
8 The German government bond (the “Bund”) is typically used as the reference benchmark rate for pricing Euro-denominated bonds, as it is the most liquid bond market in the Eurozone. For specific deals, there may be an exception to this rule and the yield on the local sovereign bond may be used, e.g. because of bond investor affinity, however the Bund is usually used to mitigate i.a. pricing uncertainty.
-10
0
10
20
30
40
50
60
-1
0
1
2
3
4
5
6
Spr
ead
(bps
)
Yie
ld
Euro Swaps Curve EUR Sovereign Curve Spread
Euro swap rates and sovereign rates
Source: Bloomberg (1 October 2013)
-60
-40
-20
0
20
40
60
-6
-4
-2
0
2
4
6
2013
2017
2021
2025
2029
2033
2037
2041
2045
2049
2053
2057
2061
Spr
ead
(bps
)
Yie
ld
British Pound Swaps Curve GBP Sovereign Curve
Spread
Sterling swap rates and sovereign rates
Source: Bloomberg (1 October 2013)
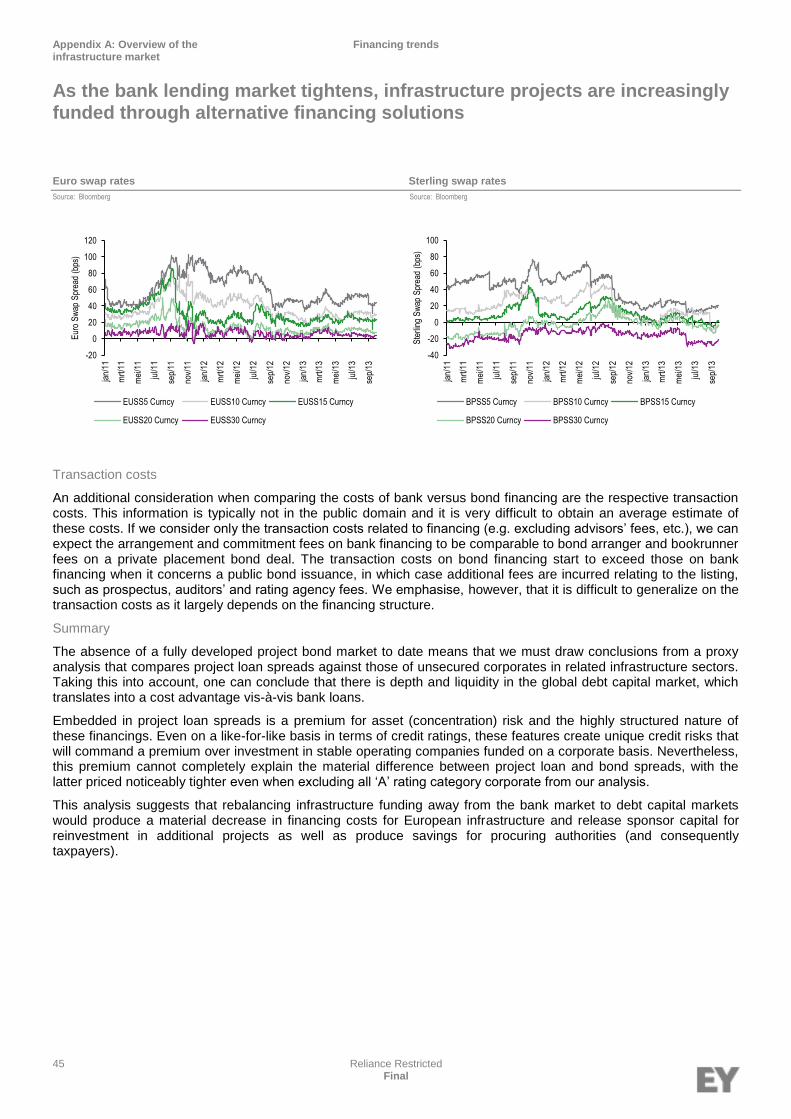
Appendix A: Overview of the infrastructure market
Financing trends
As the bank lending market tightens, infrastructure projects are increasingly funded through alternative financing solutions
45 Reliance Restricted Final
Euro swap rates Sterling swap rates
Source: Bloomberg Source: Bloomberg
Transaction costs
An additional consideration when comparing the costs of bank versus bond financing are the respective transaction costs. This information is typically not in the public domain and it is very difficult to obtain an average estimate of these costs. If we consider only the transaction costs related to financing (e.g. excluding advisors’ fees, etc.), we can expect the arrangement and commitment fees on bank financing to be comparable to bond arranger and bookrunner fees on a private placement bond deal. The transaction costs on bond financing start to exceed those on bank financing when it concerns a public bond issuance, in which case additional fees are incurred relating to the listing, such as prospectus, auditors’ and rating agency fees. We emphasise, however, that it is difficult to generalize on the transaction costs as it largely depends on the financing structure.
Summary
The absence of a fully developed project bond market to date means that we must draw conclusions from a proxy analysis that compares project loan spreads against those of unsecured corporates in related infrastructure sectors. Taking this into account, one can conclude that there is depth and liquidity in the global debt capital market, which translates into a cost advantage vis-à-vis bank loans.
Embedded in project loan spreads is a premium for asset (concentration) risk and the highly structured nature of these financings. Even on a like-for-like basis in terms of credit ratings, these features create unique credit risks that will command a premium over investment in stable operating companies funded on a corporate basis. Nevertheless, this premium cannot completely explain the material difference between project loan and bond spreads, with the latter priced noticeably tighter even when excluding all ‘A’ rating category corporate from our analysis.
This analysis suggests that rebalancing infrastructure funding away from the bank market to debt capital markets would produce a material decrease in financing costs for European infrastructure and release sponsor capital for reinvestment in additional projects as well as produce savings for procuring authorities (and consequently taxpayers).
-20
0
20
40
60
80
100
120
jan/
11
mrt
/11
mei
/11
jul/1
1
sep/
11
nov/
11
jan/
12
mrt
/12
mei
/12
jul/1
2
sep/
12
nov/
12
jan/
13
mrt
/13
mei
/13
jul/1
3
sep/
13
Eur
o S
wap
Spr
ead
(bps
)
EUSS5 Curncy EUSS10 Curncy EUSS15 Curncy
EUSS20 Curncy EUSS30 Curncy
-40
-20
0
20
40
60
80
100
jan/
11
mrt
/11
mei
/11
jul/1
1
sep/
11
nov/
11
jan/
12
mrt
/12
mei
/12
jul/1
2
sep/
12
nov/
12
jan/
13
mrt
/13
mei
/13
jul/1
3
sep/
13
Ste
rling
Sw
ap S
prea
d (b
ps)
BPSS5 Curncy BPSS10 Curncy BPSS15 Curncy
BPSS20 Curncy BPSS30 Curncy

Appendix A: Overview of the infrastructure market
Financing trends
First loss provision might be reduced by a merger of the different budgets
46 Reliance Restricted Final
Opportunity arising from the different EU budgets
The close cooperation between the EU and the EIB has enabled the implementation of risk-sharing instruments (e.g. the PBI) which aim to leverage existing resources. Under the PBI, the risk-sharing between the EC and the EIB follows a portfolio First Loss Piece (FLP) model, where the first losses on the portfolio (not per project) are incurred by the EC (up to a predetermined percentage) while the EIB retains the remaining risks. The objectives pursued are, amongst other, to optimize the multiplier effect and the EIB’s financing capacity. As a result, the combination of the (i) more transactions entered in this portfolio and (ii) more diversification achieved make the probability of default of the portfolio lower. However, for the time being, each of the three DG’s receive budgetary resources, which are managed separately from the others.
The PBI like other risk-sharing financial instruments, represents the most visible part of the joint intervention of the EU and EIB. Their use will be further expanded in the coming years under several programs such as the Connecting Europe Facility (CEF). The CEF aims to ensure the largest value added by striving to (i) optimize the portfolio of instruments available, (ii) standardize the operational rules, and (iii) capitalize on possible synergies. However, the current EU budgets separation (transport, energy and ICT/broadband) might not enable to achieve the highest optimization and might create inefficiencies due to the independency of each budget. This results in a higher correlation between the various projects of each individual first-loss piece contribution and this low diversification requires the EU to increase its global provision.
These three sectors are not perfectly correlated as these pursue different priorities and face different constraints and policy frameworks. Even if the ICT sector might be the most linked to economic growth in the coming years, we cannot predict which of these will attract the majority of investors going forward. Instead of having the EU resources allocated to the three different sectors, potential diversification benefits might be achieved by merging the individual first-loss piece contributions in order to pool the risks. This pooling of risks might allow for a better diversification which would result in more leverage with less resources.
As demonstrated by the Modern Portfolio Theory, established by Harry Markowitz, the portfolio diversification refers to the strategy of reducing risks via the combination of different types of assets. Given (i) the assumed imperfect correlation between transport, energy and broadband which means that there is less tendency for these sectors to evolve similarly and (ii) the fact that these represent three separate sectors presenting their own specific risks, a greater diversification could be achieved by merging their first-loss piece contributions. The separate results generated on each of these sectors will reduce the volatility of the portfolio, i.e. the volatility will be inferior to the weighted sum of the individual first-loss piece contributions. This reduction in volatility and in the risk of losses might enable the EU to set aside a lower provision for the FLP by obtaining a higher leverage from its resources.
First loss provision might be reduced by a merger of the different budgets

Appendix A: Overview of the infrastructure market
Sector focus
Each infrastructure sector has specific requirements and risks
47 Reliance Restricted Final
Introduction
The Project Bond Initiative is focused on three sectors of transport, energy and broadband/ICT. These sectors have fundamentally different characteristics which impact investment and attractiveness for investors. Whereas transport and energy have long track records of project financing, there are few examples of broadband/ICT being financed on a non-recourse basis. We will cover sector-specific issues of these sectors further below.
Transport
Investment in transport infrastructure is vital for the transport sector in order to support the economic growth but this often requires approval from the government and a long planning process. The European reality, i.e. the fact that each country has its own transport regulation, can impede cross national projects.
In 2012, project finance in the EU transport sector suffered from the economic crisis and wiped out the increase recorded from 2009 to 2011. Main EU markets including, amongst others, Germany, Spain and Portugal decreased significantly. The most active countries in the sector were France and the UK. France, however, experienced a decrease in investment value in 2012. Other European markets, including Belgium and Italy, also experienced a decline in deal value. By contrast, neighboring Russia performed better than the average. Most new transport investment is expected to take place in northern Europe and should concern brownfield airport projects and the rail sector. According to the Infrastructure Journal, road projects are currently negatively impacted due to the following reasons:
► Lack of public funding
► Lack of pipeline
► Greater awareness of traffic risk
► Increasing bank liquidity requirements
Other issues that investors have to deal with when considering an infrastructure project are the public opposition, permitting issues and environmental concerns.
Despite economic restrictions, state budgets are the main contributor to transport infrastructure. In order to maximize the return on transport assets, governments have expanded the traditional fare and toll fee schemes to the privatisation of these assets. This could support the investment growth in the long term but the pipeline is unlikely to be affected in the coming months. As from 2014, investment in transport infrastructure should increase as government initiatives are implemented, such as UK PF2 model and the Dutch initiative, Netherlands Investment Institution (NII).
Sector focus
Each infrastructure sector has specific requirements and risks
National initiatives to support infrastructure investment in Europe
The British initiative, “UK’s Intercity Express Programme”, realized with the cooperation of traditional banks, demonstrates that long term project finance with traditional funding remains feasible given the proper alignment of interests (e.g. the large support of Japanese banks for a Japanese sponsor, Hitachi). This approach has been implemented to overcome the weaknesses of the PFI model, initially introduced to involve private finance in public infrastructure and services. The key themes can be summarized as follows:
► Equity structure and credit enhancement: PF2 aims to reduce the leverage for projects from 90:10 debt to equity ratio to around 75:25
► Acceleration of delivery: The British government wants to reduce the procurement period and make it cheaper
► Service provision: The scope of eligible contracts has been reduced to improve the flexibility
► Risk transfer: Ensure the greater risk retention within the public sector
► Increase the transparency (publishing annual report, etc)
In the Netherlands, the government plans to invest €40 billion in infrastructure. The structure implemented will act as an intermediary between pension funds and insurance companies, financiers and banks.

Appendix A: Overview of the infrastructure market
Sector focus
Each infrastructure sector has specific requirements and risks
48 Reliance Restricted Final
Energy
The EU energy market
The EU is facing multiple energy challenges, which are far more complex than those of emerging markets or developed markets such as the US. The EU accounts for one-fifth of the global energy consumption, and it is the largest importer of energy in the world – in 2010 the EU-27 region imported almost 55% of its energy requirement (gross inland energy consumption was 1.759 million tons of oil equivalents (Mtoe) whereas total production was 831 Mtoe ).
The main challenges faced for the EU energy market are:
► High reliance on energy imports
► Absence of a single energy market
► Obsolete energy infrastructure and a legacy of low investment
We conducted a closer examination of each of these three main challenges below.
High reliance on energy imports
It is estimated that by 2035, 80% of EU crude oil and gas requirements will have to be met through imports. The EU spends €406 billion annually on its energy imports, which account for 55% of its energy requirements. The EU is highly dependent on oil for meeting its energy needs. Approximately 35% of the EU’s gross inland consumption is sourced from oil while 24% comes from gas. This mix varies widely across countries and has evolved over time due to their geographical conditions, such as the availability and access to natural resources and national policy choices. Furthermore, high dependence on conventional energy sources has made the region vulnerable to global commodity prices. According to the International Energy Agency’s (IEA) industrial price index, electricity prices have increased by 37% from 2005 to 2012. Additionally, one-third of the region’s imports are sourced from Russia, which leaves the EU susceptible to geo-political threats.
Absence of single energy market
This heavy reliance on external sources for meeting energy demands leaves energy-intensive industries in Europe at a competitive disadvantage compared to these industries in the U.S., where the price of natural gas is one third of that in the EU and the price of electricity is half of that in the EU. According to the IEA, this disadvantage will result in a 10% drop of the EU share of the global market for energy-intensive goods by 2035. This disadvantage is further aggravated by the lack of integration of the EU energy markets. Some countries are not able to access idle power due to insufficient transmission infrastructure, and there is no common energy tariff framework. Some Member States find themselves on an ‘energy island’ as a result of insufficient infrastructure connections to transport surplus power to them. EU Member States have highly variable energy taxes ranging from 50% of energy prices in Denmark to around 10% in Britain.
Obsolete infrastructure and low investments in energy sector
The EU energy market has an aging power infrastructure in a period of high sovereign debt and tightening public budgets, which is shifting back investment plans. Replacement will be required in the medium term. It is estimated that by 2020, 20% of coal-based power plants will retire and by 2025, more than 250 GW of power generation capacity will warrant replacement. Many European power utilities have frozen their investment plans in the face of an increasing debt burden and the challenge to their traditional business model from renewable energy.
The energy grid in the EU thus requires massive investment. Today, however, the main source of funding for the transmission grid is the balance sheet of the transmission system operators (TSO), which are often wholly or partly owned by national governments, who currently face constrained budgets. Europe will probably face a shortfall in funding for its energy network over the next decade. It is clear that new sources of financing for energy infrastructure, such as institutional investors and other private investors, will need to step in to finance energy infrastructure projects.
EU energy consumption mix (2011)
Source: European Commission

Appendix A: Overview of the infrastructure market
Sector focus
Each infrastructure sector has specific requirements and risks
49 Reliance Restricted Final
As outlined by both ENTSO-G (European Network of Transmission System Operators for Gas) and ENTSO-E (European Network of Transmission System Operators for Gas), the decarbonisation of Europe’s energy system requires the transmission network to be expanded and strengthened. Whilst the European single market for energy has further integrated and become more competitive in the past years, amongst others due to increased investment in energy infrastructure by Member States and subsequent expansion of the cross-border gas and electricity networks, the current rate of investment is estimated to still be insufficient to achieve the Europe’s 2020 targets.
Expansion of energy transmission networks tend to face opposition from energy consumers who will inevitably bear much of the cost of these infrastructure investments. Other barriers to investment include problems related to permit-granting procedures, financing, and to a lesser extent, the regulatory framework. The EC is trying to overcome the obstacles to investment in the energy transmission network by working with ENTSO-E, ENTSO-G and other NGO’s to educate European energy consumers about the benefits of improvements in the grid. Furthermore, the EC has streamlined the permit-granting procedures and financing support to accelerate the development of TEN-E energy corridors and projects of common interest (PCI). The current focus of the TEN-E’s PCIs is to develop the ‘missing links’ in the European electricity grid in order to create better interconnections between national energy markets. The PCIs are focused on the following objectives:
► Investments in the electricity grids are needed to adapt the transmission networks to volatile flows and the geographical distances between the producers and consumers. However, the so-called ‘electricity highways’ may face congestion problems if not implemented correctly.
► In the gas sector, additional investments in, amongst others, cross-border pipelines, reverse-flow infrastructure and LNG terminals could be a precondition to facilitate the supply, especially in Eastern Europe and in the Baltic states.
► Regarding oil infrastructure, investment in conversion capacity should continue to increase to adapt to market developments.
► Further investments in biofuels infrastructure to compensate the expected reduction in oil demand.
Another factor that can have substantial influence on infrastructure investment in the energy sector is the EU unbundling directive which aims to separate TSO activities from generation, production and supply in order to protect the electricity market from anti-competitive actions and to enable all market players to be able to use the transmission networks in place. The purpose is (i) ensure that TSO take their decisions independently and (ii) avoid any discrimination towards network users. The recently closed PBI pilot phase project, Greater Gabbard OFTO, was in fact the financing of the acquisition of the offshore energy transmission assets by a group of infrastructure investors following the unbundling of the transmission stations and lines from the offshore wind generation assets.
Meeting the energy challenges
The introduction of smart grids and the implementation of electricity highways are of crucial importance to address the EU’s energy issues. Private technology research centres such as i.a. ECN, IMEC and CEA have recognized this need and technology research is focusing increasingly on smart grid and mega-grid technology. A European Energy Research Alliance (EERA) has been formed by numerous research institutions from the private sector together with universities across Europe to increase cooperation and coordination between member states. The EERA is part of the European Strategic Energy Technology Plan. The Joint Research Programmes laid out by this Alliance show clearly the focus of today’s energy technology research, namely energy efficiency smart grids, renewable energy storage and carbon capture and storage. Renewable energy remains a strong focus point of private technology research centres, as low-carbon resources can strengthen the competitiveness of the EU area by helping reduce energy prices and providing energy security, and can help address climate challenges. The EERA aims to develop partnerships with the industry to strengthen the link between research outcomes and innovation. A third point that the research institutes focus on is the use of power by consumers and the energy efficiency needed to reach the goal of a decreasing energy demand. Researchers are developing and optimizing technologies such as electrical cars.
Required investments in European energy infrastructure
The EC estimates that energy investments of €1 trillion will be needed over the next ten years to both diversify existing resources, replace equipment and service challenging and changing energy requirements. These challenges are significant and needs to be handled in a cohesive manner.
Appendix A: Overview of the infrastructure market
Sector focus
Each infrastructure sector has specific requirements and risks
50 Reliance Restricted Final
ICT/broadband
In broadband technological factors play a more important role than in other infrastructure sectors and competitive dynamics usually take a different form. Furthermore, most ICT/broadband infrastructure in Europe has historically been funded by the balance sheets of telecom providers, rather than through non-recourse project finance.
Telecoms services are provided over various types of networks with different performance features. While in the EU DSL (Digital Subscriber Line) connections over legacy copper networks still account for the majority of lines in the fixed line retail broadband market (over 70% of lines in use)9, other technologies exist or are emerging as part of the move towards fast and ultra-fast ‘next generation access’ (NGA) networks. Other technologies include upgraded cable networks which serve a substantial share of customers in many EU markets (somewhat less than 20% of fixed EU broadband lines in use and over half of all NGA lines), but also VDSL and increasingly FTTB/H (fibre-to-the-building/-home). The latter involves the greatest proportion of fibre in the last-mile segment of the network and is seen as the fastest and best-performing technology. VDSL offers intermediate speeds (faster than traditional ADSL, slower than FTTB/H) and equipment vendors are currently trialling sophisticated solutions to further enhance its performance. In mobile, network development is mainly driven by the evolutionary cycle of mobile broadband technologies as is illustrated by the current transition from 3G to 4G. At the end of 2012, c. 93% of EU homes were able to subscribe to DSL products whereas high-speed cable, VDSL and FTTB/H covered c. 39%, c. 25% and c. 12% of homes, respectively10. Coverage with HDSPA (3G) mobile connectivity was around 96% and 4G was available to 27% of homes. With respect to take-up, the EU outperforms the OECD average in terms of basic broadband penetration, but trails other developed markets in terms of penetration with very high speed fibre lines.
The economics of next generation broadband roll-out revolve by and large around cost, demand, technology and competitive dynamics. In all Member States alike, roll-out costs and commercial viability are highly correlated with population density, above all in fixed line networks where roll-out costs per line for a rural farm are a multiple of those in a dense urban cluster. The business case is also influenced by the choice between several technologies with different performance features, life-spans and cost structures. The fact that the capabilities of some technologies evolve continuously (4G mobile and attempts to enhance the performance of VDSL are a case in point) adds to uncertainty over the commercial implications of alternative roll-out paths.
Costs and technologies also have a strong influence on the nature of competition in a set roll-out area. In large parts of national territories with moderate to low population density, fixed broadband networks represent a bottleneck/natural monopoly infrastructure, whereas in some clusters (mostly urban and dense sub-urban) cost structures may allow for co-existence of more than one fixed network. Consequently, several competitive scenarios may emerge at the infrastructure level: depending on the area in question, two (or sometimes more) fixed networks may compete with each other (e.g. nowadays often cable and copper/DSL) and to some extent with mobile (an imperfect substitute) or infrastructure competition may be confined to fixed vs. mobile only.
At the retail level, the set of service providers that compete for end users often not only comprises vertically integrated network operators (i.e. those that both own/run the underlying infrastructure and market retail services), but also competitors that rely on regulated and wholesale access to the network infrastructure of dominant operators. Such access can be imposed by National Regulatory Authorities (NRAs) in accordance with the EU regulatory framework for electronic communications networks and services. Under this framework NRAs are responsible for defining and analysing electronic communications markets. If, as a result of this process, NRAs find a given market not to be effectively competitive, meaning that they have found that one of the market players has significant market power (SMP) on that market, which in telecoms usually derives from the specific cost structure at the network level), they impose regulatory obligations on that undertaking which can include inter alia mandatory access to services and networks, price control, transparency, and non-discrimination obligations. These regulatory obligations can only be imposed on an operator that has been found to have SMP, and only if they are seen as necessary to remedy the identified persistent market failure.
For operators that are subject to SMP regulation, the recent EC Recommendation on consistent non-discrimination obligations and costing methodologies enhances the broadband investment environment by ensuring regulatory predictability and by setting-out clear conditions which may justify withdrawal or non-imposition of ex-ante price controls for regulated next generation broadband access networks.
The Digital Agenda for Europe (DAE) is one of the seven flagship initiatives of EU 2020 which aims to stimulate the digital economy and address economic and social challenges through ICT. Alongside other objectives, the DAE
9 Source: European Commission, Digital Agenda Scoreboard report, chapter on broadband markets, https://ec.europa.eu/digital-
agenda/node/30065 10
Source: see previous footnote

Appendix A: Overview of the infrastructure market
Sector focus
Each infrastructure sector has specific requirements and risks
51 Reliance Restricted Final
recognizes the role of fast and ultra-fast broadband access as a platform for innovation and growth and sets corresponding targets for broadband coverage and take-up; (i) making basic broadband access available to all Europeans by 2013 (99.4% at the end of 2012, recently full coverage achieved), (ii) making available access to much higher internet speeds of above 30 Mbps to all Europeans by 2020 (achieved at ca. 54% to date) and (iii) ensuring that by 2020 50% of Europeans households subscribe to internet speeds of 100 Mbps or higher (currently ca. 2%).
According to various estimates, these targets may require total investments amounting to more than €200 billion. Currently, private investors are hesitant to support plans for increased investment in broadband networks by telecom operators because of the following reasons:
► High commercial uncertainty associated with monetisation of benefits of the NGA network roll-out outside densely populated areas
► Uncertainty with respect to technology, competitive situation and future demand
► Long pay back periods
► Class confusions (some networks are rolled out as pure infrastructure, and some as part of vertically integrated business) resulting in broadband is still being considered as an emerging asset class (versus more mature transport and energy sectors)
However, overall the modernisation of network infrastructure in the European broadband market may create investment opportunities with the potential to attract investor interest.
The EIB has supported next generation broadband deployments, such as recently by Reggefiber in the Netherlands and by Iliad in France, with bank loans.

Appendix A: Overview of the infrastructure market
Regulatory impacts
Prudential regulation significantly impacts the financing market
52 Reliance Restricted Final
Introduction
The regulatory treatment of the financial sector has an important impact on the financing market. Whereas Basel III has accelerated bank’s shifting their balance sheets to more liquid assets – and thus away from long-term bank loans and project finance – Solvency 2 may influence insurance companies appetite for project bonds. We discuss each of these regulations in further detail here below.
Basel III
Introduction
The global credit crisis exposed the unstable wholesale funding model of many banks, in which long term assets were funded with increasingly short term liabilities. This funding shock caused banks to retreat from longer term lending, in particular in areas such as project finance for which the limited loan refinancing vehicles available pre-credit crisis (e.g. CLOs of project loans) shut completely.
Added to this market context is the imposition of strengthened banking prudential regulation in the form of Basel III, which will increase banks’ cost of capital leading up to full implementation in 2019. Higher capital charges reduce the profitability of bank project finance teams vis-à-vis other product areas, given the long term and comparatively illiquid nature of project loan books. As a result, many banks have significantly reduced the scope of their project finance lending. It is interesting to note, however, that many of the banks that have reduced their project finance teams are ‘late entrants’ to the market whereas the major project finance bank, i.e. large German, Japanese and French institutions have kept their teams and are seen coming back to the long maturity project finance market in recent times.
Reform package
The key reforms proposed by Basel III include, inter alia:
► a minimum common equity ratio of 4.5% held against risk weighted assets, and a minimum Tier 1 ratio of 6% of risk weighted assets
► a capital conservation buffer which requires banks to hold additional common equity against a minimum of 2.5% of risk weighted assets, otherwise shareholder distributions will be restricted
► a Tier 1 capital leverage ratio applied to assets on a gross (non-risk weighted) basis
► a liquidity coverage ratio (measuring availability of high quality, liquid assets sufficient to cover stress scenario cash outflows for 30 days)
► a net stable funding ratio (a ratio of available to required stable funding – that is, funding available over a one year period in times of wholesale market stress)
The implementation of these, and other, Basel III measures is spread from 2013 to 2019. Their cumulative impact is to require more capital and to raise the cost of this capital (by requiring more expensive forms of capital such as common equity at the expense of cheaper hybrid securities).
Basel III regulations make project lending an expensive business for banks. In contrast, banks’ project bond structuring and bookrunning activities would make far less use of bank balance sheets, with bank exposure limited to supporting (liquidity, working capital) facilities and swaps.
Whilst Basel III may push banks to accept and originate project bond deals, a counterbalancing force is to be found in new draft prudential requirements for insurance companies, which could make project bonds more expensive for insurers to purchase.
Solvency II
Introduction
Pension funds and insurance companies need to find stable yielding long-term assets to match an ever increasing pool of long-term liabilities. An unprecedented compression of government bond yields has caused institutional investors to move down the credit curve in search of a sustainable yield to help cope with the underlying growth in liabilities to which they are exposed.
A recent report from Bearing Point, a consulting firm, shows that the majority of insurers and pension funds are ‘extremely interested’ in infrastructure investments. The report also points out that most insurers and other institutional investors are however reluctant to invest directly in greenfield projects which can be explained by the
Regulatory impacts
Prudential regulation significantly impacts the financing market

Appendix A: Overview of the infrastructure market
Regulatory impacts
Prudential regulation significantly impacts the financing market
53 Reliance Restricted Final
reluctance to take on construction risk and the possibility of delayed yields. These conclusions paint a picture of a deep pool of capital waiting to be ‘unleashed’ on an infrastructure asset class – if the right credit conditions for that investment can be put in place.
A slight counterbalancing force on the willingness of institutional investment to flow into European infrastructure is Solvency II, which lays a set of EU-wide capital requirements and risk management standards for insurance companies. Despite Solvency II (SII) undergoing a significant number of delays, most European insurers are making preparations based on the draft implementing measures and are computing capital requirements based on economic capital models with similar characteristics to SII.
Solvency Capital Requirements
Under Solvency II, insurers are required to hold sufficient capital to ensure that they remain solvent with a confidence interval of 99.5% over a 1-year period (i.e. withstand a 1-in-200 year event).
There are two approaches insurers can use to calculate their Solvency Capital Requirements (SCR):
► Standard Model: a prescriptive set of rules specified by the regulators
► Internal Model: an economic capital model tailored to the risk profile of the insurer. This requires regulatory approval
For every type of risk (market, life etc.), the insurer will need to either use the standard model or opt for the internal model. The latter will obviously necessitate much more time and money to be created and approved by the regulator.
The capital treatment of alternative investments, which includes infrastructure-related investments, is typically more onerous (in terms of capital requirements) under the standard model than under the internal model. In addition, many illiquid investments, such as project bonds, carry low credit risk as the sponsor is either a stable government or a government-backed agency.
In the current market, insurers are therefore exploring opportunities to generate additional income, reduce capital and/or increase IFRS earnings.
Specific risks with infrastructure
As a general rule, there are some specific risks that insurance companies would consider before investing in such products. The diversity in types of infrastructure assets makes them a potentially challenging investment for insurers, many of which still lack strong investment teams to analyze this asset class and its constituent risks:
► Project type: property, vehicles, machinery, transmission assets
► Project stage/term: generally higher default risk in planning and development compared to operational and handover phases
► Revenue risk: demand/availability based revenue criteria, explicit floors on revenue irrespective of performance
► Cost inflation risk: typically higher during construction phase and once in maintenance, these include inflation on insurance fees and maintenance
► Equity burn through levels: gearing, some structures include credit enhancements, which is the case in the project bonds we are looking at
► Revenue source: central government, sector of central government, local authorities, foundations trust, consumers
► Level of explicit security: fixed and floating charges on assets of borrowing company, debt ranking
► Regulatory and political risk: different levels of regulations within markets, changes in policy or the wider government stance on assets
In addition to the risks presented above, the typical illiquidity of infrastructure-related investments make them more complex than their liquid counterparts
Solvency II impact
Under the proposed SII framework, infrastructure bonds will be treated similarly to corporate bonds. However, the credit rating is critical, and a low investment grade infrastructure bond could have a capital charge close to equity.

Appendix A: Overview of the infrastructure market
Regulatory impacts
Prudential regulation significantly impacts the financing market
54 Reliance Restricted Final
For instance, a 25-year BBB- rated bond would incur a 32.5% capital charge, compared to 39% under the standard formula for equities.
Although this could be reduced by using an internal model, the cost of implementing such a model remains substantial.
The capital requirements imposed by Solvency II for asset risk may thus limit appetite of institutional investors to lend for longer dated instruments such as infrastructure assets. On the other hand, certain provisions in the proposed regulation, such as the matching adjustment, which does not decrease equity for hold to maturity investments, may encourage a greater mix of infrastructure investments in their portfolios. Furthermore, various public and private initiatives to create credit enhancements, such as the Project Bond Initiative, can decrease the capital charge (i.e. produce a significant
regulatory capital gain) applied to infrastructure projects in the Solvency II framework.
The specific treatment of project bonds under Solvency II still needs to be finalized (the final text is set to be released in 2014).
Matching adjustment
The matching adjustment (MA) is a mechanism that prevents changes in the value of assets, caused by spread movements, from flowing through to companies’ balance sheets for portfolios where companies have fully or partially mitigated the impact of these movements. The MA adjusts the best estimate liabilities to ensure that where insurers may need to sell such assets to meet their unpredictable liabilities, they are exposed to these short-term asset value fluctuations; but not where they hold the assets to maturity.

Appendix A: Overview of the infrastructure market
EU financial instruments
The European Union takes initiatives to support European infrastructure
55 Reliance Restricted Final
Introduction
The changing market conditions of project financing require governments to find innovative ways to ensure that funding is directed towards infrastructure investment. The EU has developed multiple financial instruments in order to facilitate investment in infrastructure which we discuss below.
Loan Guarantee Instrument for Trans-European Transport Network Projects (LGTT)
The LGTT Cooperation agreement, signed in January 2008 aims to increase the participation of private sector involvement in the financing of Trans-European Transport Network Infrastructure (TEN-T).
The high levels of revenue risk in the early stages of PPP transport projects is an issue when attracting private sector funding. The EIB helps to overcome the concern that traffic-dependent revenue (tolls, fares etc.) may not reach their targets. The Loan Guarantee Instrument for Trans-European Transport Network Projects (LGTT) can partially cover risks for projects or part-projects that are deemed of “common interest” as defined by the European Commission and receive income from user-charges.
According to the EIB, the LGTT normally guarantees a maximum of 10% of senior debt (20% in exceptional instances) up to a maximum of €200 million per project (EIB Structured Finance Facility rules), following EIB Structured Finance Facility rules. The impact of the LGTT is that it enhances substantially credit quality and encourages a reduction of risk margins applied to senior project loans and should surpass the cost of the guarantee to the borrower. The support provided is available for a period of as much as five to seven years after project completion. The EU budget support, could amount to €250 million. The LGTT aims therefore to facilitate investment in TEN-T projects by significantly improving the ability of the borrower to service senior debt during the initial operating period or “ramp-up” phase of the overall project.
If the EIB guarantee is called upon by the stand-by liquidity facility (SBF) providers at the end of the availability period, it will reimburse the SBF providers and become a subordinated lender to the project but ahead of any payment to the equity providers and related financings.
According to the EIB, 7 projects have thus far been supported by the LGTT instrument (as shown in the graphic below), all concluded before 2012. One deal was closed in 2008 (first year of operations), two in 2009 (second year), one in 2010 (third year) and three in 2011 (fourth year).
Transport projects that have closed financing with the LGTT instrument
Country Project name Date of signature
Portugal IPG Amarante-Villa Real PPP (Túnel del Marão) 30 May 2008
Portugal Baixo Alentejo Motorway 30 January 2009
Germany Autobahn A5 PPP 30 March 2009
Spain EIX Transversal C-25 PPP 29 July 2010
Germany Autobahn Augsburg Ulm PPP (TEN) 31 May 2011
France LGV Sud Europe Atlantique 16 June 2011
UK London Gateway Port (TEN) 6 December 2011
Source: European Investment Bank
Marguerite Fund
The Marguerite Fund was established in 2010 in the context of the financial crisis and has raised close to €710 million. The six Core Sponsors (EIB, Caisse des depots et consignations of France, Cassa Depositi of Italy, KfW of Germany, Instituto de Credito Oficial of Spain and PKO Bank Polski SA of Poland) contributed to €100 million each while an amount of €110 million was raised by three investors including the EC. The latter committed €80 million and has a seat on the Supervisory Board. The purpose of the fund is to provide equity funding to long-term capital-intensive infrastructure projects within the TEN-T and TEN-E (Trans-European Energy Network) network. It targets attractive long-term and stable risk-adjusted returns.
The Marguerite Fund is the first fund of its kind launched by Europe’s leading financial institutions and has the particularity of combining a principle of return to investors and the pursuit of public policy objectives.
The Investment Advisor ‘Marguerite Advisor S.A’ employs the Advisory team and provides investment advisory services to the Fund under an Advisory agreement. As such, it is responsible for the day-to-day management, recommends investments and subsequent disinvestments and on-going activity of the Fund. The Advisory Team is in charge of origination, due diligence, structuring and execution of the investments as well as of monitoring and asset management.
EU financial instruments
The European Union takes initiatives to support European infrastructure

Appendix A: Overview of the infrastructure market
EU financial instruments
The European Union takes initiatives to support European infrastructure
56 Reliance Restricted Final
As mentioned above, the Fund acts as an equity provider and the 6 Core Sponsors and other institutions will put in place a debt co-financing initiative of up to €5 billion, providing a source of long-term debt for the projects it invested in. The minimum investment ticket the fund can invest in a project is €10 million.
While the minimum amount of equity investment in the Fund is €20 million, there are no restriction to the admission of new investors except for the fact that they have adequate solvency and a long-term investment philosophy.

57 Reliance Restricted Final
1. General description
2. Evaluation of pilot phase
3. Continuation of the Project Bond Initiative in the Connecting Europe Facility
Appendix B: Project Bond Initiative

Appendix B: Project Bond Initiative General description
The European Institutions create the project bond credit enhancement to catalyse capital market financing for trans-European infrastructure projects
58 Reliance Restricted Final
General description
The EU and EIB created the Europe 2020 PBI to promote finance infrastructure projects to the private-sector institutional investors. They considered the following two factors in order to develop the most suitable instrument:
► Many long-term investors expect moderate returns
► Needed infrastructure projects failed to be implemented due to public-sector budget constraints
► Financing bottlenecks faced by private sector projects
This financial instrument has been implemented to facilitate debt capital market financing of infrastructure projects in the areas of Trans-European transport networks (TEN-T), trans-European energy networks (TEN-E), ICT and broadband, thereby expanding the financing options for these projects.
Since the financial crisis, monoline insurers, which traditionally guaranteed bonds issued by projects companies, have become more reluctant to participate to such projects. This has negatively impacted bond issuances to finance infrastructure project as bond investors are hesitant to invest in the instruments rated BBB and below due to regulatory requirements. Under the PBI, the EIB provides eligible infrastructure projects with PBCE in the form of a subordinated instrument, i.e. a loan or contingent facility in order to support senior project bonds issued by infrastructure project companies. The subordinated tranche functions as a protective layer of the senior tranche, receiving the priority for the cash flows. One important difference between the PBCE and the monoline insurance products is the extent of the coverage of the credit insurance. Whereas monoline insurance products provided a guarantee backed by the credit rating of the insuring institution (typically at least AA-rated), the PBCE seeks to enhance the credit-rating of the bond only up to a level which the institutional investor market requires (for example the EIB today typically targets an A- rating). Furthermore, whereas monoline insurers can in some cases cover the full bond issuance, the target maximum coverage of the PBCE instrument is currently 20% of the bond issuance, which further reinforces its ‘credit enhancement’ (versus ‘credit wrap’) nature. It should enhance the credit rating of these bonds which will broaden financing sources and minimize overall funding costs. The EU budget contribution serves to partly cover the EIB's additional risk from engaging in riskier-than-normal transactions.
The graph below presents the Project Bond Initiative.
In typical infrastructure project financing structures, several companies set up a sponsor , which is responsible for the financing, construction and operation of the infrastructure project. The sponsor will be accountable for a minority stake in the costs. The rest will be financed through debts:
► The senior tranche is provided by institutional investors, typically through a fixed-rate investment.
► The subordinated tranche is provided by the EIB in the form of a PBCE. This could represent a loan (funded PBCE) or an additional credit line to finance any possible overrun on the costs (unfunded PBCE).
General description
The European Institutions create the project bond credit enhancement to catalyse capital market financing for trans-European infrastructure projects
Project Bond Initiative
Source: EU, EIB
Entity A
Entity B
Entity C
SP
V
Project bonds
(senior debt)
Subordinated
debt
Equity
Investors
subscribe
EIB EU
Risk shared
PBCE versus LGTT
PBCE is more flexible than LGTT as it is accessible to TEN-E and broadband projects (on top of TEN-T). It also extends the risk mitigation of the LGTT by (i) enhancing all debt capital market financing, (ii) securing the entire duration of the senior debt, and (iii) backing all types of project-related risks.

Appendix B: Project Bond Initiative General description
The European Institutions create the project bond credit enhancement to catalyse capital market financing for trans-European infrastructure projects
59 Reliance Restricted Final
The PBI pilot phase was set up as a precursor for the main phase of the PBI, which will be rolled out under the Connecting Europe Facility (hereafter referred to as ‘CEF’) from 2014 to 2020. The testing phase is going to be supported until 2016 by unused EU budgetary resources amounting to €230 million, split as follows:
► €200 million to trans-European transport networks
► €20 million to high-speed broadband projects
► €10 million to trans-European energy networks
This could support infrastructure projects for €4.4 billion (a multiplier of 19), according to the EIB. The objectives pursued can be summarized as:
► Increase the number of suitable projects and broaden the infrastructure investor base by mobilizing capital market investment in infrastructure projects
► Reduce cost while increasing tenor and liquidity in this market
► Enhance financing capacity in the whole EU
► Provide to the capital markets with another asset class by establishing tradable infrastructure project bonds
The PBI, like other risk-sharing financial instruments, represents the most visible part of the joint intervention of the European Commission and the EIB. Its main phase will be rolled out in the coming years under the Connecting Europe Facility (CEF), from which circa 10% will be allocated to financial instruments. The main objectives of the CEF are the promotion of growth, jobs and competitiveness through targeted infrastructure investment at European level. The CEF, as part of the European infrastructure package, includes policy guidelines which set the objectives and priorities in each of the three sectors of trans-European network development. In order to ensure the largest value added, the CEF will strive to (i) optimize the portfolio of instruments available, (ii) standardize the operational rules, and (iii) capitalize on possible synergies. The CEF regulation agreed that the overall budget would be split between the three sectors.
The European Parliament and European Council have agreed to allocate €33.3 billion of the EU budget to the CEF under the 2014-2020 Multi-annual Financial Framework (MFF). In the legislative text, the sector allocation is as follows:
► Transport: €26.3 billion11
► Energy: €5.9 billion
► Telecommunications: €1.1 billion
11
Of which €11.3 million is transferred from the Cohesion Fund and will be spent in line with this Regulation exclusively in Member States eligible for funding from the Cohesion Fund.

Appendix B: Project Bond Initiative Evaluation of pilot phase
Two projects in the PBI pilot phase have thus far reached financial close
60 Reliance Restricted Final
Evaluation of pilot phase
Until the end of the period under evaluation (until 31 July 2013), eight trans-European infrastructure projects received approval from the EIB Board of Directors to benefit from the Project Bond Credit Enhancement facility, as presented in the table below.
Given the limited budget allocated to the PBI pilot phase which amounts to €230 million in 2013 and to €230 in 2014-2015 under the Connecting Europe Facility, it is likely that not all projects listed above will be supported by the PBI.
As of the end of the one-year period for which our evaluation has been undertaken (i.e. until end of July 2013), only one project, the Castor gas storage project in Spain, had already reached the financial close. The pilot phase evaluation is therefore focused on the lessons learned from this project.
We note, however, that an additional PBI pilot phase project, Greater Gabbard OFTO refinancing, has reached Financial Close in November 2013. Furthermore, the A11 greenfield PPP road project has reached Financial Close in March 2014.
12
Evaluation of the Castor project
The Castor project is a submarine natural gas storage facility in the east coast of Spain, in the municipality of Vinarós, able to contain 1.3 billion cubic meters of gas based on a depleted oil reservoir around 21 kilometers offshore. The facility will have two platforms, compression and related facilities onshore and offshore, and a maximum delivery rate of 25 million cubic meter a day. It includes the 30-year concession for construction and operation of the underground gas storage facility. This project was the first in Europe to publicly issue project bonds and raised financing of €1.4 billion. The Castor natural storage facility is a strategic TEN-E project that will allow to cover 30% of Spain’s daily gas consumption. The full inclusion in the Spanish gas system is expected by the end of 2013.
The project company is Escal UGS, and is funded with €250 million in equity, mainly held by Spanish construction conglomerate, Grupo ACS, and Canadian gas exploration company, Dundee Energy Limited (through its 73.7% interest in Castor UGS Limited Partnership), who respectively hold 66.7% and 24.5%. The remaining 9.8% is held by a Spanish gas distribution company, Enagas. The bond issue was successfully placed, with institutional investors (primarily insurance companies and pension funds) subscribing to €1.1 billion and the EIB for €300 million as an anchor investor. The bond issue was emitted by Watercraft Capital S.A., a Luxembourg SPV established for the purpose of the issue. The EIB has provided a €200 million credit-enhancing liquidity line. The project bond issuance was done using the framework of the PBI and is fully “PBI-compatible”. Hence, even if the project Castor has been financed with project bond, it has not been directly supported by the EU 2020 Project Bond Initiative (PBI). The overall financing structure is shown in the graph below.
12
The refinancing of the Greater Gabbard OFTO transmission network in the UK by a PBCE-backed project bond was closed on 27 November 2013. Whilst it is not possible to make an in-depth analysis of this financing in the context of this evaluation, a further study of this deal could also provide useful insights on the successes and lessons learned for the PBI.
Evaluation of pilot phase
Two projects in the PBI pilot phase have thus far reached financial close
Projects approved by the EIB BoD for PBCE
Currency: € million Project's type Country Amount
TEN-T Motorway UK 200
TEN-E Gas storage Spain 200
TEN-E Gas storage Italy 200
TEN-T Motorway Slovakia 200
TEN-E Grid connections to several offshore wind farms Germany 170*
TEN-T Motorway Belgium 150
TEN-E Grid connection to several offshore wind farms UK 150
TEN-T Motorway Germany 120
Source: EU – Economic and financial affairs
* Per operation

Appendix B: Project Bond Initiative Evaluation of pilot phase
Two projects in the PBI pilot phase have thus far reached financial close
61 Reliance Restricted Final
The EIB’s commitment supported the transaction and the project obtained a credit rating of BBB and BBB+ from S&P and Fitch, respectively, which is a notch above the Spanish sovereign rating. S&P stated that its rating reflects the high revenue predictability and the strategic importance of the project. According to Fitch, the project would carry a rating of BBB-, excluding the EIB’s credit enhancement, which reflects the project’s standalone risk. The uplift in comparison with the Spanish’s government bond rating is supported by the sound participation of the EIB.
Although insurance companies are usually reluctant to buy European project bonds rated below the 'A' category due to higher capital charges for long-term debt under the proposed Solvency II regulations, they were actively involved in the operation. From a geographical perspective, German investors represented the largest base (28%), followed
by the Benelux (23%, including the EIB), Spain (18%), France (11%), the UK (10%) and Italy (10%).
The issuer, Watercraft Capital S.A. has been formed to issue €1.4 billion of project bonds as its principal purpose was to raise money in the capital markets and lend them to Escal UGS, the sponsor, by the use of an on-loan agreement.
Interest will be accrued at a rate of 5.756% per annum and payable semi-annually (each 30 June and each 31 December (each a Payment Date)). The principal will be
redeemed in instalments on each Payment Date with a final maturity on 31 December 2034. The bond has a tenor of 21.5 year, typically for infrastructure financing, but rather long in the current market context, and an average life length of 12.5 years. The table below presents the main terms of the transaction.
It is noteworthy that the first project to benefit from the PBCE is located in Spain. The successful financial close demonstrated that bond credit enhancement can support long-term investment in periods of economic turmoil and in difficult markets, such as Spain. Indeed, the bond issue was oversubscribed by €200 million (including the take out of €300 million by the EIB). According to participants, the relatively rapid close of the bond issue was also achieved in part because the issue’s rating was able to pierce the sovereign rating ceiling.
Without the participation of the EIB and the PBCE, the bond issue would most certainly have not taken place. One might even question whether the refinancing would have been achieved even in the banking market. The successful placement of the bond issue is largely due to the fact that the PBCE creates a buffer against broad project risks, such as O&M cost increases, technical failures or unforeseen changes in the sector’s regulation. In fact, the effectiveness of the PBCE is now being tested, because the Spanish government ordered a temporarily suspension of the gas injection during the month of October 2013 due to seismic activity off the coast of Valencia. The role
Castor financing structure
Source: EIB
ACS, Enagas,
Castor UGS
Escal UGS
EIB
PBI team
Watercraft
Capital SA
Institutional
investors
EIB
lending
Equity
€250 million
€1.4 billion
PBCE product
€200 million
€1.1 billion
€300 million
Purchase of project bonds
Liquidity line
Castor main terms overview
Source: EIB
Issuer Watercraft Capital S.A.. a special purpose vehicle set up under Luxembourg Law
€1.4 billionProject Bond size
Capex
Rating
Basic Bond legal structure
Total construction cost EUR 1.65bn
BBB (S&P) and BBB+ (Fitch)
Orphan vehicle in Luxembourg on-loans to a Spanish SPV
Tenor True long term financing with a tenor ending in December 2034
All-in fixed coupon 5.756%Pricing
Average life
Ranking
Bookrunners
12.5 years
Secured limited recourse amortising bonds
Bankia, BNP Paribas, CaixaBank, Crédit Agricole CIB, Natixis, Santander,
Société Génerale

Appendix B: Project Bond Initiative Evaluation of pilot phase
Two projects in the PBI pilot phase have thus far reached financial close
62 Reliance Restricted Final
played by the EIB PBCE in this case will be critical for bondholders and a real test of its value in infrastructure projects.
Preliminary lessons learned from the Castor project
The Castor project is instructive for the success of the PBCE. The following take-aways can be drawn from the Castor experience:
► Liquidity: There is a market for project bonds, notably with interest from insurance companies and pension funds (i.e. precisely the ‘target’ market envisaged for the PBI), who can match their long-term liabilities with long-term assets, and pick up additional yield. This raised debt financing through the issue (€1.4 billion) is significant and demonstrates the level of liquidity in the market.
► European investor base: Spain only accounted for 18% of the bond issue versus more than half covered by German and Benelux investors. This demonstrates that the financing market for large infrastructure projects is increasingly trans-national/European.
► Credit rating: The bond was issued at a credit rating below A-, which has often been thought as the rating floor for many institutional investors. The fact that the bond was issued at BBB/BBB+ and could still raise significant financing, shows that there is liquidity in the market even for riskier projects, which is a positive signal for the amount of liquidity for inherently less risky projects, e.g. less complex and in better functioning economies in Europe.
► Sovereign rating: The project achieved a credit rating one notch above the sovereign rating. This is important, because it gives a perspective for important infrastructure projects in Europe’s troubled economies by showing that they can find financing with the right credit enhancement and risk allocation.
► Risk mitigation: A large part of the success of the bond issue is because it benefitted from a “partial wrap” of the PBCE. The effectiveness of this credit enhancement facility may be tested by the operational disruptions created by seismic activity in the region of Castor, and the outcome of these events on the bond’s liquidity and price could be instructive for the effectiveness of the PBCE in risk mitigation.

Appendix B: Project Bond Initiative Continuation of the Project Bond Initiative in the Connecting Europe Facility
Optimising the multiplier effect of the Connecting Europe Facility
63 Reliance Restricted Final
Current situation
The close cooperation between the European Commission (EC) and the EIB has enabled the implementation of risk-sharing instruments (e.g. the PBCE) which aim to leverage existing resources. Under the PBI, the risk-sharing between the EC and the EIB follows a portfolio First Loss Piece (FLP) model. In this model, the EC absorbs the first losses on the lending portfolio up to a predetermined percentage. The percentage is typically set at just above the historical average loss, which can be modelled from previous lending of the financial partner (in this case the EIB) in the sectors. As “first losses” are more likely to occur than losses above a specified level, the multiplier effect of EU budgetary funds is optimised as it provides the most efficient guarantee in terms of total guarantee liability versus size of portfolio. For the pilot phase, we understand that the budget allocation from the Directorate General responsible for the three priority sectors, i.e. DG MOVE, DG ENER and DG CONNECT, respectively, are kept in separate trust accounts for use in the PBI pilot phase.
13 This structure of multiple, isolated trust accounts diminishes
the benefits of the minimizing portfolio risk through diversification, as will be explained further on.
Modern Portfolio Theory
Modern Portfolio Theory (MPT) was established by Nobel prize winner Harry Markowitz after publishing his research in the Journal of Finance in 1952. Portfolio diversification enables investors to reduce risks via the combination of different types of assets.
The MPT states that the expected portfolio return is a weighted average of the expected returns on the individual assets which composed the portfolio. It can be represented by the equation below
(a) E( ) ∑wi E(Ri)
N
i 1
Where E(Rp) is the expected return on the portfolio P, wi is the proportion ("weight") of the portfolio allocated to the asset i and E(Ri) is the expected return on the asset i.
Given that the variance of a single security is the expected value of the sum of the squared deviations from the mean, and that the standard deviation is the square root of the variance, the portfolio variance (σ²p) of a combination of securities is
(b) σ p ∑w i σ i +
N
i
∑
N
i 1
∑wiwj σiσjp
N
j
where is the correlation coefficient which measures the degree of linear dependence between the assets i and j This coefficient is bounded between - one (negative correlation) and + one (positive correlation) and a value of zero indicates that there is no correlation.
Standard deviation, the classical measure of volatility of the portfolio is simply the square root of the portfolio variance.
What this theory teaching us is that combining assets with varying correlations results in a lower risk and higher-risk adjusted return. If investors hold one asset class, their risk (i.e. standard deviation) and return would be concentrated whilst they could reduce their exposure to individual asset risk by investing in a diversified set of assets, which are not perfectly correlated.
To better represent the risk-reward payoff resulting from the diversification, The MPT defines the efficient frontier as a curve showing the optimal portfolios, i.e. those having the highest expected return for a given level of risk, as shown in the graphic below.
13
For further information with respect to the allocation of the EU budgetary resources per sector, we refer to the Project Bond Initiative section.
Continuation of the Project Bond Initiative in the Connecting Europe Facility
Optimising the multiplier effect of the Connecting Europe Facility
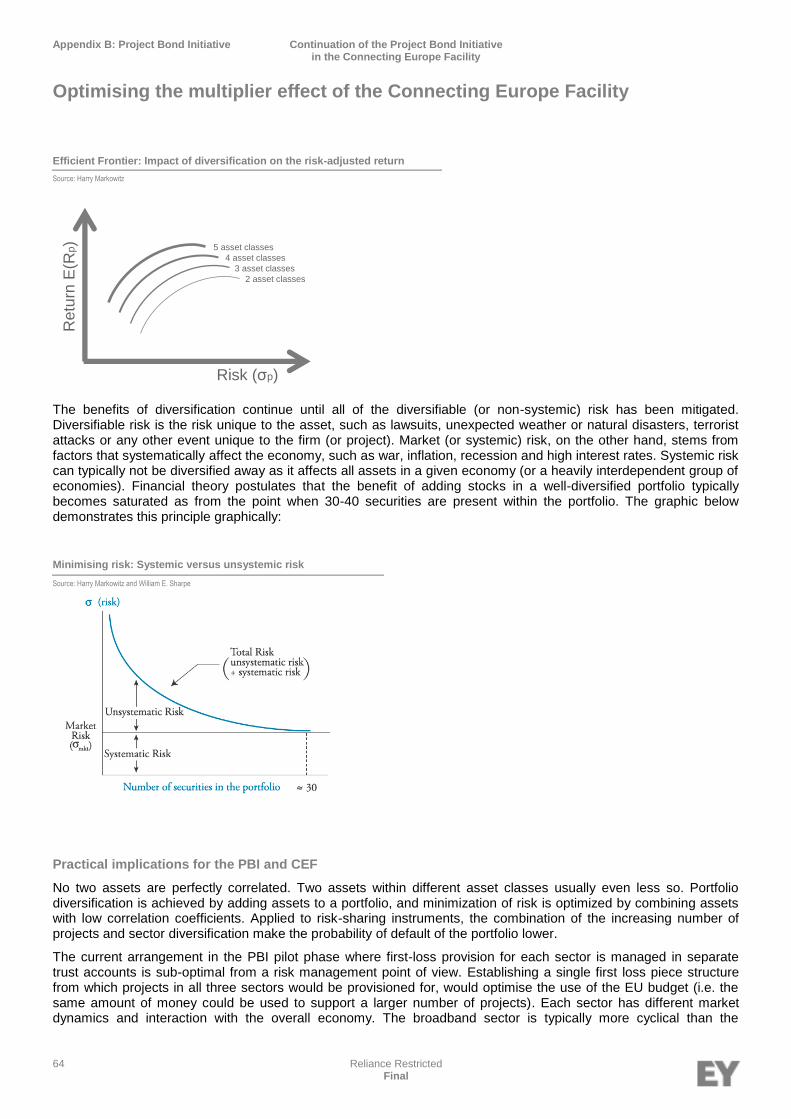
Appendix B: Project Bond Initiative Continuation of the Project Bond Initiative in the Connecting Europe Facility
Optimising the multiplier effect of the Connecting Europe Facility
64 Reliance Restricted Final
The benefits of diversification continue until all of the diversifiable (or non-systemic) risk has been mitigated. Diversifiable risk is the risk unique to the asset, such as lawsuits, unexpected weather or natural disasters, terrorist attacks or any other event unique to the firm (or project). Market (or systemic) risk, on the other hand, stems from factors that systematically affect the economy, such as war, inflation, recession and high interest rates. Systemic risk can typically not be diversified away as it affects all assets in a given economy (or a heavily interdependent group of economies). Financial theory postulates that the benefit of adding stocks in a well-diversified portfolio typically becomes saturated as from the point when 30-40 securities are present within the portfolio. The graphic below demonstrates this principle graphically:
Practical implications for the PBI and CEF
No two assets are perfectly correlated. Two assets within different asset classes usually even less so. Portfolio diversification is achieved by adding assets to a portfolio, and minimization of risk is optimized by combining assets with low correlation coefficients. Applied to risk-sharing instruments, the combination of the increasing number of projects and sector diversification make the probability of default of the portfolio lower.
The current arrangement in the PBI pilot phase where first-loss provision for each sector is managed in separate trust accounts is sub-optimal from a risk management point of view. Establishing a single first loss piece structure from which projects in all three sectors would be provisioned for, would optimise the use of the EU budget (i.e. the same amount of money could be used to support a larger number of projects). Each sector has different market dynamics and interaction with the overall economy. The broadband sector is typically more cyclical than the
Efficient Frontier: Impact of diversification on the risk-adjusted return
Source: Harry Markowitz
2 asset classes
Risk (σp)
Retu
rn E
(Rp) 5 asset classes
4 asset classes
3 asset classes
Minimising risk: Systemic versus unsystemic risk
Source: Harry Markowitz and William E. Sharpe

Appendix B: Project Bond Initiative Continuation of the Project Bond Initiative in the Connecting Europe Facility
Optimising the multiplier effect of the Connecting Europe Facility
65 Reliance Restricted Final
transport or utilities sectors. The portfolio diversification could also entail a gradually lower contribution from the EU budget, so less financial burden on the tax payer.
In addition to the potential diversification benefits that can be achieved by merging the different individual first-loss piece contributions and pooling the risks, a further benefit of not creating closed funding pockets is to give flexibility to respond to market evolutions. The fortunes and structures of different sectors in Europe will certainly change over the 2014-2020 MFF period, as will likely the EU priorities. Flexibility should be given to the CEF to be able to respond to the economic and infrastructural challenges that will be faced over the next seven years.

66 Reliance Restricted Final
1. Introduction
2. N33 highway
3. A1/A6 motorway
4. Zaanstad prison
5. University of Hertfordshire student accommodation
6. Holyrood student accommodation
7. Pendleton Together Housing
8. L2 ring road
9. Mersin International Port
10. Case Study : Canada
Appendix C: Case studies

Appendix C: Case studies Introduction
Introduction
67 Reliance restricted Final
Case studies
The purpose of this section is to illustrate in practical terms the impacts of specific situations and to understand the causal links between the intervention and the achievements, results and impacts. This will also allow us to describe good practices.
We have selected seven projects in Europe that have been financed through alternative financing and/or capital market solutions, and which we think are interesting to examine in further detail. We provide an overview of the seven case studies here below:
Introduction
Introduction
Overview selected case studies
Name Country Sector Financial close date
Investment amount
Greenfield/ brownfield
Debt financing structure
N33 Netherlands Roads 21/11/2012 € 138m Brownfield Long-term bank + bond private placement (index-linked)
A1/A6 Netherlands Roads 26/2/2013 € 800m Greenfield Long-term bank financing
Zaanstad Netherlands Prisons 27/9/2013 € 217m Greenfield Short-term bank + long-term bond financing (private placement)
Uliving UK Student housing 29/5/2013 £ 193.5m Greenfield Unwrappred indexed linked listed bond
Holyrood UK Student housing 31/7/2013 £ 78m Greenfield Listed project bonds (fixed rate and index-linked)
Pendleton Together Housing UK Urban development 17/9/2013 £ 95m Greenfield Listed project bonds (senior and subordinated)
L2 France Roads 7/10/2013 € 592m Greenfield Bond private placement + Dailly tranche
Mersin International Port Turkey Ports 2/8/2013 $450m Brownfield Listed bond (144a)

Appendix C: Case studies N33 highway
N33 highway
68 Reliance restricted Final
Project description
The N33 highway project was the first transport project in the Netherlands where pension funds were involved in the financial structure. It is not a TEN-T project and is therefore not eligible for the PBI but nevertheless provides an interesting case study for alternative financing solutions.
The table below is a brief summary of the N33 project:
Project overview
Region Country Amount (€ million) Payment Mechanism
Financial close date
Duration (years) Grantor Sponsor
Europe The Netherlands 138 Availability-based 21 November 2012 20 Dutch Ministry of Transport, Public Works and Water Management (Rijkswaterstraat)
BAM PPP/PGGM JV
Source: InfraDeals
The N33 project is a Public-Private Partnership (PPP) road project between Assen and Zuidbroek in the Netherlands and will include the widening of the single carriageway to two in each direction and will cover a distance of 38km. The construction will last two and a half years with a 20-year concession for the operational stage. Rijkswaterstaat (RWS) concluded a DBFM (Design, Build, Finance, Maintain) agreement with the private sponsors.
The sponsor, a 50/50 joint venture between BAM PPP and PGGM was awarded the PPP on 1 October 2012 and provided equity of €13 million.
Financial structure
The table below represents the financial structure of the project:
Financial structure
Type Financier Amount (€ million) Maturity (years) Other
Equity BAM PPP/PGGM SPV 13,0 n/a n/a
Senior secured term loan BTMU, KfW, Rabobank equally 47.1 20 Euribor+250bps
Senior secured capex facility (construction debt)
BTMU, KfW, Rabobank equally 125.0 2.5 Refinanced
Index-linked loan ABP 77.8 20 n/a
Source: InfraDeals
The project was financed at a gearing ratio of 90:10. Three banks, BTMU, KfW-IPEX and Rabobank, provided the construction loan and a long-term project loan of €47.1 million (38% of the debt financing). The remaining 62% of the debt financing was secured from Dutch pension fund ABP (managed by its APG subsidiary which administers the ABP pension scheme) in the form of an index-linked loan to be issued after construction is over, refinancing the banks’ capex facility.
Following a 6-month evaluation of the progress of the N33 PPP project, the Dutch government announced in June 2013 that it will not publish new tenders for infrastructure projects with inflation-linked payments. This announcement was heavily contested by large Dutch pension funds, such as APG and PGGM. According to government sources, however, not all institutional investors deem index-linked payments as their main priority, and are interested in other instruments, such as bond financing. Whilst the pricing of the inflation-linked loan was very attractive at financial close, the government regrets having taken this risk and believes that it is better allocated to the private sector.
N33 highway
N33 highway
Key take-aways
► Senior lenders: The senior lenders consisted of Japanese (BTMU), German (KfW-IPEX) and a Dutch cooperative bank (Rabobank). The composition of this banking club underlines the fact that liquidity for long-term maturity loans is available and lies primarily with Japanese and German lenders at the current time.
► Equity: On the equity side as well, a Dutch pension fund, PGGM (advisor to PFZW), was involved. In fact, PGGM has set up a 50/50 joint venture with Dutch construction group, Koninklijke BAM, to take equity stakes in infrastructure projects. Pension funds are already rather present on the infrastructure financing market as equity providers.
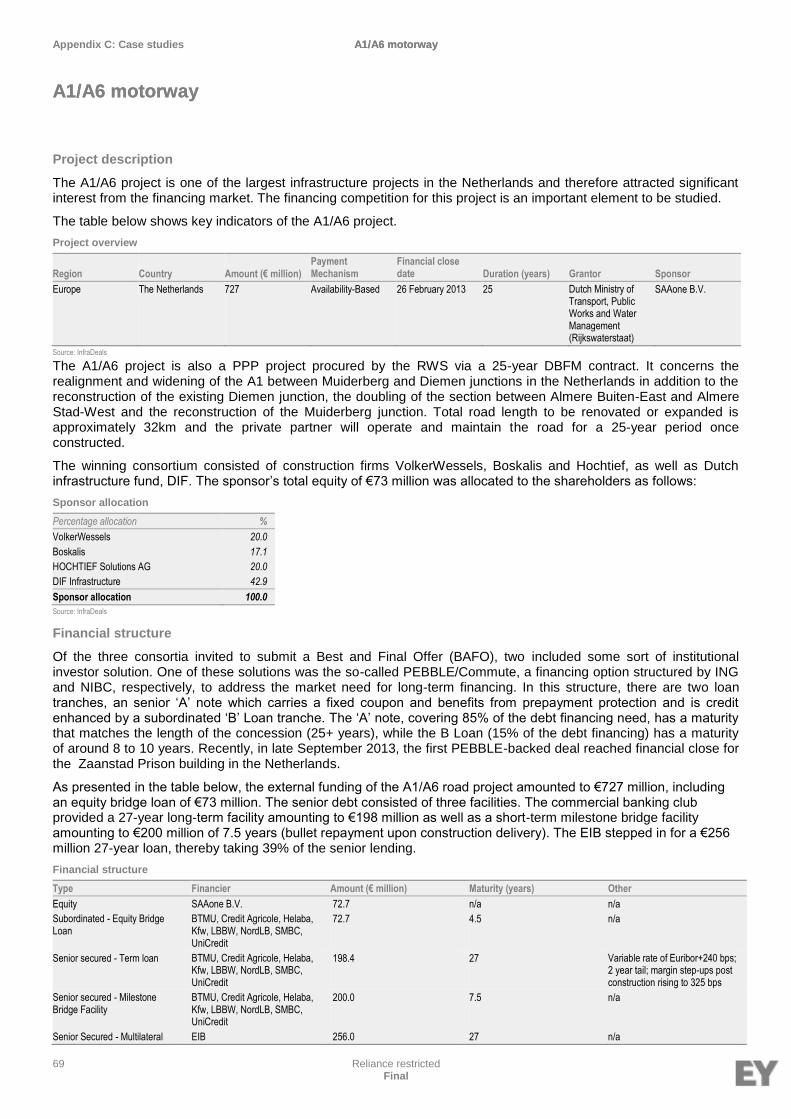
Appendix C: Case studies A1/A6 motorway
A1/A6 motorway
69 Reliance restricted Final
Project description
The A1/A6 project is one of the largest infrastructure projects in the Netherlands and therefore attracted significant interest from the financing market. The financing competition for this project is an important element to be studied.
The table below shows key indicators of the A1/A6 project.
Project overview
Region Country Amount (€ million) Payment Mechanism
Financial close date Duration (years) Grantor Sponsor
Europe The Netherlands 727 Availability-Based 26 February 2013 25 Dutch Ministry of Transport, Public Works and Water Management (Rijkswaterstaat)
SAAone B.V.
Source: InfraDeals
The A1/A6 project is also a PPP project procured by the RWS via a 25-year DBFM contract. It concerns the realignment and widening of the A1 between Muiderberg and Diemen junctions in the Netherlands in addition to the reconstruction of the existing Diemen junction, the doubling of the section between Almere Buiten-East and Almere Stad-West and the reconstruction of the Muiderberg junction. Total road length to be renovated or expanded is approximately 32km and the private partner will operate and maintain the road for a 25-year period once constructed.
The winning consortium consisted of construction firms VolkerWessels, Boskalis and Hochtief, as well as Dutch infrastructure fund, DIF. The sponsor’s total equity of €73 million was allocated to the shareholders as follows:
Financial structure
Of the three consortia invited to submit a Best and Final Offer (BAFO), two included some sort of institutional investor solution. One of these solutions was the so-called PEBBLE/Commute, a financing option structured by ING and NIBC, respectively, to address the market need for long-term financing. In this structure, there are two loan tranches, an senior ‘A’ note which carries a fixed coupon and benefits from prepayment protection and is credit enhanced by a subordinated ‘B’ Loan tranche. The ‘A’ note, covering 85% of the debt financing need, has a maturity that matches the length of the concession (25+ years), while the B Loan (15% of the debt financing) has a maturity of around 8 to 10 years. Recently, in late September 2013, the first PEBBLE-backed deal reached financial close for the Zaanstad Prison building in the Netherlands.
As presented in the table below, the external funding of the A1/A6 road project amounted to €727 million, including an equity bridge loan of €73 million. The senior debt consisted of three facilities. The commercial banking club provided a 27-year long-term facility amounting to €198 million as well as a short-term milestone bridge facility amounting to €200 million of 7.5 years (bullet repayment upon construction delivery). The EIB stepped in for a €256 million 27-year loan, thereby taking 39% of the senior lending.
Financial structure
Type Financier Amount (€ million) Maturity (years) Other
Equity SAAone B.V. 72.7 n/a n/a
Subordinated - Equity Bridge Loan
BTMU, Credit Agricole, Helaba, Kfw, LBBW, NordLB, SMBC, UniCredit
72.7 4.5 n/a
Senior secured - Term loan BTMU, Credit Agricole, Helaba, Kfw, LBBW, NordLB, SMBC, UniCredit
198.4 27 Variable rate of Euribor+240 bps; 2 year tail; margin step-ups post construction rising to 325 bps
Senior secured - Milestone Bridge Facility
BTMU, Credit Agricole, Helaba, Kfw, LBBW, NordLB, SMBC, UniCredit
200.0 7.5 n/a
Senior Secured - Multilateral EIB 256.0 27 n/a
A1/A6 motorway
A1/A6 motorway
Sponsor allocation
Percentage allocation %
VolkerWessels 20.0
Boskalis 17.1
HOCHTIEF Solutions AG 20.0
DIF Infrastructure 42.9
Sponsor allocation 100.0
Source: InfraDeals
Appendix C: Case studies A1/A6 motorway
A1/A6 motorway
70 Reliance restricted Final
Source: InfraDeals
The winning consortium for the A1/A6 project opted for the traditional bank lending structure above (in the form of a soft mini-perm). The reasons cited for this were the capability and willingness of lenders to provide long-term debt for the PPP, as well as bond pricing being higher than bank debt pricing. At first sight, the fact that this structure was more competitive than a bond solution is somewhat perplexing, given that a large amount of the debt financing (31%) was covered by a construction facility. Although we lack further insights into this deal to draw further conclusions on this, one can also suspect the following reasons why this financing solution was retained:
► RWS requires committed financing which largely precludes funding in the public bond market and effectively limits a bond solution to a private placement
► RWS was required to amend the bidding documents to facilitate a bond reducing the time available to fully develop a bond solution
► the consortium had the most competitive construction and operating costs (by far the most important cost elements)
► the consortium’s financial advisor was the structuring bank, Crédit Agricole, who probably preferred a banking solution
► the financial close procedure was clearer and carried less (perceived) risks than with a bond solution
► the involvement of the EIB through a €256 million loan made this solution particularly competitive on pricing
Although we understand that PBCE was considered by bidders, the procurement was well advanced before it could be evaluated meaning that alternative bank debt solutions were well developed by this time.
Key take-aways
This is the largest transport infrastructure PPP project ever undertaken in the Netherlands. The EIB’s involvement was certainly a key factor in reaching financial close, particularly considering the large banking club of 8 banks.
► Lending tenors: The lending package cannot be considered ‘purely’ long term. Whilst the long-term commercial lending facility had indeed a relatively long tenor of 27 years, it included margin step –ups, which encourage early refinancing. The milestone bridge facility (50% and 31% of the commercial senior term facility and total senior lending, respectively) is bullet loan facility for which the principal and capitalized interest is fully repaid at the end of the construction phase. The fact that the full senior debt could not be financed with long-term debt demonstrates the lack of liquidity for long maturity debt in the European infrastructure market today.
► EIB role: The EIB’s involvement as a lender was certainly key for the success of this financing structure. The involvement of the EIB provides credibility to the project and financing solution.

Appendix C: Case studies Zaanstad prison
Zaanstad prison
71 Reliance restricted Final
Project description
The Zaanstad prison is the first project to have reached financial close with the PEBBLE-Commute scheme. This financing scheme has been structured by two banks, ING and NIBC, to tap the liquid institutional investor market. As a social infrastructure project, Zaanstad prison was not eligible for funding from the Project Bond Initiative.
The table below shows key indicators of the Zaanstad project.
Project overview
Region Country Amount (€ million) Payment Mechanism
Financial close date Duration (years) Grantor Sponsor
Europe The Netherlands 217 Availability-Based 27 September 2013 25 Dutch Buildings Agency (Rijksgebouwendienst)
Pi2 B.V.
Source: InfraDeals
On 2 September 2013, the Rijksgebouwendienst (RGD) signed a 25-year DBFM contract with Pi2, a consortium consisting of Ballast Nedam Concessions and Royal Imtech, respectively a Dutch construction and building maintenance company, for the construction and maintenance of a new prison in Zaanstad, part of the metropolitan area of Amsterdam. The penitentiary will be multifunctional, with detention care and a forensic service, and will be able to accommodate 1.000 inmates. It is expected to open in 2016.
The works execution will be undertaken by Ballast Nedam (65% of the cost) and Royal Imtech (35%). The €22 in equity will, however, be fully provided by Ballast Nedam, as shown below:
Financial structure
Financial close took place on 27 September, some weeks after the signing of the DBFM-agreement, and included for the first time the PEBBLE-Commute bank-bond scheme structured by ING and NIBC, respectively. The two schemes were in 2012 by ING, which set up the PEBBLE scheme, and NIBC, which introduced the Commute scheme. The schemes were created to make up for the reduced willingness of banks to lend long-term. Both focus on a credit-enhancing mechanism which ensures mitigation of the construction risk, as well as a 7-10 year B loan, which operates as a first loss/first pay tranche. It will shoulder the first 15% of losses. In this case, the subordinate lenders will be repaid ahead of the senior lenders, largely because they are taking construction risk. In the Zaanstad deal, the entire of the B loan is funded upfront, which differs from the original PEBBLE structure which involved funding the B loan incrementally throughout construction.
The A notes were issued at project company level, instead of creating a separate SPV. The private placement was issued without a rating, and was reportedly oversubscribed, revealing ‘significant appetite from investors’, according to a source. The private placement was achieved with multiple institutional investors from Belgium, the Netherlands, France and Germany. The A notes have a 28-year maturity.
The table below provides an overview of the financing structure:
Financial structure
Type Financier Amount (€ million) Maturity (years) Other
Equity Pi2 B.V. 22.0 n/a n/a
Equity Bridge loan ING, NIBC 9.2 3.3 n/a
Subordinated “B” loan tranche ING, NIBC 12.3 8 n/a
Senior Secured - Capex revolver loan
ING, NIBC 42.0 3 n/a
Senior Secured - Milestone Bridge Facility
ING, NIBC 56.0 3 n/a
Senior Secured – Private placement “A” tranche
Institutional investors 72.0 28 Fixed rate
Source: InfraDeals
Zaanstad prison
Zaanstad prison
Sponsor allocation
Percentage allocation %
Ballast Nedam Concessions 100.0
Sponsor allocation 100.0
Source: InfraDeals
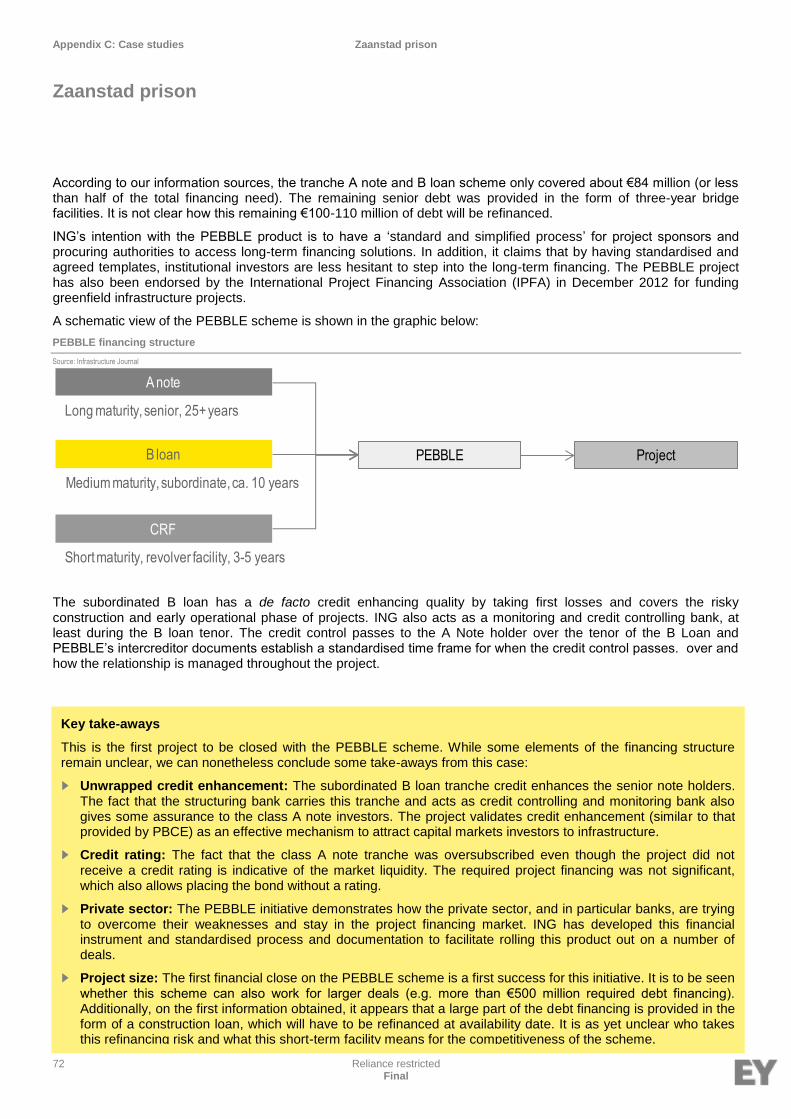
Appendix C: Case studies Zaanstad prison
Zaanstad prison
72 Reliance restricted Final
According to our information sources, the tranche A note and B loan scheme only covered about €84 million (or less than half of the total financing need). The remaining senior debt was provided in the form of three-year bridge facilities. It is not clear how this remaining €100-110 million of debt will be refinanced.
ING’s intention with the PEBBLE product is to have a ‘standard and simplified process’ for project sponsors and procuring authorities to access long-term financing solutions. In addition, it claims that by having standardised and agreed templates, institutional investors are less hesitant to step into the long-term financing. The PEBBLE project has also been endorsed by the International Project Financing Association (IPFA) in December 2012 for funding greenfield infrastructure projects.
A schematic view of the PEBBLE scheme is shown in the graphic below:
PEBBLE financing structure
Source: Infrastructure Journal
The subordinated B loan has a de facto credit enhancing quality by taking first losses and covers the risky construction and early operational phase of projects. ING also acts as a monitoring and credit controlling bank, at least during the B loan tenor. The credit control passes to the A Note holder over the tenor of the B Loan and PEBBLE’s intercreditor documents establish a standardised time frame for when the credit control passes. over and how the relationship is managed throughout the project.
A note
B loan
CRF
Long maturity, senior, 25+ years
Medium maturity, subordinate, ca. 10 years
Short maturity, revolver facility, 3-5 years
PEBBLE Project
Key take-aways
This is the first project to be closed with the PEBBLE scheme. While some elements of the financing structure remain unclear, we can nonetheless conclude some take-aways from this case:
► Unwrapped credit enhancement: The subordinated B loan tranche credit enhances the senior note holders. The fact that the structuring bank carries this tranche and acts as credit controlling and monitoring bank also gives some assurance to the class A note investors. The project validates credit enhancement (similar to that provided by PBCE) as an effective mechanism to attract capital markets investors to infrastructure.
► Credit rating: The fact that the class A note tranche was oversubscribed even though the project did not receive a credit rating is indicative of the market liquidity. The required project financing was not significant, which also allows placing the bond without a rating.
► Private sector: The PEBBLE initiative demonstrates how the private sector, and in particular banks, are trying to overcome their weaknesses and stay in the project financing market. ING has developed this financial instrument and standardised process and documentation to facilitate rolling this product out on a number of deals.
► Project size: The first financial close on the PEBBLE scheme is a first success for this initiative. It is to be seen whether this scheme can also work for larger deals (e.g. more than €500 million required debt financing). Additionally, on the first information obtained, it appears that a large part of the debt financing is provided in the form of a construction loan, which will have to be refinanced at availability date. It is as yet unclear who takes this refinancing risk and what this short-term facility means for the competitiveness of the scheme.

Appendix C: Case studies University of Hertfordshire student accommodation
University of Hertfordshire student accommodation
73 Reliance restricted Final
Project description
The table below provides key information on the ULiving project. As a social infrastructure project, the University of Herts project was not eligible for funding from the Project Bond Initiative.
Project overview
Region Country Amount (£ million) Payment Mechanism
Financial close date Duration (years) Grantor Sponsor
UK United Kingdom 193.5 Rental and commercial revenues
29 May 2013 50 The University of Hertfordshire
Uliving Consortium
Source: InfraDeals
This project aims to redevelop on-campus student accommodation and will see the transfer of 502 of the University’s existing residences and the delivery of a further 2,511 new build units at the University’s College Lane campus in Hatfield, UK. The project will also provide new sport pitches, a campus gym, informal learning and social spaces and a new dedicated bus route.
The construction of over 2,500 new bedrooms will be undertaken by Bouygues UK, under a contract worth ca. £117 million, and is expected to be completed by September 2016. Derwent Livingwill be responsible for the operation and facilities management elements of the contract for a total period of 50 years. The operation and facility management tasks will begin immediately to cover the existing student accommodation. Derwent Living’s provision of asset management and facilities management services for the new and existing units will be worth more than £200 million over the lifetime of the contract. Derwent Living will also refurbish the existing 500 bedrooms over the next three years.
The total equity of the sponsor, ULiving, amounts to £50 million and is mainly composed of Meridiam Infrastructure Europe II, representing £27.5 million (55%). Other shareholders include Bouygues Construction, who will carry out the construction of the project and Derwent Living, who will manage the operation and facilities for 50 years. Finally, the University of Hertfordshire is a shareholder as is UK insurance company, Legal & General, for a minority stake of 5%.
Financial structure
This project can be considered a primer, as it was the first greenfield infrastructure project to feature an unwrapped private bond placement with such a long tenor (41 years) and for which the bond was subscribed at financial close, i.e. with intrinsic construction risk.
The table below represents the financial structure of the ULiving project.
Financial structure
Type Financier Amount (£ million) Maturity (years) Other
Equity ULiving 50.0 n/a n/a
Unwrapped bond - Asset Backed - Index-linked
Legal & General 143.5 31/07/2054 Weighted average life: 21,43 years Coupon: 2,057% (semi-annual) Spread: 235bps Benchmark: UKTI 2 01/35 Rating: A-
Source: InfraDeals
University of Hertfordshire student accommodation
University of Hertfordshire student accommodation
Sponsor allocation
Percentage allocation %
Meridiam Infrastructure Europe II 55.0
The University of Hertfordshire 13.4
Derwent Living 13.4
Legal & General Investment Management 5.0
Bouygues Construction 13.2
Sponsor allocation 100.0
Source: InfraDeals

Appendix C: Case studies University of Hertfordshire student accommodation
University of Hertfordshire student accommodation
74 Reliance restricted Final
The index-linked bond was placed Royal Bank of Canada and is fully subscribed by Legal & General (L&G).
The bond has been rated A- by S&P with a ‘stable’ outlook. This high rating can be explained by the conservative financing structure and positive economic outlook for the project:
► A gearing ratio of 75:25
► Minimum and average DSCR of 1.59x and 1.75x, respectively
► The University is a well-established engineering university sought after by students
► The University is a shareholder in the equity, and thus has an incentive to make the project profitable
On the merits above, the bond was able to be placed without explicit credit enhancement, such as a monoline or liquidity facility.
Key take-aways
This project is a primer in Europe in terms of its financial structure. The following take-aways can be made from this case:
► Unwrapped bond: The bond was able to obtain an A-rating on the merits of the financial structure and economics of the project. No credit insurance or liquidity line was therefore needed.
► Long tenor: The tenor of 41 years is well beyond the market standard, but was most certainly helped by the fact that the bond was indexed linked. Given the fact that institutional investors such as pension funds have long-term liabilities linked to inflation, index-linked bonds can support them in mitigating this risk and therefore attract them to these longer maturity assets.
► Construction risk: The bond investor subscribed at financial close, thereby carrying a certain risk during the three-year construction period. The willingness of L&G to take this risk was most certainly helped by the creditworthiness of the construction firm, Bouygues, as well as the client’s willingness to also accept risks, e.g. taking an equity stake in the borrower. In this regard, it also demonstrates the importance of creditworthy and flexible contracting authorities to conclude this type of deal.
► Rating: Given an appropriate rating, investors are willing to take construction risk.

Appendix C: Case studies Holyrood student accommodation
Holyrood student accommodation
75 Reliance restricted Final
Project description
The Holyrood project is a 50-year concession with the University of Edinburgh to design, build, finance and maintain 1,165 units of student accommodation including a commercial restaurant and an outreach centre, which will provide office space, conference and teaching facilities. The accommodation will be located close to the city centre of Edinburgh within easy reach of the central campus, student union, sports centre and other city centre amenities. As a social infrastructure project, the Holyrood project was not eligible for funding from the Project Bond Initiative.
The table below represents key indicators of the Holyrood project.
Project overview
Region Country Amount (£ million) Payment Mechanism
Financial close date Duration (years) Grantor Sponsor
Europe United Kingdom 78 Rental and commercial revenues
31 July 2013 50 University of Edinburgh
Holyrood Student Accommodation
Source: InfraDeals
Balfour Beatty, a company specialised in infrastructure projects, is the sole shareholder to the project company and private party to the DBFM-contract. It is providing equity of £14.8 million.
Financial structure
Like the ULiving project, this project is similar in that in entails student accommodation and therefore certain commercial risks (e.g. rental rates, occupancy, etc.) for the private party. The main difference with ULiving is that the debt financing was a achieved through a listed bond placement with the involvement of a monoline credit insurer, i.e. Assured Guaranty.
The table below represents the financial structure of the Holyrood project.
Financial structure
Type Financier Amount (£ million) Maturity Other
Equity Balfour Beatty 14.8 n/a n/a
Fixed-rate bonds Market 31.5 35 Irish Stock Exchange; Coupon: 5.533%; Credit spread: 215bps over 2036 gilts
Index-linked bonds Market 31.5 35 Irish Stock Exchange; Coupon: 1.9713%; Credit spread: 190 bps over gilts
Source :Infrastructure Journal
Balfour Beatty selected Assured Guaranty’s proposal after it emerged as the cheapest option in a funding competition that the sponsor ran for the project (which had included both banking and private placement solutions).
The debt-to-equity ratio is 81:19. The debt financing of £63m was completely filled in by bonds listed on the Irish stock exchange. The bond issue has split 50/50 between fixed rate and index-linked bonds. Index-linked bonds are a good match against long-term liabilities of pension funds which are often linked to inflation or earnings, whilst fixed-rate bonds can be a good investment for investors looking to lock in long-term reliable returns, such as insurance companies, as these have liabilities which predominantly include fixed amounts payable on a specified future date. The bonds have been placed by Royal Bank of Canada to a small number (“less than six”) pension funds and insurance companies.
Assured Guaranty will guarantee the timely payment of principal and interest to bondholders throughout 2048, the maturity of the bonds. S&P and Moody’s rated the bonds AA- (stable) and A2 (stable), respectively, in line with the financial strength rating of the financial guarantors, Assured Guaranty (Europe) Ltd. and Assured Guaranty Municipal Corp. (AA- stable at S&P and A2 stable at Moody’s). The credit rating uplift was 5 notches from S&P and 4 from Moody’s above the underlying unsecured project (rated BBB stable and Baa3 stable by S&P and Moody’s, respectively), and according to the prospectus, is due to the fact that the rating agencies have solely considered the credit risk of the financial guarantors (i.e. Assured Guaranty) to issue their rating.
Although monoline wraps can no longer enhance bond ratings up to the triple-A level as they could prior to the 2008 financial crisis, the ratings uplift that Assured Guaranty can offer to typically BBB-rated infrastructure debt still offers considerable benefits for investors, particularly to pension funds and insurance companies. As discussed in our
Holyrood student accommodation
Holyrood student accommodation
Sponsor allocation
Percentage allocation %
Balfour Beatty Capital 100.0
Sponsor allocation 100.0
Source: InfraDeals

Appendix C: Case studies Holyrood student accommodation
Holyrood student accommodation
76 Reliance restricted Final
regulatory overview, there is a huge regulatory capital gain when the credit rating of such bonds changes from triple-B to single-A, and a significant advantage in taking it up further do double-A.
In addition to the rating enhancement, the real value of a monoline wrap is the regular monitoring over the lifetime of the bond by a competent and diligent third party. This is particularly advantageous on projects that involve construction risk because bond investors have progress reports during the drawdown phase.
Although ostensibly the project entails some commercial risks for the project company, in reality many of these risks are mitigated in the terms of the DBFM-contract. At the beginning of each academic year, the university informs (or ‘nominates’) the company how many rooms it will require. The university then assumes all risks associated with occupancy, rent collection and rental arrears over the period. The only real occupancy risk is that the university does not require all available accommodation at the start of the academic year, but this risk is considered slight given the strong demand for student accommodation in the city (occupancy rates in similar facilities at the university have averaged 97% over the past three years). Furthermore, the DBFM-agreement allows the project company to rent any rooms the university doesn’t nominate on its own account (e.g. to undergraduates). The only remaining risk was therefore that the university cannot meet its payment obligations, but the creditworthiness of Edinburgh University was considered very good according to the credit rating agencies.
Another beneficial aspect for the economics of the project is the limited amount of building space in the city of Edinburgh, with its historic city centre. This is considered to significantly limit the amount of competition the project will see from other student accommodation projects.
Key take-aways
This project marks the return of monoline insurance in Europe. It also confirms the trend that long-tenor debt is possible in the market, particularly for student accommodation projects. In addition, the project highlights the benefit of credit enhancement where the underlying rating is in the low BBB category. The following take-aways can be made from this case:
► Full wrap: The full credit wrap allowed the bond rating to get an uplift of four or five notches (to the rating of the financial guarantor), depending on the rating agency, above the underlying project rating. The rating above single -A allowed the bonds to price on tighter spreads, although perhaps higher than one would typically expect of a AA-/A2 rated investment.. Assured Guaranty helped the pricing on the bonds to overcome the competition from bank and private placement financing options, again highlighting the benefits of credit enhancement into the single A (and better) territory.
► Risk allocation: The willingness of the university to accept student credit risk and some occupancy risk, as well as the option for the private partner to rent unreserved space on its own account, significantly decreased the risks for the project company in the deal. This was certainly an element that increased investors’ appetite for the deal.

Appendix C: Case studies Pendleton Together Housing
Pendleton Together Housing
77 Reliance restricted Final
Project description
The Pendleton Together Housing project consists in the design, financing and refurbishment of 1,270 existing dwellings; and their maintenance for a period of 30 years in Salford, North West of Manchester, UK. Salford City Council has embarked on a public-private partnership to regenerate the Pendleton area, with plans to build new homes, refurbish existing council-owned properties, including the creation of more than ten hectares of new public space, such as allotments, walkways, cycle routes and a community farm. The private consortium, Pendleton Together, is working with the council to deliver the 30-year private finance initiative (PFI) – the New Pendleton Social Housing PFI – which all told is expected to deliver £650 million of investment. As a social infrastructure project, the Pendleton project was not eligible for funding from the Project Bond Initiative.
Pendleton is a densely populated area of Salford just a mile from Salford Quays, and is said to have high health needs. More than 40% of residents have no formal qualifications and just 41% of working age residents are in employment. It is in the bottom one per cent of the UK for health deprivation. As well as the physical improvements, the scheme is expected to create 500 jobs, generate 24 new small and medium sized enterprises, and provide skills training for 3,200 local people and 2,000 work experience placements.
Pendleton Together is owned by subsidiaries of Together Housing, a social housing developer in northern England, and has subcontracted the refurbishment works to Keepmoat.
The table below presents the main indicators of the New Pendleton PFI housing project.
Project overview
Region Country Amount (£ million) Payment Mechanism
Financial close date Duration (years) Grantor Sponsor
Europe United Kingdom 95 Availability-based 17 September 2013 30 Salford City Council SP+
Source: InfraDeals
The project has been 10 years in the making, and in procurement since 2010, was initially thrown off schedule first due to the UK government's value for money reviews in 2010 followed by the insolvency of one of its sub-contractors. A new financing solution then had to be found following the dissolution of the original bond arranger, Hadrian’s Wall Capital. Now the refurbishment of the 1,270 existing homes is expected to be completed by 2017.
Pendleton Together, which will manage the homes for the coming 30 years, took over management of the project from the Salford City Council at financial close. Together Housing Group is providing 100% of the £12.5 million equity required for the project.
Financial structure
This deal represents the first unwrapped bond financing within the UK’s PFI scheme. The success of the bond issue is expected to help kick-start the injection of institutional investor funding into other PFI projects.
The table below shows the finance structure of the project.
Financial structure
Type Financier Amount (£ million) Maturity (years) Other
Equity Consortium 12.5 n/a n/a
Class A senior secured notes
Pension Insurance Corporation
71.7 29 Irish Stock Exchange; Coupon: 5.414%; Treasury 4.25% 2032 as benchmark
Class B junior secured notes
Gravis Capital Partners 10.9 29 Irish Stock Exchange; Coupon: 8.35%; Treasury 4.25% 2032 as benchmark
Source: InfraDeals
The two-tranche unwrapped bond deal was managed by Investec Bank and FHW Dalmore Limited and it is understood that the bonds were entirely bought by two investors, Pension Insurance Corporation (PIC), a specialist provider of insurance solutions for defined benefit pension funds, and Gravis Capital Partners, a listed infrastructure fund. PIC stated that they bought the investment grade quality bonds as these provide a match for their pension
Pendleton Together Housing
Pendleton Together Housing
Sponsor allocation
Percentage allocation %
Together Housing Group 100.0
Sponsor allocation 100.0
Source: InfraDeals

Appendix C: Case studies Pendleton Together Housing
Pendleton Together Housing
78 Reliance restricted Final
liabilities. This transaction enables the pension insurance company to diversify their portfolio and to obtain a decent return above the risk free yields.
The Class A bonds are credit enhanced through the Class B subordinated bond. Senior debt due diligence and document negotiation has been carried out by FHW Capital LLP. FHW Dalmore Limited, will also be providing managing agent services for the bond investors for the duration of the concession.
As stated in the prospectus, there was no intention to obtain ratings from rating agencies in respect of either senior bond or junior bond. The deal was closed with a 87:13 gearing ratio.
Key take-aways
This project is an important step for the UK’s PFI scheme and the engagement of institutional investors in the debt capital markets. The following take-aways can be made from this case:
► Partial wrap: The senior class A bond benefits credit enhancement from the subordinated class B tranche. This partial wrap includes the sub-debt investors stepping in for 13% of the debt financing. Hence this also highlights the importance of credit enhancement.
► Market liquidity: The fact that both tranches could be placed with only two investors without the need for a credit rating, demonstrates that there is market appetite for long-term investment. In particular, not only for the credit-enhanced tranche, but also for the subordinated, junior tranche.
► Counterparty risk: As in many public-private partnership deals for social infrastructure, the contracting authority will make regular payments to the project company. Commercial risk is therefore limited, and the most important payment risk is the counterparty risk of the contracting authority. It is noteworthy that the payment guarantee is on a sub-sovereign, i.e. municipal, level but that the project was still able to be funded on a rather aggressive financial structure, e.g. 87:13 gearing ratio.

Appendix C: Case studies L2 ring road
L2 ring road
79 Reliance restricted Final
Project description
The L2 Rocade project is the first availability-based PPP deal in the French roads sector, and includes the 30-year DBFM of a 10km bypass around the city of Marseilles. The 35-year project includes the design and construction of the L2 Est (sixkm) and L2 Nord (four km) sections, along with the maintenance of the entire L2 bypass, a Trans-European Transport Network (TEN-T) route. The project will be built in a heavily urbanised area and is intended to alleviate congestion on Marseilles’ urban roads and reduce noise and pollution in the city and suburbs.
The road will connect the A7 motorway, between the north of Marseilles and Aix-en-Provence, with the A50, east of the city. The project will be constructed in two tranches. The first tranche is the L2 Est, which will effectively be a brownfield project expanding the section that was already built in the 1990s and is expected to be completed by 2016. The second tranche is the greenfield build of the L2 Nord.
EY understands that EIB approval was only given subject to certain technical conditions, making it very difficult for the PBCE (or EIB senior debt) to participate in the funding of this project
The table below represents a brief summary of the L2 project.
Project overview
The sponsors are a Bouygues-led consortium, which includes infrastructure equity funds CDC Infrastructure and Meridiam Infrastructure Finance II for 70% of the equity, as well as construction subcontractors EGIS Projects, Spie Batignolles and Colas for minority stakes. The sponsors have committed €30 million, distributed as follows:
Financial structure
This project, which has been long in the making, reached the financial close on October seven. It will cost €592 million (including construction, interest and other costs). The French state and other public authorities are providing most of the financing. The table below shows the financial structure of the L2 project:
A large part of the financing (>65%) comes from the French public purse. The remaining debt financing of €165 million, has been purchased by German insurance group Allianz, in a private placement. More than half of the total debt is backed by the Dailly scheme, meaning that repayment will be guaranteed by the French state. With the ‘cession de créances Dailly’ mechanism, the French state accepts to guarantee a portion of the payments to the lenders, provided that project completion has occurred. According to French law, however, only bank lending can
L2 ring road
L2 ring road
Region Country Amount (€ million)
Payment Mechanism
Financial close date
Duration (years) Grantor Sponsor
Europe France 592 Availability-based
7 October 2013 35 Marseille Town Council (CUMPM), Departement du Rhône
Societe de la Rocade L2 de Marseille
Source: InfraDeals
Sponsor allocation
Percentage allocation %
CDC Infrastructure 35.0
Meridiam Infrastructure Finance II 35.0
Bouygues 14.0
Spie Batignolles 7.0
EGIS Projects 5.0
Colas 4.0
Sponsor allocation 100.0
Source: InfraDeals
Table title
Type Entity Amount (€ million) Maturity (years) Other
Equity Sponsor 30.0 n/a Equity for €3 million and shareholders' loan for €27 million
Senior secured bonds (tranche I) Allianz 79.0 28 Issued by the project SPV Rating Moody's: Baa3
Senior secured bonds (tranche II) Allianz 86.0 30 Issued by a securitization vehicule, FCT Rocade L2 Marseille Rating Moody's: Baa3 Dailly scheme
Public subsidies French Government
397.0 n/a n/a
Source: InfraDeals

Appendix C: Case studies L2 ring road
L2 ring road
80 Reliance restricted Final
benefit from the Dailly guarantee, and therefore this second tranche has been advanced by French banks Société Générale and Crédit Agricole but will ultimately be funded by bonds issued by a securitization vehicule (fonds commun de titrisation, or FCT) and on lent to the project SPV. The banks have provided a €30 million equity bridge loan and a €4 million VAT facility. The project leverage is 84.5:15.5 and the ADSCR is equal to 1.05.
The project has received a Baa3 rating from Moody’s (low investment grade), reflecting the following elements:
► Strong rationale of the project, i.e. facilitating traffic congestion in one of the French largest cities
► Sector knowledge and credit rating of the consortium sponsors
► Availability-payment mechanism
► Protection against operational risk provided to the FCT bonds via the Dailly scheme
Key take-aways
This project is important for the French PPP market, which has been immobilised since new government came into place in 2012. This is a large and strategically important project, and the fact that it has been financed by a project bond solution has sent an important signalling effect to the market. The following take-aways can be made from this case:
► Dailly tranche: This large and complex project involves a large number of stakeholders, including public authorities, equity partners, subcontractors and bond investors. Typical of French infrastructure projects, it has also benefitted from the Dailly tranche, which provides an immense credit uplift (the French state is AA+ rated) after the construction phase. The credit enhancement and the involvement of the public purse were significant elements in the success of this deal.
► Construction risk: Although the public financial guarantee is not provided during the construction phase, Allianz has nonetheless subscribed the debt as from financial close. This is again a signal that institutional investors are willing to accept construction risk.
► Ticket size: Allianz has subscribed the full amount of the private placement, amounting to €165 million. This is indicative that at the top end of the market, there is liquidity and appetite for large ticket sizes. They have, however, requested a shadow rating, which may be a requirement of their investment guidelines that requiring investments to have a minimum credit rating as provided by one of the three big credit rating agencies.
Appendix C: Case studies Mersin International Port
Mersin International Port
81 Reliance restricted Final
Project description
The refinancing of the Mersin International Port (MIP) consists of the first infrastructure bond to ever be issued in Turkey. This port was privatized in 2007 and a 36-year concession sold to a 50-50 joint venture between Akfen Holdings, a publicly-listed Turkish conglomerate, and PSA, a Singaporean port operator. It is one of the largest in the country by tonnage, handling around 1,26m TEUs of container traffic in 2012. Between 2008 and 2012, MIP’s container throughput and conventional cargo throughput grew at a compound annual growth rate (CAGR) of 9.8% and 6.3%, respectively. MIP can set its own tariffs and its EBITDA margin was nearly 60% on 2012 revenues of US$248m. As a project outside the European Union, the MIP project was not eligible for funding from the Project Bond Initiative.
The table below shows key indicators of the Mersin International Port.
Project overview
Region Country Amount ($ million) Payment Mechanism
Financial close date Duration (years) Grantor Sponsor
Europe Turkey 450 Operational cash flow
2/08/2013 36 n.a. Mersin International Port
Source: InfraDeals
Financial structure
The refinancing involves the replacement of a senior loan amounting of $580 million with a $450 million bullet bond, Turkey’s first infrastructure bond, and a bridge facility guaranteed by PSA, the port operator. The bond was issued by MIP and listed on the Irish Stock Exchange. Other information over this refinancing bond is presented in the table below.
Financial structure
Type Financier Amount ($ million) Maturity (years) Other
Fixed-rate bond issue Private investors 450 12/08/2020 (first potential call on 12/08/2018 at a redemption price of 101.47%)
Coupon: 5.875% Credit spread: 383.4 bps over T2 07/31/2020 Lead managers: Citi, DBS Bank and UniCredit Rating: Moody's (Baa3), Fitch (BBB-)
Source: InfraDeals
This bond issue was arranged by Citi, DBS and UniCredit and attracted over 100 investors. The anchor investor in the bond were Clifford Capital, a specialist investment fund set up by several international banks in Singapore, the European Bank for Reconstruction and Development (EBRD) for US$80 million each and the International Finance Corporation (IFC) for US$66 million. According to EBRD, the bond market has been chosen in lieu of traditional bank market due to the better current conditions for refinancing.
Moody’s and Fitch have rated this financial instrument Baa3 and Fitch BBB-, respectively whilst Turkey’s rating is Ba1 at Moody’s and BBB- at Fitch. Moody’s explained the difference with the sovereign rating by stating that its rating considers MIP’s balanced mix of imports and exports and product diversification, the long-term concession agreement and the group’s strong financial metrics. This rating agency also noted that the port remains exposed to volatility in container traffic combined with the fact that 80% of its revenue is generated from container terminal services. Fitch outlined the strong market position and the moderate exposition to macro-economic shocks as confirmed by the small decrease in revenue during the 2008 downturn.
Mersin International Port
Mersin International Port

Appendix C: Case studies Mersin International Port
Mersin International Port
82 Reliance restricted Final
Key take-aways
The MIP refinancing demonstrates that market liquidity for infrastructure assets is not constrained to ‘safe havens’, which can be instructive for doing deals in some of Europe’s more troubled economies and or developing markets. The following take-aways can be made from this case:
► Competitive pricing: As was noted by the EBRD, the bond market was chosen in lieu of traditional bank market due to better financing conditions. This confirms the conclusions of the market analysis we have performed earlier in our report.
► Low investment grade: Despite the rather low credit rating of the bond (Baa3 / BBB-), this relatively large issue was well subscribed. This shows that investors are currently interested in riskier assets although this was a relatively short term (7 years) bond at a wide spread.
► Currency exposure: The bond was issued in US dollars, which certainly increased its attractiveness as investors have less foreign currency risk exposure. The bond was structured as a Eurodollar bond, probably because (i) the original project financing that was being repaid was denominated in USD and (ii) a broader group of international investors could be tapped.

Appendix C: Case studies Case Study : Canada
Lessons can be learned from the development of the Canadian project bond market over the last years
83 Reliance restricted Final
Development of the Canadian project bond market
Prior to the financial crisis in 2008 and 2009, Canadian PPPs were typically financed by banks or insurance companies through long term credit facilities. In addition, several large deals were financed with bonds wrapped by monoline insurers in order to enhance the rating and the pricing.
The financial crisis and the significant reduction in credit facilities in 2008 and 2009 have negatively impacted all asset classes, including infrastructure projects. Hence the bonds issued by the companies were unwrapped, i.e. with a lower rating, and became unattractive to long-term institutional investors. As a result, Canadian banks were unable to lend on a long term basis and most European banks active on the Canadian project finance market left it, making the bank importance in the infrastructure market to decrease even further. In the peak of the financial crisis, the short term (up to 8 years) and bridge loan bank-funded structures were really popular but for the public sector, this could not represent a long term solution to the funding issues.
Over the last years, a project bond market has emerged in Canada and is now one of the primary financing sources for infrastructure projects through PPP. The success of the Canadian project bond market merits to be explored further to see what lessons can be learned for developing project bonds in Europe.
The emergence of the project bond market in Canada for PPP projects since the financial crisis is mainly due to the following elements:
► The creditworthiness of Canadian sovereign debt as well as its financial institutions remained strong, especially as compared many European countries and banks that were downgraded during the Eurozone crisis.
► The departure of European banks made the project loan market more fragile and hence Canadian authorities had to find an alternative to finance infrastructure projects.
► A clear pipeline of projects in various sectors (e.g. Health and Transport) driven by multi-year infrastructure plans in several provinces which offered continuous opportunities.
► Some Canadian departments developed standardized documentation for PPP tenders in 2009
– Investors, advisors and legal teams became familiar with PPP
– Rating agencies assessed the rating based on formalized templates
Underwriters, in cooperation with major Canadian financial institutions, supported the bond option by closely collaborating with the rating agencies to evaluate the new risk allocation model, which was quite different from previous years, when monolines were enhancing the credit rating attached to PPP projects. In fact, monoline insurers were legally restricted from providing guarantees for the issuance of Canadian project bonds and therefore had little involvement in the development of the Canadian project bond market (except for a few transactions done offshore). Politicians also supported the initiative by quickly adapting government templates and by making an appropriate risk allocation on various projects, particularly with respect ot financing and construction risk. As a result, the bond market for PPP projects exploded from an average annual rate of CAD500 million per year from 2007 to 2009 to reach more than CAD4 billion by 2011.
The fact that Canada was able to maintain its AAA sovereign credit rating helped liquidity in the market.
Case Study : Canada
Lessons can be learned from the development of the Canadian project bond market over the last years
Long term Canadian PPP debt financing
Source: www.p3canada.ca
0
500
1.000
1.500
2.000
2.500
3.000
3.500
4.000
4.500
2008 2009 2010 2011
CA
D b
illio
n
Bond Bank

Appendix C: Case studies Case Study : Canada
Lessons can be learned from the development of the Canadian project bond market over the last years
84 Reliance restricted Final
Structure of the deals in the Canadian market
The bonds are issued by the sponsor through a SPV and the repayments depend on the payments received from the Public Authority, which can take several forms:
► Milestone or progress payments during the construction phase
► Constant payments from construction completion such as availability-based payments or market-based payments
► Construction risk is often covered by combining parental performance guarantees (often from investment grade rated sponsors), letters of credit, performance and materials bonding and subcontractor default insurance. This addresses concerns of rating agencies and investors.
In order to ensure the bonds’ liquidity, the certainty that regular payments are made is crucial.
The bonds were generally issued at a credit rating above A- (with some being issued at a BBB+ rating), supported by an equity participation of between 7% and 20%. The tenor achieved on this market is up to 35 years (generally between 20 to 30 years) and pricing has been at about 200 bps over the yield-to-market (YTM) on government bonds of similar duration. The spread to which bidders commit is typically benchmarked with spreads of a basket of comparable bonds traded in the market.
The most significant obstacle for bond financing in Canada is the cost and complexity of the transaction as it involves more complex documentation than a bank or private placement solution, due to the additional due diligence process and disclosure requirements, such as the prospectus. Additionally, ratings from primary agencies are also required at financial close and at regular intervals over the life of the project.
Today, the project bond market in Canada is an established market with a continuous growing base of participants and a specific PPP bond market.
Lessons learned
Whilst the Canadian project finance market remains small – both in terms of size as well as volume - compared to the European market, a number of lessons from the development of the Canadian project bond market over the last few years.
► Pipeline: Liquidity was attracted to the Canadian infrastructure market, partially because of a clear project pipeline. The project bond market saw a boost when the long-term bank financing of infrastructure started to become scarce.
► Standard documentation: In Canada, contractual documentation was standardized to the maximum. Structural changes are driven by the equity sponsors and financial advisors who continually educate institutional investors. Furthermore, the financial community and rating agencies consulted regularly in order clarify the key indicators to achieving the defined credit rating.
► Flexibility: Public authorities took an active role in supporting projects, for example by communicating clear objectives and coordinating stakeholders. There was also flexibility in the Canadian model, which adapted to the transaction specificities and the risk profiles or expectations of the investors.

85 Reliance Restricted Final
1. Key findings from stakeholder interviews
Appendix D: Stakeholder interviews

Appendix D: Stakeholder interviews Key findings from stakeholder interviews
Introduction
86 Reliance Restricted Final
We have collected feedback and insights from stakeholders of the European infrastructure sector in order understand their experience with the PBCE and its impact on infrastructure development and investment decisions. We selected the stakeholders to interview in agreement with the European Commission and the EIB, and we were able to obtain 13 interviews with senior representatives of the European infrastructure community, representing the following company types:
► three insurance companies
► three banks
► two procuring authorities
► two advisors (e.g. financial structuring, credit monitoring, etc.)
► one asset manager
► one private sponsor
► one industry association
The interviewees’ companies represented several countries, including the UK, Belgium, the Netherlands, Germany, France and Spain.
Our interviews conducted by us with each interviewee typically lasted one and a half to two hours, and followed a structured Interview Guide.
We would like to express our gratitude to the interviewees for their participation and openness in sharing their views.
Key findings from stakeholder interviews
Introduction
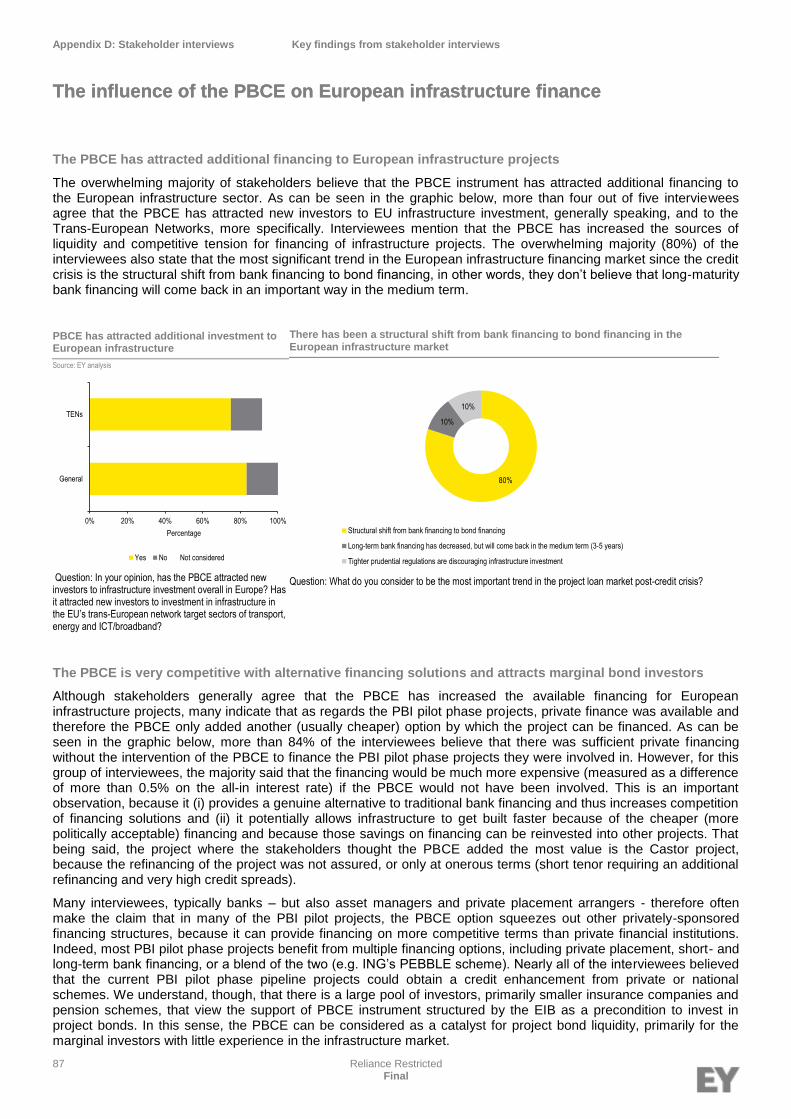
Appendix D: Stakeholder interviews Key findings from stakeholder interviews
The influence of the PBCE on European infrastructure finance
87 Reliance Restricted Final
The PBCE has attracted additional financing to European infrastructure projects
The overwhelming majority of stakeholders believe that the PBCE instrument has attracted additional financing to the European infrastructure sector. As can be seen in the graphic below, more than four out of five interviewees agree that the PBCE has attracted new investors to EU infrastructure investment, generally speaking, and to the Trans-European Networks, more specifically. Interviewees mention that the PBCE has increased the sources of liquidity and competitive tension for financing of infrastructure projects. The overwhelming majority (80%) of the interviewees also state that the most significant trend in the European infrastructure financing market since the credit crisis is the structural shift from bank financing to bond financing, in other words, they don’t believe that long-maturity bank financing will come back in an important way in the medium term.
The PBCE is very competitive with alternative financing solutions and attracts marginal bond investors
Although stakeholders generally agree that the PBCE has increased the available financing for European infrastructure projects, many indicate that as regards the PBI pilot phase projects, private finance was available and therefore the PBCE only added another (usually cheaper) option by which the project can be financed. As can be seen in the graphic below, more than 84% of the interviewees believe that there was sufficient private financing without the intervention of the PBCE to finance the PBI pilot phase projects they were involved in. However, for this group of interviewees, the majority said that the financing would be much more expensive (measured as a difference of more than 0.5% on the all-in interest rate) if the PBCE would not have been involved. This is an important observation, because it (i) provides a genuine alternative to traditional bank financing and thus increases competition of financing solutions and (ii) it potentially allows infrastructure to get built faster because of the cheaper (more politically acceptable) financing and because those savings on financing can be reinvested into other projects. That being said, the project where the stakeholders thought the PBCE added the most value is the Castor project, because the refinancing of the project was not assured, or only at onerous terms (short tenor requiring an additional refinancing and very high credit spreads).
Many interviewees, typically banks – but also asset managers and private placement arrangers - therefore often make the claim that in many of the PBI pilot projects, the PBCE option squeezes out other privately-sponsored financing structures, because it can provide financing on more competitive terms than private financial institutions. Indeed, most PBI pilot phase projects benefit from multiple financing options, including private placement, short- and long-term bank financing, or a blend of the two (e.g. ING’s PEBBLE scheme). Nearly all of the interviewees believed that the current PBI pilot phase pipeline projects could obtain a credit enhancement from private or national schemes. We understand, though, that there is a large pool of investors, primarily smaller insurance companies and pension schemes, that view the support of PBCE instrument structured by the EIB as a precondition to invest in project bonds. In this sense, the PBCE can be considered as a catalyst for project bond liquidity, primarily for the marginal investors with little experience in the infrastructure market.
The influence of the PBCE on European infrastructure finance
PBCE has attracted additional investment to European infrastructure
Source: EY analysis
Question: In your opinion, has the PBCE attracted new investors to infrastructure investment overall in Europe? Has it attracted new investors to investment in infrastructure in the EU’s trans-European network target sectors of transport, energy and ICT/broadband?
0% 20% 40% 60% 80% 100%
General
TENs
Percentage
Yes No Not considered
There has been a structural shift from bank financing to bond financing in the European infrastructure market
Question: What do you consider to be the most important trend in the project loan market post-credit crisis?
80%
10%
10%
Structural shift from bank financing to bond financing
Long-term bank financing has decreased, but will come back in the medium term (3-5 years)
Tighter prudential regulations are discouraging infrastructure investment
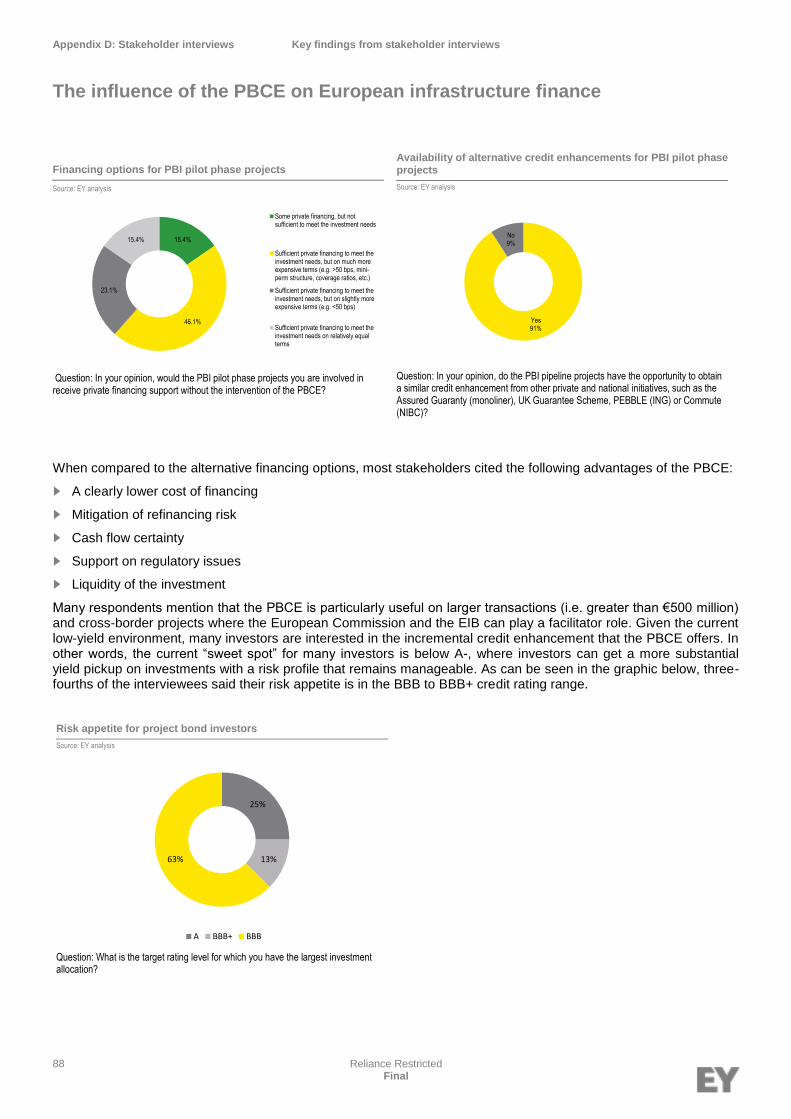
Appendix D: Stakeholder interviews Key findings from stakeholder interviews
The influence of the PBCE on European infrastructure finance
88 Reliance Restricted Final
When compared to the alternative financing options, most stakeholders cited the following advantages of the PBCE:
► A clearly lower cost of financing
► Mitigation of refinancing risk
► Cash flow certainty
► Support on regulatory issues
► Liquidity of the investment
Many respondents mention that the PBCE is particularly useful on larger transactions (i.e. greater than €500 million) and cross-border projects where the European Commission and the EIB can play a facilitator role. Given the current low-yield environment, many investors are interested in the incremental credit enhancement that the PBCE offers. In other words, the current “sweet spot” for many investors is below A-, where investors can get a more substantial yield pickup on investments with a risk profile that remains manageable. As can be seen in the graphic below, three-fourths of the interviewees said their risk appetite is in the BBB to BBB+ credit rating range.
Availability of alternative credit enhancements for PBI pilot phase projects
Source: EY analysis
Question: In your opinion, do the PBI pipeline projects have the opportunity to obtain a similar credit enhancement from other private and national initiatives, such as the Assured Guaranty (monoliner), UK Guarantee Scheme, PEBBLE (ING) or Commute (NIBC)?
Yes91%
No9%
Chart title
Source:
Notes to chart
3. Note text.
Risk appetite for project bond investors
Source: EY analysis
Question: What is the target rating level for which you have the largest investment allocation?
25%
13%63%
A BBB+ BBB
Financing options for PBI pilot phase projects
Source: EY analysis
Question: In your opinion, would the PBI pilot phase projects you are involved in receive private financing support without the intervention of the PBCE?
15.4%
46.1%
23.1%
15.4%
Some private financing, but notsufficient to meet the investment needs
Sufficient private financing to meet theinvestment needs, but on much moreexpensive terms (e.g. >50 bps, mini-perm structure, coverage ratios, etc.)
Sufficient private financing to meet theinvestment needs, but on slightly moreexpensive terms (e.g. <50 bps)
Sufficient private financing to meet theinvestment needs on relatively equalterms

Appendix D: Stakeholder interviews Key findings from stakeholder interviews
The influence of the PBCE on European infrastructure finance
89 Reliance Restricted Final
The focus of the PBCE should be on uplifting sub-investment grade projects to an investment grade rating
Whereas many respondents applaud the incremental ‘credit enhancement’ option offer by the PBCE as opposed to some ‘credit substitution’ solutions (e.g. Assured Guaranty or UK Guarantee schemes), many interviewees indicate that the market has evolved since the PBCE was first being discussed and designed by the European Commission and the EIB in 2010-2011. Today there is a large pool of liquidity for all investment grade projects, and many large investors have set up teams that can structure deals and manage the risks of BBB-rated projects. Most investors would therefore like to see the focus of the PBCE instrument on uplifting non-investment grade projects to investment grade.
When asked which adjustments they would like to see in the PBCE, the most prevalent response is the focus on bringing large infrastructure projects to an investment-grade level. Most investors feel comfortable with the risks of availability-based PPPs in northwestern Europe in established sectors, such as transport and social infrastructure. The areas where the financing market is much tighter is in riskier sovereigns of Southern and Eastern Europe and sectors with higher risk profiles, such as the renewable energy generation sector. Other areas for improvement in the PBCE mentioned by stakeholders are the following:
► The percentage of financing that can be guaranteed should not be fixed at 20%, but should be flexible depending on the needs of the projects. Lower risk projects may only need 10%, whereas other projects may need 30% or more.
► There should also be flexibility to allow the percentage guarantee / sub debt to decrease in the operational phase, once the construction and transition risks are subsided. The bond investors can also be given the option to get rid of the PBCE in the operational phase if it is no longer deemed necessary.
► The PBCE should be made available to a wide range of sectors, not just Projects of Common Interest. This will create a greater pipeline for the PBCE and also a more diversified portfolio for the European Commission and EIB (please see Appendix B on this topic).
► There should be distinct guidelines for the EIB acting as a “first loss” provider different from those used as a senior lender. This will allow the PBCE to be more easily rolled out without too much hindrance from the general bank lending guidelines.
Investor satisfaction with PBCE in its current form
Source: EY analysis
Question: Does the PBCE, in its current form, meet your investment needs?
Somewhat44.4%
Much22.22%
Completely33.33%
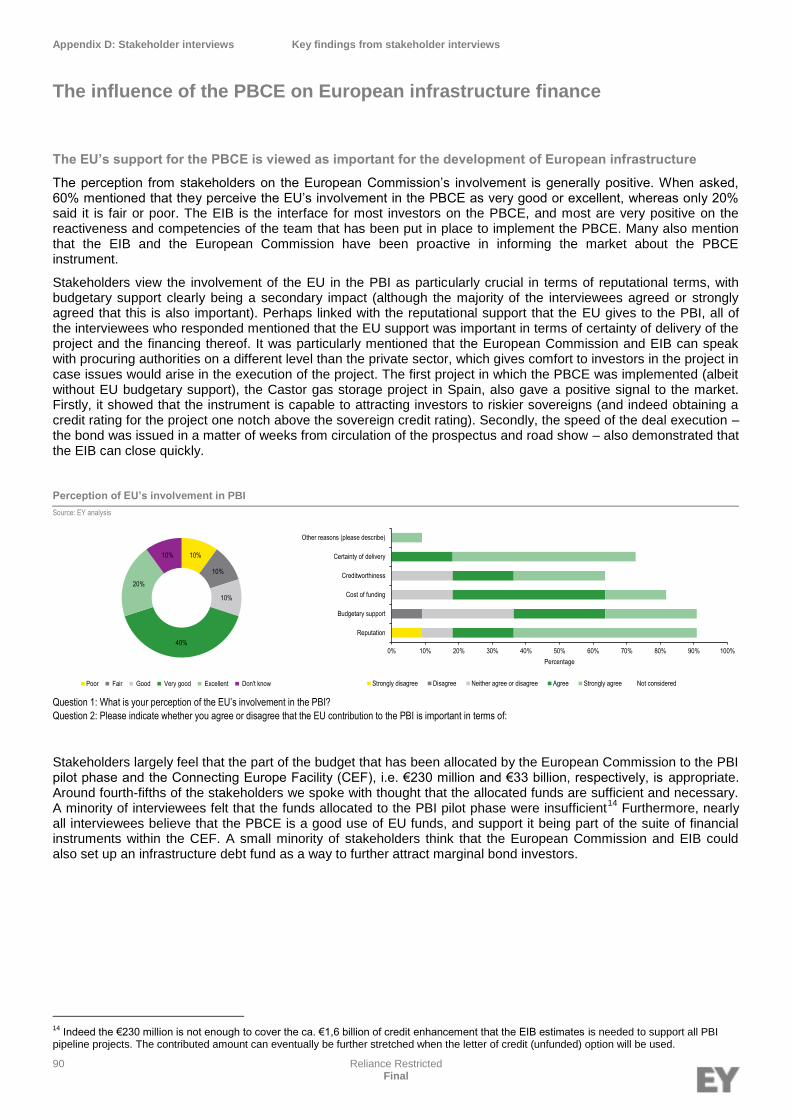
Appendix D: Stakeholder interviews Key findings from stakeholder interviews
The influence of the PBCE on European infrastructure finance
90 Reliance Restricted Final
The EU’s support for the PBCE is viewed as important for the development of European infrastructure
The perception from stakeholders on the European Commission’s involvement is generally positive. When asked, 60% mentioned that they perceive the EU’s involvement in the PBCE as very good or excellent, whereas only 20% said it is fair or poor. The EIB is the interface for most investors on the PBCE, and most are very positive on the reactiveness and competencies of the team that has been put in place to implement the PBCE. Many also mention that the EIB and the European Commission have been proactive in informing the market about the PBCE instrument.
Stakeholders view the involvement of the EU in the PBI as particularly crucial in terms of reputational terms, with budgetary support clearly being a secondary impact (although the majority of the interviewees agreed or strongly agreed that this is also important). Perhaps linked with the reputational support that the EU gives to the PBI, all of the interviewees who responded mentioned that the EU support was important in terms of certainty of delivery of the project and the financing thereof. It was particularly mentioned that the European Commission and EIB can speak with procuring authorities on a different level than the private sector, which gives comfort to investors in the project in case issues would arise in the execution of the project. The first project in which the PBCE was implemented (albeit without EU budgetary support), the Castor gas storage project in Spain, also gave a positive signal to the market. Firstly, it showed that the instrument is capable to attracting investors to riskier sovereigns (and indeed obtaining a credit rating for the project one notch above the sovereign credit rating). Secondly, the speed of the deal execution – the bond was issued in a matter of weeks from circulation of the prospectus and road show – also demonstrated that the EIB can close quickly.
Stakeholders largely feel that the part of the budget that has been allocated by the European Commission to the PBI pilot phase and the Connecting Europe Facility (CEF), i.e. €230 million and €33 billion, respectively, is appropriate. Around fourth-fifths of the stakeholders we spoke with thought that the allocated funds are sufficient and necessary. A minority of interviewees felt that the funds allocated to the PBI pilot phase were insufficient
14 Furthermore, nearly
all interviewees believe that the PBCE is a good use of EU funds, and support it being part of the suite of financial instruments within the CEF. A small minority of stakeholders think that the European Commission and EIB could also set up an infrastructure debt fund as a way to further attract marginal bond investors.
14
Indeed the €230 million is not enough to cover the ca. €1,6 billion of credit enhancement that the EIB estimates is needed to support all PBI pipeline projects. The contributed amount can eventually be further stretched when the letter of credit (unfunded) option will be used.
Perception of EU’s involvement in PBI
Source: EY analysis
Question 1: What is your perception of the EU’s involvement in the PBI?
Question 2: Please indicate whether you agree or disagree that the EU contribution to the PBI is important in terms of:
10%
10%
10%
40%
20%
10%
Poor Fair Good Very good Excellent Don't know
0% 10% 20% 30% 40% 50% 60% 70% 80% 90% 100%
Reputation
Budgetary support
Cost of funding
Creditworthiness
Certainty of delivery
Other reasons (please describe)
Percentage
Strongly disagree Disagree Neither agree or disagree Agree Strongly agree Not considered
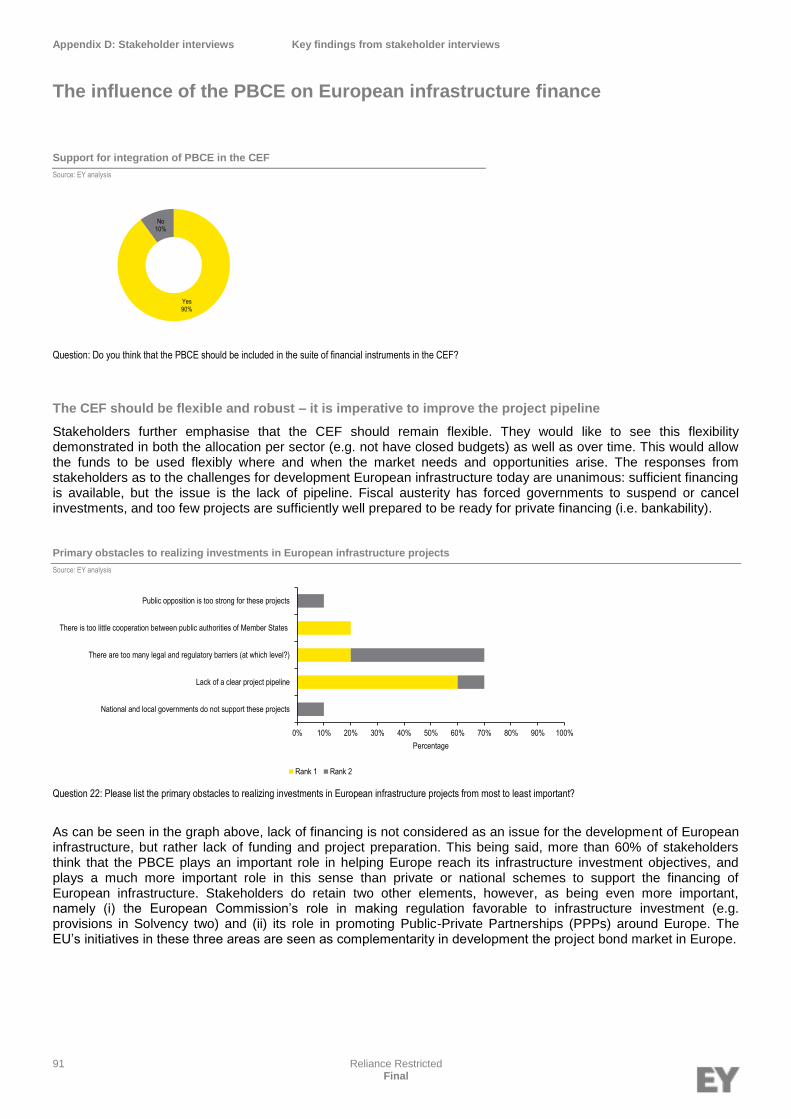
Appendix D: Stakeholder interviews Key findings from stakeholder interviews
The influence of the PBCE on European infrastructure finance
91 Reliance Restricted Final
The CEF should be flexible and robust – it is imperative to improve the project pipeline
Stakeholders further emphasise that the CEF should remain flexible. They would like to see this flexibility demonstrated in both the allocation per sector (e.g. not have closed budgets) as well as over time. This would allow the funds to be used flexibly where and when the market needs and opportunities arise. The responses from stakeholders as to the challenges for development European infrastructure today are unanimous: sufficient financing is available, but the issue is the lack of pipeline. Fiscal austerity has forced governments to suspend or cancel investments, and too few projects are sufficiently well prepared to be ready for private financing (i.e. bankability).
Primary obstacles to realizing investments in European infrastructure projects
Source: EY analysis
Question 22: Please list the primary obstacles to realizing investments in European infrastructure projects from most to least important?
As can be seen in the graph above, lack of financing is not considered as an issue for the development of European infrastructure, but rather lack of funding and project preparation. This being said, more than 60% of stakeholders think that the PBCE plays an important role in helping Europe reach its infrastructure investment objectives, and plays a much more important role in this sense than private or national schemes to support the financing of European infrastructure. Stakeholders do retain two other elements, however, as being even more important, namely (i) the European Commission’s role in making regulation favorable to infrastructure investment (e.g. provisions in Solvency two) and (ii) its role in promoting Public-Private Partnerships (PPPs) around Europe. The EU’s initiatives in these three areas are seen as complementarity in development the project bond market in Europe.
0% 10% 20% 30% 40% 50% 60% 70% 80% 90% 100%
National and local governments do not support these projects
Lack of a clear project pipeline
There are too many legal and regulatory barriers (at which level?)
There is too little cooperation between public authorities of Member States
Public opposition is too strong for these projects
Percentage
Rank 1 Rank 2
Support for integration of PBCE in the CEF
Source: EY analysis
Question: Do you think that the PBCE should be included in the suite of financial instruments in the CEF?
Yes90%
No10%

Appendix D: Stakeholder interviews Key findings from stakeholder interviews
The influence of the PBCE on European infrastructure finance
92 Reliance Restricted Final
Finally, when asked whether infrastructure can become a true asset class like utilities or real estate, the opinions of stakeholders is mixed, with approximately half agreeing and half disagreeing. Those who agree think this is possible only if a number of large public issues come to the market and a certain frequency can be established (e.g. “one deal a month”). Those who disagree cite the fact that most project bond investors are “buy and hold” investors, so there would not be much liquidity in the market (bid-ask spreads would be high). Furthermore, they mention that each infrastructure projects has its specificities (i.e. they are idiosyncratic making them difficult to bundle), which requires a certain level of expertise and experience. On this point, we try to draw some lessons learned from a study of the Canadian project bond market (see section C).
European infrastructure as an asset class
Source: EY analysis
Question: In your opinion, will the PBCE help establish the infrastructure sector as a more mainstream asset class?
Yes54%
No46%

93 Reliance Restricted Final
1. Ad-hoc audit question evaluation framework
Appendix E

Appendix E Ad-hoc audit question evaluation framework
Ad-hoc audit question evaluation framework - Effectiveness
94 Reliance Restricted Final
Ad-hoc audit question evaluation framework
Ad-hoc audit question evaluation framework - Effectiveness
Ad-hoc audit question framework - Effectiveness
Questions based on Tender
Specifications par. 2.2.1 Judgement criteria Types of analysis
Primary sources
(Key reference actors/
institutions)
Secondary sources
(Key reference documents)
(1.1.)
To what extent has the PBI
helped provide or is likely to help providing additional
financing for infrastructure
projects in the TEN-T, TEN-E and ICT and broadband
sectors?
► Level of financing to the transport, renewable energy and ICT sectors
► Pricing differential between PBI financing solution and bank solution
► Feedback on implementability of PBI for infrastructure transactions
► Project evaluation
► Case studies
► Interviews with institutional investors, banks, equity funds, etc.
► EIB
► DG MOVE / TEN-T EA
► Pension funds
► Insurance companies
► Procuring authorities
► Data providers (e.g. InfraNews, Prequin, Thomson, etc.)
► Project documentation
(1.2.)
To what extent has the PBI
encouraged debt capital
market financing of infrastructure projects?
► Level of financing to the transport, renewable energy and ICT sectors
► Pricing differential between PBI financing solution and bank solution
► Feedback on implementability of PBI for infrastructure transactions
► Desk research
► Project evaluation
► Case studies
► Interviews with institutional investors, banks, equity funds, etc.
► Pension funds
► Insurance companies
► Banking institutions
► Data providers (e.g. InfraNews, Prequin, Thomson, etc.)
► Project documentation
(1.3.)
Did the EU Contribution help
to attract additional sources of
capital?
► Composition of the financing structure of pilot phase projects (in particular Castor)
► Involvement of institutional investors
► Experience of investors in infrastructure projects
► Project evaluation
► Case studies
► Interviews with project sponsors, contracting authorities, etc.
► EIB
► DG MOVE / TEN-T EA
► DG ENER
► Project documentation (e.g. Castor prospectus)
► Case studies
►
(1.4.)
Has the EU involvement in
both reputational and budgetary terms increased the
credibility of the PBI vis-à-vis
investors?
► Perception of financiers of EU/EIB involvement
► Ranking of experience of working with the EU institutions
► Feedback on sufficiency of financial support and expectations
► Interviews with institutional investors, banks, equity funds, etc.
► Pension funds
► Insurance companies
► Banking institutions
► Equity funds
► Market intelligence (e.g. InfraNews, Infrastructure Journal, etc.)
(1.5.a.)
Would other forms of credit
enhancement or insurance better correspond to market
needs?
► Satisfaction of financing community with PBI
► Usage of other financing instruments other than PBI
► Feedback on the modalities of PBI
► Interviews with institutional investors, banks, equity
► Desk research
► Pension funds
► Insurance companies
► Banking institutions
► Equity funds
► Market intelligence (e.g. InfraNews, Infrastructure Journal, etc.)
(1.5.b.)
How, if necessary, could the
PBI solution be made more
attractive?
► Comparison matrix between PBI and other bank and non-bank financing solutions
► Satisfaction of financing community with PBI
► Feedback on the modalities of PBI
► Interviews with institutional investors, banks, equity
► Project evaluation
► Case studies
► Desk research
► EIB
► Pension funds
► Insurance companies
► Banking institutions
► Procuring authorities
► Project documentation

Appendix E Ad-hoc audit question evaluation framework
Ad-hoc audit question evaluation framework - Efficiency
95 Reliance Restricted Final
Ad-hoc audit question framework - Efficiency
Questions based on Tender
Specifications par. 2.2.1 Judgement criteria Types of analysis
Primary sources
(Key reference actors/
institutions)
Secondary sources
(Key reference documents)
(2.1.)
To what extent is the PBI
instrument and the resulting
bonds likely to be competitive with other available sources of
financing?
► Comparison matrix between PBI and other bank and non-bank financing solutions
► Satisfaction of financing community and procuring authorities with PBI
► Project evaluation
► Case studies
► Interviews with institutional investors, banks, equity funds, etc.
► EIB
► Pension funds
► Insurance companies
► Banking institutions
► Procuring authorities
► Project documentation
► Case studies
► Market intelligence (e.g. InfraNews, Infrastructure Journal, etc.)
(2.2.a.)
How does the PBI compare to
the LGTT or other risk-sharing
facilities in terms of results at a similar stage of maturity of
the instrument?
► Take-up rates of PBI versus LGTT in the first operational year
► Satisfaction of project stakeholders of PBI and LGTT
► Desk research
► Interviews with European Commission/EIB
► EIB
► DG MOVE / TEN-T EA
► Procuring authorities
► Banks
► Project documentation
(2.2.b.)
Is there sufficient awareness of
the PBI?
► Spontaneous citation of PBI as source of financing
► Hit rates of EIB and EC websites referencing PBI
► Interviews with institutional investors, banks, equity funds, etc.
► Interviews and data provided by European Commission / EIB
► DG ECFIN
► DG MOVE
► EIB
► Pension funds
► Insurance companies
► Banking institutions
► Procuring authorities
► Commission / EIB websites
(2.3.)
Are there preliminary
indications as to whether the EU contribution to the
initiative is sufficient/
appropriate to achieve EU policy objectives?
► Comparison of targeted investment in trans-European projects versus expected investment catalysed by PBI
► Realised take-up of instrument in first year of operations versus expected take-up
► Interviews with European Commission/EIB
► Desk research
► DG ECFIN
► DG MOVE
► DG ENER
► EIB
► Internal Commission documents
► Published Commission documents
Ad-hoc audit question evaluation framework - Efficiency

Appendix E Ad-hoc audit question evaluation framework
Ad-hoc audit question evaluation framework - EU value added
96 Reliance Restricted Final
Ad-hoc audit question framework – EU value added
Questions based on Tender
Specifications par. 2.2.1 Judgement criteria Types of analysis
Primary sources
(Key reference actors/
institutions)
Secondary sources
(Key reference documents)
(3.1.a.)
What is the EU added value of
the PBI to TEN-T, TEN-E and
ICT and broadband projects?
► Number of TEN-T, TEN-E and Digital Agenda projects which had other financing alternatives other than PBI
► Evolution of successfully closed financing for TEN-T, TEN-E and Digital Agenda projects over the last 5 or 10 years
► Interviews with European Commission/EIB
► Desk research
► DG MOVE
► DG ENER
► DG CNCT
► EIB
► Project documentation
► EC websites of DG MOVE, DG ENER and DG CNCT
► EIB website
(3.1.b.)
To what extent and by which
means can the EU added value of the instrument be
maximised?
► Number of projects for which other capital market solutions, besides PBI, were considered
► Evolution in number of trans-European projects that have successfully closed financing
► Proportion of trans-European projects receiving financing through other means than the PBI
► Incidences of major European infrastructure projects failing because of lack of financing
► Interviews with European Commission/EIB
► Desk research
► EIB
► DG ECFIN
► DG MOVE
► DG ENER
► DG CNECT
► Market intelligence (e.g. InfraNews, Infrastructure Journal, etc.)
► Project documentation
Ad-hoc audit question evaluation framework - EU value added

Appendix E Ad-hoc audit question evaluation framework
Ad-hoc audit question evaluation framework - Additionality
97 Reliance Restricted Final
Ad-hoc audit question framework - Additionality
Questions based on Tender
Specifications par. 2.2.1 Judgement criteria Types of analysis
Primary sources
(Key reference actors/
institutions)
Secondary sources
(Key reference documents)
(4.1.a.)
Has the principle of
additionality been respected, i.e. has private financing been
attracted?
► Number of projects for which other capital market solutions, besides PBI, were considered
► Evolution in number of trans-European projects that have successfully closed financing versus the evolution in the infrastructure market in general
► Project evaluation
► Desk research
► Project sponsors
► Equity funds
► EIB
► Project documentation
► Data providers (e.g. InfraNews, Prequin, Thomson, etc.)
► Market intelligence (e.g. InfraNews, Infrastructure Journal, etc.)
(4.1.b.)
How can the EU budget best
be used to attract the maximum amount of private
funding?
► Reasons provided for failure to close financing of large European infrastructure projects, and in particular, trans-European projects
► Ranking of attractiveness of various available financial instruments by institutional investors
► Survey of most important investment criteria for institutional and other infrastructure investors
► Interviews with institutional investors, banks, equity funds, etc.
► Interviews with European Commission/EIB
► Desk research
► Pension funds
► Insurance companies
► Sovereign wealth funds
► Family offices
► Alternative asset managers
► EIB
► DG MOVE
► DG ENER
► Market intelligence (e.g. InfraNews, Infrastructure Journal, etc.)
(4.2.a.)
To what extent is the PBI
coherent with other relevant
EU policies and financial
instruments? Are there any overlaps or contradictions?
► Comparison of stated objectives of EU infrastructure policies with objectives of PBI
► Mapping of EU financial instruments
► Desk research
► Interviews with European Commission/EIB
► DG ECFIN
► DG BUDGET
► DG MOVE / TEN-T EA
► DG ENER
► EIB
► Internal Commission documents
► EC websites, including those of DG REGIO
Ad-hoc audit question evaluation framework - Additionality

98 Reliance Restricted Final
1. Bibliography
Appendix F

Appendix F Bibliography
Bibliography
99 Reliance Restricted Final
► Debt instruments to support Infrastructure Financing - Update on the EU-EIB Project Bond Initiative, Workshop Science and Technology Options Assessment, Brussels, 2013
► The State of Broadband 2012: Achieving Digital Inclusion For All, The Broadband Commission, 2012
► The State of Broadband 2013: Universalizing Broadband, The Broadband Commission, 2013
► Digital Agenda Toolbox: Smart Investments for Structural Funds, Smart Specialization Platform, European Commission, 2013
► Investing in Infrastructure: Overview and Treatment under Solvency II, Nadine Gatzert, Thomas Kosub, Department of Insurance Economics and Risk Management Friedrich-Alexander-University, Erlangen-Nürnberg, 2013
► Broadband Networks and Open Access, OECD Digital Economy Papers, No. 218, OECD, 2013
► Unbundling and financial investors, Shareholdings in Transmissions System Operators Dr Christian Hampel, Florence, 2012
► Global trends in renewable energy investment 2013, Frankfurt School of Finance & Management gGmbH, Frankfurt am Main, 2013
► Investing in growth: Europe’s next challenge, McKinsey Global Institute, 2012
► World Broadband Statistics Q1 2013, Point Topic Ltd, London, 2013
► PF2: A User Guide, Infrastructure UK, London, 2012
► Project Bond Initiative, Project selection the key to success, DB Research, Frankfurt am Main, 2013
► An outline guide to Project Bonds Credit Enhancement and the Project Bond Initiative, EIB, Luxembourg, 2012
► PEBBLE Intercreditor Agreement Term Sheet, IPFA Standard Form 1.0, International Project Finance Association
► Investment in telecommunications infrastructure, growth, and employment - recent research, Wieck, Reinhard; Vidal, Miguel, International Telecommunications Society (ITS), Copenhagen, 2010
► EU-EIB Project Bond Initiative launched with start of pilot phase, EIB, Luxembourg, 2012
► How Europe’s Initiative To Stimulate Infrastructure Project Bond Financing Could Affect Ratings, Standard & Poor’s, London, 2011
► Fitch Comments on EU Project Bonds Initiative, Global Infrastructure & Project Finance, FitchRatings, London, 2011
► Europe 2020 Project Bond Initiative, Moody’s Investor Service, London, 2012
► Loan Guarantee Instrument for TEN-T Projects – Mid-term Review, EIB, Luxembourg, 2011
► Strategic Transport Infrastructure Needs to 2030, OECD, 2011
► Pension Funds Investment in Infrastructure: A Survey, OECD, 2011
► Infrastructure 2013: Global Priorities, Global Insights, EY, Washington, 2013
► Final Report, Expert Group 5, Funding Strategy and Financing Perspectives for the TEN-T, DIRECTORATE B - Transport Logistics, TEN-T and Comodality, The Director European Commission, 2010
► High-Level Workshop on Non-Bank Funding of Growth and Jobs in Europe, Irish Presidency, Dublin, 2012
► Supporting Long-Term Financing of the European Economy, European Financial Services Round Table, Brussels, 2013.
► The Matching Adjustment: Theory and Practice, Insurance Europe, 2013
► Energy Challenges and Policy, European Commission, 2013Volts for Volks, The Economist, 2013
► Utilities Switch Off Investment in Fossil Fuel Plants, New York Times, 2013
► Record Carbon Plunge Means Pain for Europe’s Utilities: Energy, Bloomberg News, 2013
► Digital Agenda Scoreboard report, European Commission, 2013
Bibliography
Bibliography

Appendix F Bibliography
Bibliography
100 Reliance Restricted Final
► Canada as a global leader: Delivering Value through Public-Private Partnerships at Home and Abroad, Gill Vijay, Dinick Sarah, The Conference Board of Canada, Canada, 2013
► Why Project Bonds? Why Now?, McLaughlin Cathleen, Yessios Dorina, Allen & Overy LLP Latin America, Latin Lawyer magazine April 2011 (vol 10, issue 3), 2011
► Canada - An intelligence Report, Infrastructure Investor, PEI Media, December/January 2010
► Developments in PPP and DCM Debt Structures, HSBC, April 2013
► Consultation on the Europe 2020 Project Bond Initiative (the “Initiative”), Dexia Response, April 2011
► Public-Private Partnerships: an investment in Canada’s infrastructure, Media Planet, June 2013
► Project Bonds - How to Attract Investors?, RBC Capital Markets, June 2012
► Second coming: the re-emergence of the Canadian bond market for P3 projects, McMillan, November 2012
► The Canadian PPP model and its applicability in Latin America, Adrian Barrios, Infrastructure, 2012
► 2014 – 2020 EU budget priorities and major projects financing activities: alternatives for energy sector, Baltic Utilities Seminar, EY, April 2013
► Quantitative Tools for Impact Assessment in Transport, Joint Research Centre STOA Workshop, September 2013
► Model-based support to EU policymaking: Experience of the RHOMOLO model, d’Artis Kancs, J.2 Regional Economic Modeling, DG Joint Research Centre, European Commission, European Parliament, STOA, September 2013
► Debt instruments to support Infrastructure Financing, Update on the EU-EIB Project Bond Initiative, European Investment Bank, STOA, Workshop Science and Technology Options Assessment, Brussels, September 2013
► Financing and assessing large scale infrastructure projects, Conference European Parliament, Brussels, September 2013
► Mid-Term Evaluation of the Risk-Sharing Financial Facility (RSFF), Mann Erika, Gannon Frank, Hibon Arnauld, Nowotny Ewald, Soete Luc, Vela Carmen, July 2010
► Proposal for a regulation of the European Parliament and of the Council, The European Commission, Brussels, 2011
► Call for proposals for projects of common interest in the field of the trans-European transport network under the Annual Work Program 2011, Trans-European Transport Network Executive Agency, 2012
► A pilot for the Europe 2020 Project Bond Initiative, The European Commission, Brussels, 2011
► A framework for the next generation of innovative financial instruments - the EU equity and debt platforms, The European Commission, 2011
► Fitch Comments on EU Project Bonds Initiative, EMEA Special Report, Fitch Ratings, 2011
► How Europe’s Initiative To Stimulate Infrastructure Project Bond Financing Could Affect Ratings, Standard & Poor’s, 2011
► Europe 2020 Project Bond Initiative, Capable of credit-enhancing PFI/PPP project bonds from low investment-grade to single-A ratings, Moody’s Investors Services, Global Project Finance, 2011
► Energy markets in the European Union in 2011, The European Commission, Luxembourg, 2012
► Increasing lending to the economy: implementing the EIB capital increase and joint Commission-EIB initiatives, Joint Commission-EIB report to the European Council, June 2013
► Towards smart and green mobility, Olivier Debande, European Investment Bank, Brussels, October 2011
► Power Shift: The Rise of Export Credit and Development Finance in Major Projects, Baker & Mc Kenzie, Infrastructure Journal, 2013
► TEN-T Trans-European Transport Network, Implementation of the Priority Projects, European Commission - Directorate General for Mobility and Transport, November 2012

Appendix F Bibliography
Bibliography
101 Reliance Restricted Final
► Risk Gaps: First-Loss Protection Mechanisms, Hervé-Mignucci Morgan, Frisari Gianleo, Micale Valerio, Mazza Federico, Climate Policy Initiative, 2013
► Private Infrastructure Finance and Investment in Europe, Georg Inderst, Inderst Advisory, EIB Working Papers, European Investment Bank, 2013
► Infrastructure 2013: Global Priorities, Global Insights, Jonathan D. Miller, Urban Land Institute / Ernst & Young, 2013
► Regulation (EU) No 1316/2013 of the European Parliament and of the Council of 11 December 2013 (CEF Regulation), 2013
► Public and private financing of infrastructure: Evolution and economics of private infrastructure finance, EIB Papers, Volume 15, No. 1, European Investment Bank, 2010
► Investment projects in energy infrastructure, Commission Staff Working Document, European Commission, 2012
► Annual report 2012: Europe’s low-carbon challenge and the electricity network, European Network of Transmission System Operators for Electricity, 2013
► Annual report 2012: Securing Europe’s energy future: implementing the internal market for gas, European Network of Transmission System Operators for Gas, 2013
► Infrastructure productivity: How to save $1 trillion a year, McKinsey Global Institute, McKinsey Infrastructure Practice, 2013
► Market Update: Review of the European PPP Market in 2012, European PPP Expertise Centre (EPEC), EIB, 2012
Websites
► Infrastructure Journal (www.ijonline.com)
► Project Finance Magazine (www.projectfinancemagazine.com)
► Project Finance International (www.pfie.com)
► International Project Finance Association (www.ipfa.org)
► Inspiratia (http://inspiratia.com/home/)
► InfraNews (www.infra-news.com)
► InfraDeals (http://www.infra-deals.com)
► Proyecto Castor (http://www.proyectocastor.com)
► InfraPPP Infrastructure knowledge (http://infrapppworld.com)
► Baker & McKenzie (http://www.bakermckenzie.com)
► Climate Policy Initiative (http://climatepolicyinitiative.org)
► European Commission (http://ec.europa.eu)
► Irish Stock Exchange (http://www.ise.ie)
► European Bank for Reconstruction and Development (http://www.ebrd.com)
► Financier Worldwide (http://www.financierworldwide.com)
► European Union (http://europa.eu)
► European Investment Bank (http://www.eib.org/)
► Eurostat (http://epp.eurostat.ec.europa.eu)
► International Energy Agency (http://www.iea.org)

102 Reliance Restricted Final
1. Abbreviations
Appendix G

Appendix G Abbreviations
Abbreviations
103 Reliance Restricted Final
$ US Dollar
€ Euro
£ British Pounds
4G Fourth Generation (technology)
ACS Actividades de Construcción y Servicios
ADSL Asymmetric Digital Subscriber Line
BAFO Best and Final Offer
bn Billion
Bod Board of Directors
Bps Basis Point
BTMU The Bank of Tokyo-Mitsubishi
B.V. Besloten Vennootschap
CAGR Compound Annual Growth Rate
CLO Collateralized Loan Obligation
CEF Connecting Europe Facility
DAE Digital Agenda for Europe
DBFM Design, Build, Finance, Maintain
DG CONNECT Directorate General for Communications Networks, Content & Technology
DG ECFIN
DG ENER
Directorate General for Economic and Financial Affairs
Directorate General for Energy
DG ENERGY Directorate General for Energy
DG MOVE Directorate General for Mobility and Transport
DG REGIO Directorate General for Regional and Urban Policy
DIF Dutch Infrastructure Fund
DSL Digital Subscriber Line
EA Executive Agency
EBITDA Earnings Before Interests, Taxes, Depreciation and Amortization
EBRD European Bank for Reconstruction and Development
EC The European Commission
EIB
ENTSO-E
ENTSO-G
E(Ri)
E(Rp)
The European Investment Bank
European Network of Transmission System Operators for Electricity
European Network of Transmission System Operators for Gas
Expected return on the asset i
Expected portfolio return
EU The European Union
EUR Euro
FCT
FLP
Fonds commun de titrisation
First Loss Piece
Abbreviations
Abbreviations
Appendix G Abbreviations
Abbreviations
104 Reliance Restricted Final
FTTB/H Fiber to the Building / Home
H1 20XX First semester of year 20XX
HDSPA High-speed Downlink Packet Access
ICT Information and Communications Technology
IFC International Finance Corporation
IFRS International Financial Reporting Standards
IPFA International Project Financing Association
KfW Kreditanstalt für Wiederaufbau
LGTT Loan Guarantee Instrument for Trans-European Transport Network Projects
LLP Limited Liability Partnership
LNG
LTIF
Liquefied Natural Gas
Long-term investment fund
m Million
M&A Mergers and Acquisitions
Mbps
MFF
Megabit per Second
Multinannual Financial Framework
MIP
MPT
Mersin International Port
Modern Portfolio Theory
n.a. or n/a Non Available or Non Applicable
NGA Next Generation Access
NII Netherlands Investment Institution
O&M
OFTO
Operating and Maintenance
Offshore Transmission Owner
OTAS Ojer Telekomünikasyon A.Ş.
PBCE
PEBBLE
Project Bond Credit Enhancement
Patch and Element Based grey Box Linear Equation Solver
PBI Project Bond Initiative
PF2 Private Finance 2
PFI Private Finance Initiative
PKO Powszechna Kasa Oszczędności
PPP Public-Private Partnership
QX 20XX Quarter X of year 20XX
RGD Rijksgebouwendienst
RWS Rijkswaterstaat
SA Société Anonyme
S&P Standard & Poor’s
SBF Stand-by Liquidity Facility
SCR Solvency Capital Requirements

Appendix G Abbreviations
Abbreviations
105 Reliance Restricted Final
SMP Significant Market Power
SPV Special Purpose Vehicle
TEN-E Trans-European Energy Network
TEN-T Trans-European Transport Network
TEU Twenty-foot Equivalent Unit
TSO Transmission System Operator
UGS Underground Gas Storage
UK The United Kingdom
US The United States of America
VAT
Wi
Value Added Tax
Proportion weight
VDSL Very-high-bitrate Digital Subscriber Line
YTM
Ρij
Ϭp
Ϭmkt
Ϭ2p
Yield to maturity
Correlation coefficient
Risk
Market risk
Portfolio variance

106 Reliance Restricted Final
1. Stakeholders' Interview Guide
Appendix H

Appendix H Stakeholders' Interview Guide
Stakeholders' Interview Guide
107 Reliance Restricted Final
Name of interviewee:
Organisation/Unit:
Date of interview:
► Key questions
1 The pilot phase of the Europe 2020 Project Bond Initiative (‘PBI’) became operational in November 2012, but was already being discussed in various forums of the EU since the fall of 2010. How did you become aware of the PBI and when (approximately)?
Activity Month/year
Conversations with EC-EIB ☐
EC-EIB presentation at industry event ☐
Other presentation at industry event ☐
Industry literature (news, trade journals, etc.) ☐
EC-EIB website ☐
Other (please explain) ☐
2 Please describe your experience with the Project Bond Credit Enhancement (PBCE) facility.
Have invested in a project bond using the PBCE ☐
Reviewing the PBCE in a transaction which has not yet reached Financial Close ☐
Reviewed the PBCE in a transaction, but the PBCE option was not retained ☐
Reviewed the PBCE in a transaction, but decided not to invest ☐
No transaction experience with PBCE, only know it from market knowledge ☐
Never heard of PBCE ☐
Other (please explain) ☐
3 In your opinion, has the PBCE attracted new investors to infrastructure investment overall in Europe? Has it
attracted new investors to investment in infrastructure in the EU’s trans-European network target sectors of transport, energy and ICT/broadband?
Note to interviewer: Please ask interviewee to explain their answer
General TENs
Yes ☐ ☐
No ☐ ☐
Stakeholders' Interview Guide
Stakeholders' Interview Guide

Appendix H Stakeholders' Interview Guide
Stakeholders' Interview Guide
108 Reliance Restricted Final
4 In your opinion, will the PBCE help establish the infrastructure sector as a more mainstream asset class? Note to interviewer: Please ask interviewee to explain their answer
Yes ☐
No ☐
5 In your opinion, would the PBI pilot phase projects you are involved in receive private financing support without the intervention of the PBCE?
Note to interviewer: Please ask interviewee to explain their answer.
No private financing support ☐
Some private financing, but not sufficient to meet the investment needs ☐
Sufficient private financing to meet the investment needs, but on much more expensive terms (e.g. >50 bps, mini-perm structure, coverage ratios, etc.)
☐
Sufficient private financing to meet the investment needs, but on slightly more expensive terms (e.g. <50 bps)
☐
Sufficient private financing to meet the investment needs on relatively equal terms ☐
6 For the projects you are involved in, have there been the other competing financial structures to bond financing?
Long-term bank financing ☐
Mini-perm bank financing ☐
Institutional investor solution (bank-intermediated) ☐
Institutional investor solution (Other) ☐
Other financing solution (please indicate) ☐
No other alternatives ☐
7 How would you compare the PBCE financing option versus these alternative financing structures?
Much worse
Worse Equivalent Better Much better
Further explanation on answer
Cost of funding ☐ ☐ ☐ ☐ ☐
Financing commitment ☐ ☐ ☐ ☐ ☐
Mitigation of refinancing risk ☐ ☐ ☐ ☐ ☐
Clear Financial Close procedure ☐ ☐ ☐ ☐ ☐
Cash flow certainty ☐ ☐ ☐ ☐ ☐
Financing liquid during construction period
☐ ☐ ☐ ☐ ☐
Support on regulatory issues ☐ ☐ ☐ ☐ ☐
Exit strategy available in the short term ☐ ☐ ☐ ☐ ☐
Other (up to 3) ☐ ☐ ☐ ☐ ☐

Appendix H Stakeholders' Interview Guide
Stakeholders' Interview Guide
109 Reliance Restricted Final
8 In your opinion, do the PBI pipeline projects have the opportunity to obtain a similar credit enhancement from other private and national initiatives, such as the Assured Guaranty (monoliner), UK Guarantee Scheme, PEBBLE (ING) or Commute (NIBC)?
Note to interviewer: Please ask interviewee to explain their answer
Yes ☐
No ☐
If you answered yes to the above, what is in your opinion the key value added of the PBCE versus these other instruments (cite up to 3 elements)? If you answered no, please explain why the private and national initiatives were not available for the PBI pilot phase projects (up to three reasons).
9 Does the PBCE, in its current form, meet your investment needs?
Note to interviewer: Please ask interviewee to explain their answer.
Not at all A little Somewhat Very much so Completely
☐ ☐ ☐ ☐ ☐
10 How would you describe your satisfaction with the PBCE term sheet?
Poor Fair Good Very good Excellent Don’t know
☐ ☐ ☐ ☐ ☐ ☐
11 How would you describe your satisfaction with the following elements of the PBCE term sheet?
Note to interviewer: Please ask interviewee to explain their answer.
Very negative
Negative Neutral Positive Very positive Don’t know
Ticket size (financing commitment)
☐ ☐ ☐ ☐ ☐ ☐
Legal maturity ☐ ☐ ☐ ☐ ☐ ☐
Pricing ☐ ☐ ☐ ☐ ☐ ☐
Coverage ratios ☐ ☐ ☐ ☐ ☐ ☐
Cashflow waterfall ☐ ☐ ☐ ☐ ☐ ☐
Reserve accounts ☐ ☐ ☐ ☐ ☐ ☐
Conditions precedent ☐ ☐ ☐ ☐ ☐ ☐
Security package ☐ ☐ ☐ ☐ ☐ ☐
Are there other important or controversial points not listed above that are particularly important?

Appendix H Stakeholders' Interview Guide
Stakeholders' Interview Guide
110 Reliance Restricted Final
► Secondary questions
12 What is your perception of the EU’s involvement in the PBI?
Note to interviewer: Please ask interviewee to explain their answer.
Poor Fair Good Very good Excellent Don’t know
☐ ☐ ☐ ☐ ☐ ☐
13 Please indicate whether you agree or disagree that the EU contribution to the PBI is important in terms of:
Note to interviewer: Please ask interviewee to explain their answer.
14 How would you qualify the EIB’s role in the transaction process, and in particular in the following elements:
Note to interviewer: Please ask interviewee to explain their answer.
Poor Fair Good Very good Excellent N/A
Attracting investment (e.g. as an anchor investor)
☐ ☐ ☐ ☐ ☐ ☐
Financial structuring ☐ ☐ ☐ ☐ ☐ ☐
Due diligence ☐ ☐ ☐ ☐ ☐ ☐
Credibility ☐ ☐ ☐ ☐ ☐ ☐
Other reasons (up to 3) ☐ ☐ ☐ ☐ ☐ ☐
15 Did you feel that the EIB was supportive of your concerns as a senior investor?
Note to interviewer: Please ask interviewee to explain their answer.
Yes ☐
No ☐
Strongly disagree
Disagree Neither agree nor disagree
Agree Strongly agree
Reputation ☐ ☐ ☐ ☐ ☐
Budgetary support ☐ ☐ ☐ ☐ ☐
Cost of funding ☐ ☐ ☐ ☐ ☐
Creditworthiness ☐ ☐ ☐ ☐ ☐
Certainty of delivery ☐ ☐ ☐ ☐ ☐
Other reasons (please describe) ☐ ☐ ☐ ☐ ☐

Appendix H Stakeholders' Interview Guide
Stakeholders' Interview Guide
111 Reliance Restricted Final
16 We understand that the targeted total investment with the first part of the PBI pilot phase (ending December 2013) is €4.5 billion. In your opinion, is the EU contribution of €230 million (20x multiplier effect) sufficient to reach the this objective?
Note to interviewer: Please ask interviewee to explain their answer.
Yes ☐
No ☐
17 The Connecting Europe Facility (CEF) will allocate €30-50 billion to trans-European infrastructure projects until
2020 through the use of financial instruments. Do you think the this financial support is sufficient to reach Europe’s objectives (cfr. estimated investment need in the previous question)?
Note to interviewer: Please ask interviewee to explain their answer
Yes ☐
No ☐
18 In your opinion, is the risk allocation between private investors and the public sector optimal under the PBI?
Note to interviewer: Please ask interviewee to explain their answer
Yes ☐
No ☐
19 Do you think that the PBCE should be included in the suite of financial instruments in the CEF?
Note to interviewer: Please ask interviewee to explain their answer
Yes ☐
No ☐
If you answered no, how do you think that the CEF can best be deployed, i.e. what other financial
instruments would you recommend?
20 If you answered yes to the question above, should the PBCE be included in its current form?
Yes ☐
No ☐
How could the PBCE be improved to better suit bond investors’ needs?

Appendix H Stakeholders' Interview Guide
Stakeholders' Interview Guide
112 Reliance Restricted Final
21 Please state the importance of the following initiatives to reaching the Europe’s infrastructure investment objectives.
Not at all A little Some-
what Much Comp-
letely Further explanation on answer
PBI ☐ ☐ ☐ ☐ ☐
EU Structural Funds ☐ ☐ ☐ ☐ ☐
Unbundling directive ☐ ☐ ☐ ☐ ☐
Prudential regulation (e.g. Solvency 2)
☐ ☐ ☐ ☐ ☐
National guarantee schemes (e.g. UK Guarantee Scheme)
☐ ☐ ☐ ☐ ☐
National infrastructure funds
☐ ☐ ☐ ☐ ☐
Private sector schemes (e.g. Assured Guaranty, PEBBLE-COMMUTE, etc.)
☐ ☐ ☐ ☐ ☐
PPP initiatives ☐ ☐ ☐ ☐ ☐
Others (please explain) ☐ ☐ ☐ ☐ ☐
22 Please list the primary obstacles to realizing investments in European infrastructure projects from most to least
important?
Note to interviewer: Please ask interviewee to explain their answer
Explanation Rank Further explanation
There is insufficient market demand / economic rationale for these projects
National and local governments do not support these projects
Lack of a clear project pipeline
There are too many legal and regulatory barriers (at which level?)
There is too little cooperation between public authorities of Member States
Public opposition is too strong for these projects
There is a lack of financing
Other (please explain)
23 Referring to the previous question, would you change this ranking order if we only consider large European
infrastructure projects, and in particular, trans-European network projects (TEN-T, TEN-E, broadband)?
Note to interviewer: Please ask interviewee to explain their answer
24 What do you consider to be the most important trends in the project loan market post-credit crisis?
Structural shift from bank financing to bond financing ☐
Long-term bank financing has decreased, but will come back in the medium term (3-5 years) ☐

Appendix H Stakeholders' Interview Guide
Stakeholders' Interview Guide
113 Reliance Restricted Final
Infrastructure project profiles have gotten fundamentally riskier ☐
Tighter prudential regulations are discouraging infrastructure investment ☐
Other trends (please explain up to three) ☐
25 Please rank your investment criteria for investing in infrastructure project debt?
Explanation Rank Further explanation
Yield
Credit rating (lower risk)
Sector experience
Knowledge of the country / political environment
Other (please explain)
26 What is the target rating level for which you have the largest investment allocation?
AAA ☐ AA- ☐ A- ☐ BBB- ☐
AA+ ☐ A+ ☐ BBB+ ☐ Below BBB- ☐
AA ☐ A ☐ BBB ☐
27 Would you invest if the standalone project was sub-investment grade, or do you require at least a BBB-rated underlying project?
Yes ☐
No ☐
28 In your opinion, what are the main risks for project bond investors?
Insignificant Slightly
significant Moderately significant
Significant Highly significant
Further explanation on answer
Construction risk ☐ ☐ ☐ ☐ ☐
Transaction structure ☐ ☐ ☐ ☐ ☐
Lack of credit rating ☐ ☐ ☐ ☐ ☐
Off-take risk ☐ ☐ ☐ ☐ ☐
Lack of institutional knowledge
☐ ☐ ☐ ☐ ☐
Other (up to 3) ☐ ☐ ☐ ☐ ☐
29 In your opinion, do you think that project finance transactions require institutional investors to make substantial investments in specific skills to deal with such financial instruments?
Yes ☐

Appendix H Stakeholders' Interview Guide
Stakeholders' Interview Guide
114 Reliance Restricted Final
No ☐
30 If the answer to the previous question was yes, please indicate if you would be willing to make these required investments.
Note to interviewer: Please ask interviewee to explain their answer
Yes ☐
No ☐
31 Do you think capital markets will develop an appetite for project bonds inclusive of construction risk in the absence of PBCE or other forms of public support?
Note to interviewer: Please ask interviewee to explain their answer
Yes ☐
No ☐

EY | Assurance | Tax | Transactions | Advisory
About EY EY is a global leader in assurance, tax, transaction and advisory services. The insights and quality services we deliver help build trust and confidence in the capital markets and in economies the world over. We develop outstanding leaders who team to deliver on our promises to all of our stakeholders. In so doing, we play a critical role in building a better working world for our people, for our clients and for our communities. EY refers to the global organization, and may refer to one or more, of the member firms of Ernst & Young Global Limited, each of which is a separate legal entity. Ernst & Young Global Limited, a UK company limited by guarantee, does not provide services to clients. For more information about our organization, please visit ey.com. © 2014 EYGM Limited All Rights Reserved.