acute myeloid leukemia induced by graded reduction of a lineage-specific transcription factor, pu.1
TRANSCRIPT

1Harvard Institutes of Medicine, Room 954, 77 Avenue Louis Pasteur, Boston, Massachusetts 02115, USA. 2Department of Pathology, Brigham and Women’sHospital, Boston, Massachusetts 02115, USA. 3Department of Cancer Immunology and AIDS, Dana-Farber Cancer Institute, Harvard Medical School, Boston,Massachusetts 02115, USA. 4Section of Hematology/Oncology, University of Chicago, Chicago, Illinois 60637, USA. 5Department of Microbiology and Immunology,Dartmouth Medical School, Hanover, New Hampshire 03756, USA. Correspondence should be addressed to D.G.T. ([email protected]).
Published online 16 May 2004; doi:10.1038/ng1361
0
0.1
0.2
0.3
0.4
0.5
0.6
DNase I HS Cluster 1(–14 kb URE) 1 kbSfpi1
a
Targeting construct HSVtkneoE
1 kb
(–14 kb URE)
Wild-type allele
neoE
Targeted allele loxP
S
S E E
neoS E
Knockdown allele (kd)
External probe A
+ Cre
S
S
S
E
E
E E E
E
b
EcoRV/Sspl
4.7 kb
9.7 kb
6.8 kb
4.7 kb
9.7 kb
6.8 kb
+/kd
+/+
+/+
+/lo
xP+/
loxP
ePU.1Actin
40 kDa
+/+ kd/k
dkd
/kd
AML
+/+
–/–
kd/kdc
Sfpi1
Gapd
+/+d
+/+
+/kd
kd/k
dkd
/kdA
ML
Per
cent
18S
rR
NA
1 2 3 4 5
Acute myeloid leukemia induced by graded reduction of alineage-specific transcription factor, PU.1Frank Rosenbauer1, Katharina Wagner1, Jeffery L Kutok2, Hiromi Iwasaki3, Michelle M Le Beau4, Yutaka Okuno1,Koichi Akashi3, Steven Fiering5 and Daniel G Tenen1
L E T T E R S
624 VOLUME 36 | NUMBER 6 | JUNE 2004 NATURE GENETICS
Transcription factors are believed to have a dominant role inacute myeloid leukemia (AML). This idea is supported byanalysis of gene-knockout mice, which uncovered crucialroles of several transcription factors in normalhematopoiesis1, and of individuals with leukemia, in whomtranscription factors are frequently downregulated ormutated2. However, analysis of knockout animals has notshown a direct link between abrogated transcription factorsand the pathogenesis of AML. Sfpi1, encoding the lineage-specific transcription factor PU.1, is indispensable for normalmyeloid and lymphoid development3,4. We found that micecarrying hypomorphic Sfpi1 alleles that reduce PU.1
expression to 20% of normal levels, unlike mice carryinghomo- or heterozygous deletions of Sfpi1, developed AML.Unlike complete or 50% loss, 80% loss of PU.1 induced aprecancerous state characterized by accumulation of anabnormal precursor pool retaining responsiveness to G-CSFwith disruption of M- and GM-CSF pathways. Malignanttransformation was associated with a high frequency of clonalchromosomal changes. Retroviral restoration of PU.1expression rescued myeloid differentiation of mutantprogenitors and AML blasts. These results suggest that tightlygraded reduction, rather than complete loss, of a lineage-indispensable transcription factor can induce AML.
Figure 1 PU.1-knockdown mice have a graded reduction of PU.1 expression.(a) Map of Sfpi1 (encoding PU.1) indicating the location of the URE in DNaseI–hypersensitive (HS) Cluster 1. Sfpi1 exons (filled boxes) and the direction oftranscription (horizontal arrow) are symbolized. The targeting strategy is shownbelow. FRT sites are represented by open arrowheads and loxP sites by closedarrowheads. The orientations of the neo and tk cassettes are shown as openarrows. E, EcoRV restriction site; S, SspI restriction site. The location of theexternal probe A is indicated as a black horizontal bar. (b) Southern-blotanalysis of EcoRV-SspI-digested mouse tail DNA. The DNA was hybridized withprobe A, which recognizes a 9.7-kb wild-type fragment, a 4.7-kb loxP-targetedfragment and a 6.8-kb fragment indicating the knockdown allele (kd) that wasgenerated after excision of the URE. (c) Northern blot showing downregulatedSfpi1 mRNA in bone marrow of Sfpi1kd/kd mice compared to Sfpi1+/+
littermates. Gapd was used as a loading control. (d) Quantitative real-time RT-PCR analysis of bone marrow RNA samples showed that Sfpi1 expression wasreduced to 65% of wild-type level in heterozygotes (+/kd) and to 20% inpreleukemic PU.1-knockdown (kd/kd) mice. Sfpi1 expression was alsoreduced in bone marrow of a PU.1-knockdown mouse with AML. Sfpi1transcript numbers are shown as a percentage of 18S transcripts. (e) Western-blot analysis showing that PU.1 protein expression was five times lower inPU.1-knockdown mice than in wild-type controls. Total extracts equaling 106
cells from bone marrow (lanes 1–3) or fetal liver (lanes 4 and 5) wereseparated by SDS-PAGE, blotted onto a nitrocellulose membrane and probedwith antibodies against PU.1 and actin. Lane 1, wild-type (+/+); lane 2,preleukemic PU.1-knockdown (kd/kd); lane 3, PU.1-knockdown with AML;lane 4, wild-type; lane 5, Sfpi1 knockout (–/–). Shown on the right is theposition of a 40-kDa marker.

Mac
-1
Gr-1
kd/kd kd/kd+/+(preleukemic) (AML)a
b
55.6 10.9
8.6
44.9 21.5
23.2
9.6 57.5
10.3
1.4 59.4
11.9
82.6
10.5
4.0 3.0
8.0
3.8 59.2
6.7
c-kit
0.5
Gr-1
c
WT
kd
Controls Recipient
1 2 3 4 5 6 7
0.1 59.3
36.8
0.1 59.3
36.8
0.1 58.6
31.4
0.1 58.6
31.4
0
20
40
60
80
100
+/+hyp /hyp
Per
cent
sur
viva
l
0 1 2 3 4 5 6 7 8 9
Months
+/+
kd/kd
d e f
g h
kji
l
L E T T E R S
NATURE GENETICS VOLUME 36 | NUMBER 6 | JUNE 2004 625
Figure 2 Development of rapidly fatal, transplantable AML. Flow cytometricanalysis of single-cell suspensions from bone marrow (a) and spleen (b) ofcontrol and mutant mice before (preleukemic) and after (AML) thedevelopment of leukemia using indicated combinations of antibodies.Numbers in quadrants indicate the percentage of total cells. The results showa representative example of 4–6 mice per group. The presence of the c-kitantigen, as an early cell marker, on almost all Mac-1pos Gr-1pos myeloid cellsindicates the immature phenotype of the neoplastic PU.1-knockdown (kd/kd)mice. (c) Cumulative survival of PU.1-knockdown (kd/kd) mice. n = 20 wild-type and 34 PU.1-knockdown mice. Mice were autopsied when visibly ill. Nodisease was observed in wild-type or heterozygous mice or in any mice beforeexcision of the URE (which had the neomycin cassette incorporated in thelocus). (d) Cytospin of spleen cells from a 3-month-old preleukemic PU.1-knockdown mouse showing the predominance of mature neutrophils (Wright-Giemsa stain, × 400). Cytospins of spleen (e) and bone marrow (f) cells froma PU.1-knockdown mouse with AML. The accumulation of blasts and myeloidprecursors comprised almost the entire primary hematopoietic organs(Wright-Giemsa stain, × 400). (g) Blood smear showing large numbers ofmyeloblasts in the peripheral blood of a mutant after development of AML(Wright-Giemsa stain, ×400). (h) Massive neoblastic infiltration of the liver.Note the accumulation of myeloblasts in the blood vessel in the lower rightcorner (hematoxylin and eosin, ×100). (i) Peripheral lymph node denselypopulated with myeloid cells; most of the tumor cells stain positive formyeloperoxidase (×100). (j) Invasion of leukemia cells into kidney tissue(hematoxylin and eosin, ×200). (k) Neoplastic liver infiltration of a secondaryrecipient mouse after it was transplanted with cells from a leukemic PU.1-knockdown mouse (myeloperoxidase stain, ×100). (l) Engraftment oftransplanted donor cells from leukemic PU.1-knockdown mice innonirradiated NOD/SCID recipient mice led to complete displacement of hostprimary hematopoietic tissue. Diagnostic Southern blot of EcoRV-SspI-digested genomic DNA from mouse tails (controls: lane 1, wild-type (+/+);lane 2, heterozygous (+/kd); lane 3, homozygous knockdown (kd/kd)) andvarious organs from one recipient mouse (lane 4, bone marrow; lane 5,kidney; lane 6, tail; lane 7, spleen) using probe A.
We previously identified a –14-kb upstream regulatory region (URE)in the Sfpi1 locus5. Here we used a cre-loxP-based homologous recom-bination strategy in mice to replace the URE with a neomycin-resis-tance cassette (Fig. 1a,b). Germline deletion of the URE after breedingthe conditional mutants to CMV-cre deleter mice6 resulted in viableoffspring at expected mendelian frequencies. Up to 8–10 weeks of age,these mice had no differences in size, behavior or reproductive abilitycompared with wild-type littermates. We found that PU.1 expressionin the bone marrow of mice homozygous with respect to the ∆UREneoallele (referred to here as PU.1-knockdown mice) was reduced to 20%of wild-type levels (Fig. 1c–e). Thus, these mutants are an ideal in vivomodel to study the consequences of low levels of PU.1.
At 2–3 months of age, PU.1-knockdown mice had more c-kitpos pre-cursor cells (2–2.5 times more) and neutrophils (Gr-1pos) than wild-type littermates (Fig. 2a,b,d). The mutants also had moderatelyenlarged spleens (1.5–2 times bigger). Expansion of the progenitor cellsand neutrophils was limited to bone marrow and spleen: peripheralwhite blood cell counts were normal (average of 11,300 leukocytes perµl versus 9,800 leukocytes per µl in wild-type littermates, n = 4 in eachgroup; Supplementary Table 1 online). Notably, 33 of 34 PU.1-knock-down mice rapidly became moribund or died at 3–8 months of age(Fig. 2c), after developing a fatal, aggressive neoplastic disease thatstrongly resembled human AML. Macroscopically, leukemic micedeveloped severe splenomegaly (weights: 660–1,600 mg versus 80–150mg in wild-type littermates) and hepatomegaly (weights: 3.0–7.2 g ver-sus 1–1.5 g in wild-type littermates). Flow cytometric examinations ofmoribund mutants showed a vast accumulation of immature myeloidcells (c-kitpos Mac-1low Gr-1low) in bone marrow and spleens (Fig.2a,b). Both organs had grossly disrupted architectures and hypercellu-larity due to expansion of myeloblastic cells (30–75% blasts and

L E T T E R S
626 VOLUME 36 | NUMBER 6 | JUNE 2004 NATURE GENETICS
promyelocytes in bone marrow; Fig. 2e,f). In contrast, there were fewerB-lymphoid and erythroid cells (data not shown). We detected T-celllymphomas that developed together with the myeloid leukemia in threePU.1-knockdown mice; in another two mice, lymphoma was the dom-inant disease (data not shown). In mice with AML, peripheral white-blood-cell counts were much higher (average of 75,200 leukocytes perµl, n = 4) than in wild-type mice; normal components were replaced by>40% blasts and immature myeloid forms (Fig. 2g and SupplementaryTable 1 online). Hematocrits and platelets were within the normalranges (data not shown). The aggressive malignant disease course wascharacterized by massive neoplastic organ infiltrations (Fig. 2h–j) withmost invading cells staining positive for myeloperoxidase, indicative ofgranulocytic origin of tumor cells (Fig. 2i,k).
To further test leukemogenicity, we intravenously injected 106
splenocytes from three PU.1-knockdown mice with AML into 12 non-irradiated NOD/SCID recipients. All the mice that received trans-plants developed progressive leukemia leading to death within 3–12weeks. They had the same disease symptoms as donors did, includinghigh peripheral white-blood-cell counts, hepatosplenomegaly andmyeloblastic invasions of hematopoietic and nonhematopoieticorgans (Fig. 2k and data not shown). Donor origin of leukemic cells inrecipients was confirmed by Southern blots (Fig. 2l). We also trans-planted the leukemia into normal nonirradiated wild-type mice.Despite decreased engraftment due to histocompatibility barriers, 3 of12 transplanted noncongenic hosts developed lethal AML with mas-sive progression of donor cells within 6–12 weeks (data not shown).
b
Sca-1
CD34
Fc
RII/
IIIc-
Kit
1.1%
0.8%
0.5%
0.15% 0.18%2.5% 5.0%
+/kdaLin -
M-CSFR
G-CSFR
GM-CSFRα
Gapd
kd/kd
kd/kd
kd/kd kd/kd
+/+ekd/kd
+/++/+
kd/k
d
kd/k
d
d
IL-3
, IL
-6, S
CF
kd/kd+/kd
G-C
SF
cP
erce
nt c
olon
ies
per
cells
pla
ted
0
60
40
20
100
80
f
kDa
42
80
Myc-P
NS
Myc
80
41 2 3 5 6
4321 5
+/+
+/+ +/+
Myc
Gapd
g
0
0.002
0.004
0.006
0.008
0.01
0.012
0.014
0.016
0.018
0
0.001
0.002
0.003
0.004
0.005
0.006
+/+
Per
cent
18S
rR
NA
+/+
HSCs Progenitors
+/kd
kd/k
d
kd/k
d
HSCs ProgenitorsMix
E+Me
Me
E
GM
G
Mac
Blast
Figure 3 Reduced expression of PU.1 alters cytokine response of HSCs and myeloid progenitors. (a) Multiple color flow cytometry showing normal HSCsbut accumulated progenitors in bone marrow of preleukemic PU.1-knockdown (kd/kd) mice. c-kitpos Sca-1pos linneg HSCs were phenotypically separatedfrom c-kitpos Sca-1neg linneg progenitor cells, which were further split into common myeloid progenitors (c-kitpos Sca-1neg linneg FcgRII/IIIneg CD34pos),myeloid-erythroid progenitors (c-kitpos Sca-1neg linneg FcgRII/IIIneg CD34neg) and granulocyte-macrophage progenitors (c-kitpos Sca-1neg linneg FcgRII/IIIpos
CD34pos). No differences were observed between wild-type and heterozygous (+/kd) mutant mice. (b) Multiplex of quantitative real-time RT-PCR usingprimers and probes specific for Sfpi1 (encoding PU.1) and 18S rRNA as a control. Sfpi1 (PU.1) transcript numbers are shown as percent of 18Stranscripts in HSCs and progenitors. (c) Single cells from sorted HSCs and progenitors from wild-type and preleukemic PU.1-knockdown (kd/kd) bonemarrow were cultured in the presence of 20 ng ml–1 of SCF, 10 ng ml–1 of TPO, 1 U ml–1 of EPO, 20 ng ml–1 of IL-3, 10 ng ml–1 of IL-11 and 10 ng ml–1
of GM-CSF. Colonies were counted and were identified by morphology and cytospins. The mixed populations from PU.1-knockdown mice contained normalerythroid and megakaryocytic cells in addition to myeloid blasts. (d) Normal myeloid differentiation induced with G-CSF, but not IL-3, IL-6 or SCF. Bonemarrow cells from controls or preleukemic mutant mice were plated in methylcellulose containing either a mix of 10 ng ml–1 of IL-3, 10 ng ml–1 of IL-6and 50 ng ml–1 of SCF or 10 ng ml–1 of G-CSF alone for 7 d. Individual colonies were picked and analyzed for cellular morphology. (e) Northern blotshowing the absence of the mRNAs of the M-CSF receptor and the GM-CSF receptor α-chain, but not of the G-CSF receptor in preleukemic PU.1-knockdown mice. A total of 10 µg of total RNA from bone marrow of 2-month-old mice was loaded per sample and probed as indicated. (f) Mycoverexpression is associated with the leukemic phase in PU.1-knockdown mice. Expression levels of Myc in bone marrow were assessed by Northern blots.Lane 1, wild-type control; lane 2, preleukemic PU.1-knockdown mutant; lanes 3–5, PU.1-knockdown mice that developed AML. (g) Protein expression(upper panel) and phosphorylation (lower panel) of c-Myc in bone marrow (lanes 1–3) and spleen (lanes 4–6) extracts from wild-type (lanes 1 and 4) mice,a preleukemic PU.1-knockdown (kd/kd) mouse (lane 2) and PU.1-knockdown mice with AML (lanes 3, 5 and 6). Myc was overexpressed andphosphorylated (Myc-P) in most (examples in lanes 3 and 6), but not all (lane 5), tumors. NS, a nonspecific band that also served as a loading control.
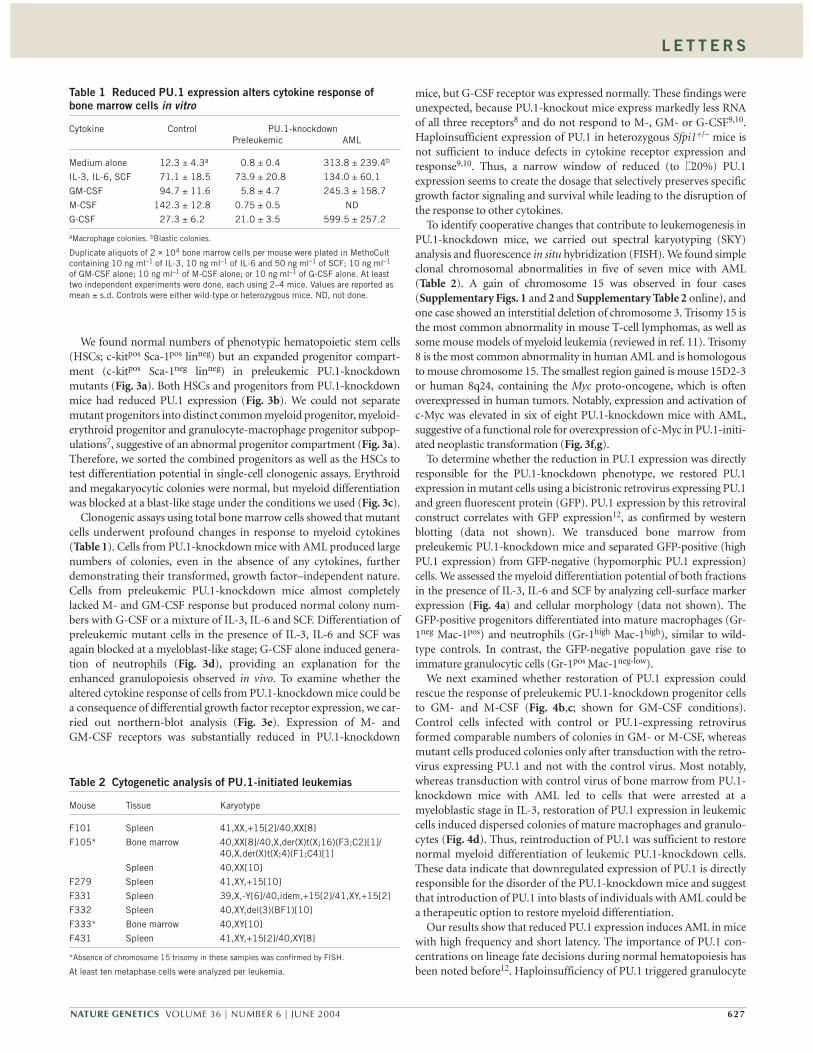
mice, but G-CSF receptor was expressed normally. These findings wereunexpected, because PU.1-knockout mice express markedly less RNAof all three receptors8 and do not respond to M-, GM- or G-CSF9,10.Haploinsufficient expression of PU.1 in heterozygous Sfpi1+/– mice isnot sufficient to induce defects in cytokine receptor expression andresponse9,10. Thus, a narrow window of reduced (to ∼ 20%) PU.1expression seems to create the dosage that selectively preserves specificgrowth factor signaling and survival while leading to the disruption ofthe response to other cytokines.
To identify cooperative changes that contribute to leukemogenesis inPU.1-knockdown mice, we carried out spectral karyotyping (SKY)analysis and fluorescence in situ hybridization (FISH). We found simpleclonal chromosomal abnormalities in five of seven mice with AML(Table 2). A gain of chromosome 15 was observed in four cases(Supplementary Figs. 1 and 2 and Supplementary Table 2 online), andone case showed an interstitial deletion of chromosome 3. Trisomy 15 isthe most common abnormality in mouse T-cell lymphomas, as well assome mouse models of myeloid leukemia (reviewed in ref. 11). Trisomy8 is the most common abnormality in human AML and is homologousto mouse chromosome 15. The smallest region gained is mouse 15D2-3or human 8q24, containing the Myc proto-oncogene, which is oftenoverexpressed in human tumors. Notably, expression and activation ofc-Myc was elevated in six of eight PU.1-knockdown mice with AML,suggestive of a functional role for overexpression of c-Myc in PU.1-initi-ated neoplastic transformation (Fig. 3f,g).
To determine whether the reduction in PU.1 expression was directlyresponsible for the PU.1-knockdown phenotype, we restored PU.1expression in mutant cells using a bicistronic retrovirus expressing PU.1and green fluorescent protein (GFP). PU.1 expression by this retroviralconstruct correlates with GFP expression12, as confirmed by westernblotting (data not shown). We transduced bone marrow frompreleukemic PU.1-knockdown mice and separated GFP-positive (highPU.1 expression) from GFP-negative (hypomorphic PU.1 expression)cells. We assessed the myeloid differentiation potential of both fractionsin the presence of IL-3, IL-6 and SCF by analyzing cell-surface markerexpression (Fig. 4a) and cellular morphology (data not shown). TheGFP-positive progenitors differentiated into mature macrophages (Gr-1neg Mac-1pos) and neutrophils (Gr-1high Mac-1high), similar to wild-type controls. In contrast, the GFP-negative population gave rise toimmature granulocytic cells (Gr-1pos Mac-1neg-low).
We next examined whether restoration of PU.1 expression couldrescue the response of preleukemic PU.1-knockdown progenitor cellsto GM- and M-CSF (Fig. 4b,c; shown for GM-CSF conditions).Control cells infected with control or PU.1-expressing retrovirusformed comparable numbers of colonies in GM- or M-CSF, whereasmutant cells produced colonies only after transduction with the retro-virus expressing PU.1 and not with the control virus. Most notably,whereas transduction with control virus of bone marrow from PU.1-knockdown mice with AML led to cells that were arrested at amyeloblastic stage in IL-3, restoration of PU.1 expression in leukemiccells induced dispersed colonies of mature macrophages and granulo-cytes (Fig. 4d). Thus, reintroduction of PU.1 was sufficient to restorenormal myeloid differentiation of leukemic PU.1-knockdown cells.These data indicate that downregulated expression of PU.1 is directlyresponsible for the disorder of the PU.1-knockdown mice and suggestthat introduction of PU.1 into blasts of individuals with AML could bea therapeutic option to restore myeloid differentiation.
Our results show that reduced PU.1 expression induces AML in micewith high frequency and short latency. The importance of PU.1 con-centrations on lineage fate decisions during normal hematopoiesis hasbeen noted before12. Haploinsufficiency of PU.1 triggered granulocyte
L E T T E R S
NATURE GENETICS VOLUME 36 | NUMBER 6 | JUNE 2004 627
We found normal numbers of phenotypic hematopoietic stem cells(HSCs; c-kitpos Sca-1pos linneg) but an expanded progenitor compart-ment (c-kitpos Sca-1neg linneg) in preleukemic PU.1-knockdownmutants (Fig. 3a). Both HSCs and progenitors from PU.1-knockdownmice had reduced PU.1 expression (Fig. 3b). We could not separatemutant progenitors into distinct common myeloid progenitor, myeloid-erythroid progenitor and granulocyte-macrophage progenitor subpop-ulations7, suggestive of an abnormal progenitor compartment (Fig. 3a).Therefore, we sorted the combined progenitors as well as the HSCs totest differentiation potential in single-cell clonogenic assays. Erythroidand megakaryocytic colonies were normal, but myeloid differentiationwas blocked at a blast-like stage under the conditions we used (Fig. 3c).
Clonogenic assays using total bone marrow cells showed that mutantcells underwent profound changes in response to myeloid cytokines(Table 1). Cells from PU.1-knockdown mice with AML produced largenumbers of colonies, even in the absence of any cytokines, furtherdemonstrating their transformed, growth factor–independent nature.Cells from preleukemic PU.1-knockdown mice almost completelylacked M- and GM-CSF response but produced normal colony num-bers with G-CSF or a mixture of IL-3, IL-6 and SCF. Differentiation ofpreleukemic mutant cells in the presence of IL-3, IL-6 and SCF wasagain blocked at a myeloblast-like stage; G-CSF alone induced genera-tion of neutrophils (Fig. 3d), providing an explanation for theenhanced granulopoiesis observed in vivo. To examine whether thealtered cytokine response of cells from PU.1-knockdown mice could bea consequence of differential growth factor receptor expression, we car-ried out northern-blot analysis (Fig. 3e). Expression of M- andGM-CSF receptors was substantially reduced in PU.1-knockdown
Table 1 Reduced PU.1 expression alters cytokine response ofbone marrow cells in vitro
Cytokine Control PU.1-knockdownPreleukemic AML
Medium alone 12.3 ± 4.3a 0.8 ± 0.4 313.8 ± 239.4b
IL-3, IL-6, SCF 71.1 ± 18.5 73.9 ± 20.8 134.0 ± 60.1
GM-CSF 94.7 ± 11.6 5.8 ± 4.7 245.3 ± 158.7
M-CSF 142.3 ± 12.8 0.75 ± 0.5 ND
G-CSF 27.3 ± 6.2 21.0 ± 3.5 599.5 ± 257.2
aMacrophage colonies. bBlastic colonies.
Duplicate aliquots of 2 × 10⁴ bone marrow cells per mouse were plated in MethoCultcontaining 10 ng ml–1 of IL-3, 10 ng ml–1 of IL-6 and 50 ng ml–1 of SCF; 10 ng ml–1
of GM-CSF alone; 10 ng ml–1 of M-CSF alone; or 10 ng ml–1 of G-CSF alone. At leasttwo independent experiments were done, each using 2–4 mice. Values are reported asmean ± s.d. Controls were either wild-type or heterozygous mice. ND, not done.
Table 2 Cytogenetic analysis of PU.1-initiated leukemias
Mouse Tissue Karyotype
F101 Spleen 41,XX,+15[2]/40,XX[8]
F105* Bone marrow 40,XX[8]/40,X,der(X)t(X;16)(F3;C2)[1]/40,X,der(X)t(X;4)(F1;C4)[1]
Spleen 40,XX[10]
F279 Spleen 41,XY,+15[10]
F331 Spleen 39,X,-Y[6]/40,idem,+15[2]/41,XY,+15[2]
F332 Spleen 40,XY,del(3)(BF1)[10]
F333* Bone marrow 40,XY[10]
F431 Spleen 41,XY,+15[2]/40,XY[8]
*Absence of chromosome 15 trisomy in these samples was confirmed by FISH.
At least ten metaphase cells were analyzed per leukemia.

L E T T E R S
628 VOLUME 36 | NUMBER 6 | JUNE 2004 NATURE GENETICS
production in a G-CSF-null background13, in agreement with ourobservation of accelerated granulopoiesis in the presence of hypomor-phic levels of PU.1. Like mice deficient in other transcription factorsimplicated in human AML1,14–17, however, neither nonconditional norconditional deletion of the gene encoding PU.1 induces leukemia3,4,18.Because haploinsufficient PU.1 expression also does not induce a spon-taneous malignancy19, a narrow window of reduced PU.1 expressionseems to be required for AML development. In addition, humans withAML have mutations in genes encoding transcription factors that leadto reduced function but generally not complete loss of function2,20–24.Taken together, these data suggest that retaining residual transcriptionfactor function can be crucial for AML development.
The mechanism behind the development of neoplasia in PU.1-knockdown mice probably includes the failure of the mutant cells toexpress sufficient levels of essential growth factor receptors. Whereasthe complete absence of PU.1 globally abrogates growth factor signal-ing, however, reduction of PU.1 expression to 20% of normal levelspreserves specific cytokine response (e.g., G-CSF and perhaps others)as an essential requirement for cell survival. This may be an importantstep in the development of a leukemic stem cell25. Malignant transfor-mation was accompanied by chromosomal abnormalities with recur-ring gain of chromosome 15, containing the gene Myc. Myc isfrequently overexpressed in human neoplasia26 and induces tumorige-nesis in mice27,28. Thus, reduced expression of PU.1 promotes recur-ring chromosomal changes, creating a secondary event that results inthe subsequent outgrowth of leukemic cell clones.
In conclusion, we showed that graded reduction of physiologicalPU.1 expression below a critical level can induce AML. Therefore, itmight be possible to change cancerous cell fate considerably with rela-tively small modulations that increase lineage-determining transcrip-tion factors above this critical level.
METHODSGeneration of the targeting construct. We subcloned a 3.3-kb BamHI-KpnIgenomic fragment containing the proximal part of the –14-kb URE plus thedownstream homology into the BamHI-KpnI sites of pPNT-loxPneo. To addthe distal part of the URE, we released a 1.7-kb SalI-BamHI fragment from apBluescript plasmid containing the entire URE as a 3.4-kb HindIII fragmentand inserted it into the SalI-BamHI sites of the targeting construct. This causesthe original neomycin gene and the proximal loxP site to drop out of the con-struct. We then released a loxP site from pPNT-loxPneo with XbaI and SmaI andinserted it into the NheI site at the very 3′ end of the URE by blunt-end ligation.To obtain the upstream homology, we amplified a 2.2-kb fragment by PCRfrom a genomic mouse Sfpi1 P1 clone5 using primers with NotI or XhoI siteoverhangs. We then subcloned this fragment into the NotI-XhoI sites ofpBluescript. We released a FRT-PGKneo-FRT resistance cassette from pK-11(ref. 29) and subcloned it into SacI-SalI sites of pBluescript. After inserting anXhoI site adaptor into the NotI site of the plasmid, we releasedFRT-PGKneo-FRT by SalI and XhoI and subcloned it into the XhoI site of thepBluescript that already contained the upstream homology. We releasedanother loxP site from pPNT-loxPneo using SalI-XhoI and inserted it into theXhoI site downstream of FRT-PGKneo-FRT. Finally, we subcloned the entirefragment containing the upstream homology, the FRT-flanked PGKneo and theloxP site into NotI-SalI sites of pPNT that already contained the URE-loxP-downstream homology fragments. This procedure created the final targetingconstruct with the elements in the following order: 2.2-kb upstream homology,FRT-PGKneo-FRT-loxP, 3.4-kb URE-loxP, 1.7-kb downstream homology,PGKHSK thymidine kinase gene. We linearized this construct with NotI andused it to transfect embryonic stem cells.
Generation of mutant mice. We electroporated 30 µg of linearized targetingconstruct into R1 embryonic stem cells and grew them under double selectionon feeder layers treated with mitomycin C. We digested DNA of individual dou-ble-resistant clones with SspI and EcoRV and probed them with the externalprobe A and the neomycin cDNA as an internal probe. We identified homolo-gous recombinant clones by a 4.7-kb band representing –14-kb UREloxP+neo in
b
c
IL3
AML kd/kd +GFPd
a
Preleukemic kd/kd +PU.1iresGFP
+PU.1iresGFP
+PU.1iresGFP
Phase contrast Fluorescent Wright-Giemsa
GM
-CS
F
Gr-1
Mac
-1
Control GFPnegGFP posPreleukemic kd/kd+/+
7.8 21.4
33.0
27.9
0.1
33.6 16.0
0.2
46.4
0
50
100
150
200
250 GM-CSF
CF
U p
er 2
× 1
04 cel
ls
+/+
+/+
kd/k
d
kd/k
d
+GFP
Figure 4 PU.1 retroviral rescue of myeloiddifferentiation in PU.1-knockdown mice. (a) Bonemarrow cells from preleukemic PU.1-knockdown(kd/kd) mice were transduced by a retrovirusexpressing bicistronic PU.1iresGFP. Cells werethen sorted by fluorescence-activated cell sortingfor GFP expression, split into GFP-positive andGFP-negative fractions, cultured in IL-3, IL-6 andSCF for 7 d and analyzed for myeloid cell surfacemarkers by flow cytometry. Wild-type control cellswere mock-transduced and kept under sameculturing conditions. (b) Bone marrow cells fromcontrol and preleukemic PU.1-knockdown micewere infected with retroviruses expressing eitherGFP alone or PU.1iresGFP. Clonogenic assays weredone in the presence of GM-CSF. Numbers ofmutant colonies after PU.1 restoration werecomparable to those in control mice. (c) PU.1-knockdown colonies transfected with the PU.1virus were GFP-positive and produced maturemacrophages and granulocytes comparable tothose of wild-type controls (see Fig. 3d). (d) Bonemarrow of a PU.1-knockdown mouse suffering fromAML was infected with the GFP control virus orwith the PU.1iresGFP virus. GFP-positive cellswere sorted by fluorescence-activated cell sorting,plated in methylcellulose containing 10 ng ml–1 ofIL-3 and analyzed after 7 d. Colony shape is shownin left panels as phase-contrast images, andcellular morphology is shown in right panels byWright-Giemsa stains. Colony numbers of controland PU.1-infected cells were equal.

addition to the 9.7-kb wild-type band in Southern blots using probe A. We gen-erated chimeric mice by standard injection procedures, bred chimeric males toC57/Bl6 females and determined germline transmission by agouti color andSouthern blots from tail genomic DNA. To remove the URE, we bred condi-tional mutants to CMV-cre deleter mice6. We identified heterozygous offspringwith the proper deletions by Southern blotting. Incorporation of the neomycincassette into the Sfpi1 locus (–14-kb UREloxP+neo) did not cause changes inexpression of PU.1 or any other phenotypic changes before deletion of theURE. Furthermore, Southern-blot assays of cells derived from mice with AMLhad a pattern similar to that shown in Figure 1, indicating that the structure ofthe URE was not altered after transformation (data not shown). Mouse experi-ments were approved by the Beth Israel Deaconess Medical Center InstitutionalAnimal Care and Use Committee (Protocol # 115-2001).
Northern-blot assays. We isolated RNA from bone marrow cells using TrizolReagent (Molecular Research Center) according to the manufacturer’s proto-col. We detected Sfpi1 (PU.1) RNA with a labeled 431-bp mouse Sfpi1 5′ cDNAfragment, Myc RNA with a probe containing exons 2 and 3 of the mouse geneand Gapd RNA with a 1.3-kb PstI fragment of the rat cDNA. Reduction of PU.1expression in Northern (Fig. 1c) blots was determined using Imagequant den-sitometry software (Amersham).
Histologic and immunohistologic methods. We carried out hematoxylin andeosin staining or immunohistochemical analysis for myeloperoxidase on 5-µmthick formalin-fixed, paraffin-embedded tissue sections. We removed theparaffin from the slides, pretreated them with 1.0 mM EDTA, pH 8.0 (Zymed),in a steam pressure cooker (Decloaking Chamber, BioCare Medical) followingthe manufacturer’s instructions and washed them in distilled water. All furthersteps were done at room temperature in a hydrated chamber. We pretreatedslides with Peroxidase Block (DAKO USA) for 5 min to quench endogenousperoxidase activity and then with a 1:5 dilution of goat serum in 50 mM Tris-Cl,pH 7.4, for 20 min to block nonspecific binding sites. We applied primary rab-bit antibody to myeloperoxidase (DAKO) at a 1:2,500 dilution in 50 mM Tris-Cl, pH 7.4, with 3% goat serum for 1 h. We washed slides in 50 mM Tris-Cl, pH7.4, and applied goat antibody to rabbit conjugated with horseradish peroxi-dase (Envision detection kit, DAKO) for 30 min. After further washing, wedeveloped the immunoperoxidase staining using a DAB chromogen kit(DAKO) following the manufacturer’s instructions and counterstained withhematoxylin. Blood films and cytospins were fixed with methanol and stainedwith Wright-Giemsa staining solutions.
Flow cytometry. We analyzed single-cell suspensions from spleens and bonemarrow by flow cytometry using unlabeled antibodies or antibodies conju-gated to phycoerythrin, fluorescein isothiocyanate, Texas red or allophyco-cyanin (all from Pharmigen) against the following cell-surface molecules:Mac-1/CD11b (M1/70), CD3 (KT31.1), CD4 (GK1.5), CD8 (53-6.7), B220(6B2), Gr-1 (8C5), TER119, CD19 (1D3), IgM (R6-60.2), IL-7Ra chain(A7R34), FcRII/IIIg (2.4G2), CD34 (RAM34), Sca-1 (E13-161-7) and c-Kit(2B8). We analyzed total bone marrow and spleen samples on a FACSscancytometer (Becton Dickinson) according to standard protocols. Gates on viablecells were set according to the exclusion of propidium iodide staining. Flowcytometric analysis and sorting methods for HSCs and myeloid precursorsusing a double laser (488 nm/350 nm Enterprise II + 647nm Spectrum) high-speed cell sorter (Moflo-MLS, Cytomation) were previously described7.
Colony-forming assays. We carried out in vitro clonogenic assays in MethocultM3234 (Stem Cell Technologies) supplemented with cytokines as indicated. Wescored cells at 4–7 d. For myeloid precursor and HSC single-cell clonogenicassays, we used an automatic cell deposition unit system to sort cells into 96-well plates (Becton Dickinson). We cultured these highly purified cell popula-tions in Methocult H4100 (Stem cell Technologies) supplemented with 20%fetal bovine serum, 1% bovine serum albumin, 2 mM L-glutamine and 50 mM2-mercaptoethanol. We purchased recombinant human IL-6 and mouse M-CSF, G-CSF and GM-CSF from Stem Cell Technologies and mouse SCF, IL-3,IL-11 and TPO and human erythropoietin from R&D Systems.
Western-blot assays. We extracted total cell lysates as described30. Weresolved proteins by SDS-PAGE and electrotransferred them to a nitrocellu-
lose membrane (Bio-Rad Laboratories). We used polyclonal rabbit antibodyto PU.1 (Santa Cruz), polyclonal rabbit antibody to c-Myc (Santa Cruz),polyclonal rabbit antibody to phosphorylated c-Myc (Thr58/Ser62; CellSignaling) and monoclonal mouse antibody to actin (Sigma). We detectedimmunoreactive proteins using HPRT-conjugated antibodies to rabbit ormouse (Santa Cruz) and the ECL system (Amersham). Reduction of PU.1expression in Western blots was determined using Imagequant densitometrysoftware (Amersham).
Real-time PCR. We extracted RNA with Trizol, treated it with DNase I, reverse-transcribed it and then amplified it using an AbiPrism 7700 Sequence Detector(Applied Biosystems) with the following parameters: 48 °C (30 min), 95 °C (10min) followed by 40 cycles of 95 °C (15 s), 60 °C (1 min). Primer and probesequences are available on request.
SKY analysis. We carried out cytogenetic and SKY analysis on spleen or bonemarrow cells as described previously11.
Retroviral transduction of mouse bone marrow cells. We transduced bonemarrow cells with MIG and MIG-PU.1 retroviruses as described9. We culturedcells in IL-3, IL-6 and SCF or IL-3 alone for 2 d and then infected them by resus-pension in high-titer cell-free retroviral supernatants for 4 h in the presence of24 µg ml–1 of polybrene. We washed infected cells three times in completemedium and then cultured them for 2 d in complete medium containing IL-3,IL-6 and SCF or IL-3 alone to allow retroviral integration and expression. Wewashed infected cells three times before plating them in methylcellulose toassess colony-forming potential.
Note: Supplementary information is available on the Nature Genetics website.
ACKNOWLEDGMENTSWe thank K. Geary, J. Fields, S. Warner and the Dartmouth Transgenic Facility forassistance in generating and keeping the described mice; R. Cruz and A.Radhakrishnan for technical assistance with the SKY analysis; V. Petkova andT. Dayaram for help with the real-time PCRs; S. Dymecki and G. Martin (pK11-FRT-PGKneo-FRT), K.P. Knobeloch (pPNT-loxPneo) and H. Singh (MIG and MIG-PU.1) for constructs and advice; and J.D. Griffin, D.G. Gilliland, A.T. Look andS. Koschmieder for comments on the manuscript. This work was supportedby DFG (German research foundation) research fellowships to F.R. and K.W.and by National Institutes of Health grants to M.M.L. and D.G.T.
COMPETING INTERESTS STATEMENTThe authors declare that they have no competing financial interests.
Received 25 November 2003; accepted 29 March 2004Published online at http://www.nature.com/naturegenetics/
1. Orkin, S.H. Diversification of haematopoietic stem cells to specific lineages. Nat.Rev. Genet. 1, 57–64 (2000).
2. Tenen, D.G. Disruption of differentiation in human cancer: AML shows the way. Nat.Rev. Cancer 3, 89–101 (2003).
3. Scott, E.W., Simon, M.C., Anastai, J. & Singh, H. The transcription factor PU.1 isrequired for the development of multiple hematopoietic lineages. Science 265,1573–1577 (1994).
4. McKercher, S.R. et al. Targeted disruption of the PU.1 gene results in multiplehematopoietic abnormalities. EMBO J. 15, 5647–5658 (1996).
5. Li, Y. et al. Regulation of the PU.1 gene by distal elements. Blood 98, 2958–2965(2001).
6. Schwenk, F., Baron, U. & Rajewsky, K. A cre-transgenic mouse strain for the ubiqui-tous deletion of loxP-flanked gene segments including deletion in germ cells. NucleicAcids Res. 23, 5080–5081 (1995).
7. Akashi, K., Traver, D., Miyamoto, T. & Weissman, I.L. A clonogenic common myeloidprogenitor that gives rise to all myeloid lineages. Nature 404, 193–197 (2000).
8. Iwama, A. et al. Use of RDA analysis of knockout mice to identify myeloid genes reg-ulated in vivo by PU.1 and C/EBPα. Nucleic Acids Res. 26, 3034–3043 (1998).
9. DeKoter, R.P., Walsh, J.C. & Singh, H. PU.1 regulates both cytokine dependent pro-liferation and differentiation of granulocyte/macrophage progenitors. EMBO J. 17,4456–4468 (1998).
10. Anderson, K.L. et al. Myeloid development is selectively disrupted in PU.1 null mice.Blood 91, 3702–3710 (1998).
11. Le Beau, M.M., Bitts, S., Davis, E.M. & Kogan, S.C. Recurring chromosomal abnor-malities in leukemia in PML-RARA transgenic mice parallel human acute promyelo-cytic leukemia. Blood 99, 2985–2991 (2002).
12. DeKoter, R.P. & Singh, H. Regulation of B lymphocyte and macrophage developmentby graded expression of PU.1. Science 288, 1439–1441 (2000).
L E T T E R S
NATURE GENETICS VOLUME 36 | NUMBER 6 | JUNE 2004 629

L E T T E R S
630 VOLUME 36 | NUMBER 6 | JUNE 2004 NATURE GENETICS
13. Dahl, R. et al. Regulation of macrophage and neutrophil cell fates by thePU.1:C/EBPalpha ratio and granulocyte colony-stimulating factor. Nat. Immunol. 4,1029–1036 (2003).
14. Iwasaki-Arai, J. et al. C/EBPα deficiency in hematopoiesis induces accumulation ofnon-malignant myeloblasts mimicking acute myelogenous leukemia. Blood 100, 61a(2002).
15. Okuda, T., van Deursen, J., Hiebert, S.W., Grosveld, G. & Downing, J.R. AML1, thetarget of multiple chromosomal translocations in human leukemia, is essential fornormal fetal liver hematopoiesis. Cell 84, 321–330 (1996).
16. Zhang, D.-E. et al. Absence of granulocyte colony-stimulating factor signaling andneutrophil development in CCAAT enhancer binding protein α-deficient mice. Proc.Natl. Acad. Sci. USA 94, 569–574 (1997).
17. Ichikawa, M. et al. AML-1 is required for megakaryocytic maturation and lymphocyticdifferentiation, but not for maintenance of hematopoietic stem cells in adulthematopoiesis. Nat. Med. 10, 299–304 (2004).
18. Duprez, E. et al. PU.1 deficiency blocks the production of Common Myeloid andCommon Lymphoid Progenitors in both adult and fetal liver myelopoiesis. Blood 100,61a (2002).
19. Scott, E.W. et al. PU.1 functions in a cell-autonomous manner to control the differ-entiation of multipotential lymphoid-myeloid progenitors. Immunity 6, 437–447(1997).
20. Osato, M. et al. Biallelic and heterozygous point mutations in the runt domain of theAML1/PEBP2alphaB gene associated with myeloblastic leukemias. Blood 93,1817–1824 (1999).
21. Pabst, T., Mueller, B.U., Harakawa, N., Zhang, D.-E. & Tenen, D.G. AML1-ETO down-regulates the granulocytic differentiation factor C/EBPα in t(8;21) myeloid leukemia.Nat. Med. 7, 444–451 (2001).
22. Pabst, T. et al. Dominant negative mutations of CEBPA, encoding CCAAT/EnhancerBinding Protein-α (C/EBPα), in acute myeloid leukemia. Nat. Genet. 27, 263–270(2001).
23. Mueller, B.U. et al. Heterozygous PU.1 mutations are associated with acute myeloidleukemia. Blood 100, 998–1007 (2002).
24. Wechsler, J. et al. Acquired mutations in GATA1 in the megakaryoblastic leukemia ofDown Syndrome. Nat. Genet. 32, 148–152 (2002).
25. Passegue, E., Jamieson, C.H., Ailles, L.E. & Weissman, I.L. Normal and leukemichematopoiesis: are leukemias a stem cell disorder or a reacquisition of stem cell char-acteristics? Proc. Natl. Acad. Sci. USA 100 Suppl 1, 11842–11849 (2003).
26. Marcu, K.B., Bossone, S.A. & Patel, A.J. myc function and regulation. Annu. Rev.Biochem. 61, 809–860 (1992).
27. Adams, J.M. et al. The c-myc oncogene driven by immunoglobulin enhancers induceslymphoid malignancy in transgenic mice. Nature 318, 533–538 (1985).
28. Felsher, D.W. & Bishop, J.M. Reversible tumorigenesis by MYC in hematopoietic lin-eages. Mol. Cell 4, 199–207 (1999).
29. Meyers, E.N., Lewandoski, M. & Martin, G.R. An Fgf8 mutant allelic series generatedby Cre- and Flp-mediated recombination. Nat. Genet. 18, 136–141 (1998).
30. Kobayashi, S. et al. Calpain-mediated X-linked inhibitor of apoptosis degradation inneutrophil apoptosis and its impairment in chronic neutrophilic leukemia. J. Biol.Chem. 277, 33968–33977 (2002).