acute encephalitis icu management - spilf - infectiologie · during lp, csf opening pressure should...
TRANSCRIPT
Romain Sonneville, M.D., Ph.D. Intensive care medicine
Bichat university hospital, Paris, France
Acute encephalitis ICU management
ICU management of acute encephalitis
KEYPOINTS
• Encephalitis patients frequently require ICU admission
• Prognostic factors and the impact of secondary complications on outcome
• Understanding brain dysfunction
• Care in the ICU Cerebral oedema Seizures / status epilepticus Systemic complications
• Specific causes requiring anti-inflammatory therapy
• Conclusions

• « Encephali,s » encompasses a broad range of infec,ous and/or autoimmune pathophysiologic processes
=> Inflamma)on of brain parenchyma
=> Acute brain dysfunc)on
• Strictly, the diagnosis is established only by histopathologic examina,on of brain ,ssue
• Brain ,ssue is (usually) not available for examina,on unless brain biopsy or post mortem examina,on are performed
• Indirect markers of brain inflamma,on – CSF leukocyte count or protein levels – Neuroimaging (MRI) changes
Acute encephalitis
or inflammation, toxic exposures, or metabolic derangements (table e-1 at Neurology.org/cp).Such conditions need to be aggressively investigated in all patients with suspected encepha-litis. Given the range of conditions that cause and mimic encephalitis, obtaining a thoroughhistory is crucial. Important historical points include the presence of recent illness, ill con-tacts, unusual exposures (including occupational, vector, and animal), outdoor activities, andingestions. It is critical to elicit travel history, both recent and remote, since agents such asrabies or malaria can become symptomatic long after initial exposure.
A practical approach to diagnosis in adults is presented in table 2. In addition to routine studiesto investigate for causes of encephalopathy, all patients with suspected encephalitis should undergoblood cultures and HIV testing. Extra serum should be drawn during the acute phase of illness andheld for later serologic studies, and if the diagnosis is still uncertain, a convalescent serum should becollected 10–21 days later. Lumbar puncture (LP) is recommended in all individuals unlesscontraindicated (i.e., significant mass effect/edema or effacement of basal cisterns on neuroimaging,or suspected skin or soft tissue abscess in the path of the puncture needle).9
Since herpes simplex virus (HSV), varicella-zoster virus (VZV), and enterovirus are 3 of themost commonly identified etiologic agents in acute encephalitis,1,4,6 these should be routinelyscreened for in the CSF. With respect to neuroimaging, MRI is preferred to CT given theincreased sensitivity and specificity for evaluation of encephalitis.10–12 Chest imaging shouldalso be performed as focal infiltrates may be suggestive of certain pathogens (e.g., fungal ormycobacterial infections).
In addition to travel, exposure, and medical history, specific signs and symptoms as well aslaboratory and neuroimaging features can help to guide further testing (table 2). For example,prominent psychosis or movement disorders should prompt testing for anti-NMDA receptor(NMDAR) encephalitis, those with limbic symptoms should undergo testing for anti–voltage-gatedpotassium channel [VGKC] and other paraneoplastic encephalitides, and brainstem lesions shouldprompt further testing for a range of additional pathogens. Notably, the field of autoimmuneencephalitis is rapidly advancing, and testing algorithms are likely to continue to evolve.
Diagnostic testing: practical considerations and caveatsDuring LP, CSF opening pressure should be obtained in all individuals, since abnormalities inintracranial pressure (ICP) may contribute to the neurologic dysfunction in encephalitis or, al-ternatively, suggest a different diagnosis. Although the typical CSF profile of viral encephalitisdemonstrates a mononuclear pleocytosis with cell counts up to 200 cells/mm3, with more
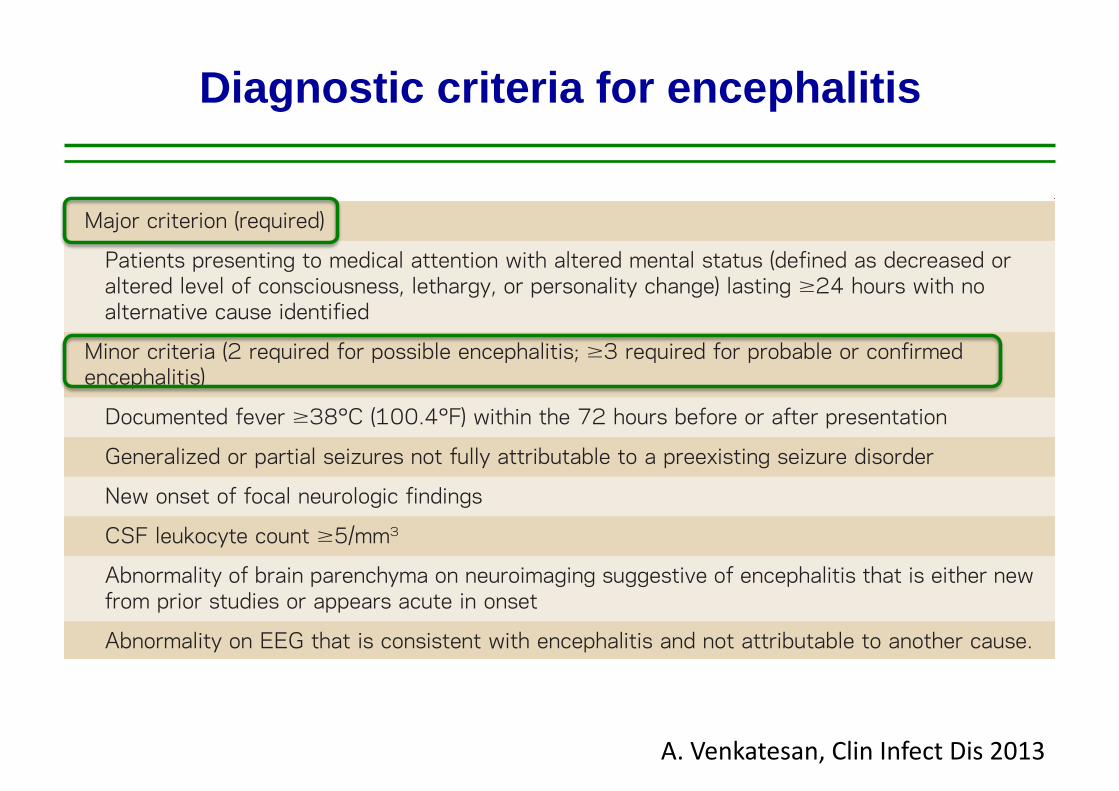
Table 1 Diagnostic criteria for encephalitisa
Major criterion (required)
Patients presenting to medical attention with altered mental status (defined as decreased oraltered level of consciousness, lethargy, or personality change) lasting $24 hours with noalternative cause identified
Minor criteria (2 required for possible encephalitis; $3 required for probable or confirmedencephalitis)
Documented fever $38°C (100.4°F) within the 72 hours before or after presentation
Generalized or partial seizures not fully attributable to a preexisting seizure disorder
New onset of focal neurologic findings
CSF leukocyte count $5/mm3
Abnormality of brain parenchyma on neuroimaging suggestive of encephalitis that is either newfrom prior studies or appears acute in onset
Abnormality on EEG that is consistent with encephalitis and not attributable to another cause.
aAdapted from reference 7 (Venkatesan et al. Clinical Infectious Diseases 2013;57:1114–1128)by permission of Oxford University Press on behalf of the Infectious Diseases Society of America.
Neurology: Clinical Practice |||||||||||| June 2014 Neurology.org/cp 207
Diagnosis and management of acute encephalitisDiagnostic criteria for encephalitis
A. Venkatesan, Clin Infect Dis 2013

• 1998-2005: 1570 patients (adults and children) • ICU admission 58%
Clin Infect Dis, 2006
Clin Infect Dis 2009
• 2007: 253 patients (adults) • ICU admission 46%

Epidemiology of acute encephalitis
Study n Design Main causes
Unknown cause
Glaser CA 2006
1570 Prospec,ve Mul,center
HSV1, enterovirus, M. pneumoniae
63%
Stahl JP 2009
253 Prospec,ve Mul,center
HSV1, VZV Mycobacterium tuberculosis
48%
Granerod J 2010
203 Prospec,ve Mul,center
HSV1 Immune-‐mediated
37%
Thakur KT 2013
103 Retrospec,ve Single center
ICU
HSV1, VZV Immune-‐mediated
47%
Sonneville R 2014
279 Retrospec,ve Single center
ICU
HSV1, VZV, Mycobacterium tuberculosis
Immune-‐mediated
32%

Acute encephalitis in the ICU
CAUSES N = 279 INFECTIONS 149 (53%)
TB 65 (23%) HSV-‐1 40 (14%) VZV 14 (5%) Listeria 19 (7%) Other 11 (4%)
IMMUNE-‐MEDIATED 41 (15%) ADEM 24 (9%) An,-‐NMDAR 6 (2%) Other 11 (4%)
UNKNOWN 89 (32%)
Bichat Medical ICU 1991-‐2012
Data are n (%) R Sonneville, Eur J Neurol 2014

Temporal trends of encephalitis in the ICU
0% 20% 40% 60% 80% 100%
1991-‐2001
2002-‐2012
Infec)ons Immune-‐mediated Undetermined
R Sonneville, Eur J Neurol 2014
20%
ICU management of acute encephalitis
KEYPOINTS
• Encephalitis patients frequently require ICU admission
• Prognostic factors and the impact of secondary complications on outcome
• Understanding brain dysfunction
• Care in the ICU Cerebral oedema Seizures / status epilepticus Systemic complications
• Specific causes requiring anti-inflammatory therapy
• Conclusions

Outcomes of encephali)s in ICU pa)ents
N=279 pa,ents
Poor outcome at 3 months (mRS score 4-‐6): 71 (25%) pa,ents Hospital mortality 47 (17%) pa,ents
Causes of death
Dura,on of mechanical ven,la,on in ICU survivors : 12 (6-‐28) days
Acute brain injury
Systemic cause

IMPACT OF SPECIFIC THERAPY ON OUTCOME
Adverse outcome at 6-month : 84 adults
Clin Infect Dis 2002
Variables OR CI 95% p
SAPS 2 > 27 3.7 1.3-‐10.6 0.014
Admission – Acyclovir therapy > 2 days
3.1 1.1-‐9.1 0.037
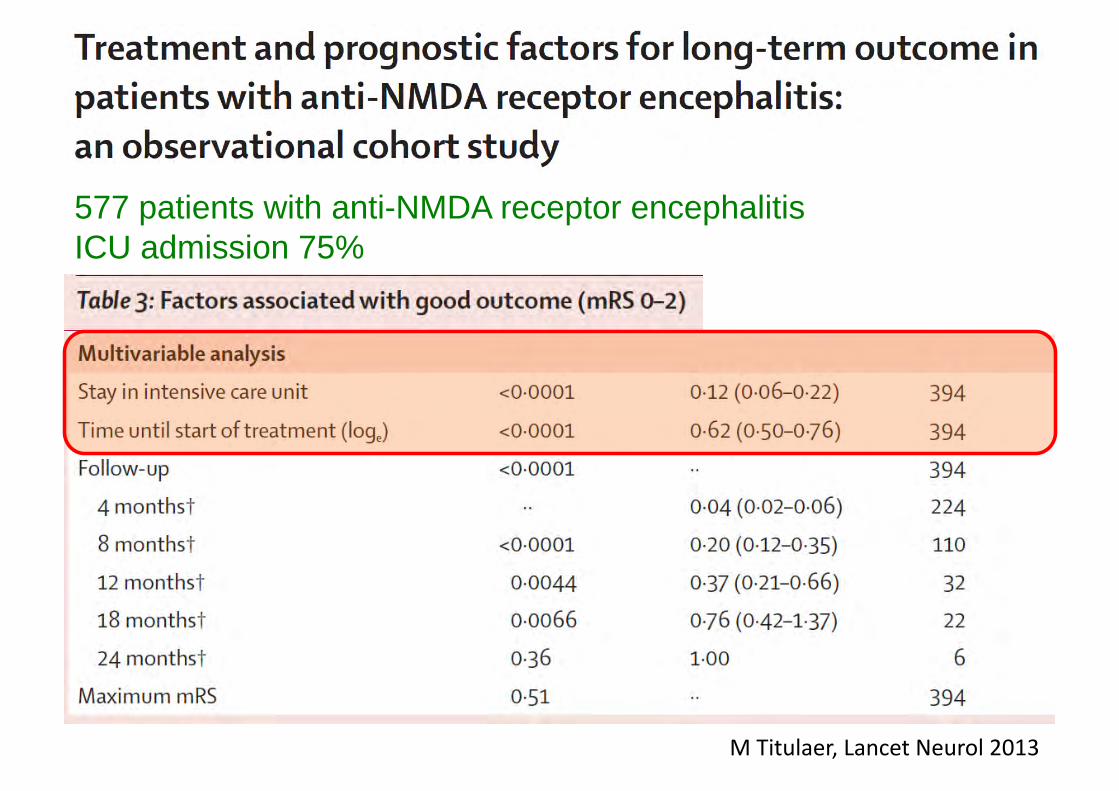
M Titulaer, Lancet Neurol 2013
577 patients with anti-NMDA receptor encephalitis ICU admission 75%
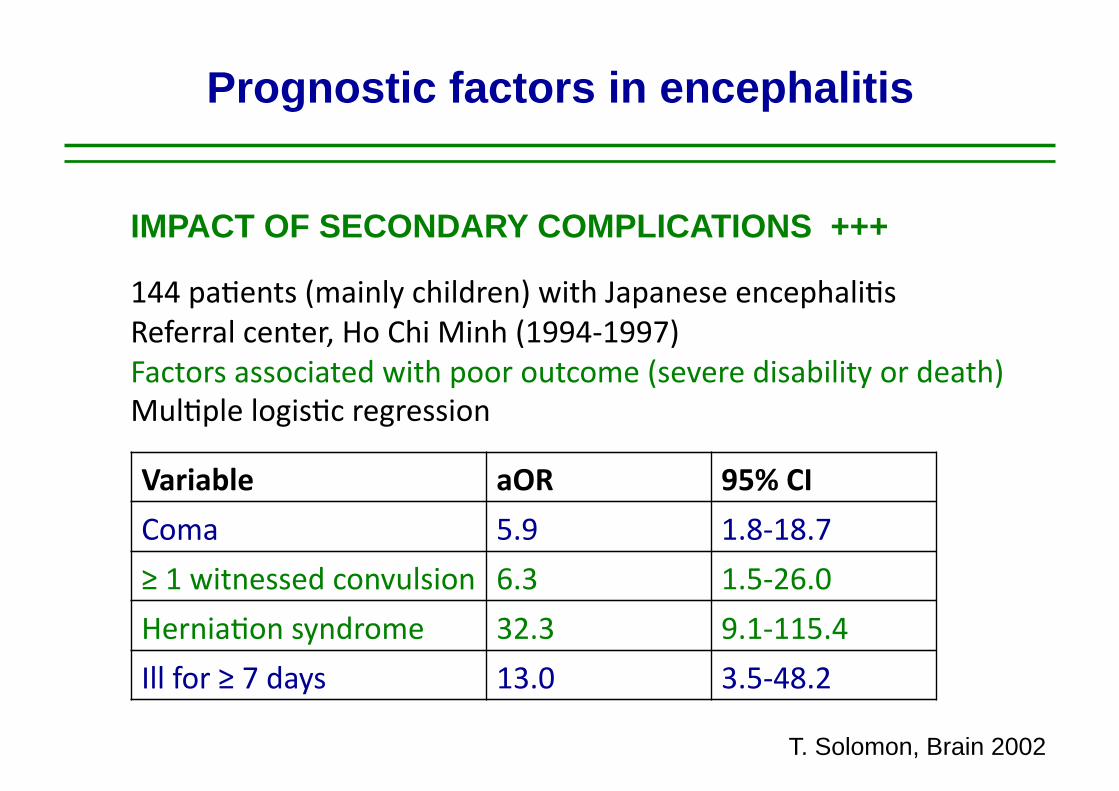
Prognostic factors in encephalitis
144 pa,ents (mainly children) with Japanese encephali,s Referral center, Ho Chi Minh (1994-‐1997) Factors associated with poor outcome (severe disability or death) Mul,ple logis,c regression
Variable aOR 95% CI
Coma 5.9 1.8-‐18.7
≥ 1 witnessed convulsion 6.3 1.5-‐26.0
Hernia,on syndrome 32.3 9.1-‐115.4
Ill for ≥ 7 days 13.0 3.5-‐48.2
T. Solomon, Brain 2002
IMPACT OF SECONDARY COMPLICATIONS +++

Prognostic factors in encephalitis
118 pa,ents with Japanese encephali,s Elevated levels of proinflammatory cytokines and chemokines in the CSF are associated with poor outcome
1624 • JID 2004:190 (1 November) • Winter et al.
Figure 2. Variation in cytokine and chemokine levels in cerebrospinal fluid (CSF), according to the day of illness. On the left, variations by dayare shown; on the right, days 2–3 of illness are compared with days 4–5 of illness. IFN, interferon; IL, interleukin.
in one study, such patients were more likely to have virusisolated from their CSF [9]. In contrast, patients previouslyinfected with a different flavivirus (in our setting, most oftendengue virus, presumably) rapidly produce antibodies to epi-topes that are common to dengue virus and JEV and are lesslikely to die [7, 8]. This anamnestic response to common fla-vivirus antigens is thought to explain the reduced rates of clin-ical attack and case fatality for JEV in dengue-immune subjects[9, 33–35]. However, prior flavivirus exposure is unlikely to bethe only explanation for the differing antibody responses in thenonsurvivors and survivors in the present study, because, evenamong the patients with a primary infection (i.e., excludingthe patients with prior flavivirus exposure), antibody responses
(as determined by levels of IgM and IgG in CSF and of IgMin plasma) varied with outcome.
The immune response to viral infection of the CNS differsfrom that in the periphery, because of the potentially damagingconsequences of cellular cytotoxicity, altered vascular perme-ability, and the influx of inflammatory cells to the brain [18,36]. In the present study, levels of proinflammatory cytokinesand chemokines were elevated in the CSF, plasma, or both ofmany of the patients, and higher levels of some of them (IL-6, IL-8, and TNF-a in CSF and RANTES in plasma) were foundin the nonsurvivors, compared with those in the survivors.Because the nonsurvivors tended to present earlier, some of thedifferences between the 2 groups may be a reflection of dif-
by guest on October 22, 2014
http://jid.oxfordjournals.org/D
ownloaded from
PM White, J Inf Dis 2004
IMPACT OF CSF INFLAMMATION +++
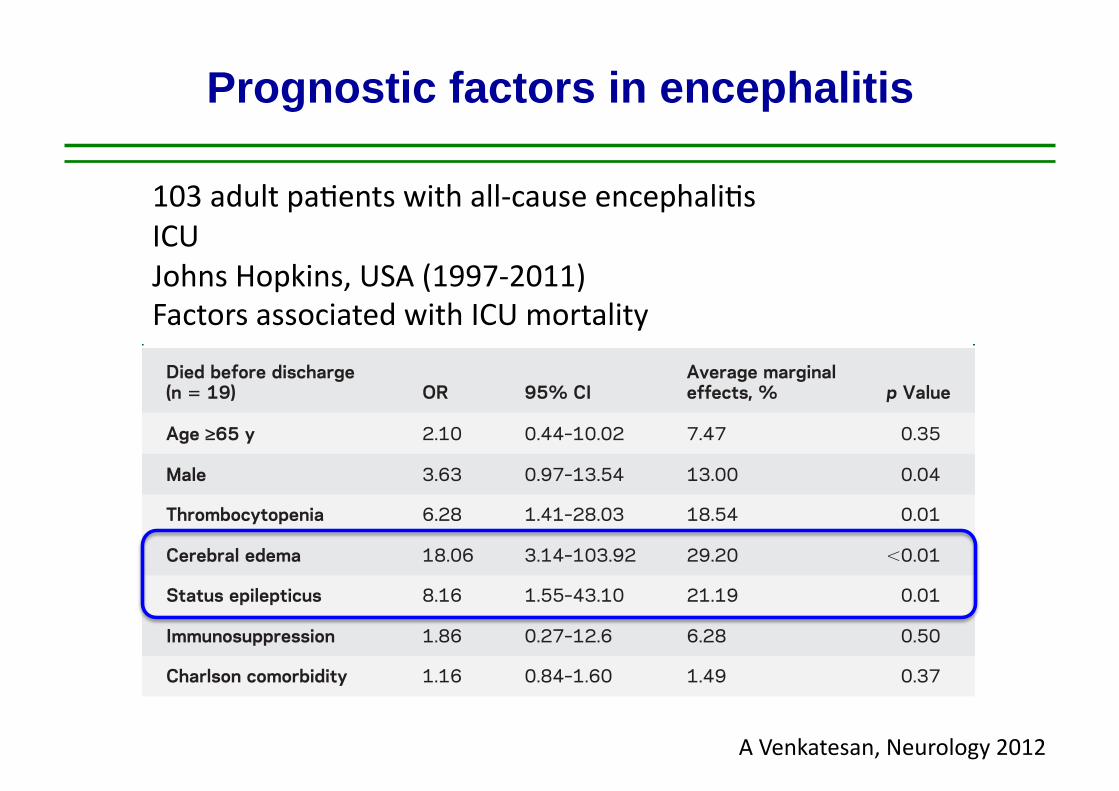
Prognostic factors in encephalitis
103 adult pa,ents with all-‐cause encephali,s ICU Johns Hopkins, USA (1997-‐2011) Factors associated with ICU mortality
A Venkatesan, Neurology 2012
surgery in patients with meningoencephalitis.12–18
Our results suggest that clinicians must maintain vig-ilance for any change in pupil reactivity, developmentof focal neurologic deficits, and changes in level ofconsciousness. Given evidence that herniation may bereversible with aggressive management, use of hyper-osmolar therapy should be initiated emergently, andneurosurgery should be considered if there are signs ofmass effect.19 Further studies in larger cohorts areneeded to determine whether there is survival benefitin those critically ill patients with encephalitis whohave ICP monitoring, along with aggressive medicaland surgical management of cerebral edema.
In addition to the increased mortality seen withcerebral edema, patients in SE were found to havean increased risk of death. Several studies have founda high 30-day mortality risk in patients who develop
SE.20–23 In a previous study evaluating SE in patientswith encephalitis and response to antiepileptic drugsand mortality, 36.7% remained refractory to thesecond antiepileptic drug and approximately one-third of patients died.24 Studies have shown thatencephalitis is a common cause of refractory SE(RSE).25,26 In our study, 11 patients (57.89% ofthose patients in SE) had RSE and required phar-macologic burst suppression. The increased likeli-hood of patients with encephalitis to develop RSEis probably related to the predilection for infectionssuch as HSV and autoimmune encephalitides to tar-get epileptogenic limbic structures and other corticalregions. Ongoing studies of early EEG features mayshed further light on prognostication in patientswith encephalitis.
The presence of thrombocytopenia was also signifi-cantly associated with mortality. The overall incidenceof thrombocytopenia among the critically ill is 35%to 44% and may be attributable to a variety of causesincluding decreased platelet production as a result ofbonemarrow suppression, increased platelet destructiondue to immune and nonimmune causes, hemodilution-al effects due to blood loss, or splenic sequestration.27 Inprevious studies of critically ill patients, thrombocyto-penia was found to be a stronger independent predictorfor ICU mortality than were composite scoring systemsused in the ICU, such as the APACHE (Acute Physi-ology and Chronic Health Evaluation) II score or theMultiple Organ Dysfunction Score.28–30 Our study sug-gests that this association between thrombocytopeniaand mortality in patients who are critically ill extendsto those with encephalitis.
Table 2 Univariate analysis of death, and good and poor outcome in survivors, among patients with all-causeencephalitis
mRS score <3(n 5 37)
mRS score 4 or 5(n 5 47) Died (n 5 19)
p Valuefreq % freq % freq %
Age ‡65 y 5 13.51 12 25.53 7 36.84 0.13
Male 21 56.76 18 38.30 13 68.42 0.05
ICU location (NCCU) 25 67.57 36 76.60 14 73.68 0.65
Cerebral edema 3 8.11 5 10.64 7 36.84 0.01
Status epilepticus 5 13.51 9 19.15 5 26.32 0.50
Burst suppressed 4 10.81 7 14.89 5 26.32 0.31
Need for intubation 14 37.84 29 61.70 18 94.74 ,0.01
Leukopenia 8 21.62 11 23.40 6 31.58 0.70
Thrombocytopenia 5 13.51 8 17.02 10 52.63 0.00
GCS score £8 10 27.03 18 38.30 11 57.89 0.08
Immunosuppression 11 29.73 11 23.40 9 47.37 0.16
Abbreviations: freq 5 frequency; GCS 5 Glasgow Coma Scale; ICU 5 intensive care unit; mRS 5 modified Rankin Scale;NCCU 5 neurosciences critical care unit.
Table 3 Multivariate analysis of factors associated with death in patients withall-cause encephalitisa
Died before discharge(n 5 19) OR 95% CI
Average marginaleffects, % p Value
Age ‡65 y 2.10 0.44–10.02 7.47 0.35
Male 3.63 0.97–13.54 13.00 0.04
Thrombocytopenia 6.28 1.41–28.03 18.54 0.01
Cerebral edema 18.06 3.14–103.92 29.20 ,0.01
Status epilepticus 8.16 1.55–43.10 21.19 0.01
Immunosuppression 1.86 0.27–12.6 6.28 0.50
Charlson comorbidity 1.16 0.84–1.60 1.49 0.37
Abbreviations: CI 5 confidence interval; OR 5 odds ratio.a Hosmer-Lemeshow statistics (x2 5 2.80, p 5 0.90).
Neurology 81 August 27, 2013 5
ª 2013 American Academy of Neurology. Unauthorized reproduction of this article is prohibited.

Variable Odd Ratio 95% CI
KNAUS score 3-‐4 6.3 2.0-‐21.2 Coma 7.1 3.1-‐17.0 Temperature (per °C) 0.7 0.5-‐0.9 Aspira,on pneumonia 4.0 1.5-‐11.0 CSF protein levels, per 1 g/l 1.6 1.2-‐2.1 Time between hospital and ICU admission, days 1.04 1.01-‐1.07
279 adult patients with all-cause encephalitis Bichat medical ICU, Paris, France (1991-2012) Poor outcome (mRS=4-6): 71 (25%) patients at day 90
R Sonneville, Eur J Neurol 2014
Prognostic factors in encephalitis

Prognostic factors in encephalitis
R Sonneville, Eur J Neurol 2014

How to improve outcome ?
• Timely identification of causes of encephalitis deserving specific therapy
• Early ICU admission
• Detection and control of secondary complications – Cerebral oedema, herniation – Seizures – Systemic complications

ICU management of acute encephalitis
KEYPOINTS
• Encephalitis patients frequently require ICU admission
• Prognostic factors and the impact of secondary complications on outcome
• Understanding brain dysfunction
• Care in the ICU Cerebral oedema Seizures / status epilepticus Systemic complications
• Specific causes requiring anti-inflammatory therapy
• Conclusions
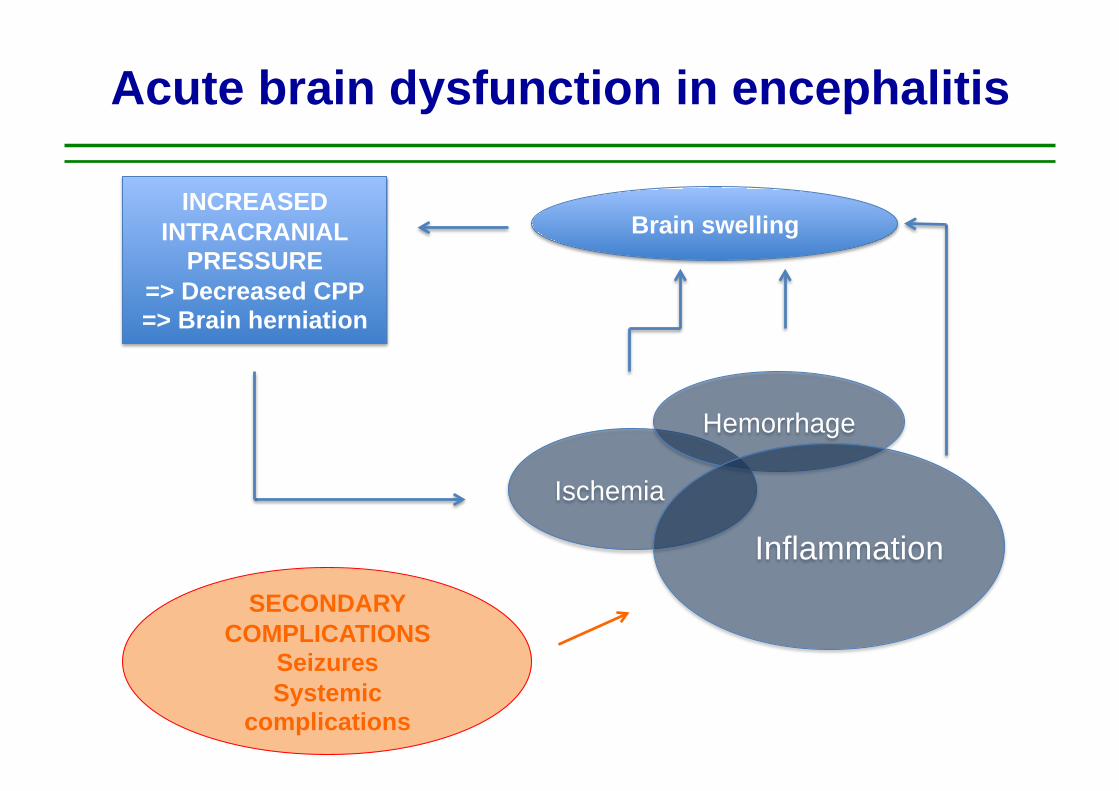
Acute brain dysfunction in encephalitis
Ischemia
Hemorrhage
Inflammation
Brain swelling INCREASED
INTRACRANIAL PRESSURE
=> Decreased CPP => Brain herniation
SECONDARY COMPLICATIONS
Seizures Systemic
complications

Acute brain dysfunction in encephalitis
Figure 3. (Patient 3). (A) CT shows severe left-sided brain edema, compression of left lateral and third ventricle, midline shift to right, and effacement of left-sided cerebral sdci. (3) The basal cisterns are bilateral compressed. Note the begin- ning of disturbance of the CSF circulation before decompressive surgery. (C) Postoperative CT shows herniation of brain through the bone defect and regression of m.ass effect. Contrast-enhanced CT (not shown) failed to demonstrate ill- defining patchy or gyriform enhancement, suggestive of encephalitis.
era1 to the craniectomy. The highest ICP values recorded were 37 mm Hg. Spinal tap 2 days later revealed 5 white blood cells, glucose of 65 mg/dl, with a protein content of 40 mg/dl. The Coombs’ test was positive and cold agglutinin titer 1:2000. The complement fixation test for M pneu- moniae was positive. Electrophysiologic examinations showed bilaterally normal BAEP; SEP had increased inter- peak latency (IPL) N13 through N20 and the N20P25 amplitude was absent in the right hemisphere. After 10 days she was successfully weaned and transferred to a rehabilitation clinic. She does not have any neurologic def- icit and has returned to work.
A 25-year-old man complained of “flulike” symptoms such as fever of up to 39”C, headache, and myalgias. Despite antibiotic treatment with amoxicillin the fever persisted. Because of progressive headache he was admitted to a county hospital, where a spinal tap revealed 600 white blood cells and a protein content of 140 mg/dl. The following day his condition further deteriorated and he became comatose. He was transferred to our NCCU due to suspected herpes encephalitis. On admission the patient was comatose. He showed fending-off movements upon noxious stimuli without localization of pain. CT ex- amination revealed right-hemispheric, space-occupying edema. EEG demonstrated a diffuse slowing with intermit- tent, rhythmic theta activity. For ICP monitoring an epi- dural probe was inserted. Despite osmotherapy, short- acting barbiturates, and hyperventilation the ICP values rose to 35 mm Hg. Right-hemispheric craniectomy was then performed, 2 days after onset of neurologic symptoms, for further ICP control. Further spinal tap gave evidence for herpes simplex virus infection, with a positive comple- ment fixation test and rise in IgG titer in the CSF. In the further clinical course the patient was able to be weaned within 7 days after operation. He recovered completely and is back a t work.
Patient 5.
Patient 6. A 45-year-old woman was admitted to our department because of dizziness and slight fever of 38.3”C. Within 24 hours she developed a severe right- sided hemiparesis, conjugated gaze palsy, global aphasia, and coma. She was admitted to the intensive care unit for intubation and artificial ventilation. CT a t admission showed a white matter hypodensity of the left hemisphere with effacement of the sulci but no midline shift or com- pression of the basal cisterns. Subsequent control CT showed a massive space-occupying hypodensity in the left hemisphere (figure 4). Selective digital subtraction angiog- raphy of the internal carotid and vertebral arteries re- vealed signs of a massive parietal space-occupying lesion but no vascular malformation, vasculitis, or large-vessel disease. Lumbar puncture yielded normal CSF with a pro- tein level of 140 mg/dl, normal cell count, glucose, IgG index, and no oligoclonal bands. Bacterial, fungal, viral, and tuberculosis test results were negative. Blood parame- ters of vasculitis such as antistreptolysin, antibodies against double-strand DNA, antinuclear factors, extract- able nuclear factors, mitochondria1 antibodies, comple- ment, and immunofixation electrophoresis were normal. Brain biopsy demonstrated satellitosis and scarce perivas- cular mononuclear cells. Apart from these rather unspe- cific findings, no clear evidence for a specific pathologic process, e.g., inflammation or tumor, was obtained. Fur- ther diagnostic procedures such as biopsies of muscle, nerve, and skin did not demonstrate pathologic findings. Since conservative antiedematous treatment with steroids, hyperventilation, osmodiuretics, and barbiturates was un- successful, decompressive craniectomy was performed 6 days after admission. Subsequent CT control examinations showed a slow reduction of the white matter edema. The patient was extubated 14 days later. Subsequently she recovered completely and retained no focal neurologic defi- cit. For intermittent focal seizures she was treated with
February 1997 NEUROLOGY 48 415
DIFFUSE CEREBRAL OEDEMA BRAIN HERNIATION
CONCERNS ABOUT INCREASED ICP AND MASS EFFECTS SHOULD PROMPT IMMEDIATE CT SCAN IMAGING
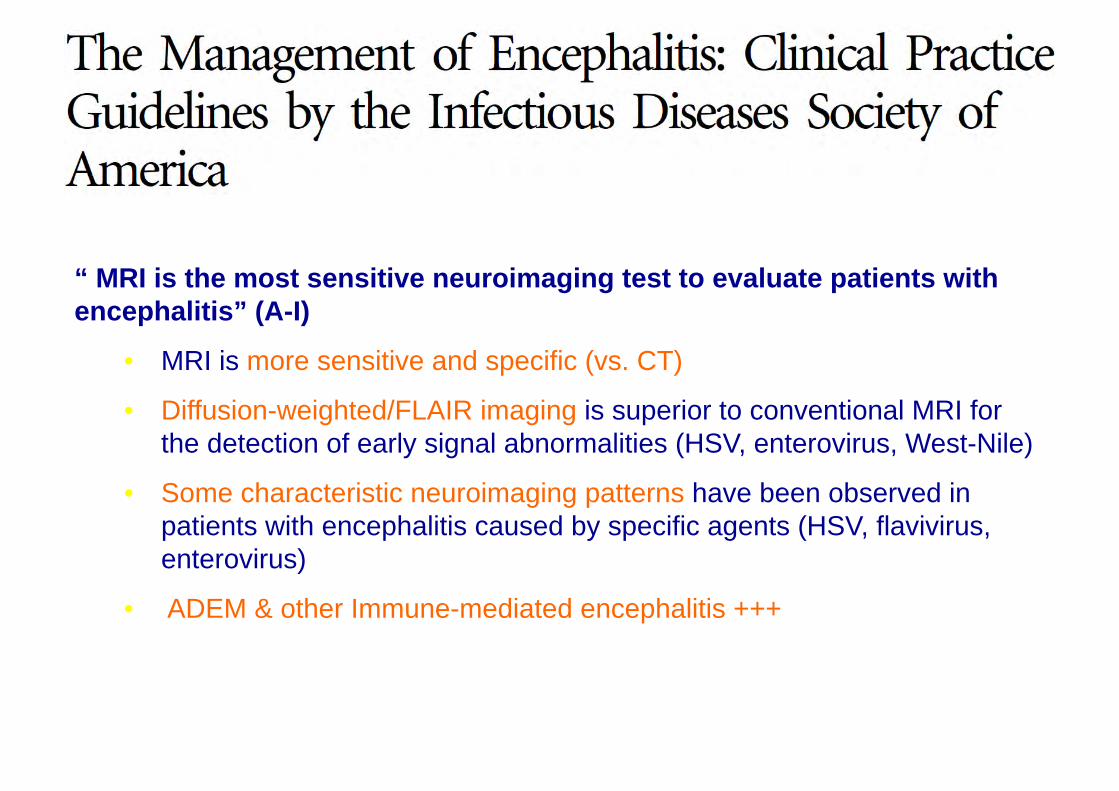
“ MRI is the most sensitive neuroimaging test to evaluate patients with encephalitis” (A-I)
• MRI is more sensitive and specific (vs. CT)
• Diffusion-weighted/FLAIR imaging is superior to conventional MRI for the detection of early signal abnormalities (HSV, enterovirus, West-Nile)
• Some characteristic neuroimaging patterns have been observed in patients with encephalitis caused by specific agents (HSV, flavivirus, enterovirus)
• ADEM & other Immune-mediated encephalitis +++

EARLY SIGNS OF BRAIN SWELLING
HSV1
MRI in acute encephalitis

DIFFUSE VASOGENIC OEDEMA
MRI in acute encephalitis
Diffuse white mamer hyperintensi,es, rela,ve sparing of cortex An increase in extracellular water => measurable increase in diffusion (elevated ADC, not shown)

Acute brain dysfunction in encephalitis
Fig. 3. Continuous EEG monitoring in a 19-year-old woman with Murray Valley encephalitis (same patient as in Fig. 1). At the bottom of the screen is a4-hour compressed density spectral array tracing demonstrating innumerable electrographic seizures. At the top of the screen is a 10-second EEG epochcorresponding to one of the seizures. Rhythmic sharp waves are seen arising in the right fronto-temporal region.
Kram
er630
60 yr-‐old man Acute onset of fever GCS score 10 Len hemiparesis CSF 70 cell / microL, prot 0.8g/l Posi,ve CSF PCR for HSV-‐1
NON CONVULSIVE SEIZURES
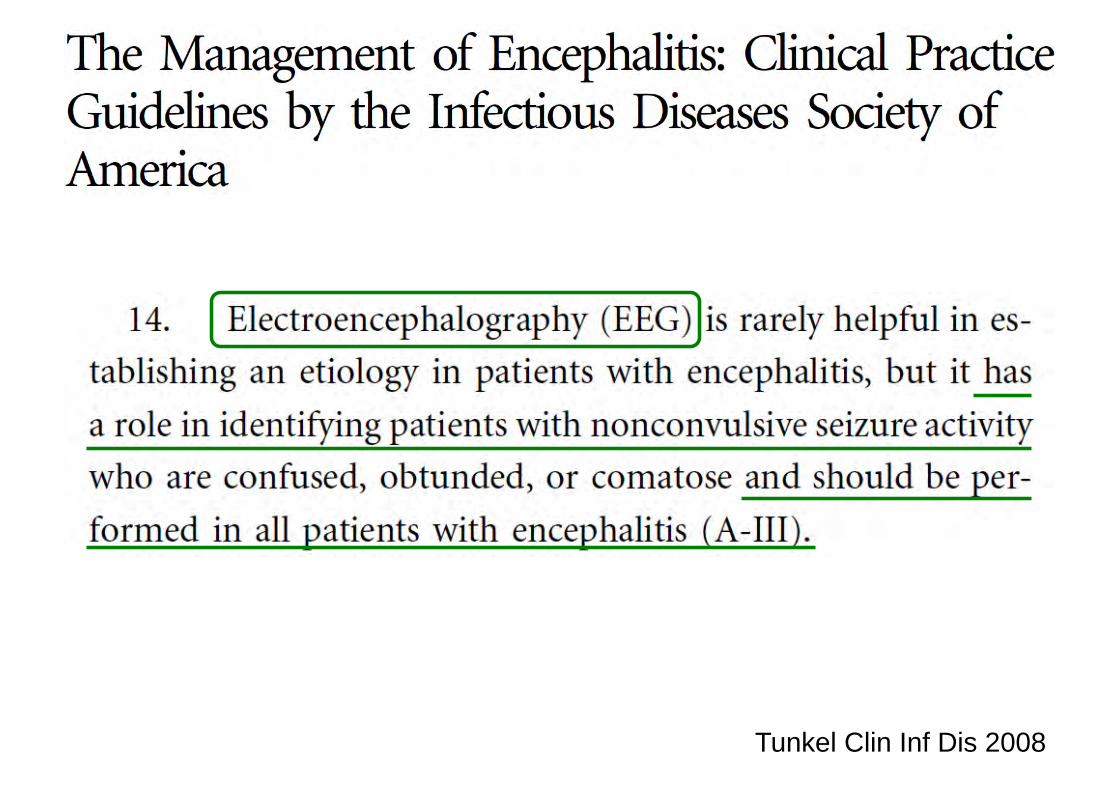
Tunkel Clin Inf Dis 2008

ICU management of acute encephalitis
KEYPOINTS
• Encephalitis patients frequently require ICU admission
• Prognostic factors and the impact of secondary complications on outcome
• Understanding brain dysfunction
• Care in the ICU Cerebral oedema Seizures / status epilepticus Systemic complications
• Specific causes requiring anti-inflammatory therapy
• Conclusions

• 19-‐year old girl, no medical history
• Admimed to the ER
Headache, fever 38.6°C
Delirium No focal sign
GCS 14
« normal CT scan »
CSF :
68 cells /microL (60% lympho.) Prot 0.58g/l
Glucose 3.7mmol/l
=> IV Acyclovir, IV amoxicillin
Case

Case
NEUROLOGICAL DETERIORATION ON DAY 3 GCS 8 ICU ADMISSION MECHANICAL VENTILATION
SEVERE INTRACRANIAL HYPERTENSION ON DAY 5 Bilateral pupillary dila,on Reac,vity to light +
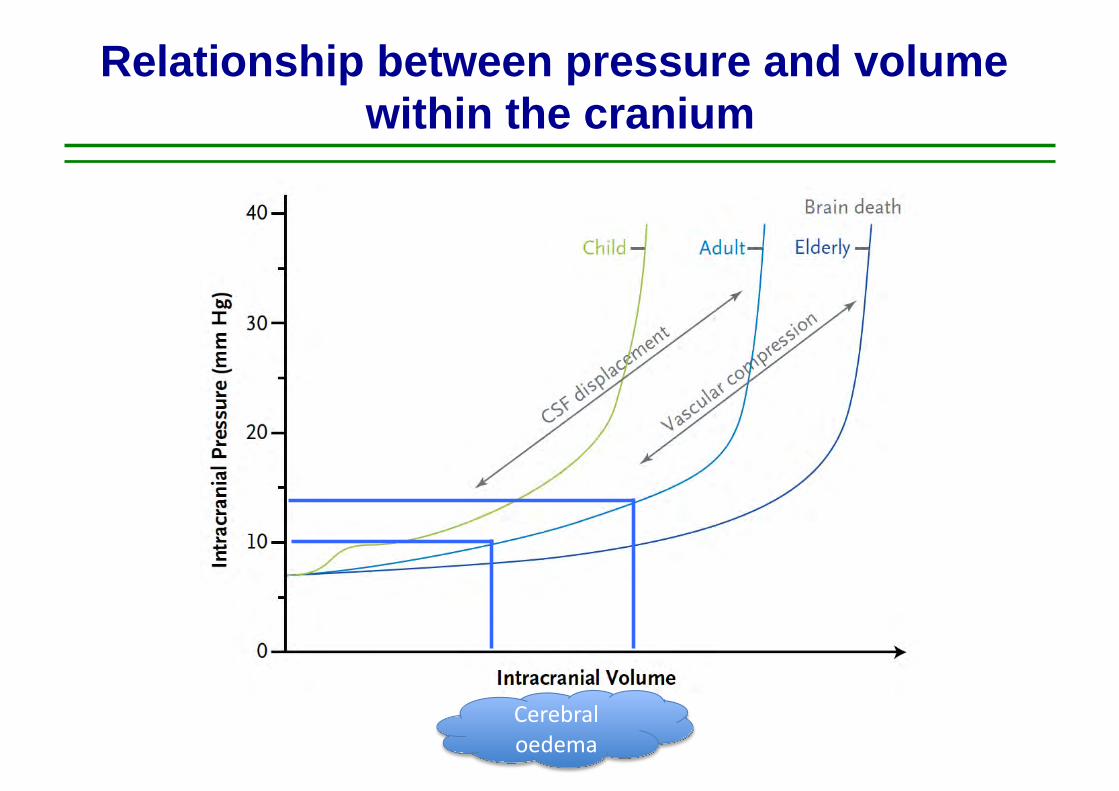
Relationship between pressure and volume within the cranium
Cerebral oedema

Relationship between pressure and volume within the cranium
Cerebral oedema
Raised ICP

Relationship between pressure and volume within the cranium
Cerebral oedema
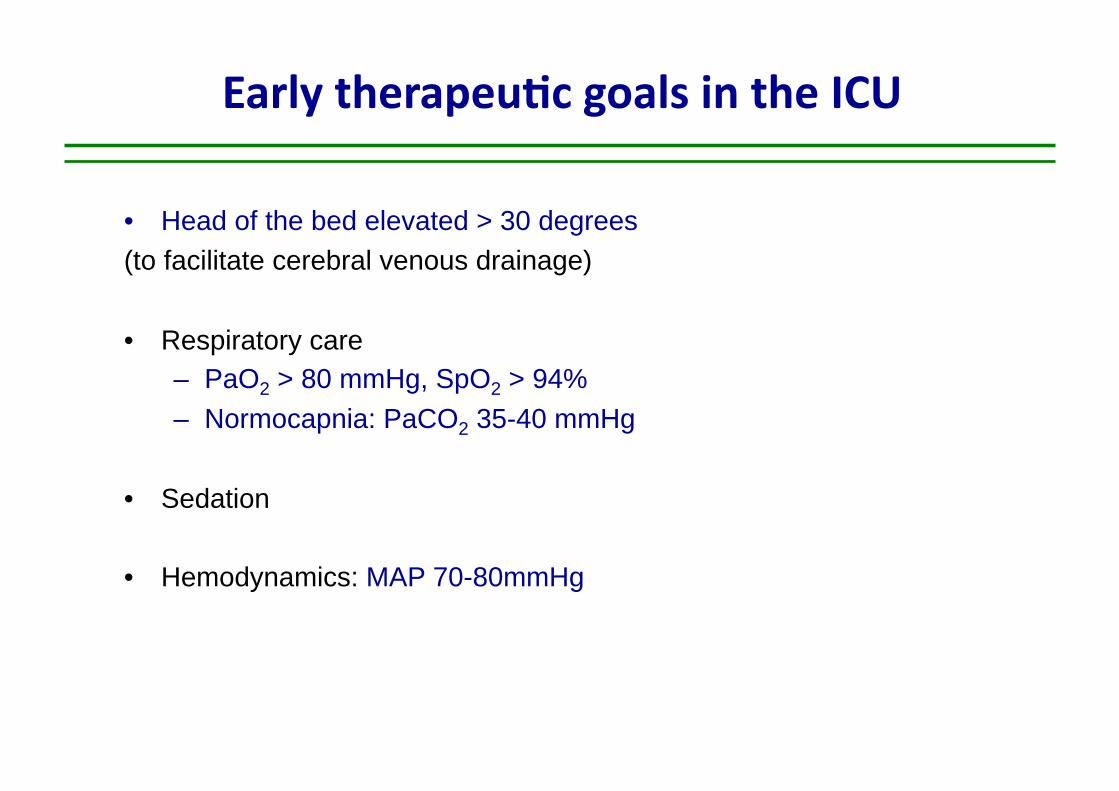
Early therapeu)c goals in the ICU
• Head of the bed elevated > 30 degrees (to facilitate cerebral venous drainage)
• Respiratory care – PaO2 > 80 mmHg, SpO2 > 94% – Normocapnia: PaCO2 35-40 mmHg
• Sedation
• Hemodynamics: MAP 70-80mmHg
Hyperosmolar therapy in raised intracranial pressure
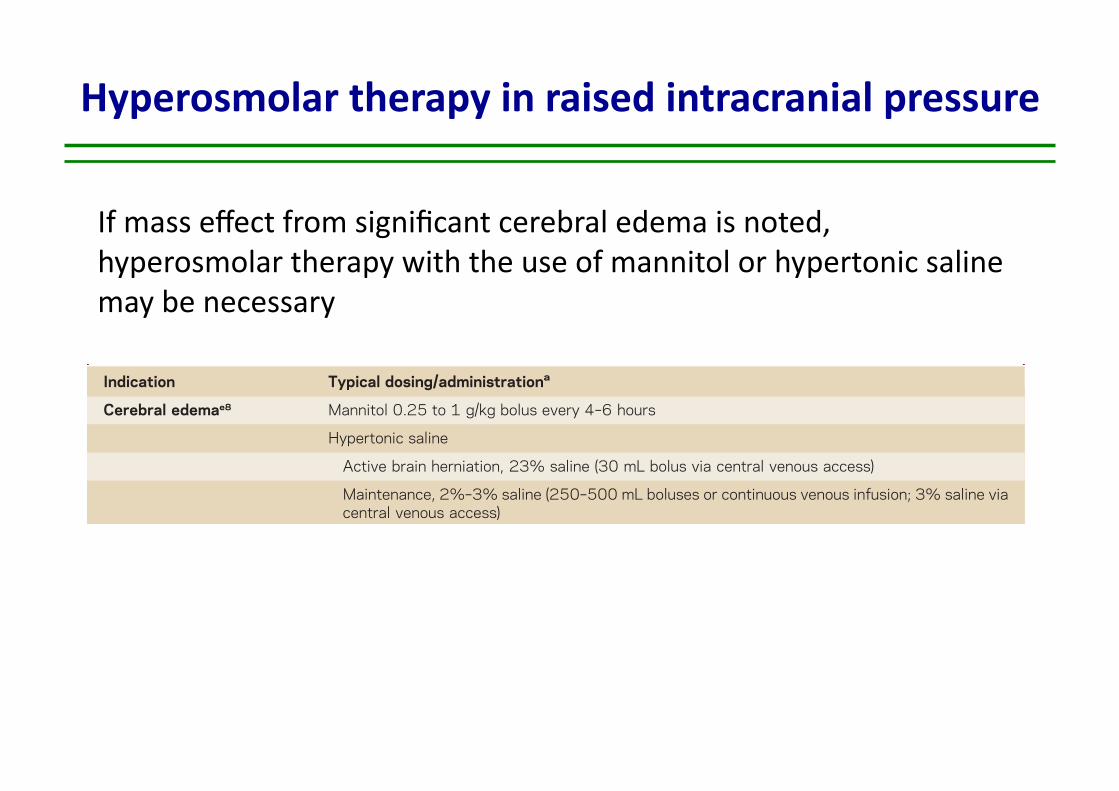
consciousness (LOC) associated with unilateral or bilateral pupillary dilation and nonreactivityto light may indicate transtentorial brain herniation. A recent review addressed the reversal ofbrain herniation.e8 Normal oxygenation (O2 sats .90%) and hyperventilation to pCO2 30 62 mm Hg and mean arterial pressure to at least 60 mm Hg are reasonable initial targets. Ifmass effect from significant cerebral edema is noted, hyperosmolar therapy with the use ofmannitol or hypertonic saline may be necessary. IV mannitol at 0.25 to 1 g/kg bolus every 4–6 hours can be given via a peripheral line, though it is important to correct the diuresisassociated with mannitol with normal saline solution in order to avoid dehydration. Ourpreference has been the use of hypertonic saline rather than mannitol; we typically useconcentrations of 2% Na via a peripheral line, and 3% or 23.4% Na via a central line.We administer 2% or 3% Na as boluses of 250–500 cc to attain a serum Na of 150–155;maintenance infusion may be necessary over several days. The administration of a 30-cc bolusof 23.4% Na is reserved for active brain herniation. One important caveat in the use of salinesolutions is in the setting of hyponatremia, as can occur in CNS infection. Long-term hy-ponatremia needs to be corrected slowly over several days to avoid myelin injury, and there-fore mannitol may be preferred in such settings. However, for those with normal Na,hypertonic saline is typically safe and may be used aggressively as needed. Mass effect
Table 3 Therapeutics agents commonly used in encephalitis
Indication Typical dosing/administrationa
Cerebral edemae8 Mannitol 0.25 to 1 g/kg bolus every 4–6 hours
Hypertonic saline
Active brain herniation, 23% saline (30 mL bolus via central venous access)
Maintenance, 2%–3% saline (250–500 mL boluses or continuous venous infusion; 3% saline viacentral venous access)
Seizures and statusepilepticuse12
First line, initial dosing Lorazepam 0.1 mg/kg IV up to 4 mg per dose
Midazolam 0.25 mg/kg IM up to 10 mg maximum
Diazepam 0.15 mg/kg IV up to 10 mg per dose
Second line, initial dosing Fosphenytoin 20 mg PE/kg IV
Levetiracetam 1,000–3,000 mg IV
Valproate sodium, 20–40 mg/kg IV
Third line, loading dose Propofol 1–2 mg/kg
Phenobarbital 20 mg/kg IV
Pentobarbital 5–15 mg/kg IV
Herpes simplexencephalitis17
Acyclovir, 10 mg/kg IV q 8 hrs 3 14–21 days
Autoimmune encephalitis,acutee16,e17
First line Methylprednisolone 1,000 mg IV q day 3 5 days
IV immunoglobulin, 0.4 g/kg IV q day 3 5 days
Plasma exchange, 5–7 exchanges administered every other day
Second line Cyclophosphamide, body surface area 3 800 mg IV
Rituximab, 1,000 mg IV 3 1, followed by second dose in 2 weeks
aDrugs and dosing recommendations are provided only as guide; clinical conditions and drug effects must be carefully consideredprior to drug administration.
212 © 2014 American Academy of Neurology
Arun Venkatesan and Romergryko G. Geocadin
If mass effect from significant cerebral edema is noted, hyperosmolar therapy with the use of mannitol or hypertonic saline may be necessary

T h e n e w e ngl a nd j o u r na l o f m e dic i n e
n engl j med 370;22 nejm.org may 29, 20142126
and intracranial pressure through multiple mech-anisms. In the first minutes of infusion, mannitol and hypertonic saline expand the plasma volume, decrease blood viscosity, and reduce the cerebral blood volume.29 Once plasma osmolarity in-creases, a gradient across the blood–brain bar-rier is established, and water is extracted from the brain. This effect may last for up to several hours, until the osmotic equilibrium is reestab-lished. The integrity of the blood–brain barrier is a prerequisite for the efficacy of hyperosmolar agents. Mannitol is an osmotic diuretic and may cause dehydration and hypovolemia. Hypertonic saline may cause abrupt increases in the sodium
plasma concentration. Comparisons between mannitol and hypertonic saline for the treatment of increased intracranial pressure have not shown a clear superiority of one option over the other.29
Induced arterial blood hypocarbia (hyperventi-lation) reduces intracranial pressure at the expense of decreasing cerebral blood flow as a result of vasoconstriction.30 Hyperventilation carries a seri-ous risk of cerebral ischemia. For this reason, cur-rent guidelines recommend additional monitor-ing for cerebral ischemia (e.g., by the monitoring of oxygen saturation in the jugular bulb and of brain-tissue oxygenation) when hyperventilation is used.31
TherapySteps
Levels!ofEvidence Treatment Risk
1Intubation
Normocarbicventilation
2 Level III Increased sedation
3 Not reported
Not reported
Ventricular CSF drainage
4 Level IIHyperosmolar therapy
Mannitol or hypertonic saline
5 Level III Induced hypocapnia
6 Level III Hypothermia
7 Level II Metabolic suppression (barbiturates)
8 Not reported Decompressive craniectomy
Infection or delayed hematomaSubdural effusionHydrocephalus and syndrome
of the trephined
Hypotension and increased numberof infections
Coughing, ventilator asynchrony,ventilator-associated pneumonia
Fluid and electrolyte disturbances and infection
Excessive vasoconstriction and ischemia
Negative fluid balanceHypernatremiaKidney failure
Infection
Hypotension
Figure!3.!Staircase!Approach!to!the!Treatment!of!Increased!Intracranial!Pressure.
The level of therapy in patients with raised intracranial pressure is increased step by step, with more aggressive interventions when there is no response. The sequence of interventions may vary among different institutions; every intervention is associated with adverse effects. Shown are the levels of evidence that underpin various approaches to treatment. Levels of evidence are based on the criteria for classifi-cation of evidence, as used in international guidelines.24 The revised guidelines for the management of severe traumatic brain injury and the surgical guidelines for the management of such injury do not contain any evidence on ventricular drainage of cerebrospinal fluid (CSF) or the use of decompressive craniectomy. Level I evidence25 shows that decompressive craniectomy is effective in reducing intracranial pressure but may worsen the long-term outcome and is associated with several complications. Among them is the syndrome of the tre-phined, in which a sunken skull flap develops with a (poorly understood) neurologic deterioration.
The New England Journal of Medicine Downloaded from nejm.org at INSERM DISC DOC on October 23, 2014. For personal use only. No other uses without permission.
Copyright © 2014 Massachusetts Medical Society. All rights reserved.
Treatment of raised intracranial presssure
N. Stoccher, New Eng J Med 2014
✔
✔
✔
✔

T h e n e w e ngl a nd j o u r na l o f m e dic i n e
n engl j med 370;22 nejm.org may 29, 20142124
Intracranial causes of increased intracranial pressure
• Mass lesions (e.g., traumatic hematomas, tumors)• Edema• Vasodilatation• Disturbed central spinal !uid circulation
HematomaHematoma
Falcine herniation
Midline shift
Uncal herniation
herniation
Midline Midline shift
herniationherniation
shiftMidline Midline
Central herniation
herniationherniation
shift
Intracranial pressure under normal conditions, sagittal section
A!
Intracranial pressure monitoring by ventricular catheter
C Herniation, coronal sectionD!
Acute subdural hematoma, axial sectionB
Intracranial pressure tracing showing a progressive increase
ICP
(mm
Hg)
30
14 15 16 17 18Time (hr)
19 20 21 22 23 2413
20
10
0
Normal intracranial pressure tracing
ICP
(mm
Hg)
30
20
10
50 10 15 20 25 30 35 40 45 50 550
Time (sec)
Hematoma
Midline
Catheter
Lateral ventricle
Monitor
Collecting system
At equilibrium:The sum of the 3 intracranial components (cerebrospinal !uid + cerebral tissue + blood content) is constant, corresponding to a normal (10–15 mm Hg) intracranial pressure.
The New England Journal of Medicine Downloaded from nejm.org at INSERM DISC DOC on October 23, 2014. For personal use only. No other uses without permission.
Copyright © 2014 Massachusetts Medical Society. All rights reserved.
Treatment of raised intracranial presssure
INTRACRANIAL PRESSURE MONITORING BY VENTRICULAR CATHETER
N. Stoccher, New Eng J Med 2014

Review Articles
Hypocapnia and the injured brain: More harm than benefit
Gerard Curley, MB, FCARCSI; Brian P. Kavanagh, MD, FRCPC; John G. Laffey, MD, MA, BSc, FCARCSI
T raditional approaches in man-aging acute brain injury havefocused on the potential forhypocapnia to reduce intracra-
nial pressure (ICP) (1, 2). Because ele-vated ICP is generally adverse and hypo-capnia is thought to be benign,hyperventilation was widely practiced inpatients with acute brain injury. This rea-soning led to the idea that more profoundhyperventilation might be even betterand extremes of hypocapnia—for pro-longed periods—were advocated for acutebrain injury (3–7).
This review re-examines the rationalefor the use of hypocapnia in acute braininjury (both traumatic and other causes).We conducted a literature search onMEDLINE and PubMed (1966–August 1,2009) using the search terms: “hyperven-tilation,” “hypocapnia,” “alkalosis,” “car-bon dioxide,” “brain,” “lung,” and “myo-cardium,” alone and in combination.Bibliographies of retrieved articles werealso reviewed. The prevalence of hypocap-nia in the management of brain-injuredpatients and the evidence for beneficialand deleterious effects of hypocapniawere evaluated.
Hypocapnia: Definitions andSeverity
Arterial CO2 tension (Paco2) is a bal-ance between production and elimina-tion. Because endogenous productionrarely falls below normal, hypocapnia isusually caused by deliberate or accidentalhyperventilation. In the setting of acutebrain injury, the severity of hypocapniawhen used “therapeutically” has beengraded (Table 1) (8).
Why Do We Use Hypocapnia inPatients After Acute BrainInjury?
The Monro-Kellie doctrine states thatthe total volume of the intracranial con-
tents must remain constant because thecranial cavity represents a fixed volume.An increase in the volume of any intra-cranial compartment (e.g., cerebraledema, hematoma, or brain tumor) caninitially be compensated by displacementfrom another compartment. However,when intracranial content volume ex-ceeds a threshold, ICP increases precipi-tously (Fig. 1). Intracranial hypertension(sustained ICP !20 mm Hg) may causesecondary brain injury by impairing ce-rebral perfusion, direct pressure, or bybrainstem herniation.
Hypocapnia is induced to lower ICP bydecreasing the cerebral blood volume(CBV) via cerebral arterial vasoconstric-tion (Fig. 1). The effects are potent: cere-bral blood flow (CBF) decreases by ap-proximately 3% per mm Hg change inPaco2 (range, 60 to 20 mm Hg PCO2) inpatients with traumatic brain injury(TBI) (9).
How Often Do We UseHypocapnia in Clinical Practice?
Hypocapnia is widely used in adultsand children with acute brain injury fromthe earliest phases of the injury process,even in the absence of elevated ICP (8, 10).This widespread use of hypocapnia persistsdespite recognition of its dangers andguidelines—for adults (11) and children
From Department of Anaesthesia (GC, JGL), Uni-versity College Hospital, Galway, Ireland; Departmentsof Critical Care Medicine and Anesthesia and the Pro-gram in Physiology and Experimental Medicine (BPK),The Hospital for Sick Children, University of Toronto,Toronto, Canada; Department of Anaesthesia (JGL),School of Medicine, Clinical Sciences Institute, Na-tional University of Ireland, Galway, Ireland.
This manuscript was supported in part by a fel-lowship from Molecular Medicine Ireland under theProgramme for Research in Third Level Institutions(GC) and by funding from the European ResearchCouncil (JGL) under the Framework 7 program.
The authors have not disclosed any potential con-flicts of interest.
For information regarding this article, E-mail:[email protected]
Copyright © 2010 by the Society of Critical CareMedicine and Lippincott Williams & Wilkins
DOI: 10.1097/CCM.0b013e3181d8cf2b
Objectives: Hypocapnia is used in the management of acutebrain injury and may be life-saving in specific circumstances, butit can produce neuronal ischemia and injury, potentially worsen-ing outcome. This review re-examines the rationale for the use ofhypocapnia in acute brain injury and evaluates the evidence fortherapeutic and deleterious effects in this context.
Data Sources and Study Selection: A MEDLINE/PubMed searchfrom 1966 to August 1, 2009, was conducted using the searchterms “hyperventilation,” “hypocapnia,” “alkalosis,” “carbon di-oxide,” “brain,” “lung,” and “myocardium,” alone and in combi-nation. Bibliographies of retrieved articles were also reviewed.
Data Extraction and Synthesis: Hypocapnia—often for pro-longed periods of time—remains prevalent in the management ofseverely brain-injured children and adults. Despite this, there isno proof beyond clinical experience with incipient herniation thathypocapnia improves neurologic outcome in any context. On the
contrary, hypocapnia can cause or worsen cerebral ischemia. Theeffect of sustained hypocapnia on cerebral blood flow decreasesprogressively because of buffering; subsequent normocapnia cancause rebound cerebral hyperemia and increase intracranial pres-sure. Hypocapnia may also injure other organs. Accidental hypo-capnia should always be avoided and prophylactic hypocapniahas no current role.
Conclusions: Hypocapnia can cause harm and should bestrictly limited to the emergent management of life-threateningintracranial hypertension pending definitive measures or to facil-itate intraoperative neurosurgery. When it is used, Paco2 shouldbe normalized as soon as is feasible. Outside these settingshypocapnia is likely to produce more harm than benefit. (Crit CareMed 2010; 38:1348–1359)
KEY WORDS: carbon dioxide; hypocapnia; alkalosis; hyperventi-lation; acute brain injury; trauma
1348 Crit Care Med 2010 Vol. 38, No. 5
amino acids (e.g., N-methyl-D-aspartate)(85), which also may be increased by hy-pocapnia-induced neuronal dopamine(86). Finally, alkalosis inhibits the nega-tive feedback whereby low pH reducesongoing endogenous acid production(e.g., lactate) (87), potentially worseninginjury further.
Evidence for Hypocapnia-InducedBrain Ischemia. Concerns regarding hy-pocapnia and adverse neuronal O2 supplyand demand are supported by multiplefindings from clinical and experimentalstudies. First, in children (88) and adults(84, 89) with TBI, hypocapnia causes re-gional cerebral ischemia. In adults resus-citated after cardiac arrest, hypocapniareduces SjO2 (and increases lactate) (90).In experimental studies, hypocapnia re-duces regional CBF and local cortical tis-sue PO2 (91) and reduces cerebral oxyhe-moglobin (92, 93) and oxidizedcytochrome aa3 (93) while increasing ce-rebral deoxyhemoglobin (93). Second,hypocapnia produces ischemic changesin functional magnetic resonance imag-ing (64) and with electroencephalography(94). Third, brain lactate production (i.e.,anaerobic metabolism) is increased byhyperventilation (95), which may bemore severe earlier in TBI (96). However,alkalosis may directly stimulate glycolysis(to buffer alkalosis) and further elevatelactate (97).
Why Is Sustained HypocapniaParticularly Deleterious?
Progressive Loss of Effect on ICP. Hy-pocapnia rapidly elevates the pH of boththe CSF and the central nervous systemextracellular fluid, and the CBF declinescorrespondingly. Severinghaus et al (98)demonstrated, 4 decades ago, that duringprolonged hypocapnia the CSF pH is buff-ered toward normal and the CBF normal-izes. The buffering is a biphasic process.First, there is “tissue buffering” (99, 100),in which hypocapnia immediately lowersthe intracellular fluid CO2, resulting inexit of Cl! from intracellular fluid to ex-tracellular fluid and a reciprocal shift ofHCO3
! from extracellular fluid to intra-cellular fluid, thereby lowering the extra-cellular fluid concentration of HCO3
!.Second, the renal response—inhibitionof H" secretion and HCO3
! resorption inthe proximal tubule— begins immedi-ately and takes effect over hours to days(99, 100). Buffering of CSF pH normal-izes CBF as quickly as 6 hrs (101), even ifthe Paco2 remains low (2). In healthy
Figure 4. This figure summarizes the role of hypocapnia in the pathogenesis of neonatal intraventricularhemorrhage. Hypocapnia has been implicated in the pathogenesis of neonatal white matter injury (e.g.,periventricular leukomalacia), which results in intraventricular hemorrhage. Antioxidant depletion byexcitatory amino acids and sepsis-induced lipopolysaccharide and cytokines further potentiate white matterdestruction. Hypocapnia induced brain ischemia in watershed vascular territories, and hyperemia afterhypocapnia may contribute to intraventricular hemorrhage. Reproduced with permission from Laffey et al(140). LPS, lipopolysaccharide; TNF, tumor necrosis factor.
Figure 5. An integrated scheme of mechanisms underlying neurologic effects of hypocapnia. Induction ofsystemic hypocapnia results in a cerebrospinal fluid alkalosis, reducing cerebral blood flow, cerebral oxygendelivery, and, to a lesser extent, cerebral blood volume. This is potentially life-saving in the setting of criticallyelevated intracranial pressure. However, critical brain ischemia may result, exacerbated by an increase inhemoglobin oxygen affinity and an increase in neuronal excitability. Over time, cerebrospinal fluid pH and,hence, cerebral blood flow gradually return to normal. Normalization of Paco2 results in cerebral hyperemia andreperfusion injury to previously ischemic brain regions. In addition, hypocapnia may cause glutamate release andneuronal excitotoxicity. Reproduced with permission from Laffey et al (140).
1351Crit Care Med 2010 Vol. 38, No. 5(12)—that recommend limitation of hypo-capnia to intracranial hypertension accom-panied by neurologic deterioration.
Hypocapnia in Adults. The Brain ITinitiative, a collaboration of 38 Europeancenters that provide care for brain-injured patients, has established a TBIdatabase from which Neumann et al (10)recently analyzed arterial blood gas datafrom 2269 ventilation episodes. Earlyprophylactic hyperventilation, i.e., hypo-capnia in the first 24 hrs, was used in54% of episodes (10) (Fig. 2). Further-more, the majority of patients who didnot have increased ICP had significanthypocapnia for up to 50% of their totalventilation time. More than 90% of pa-tients with Paco2 !30 mm Hg receivedno monitoring of brain oxygenation (10).In the United States, 36% of U.S. board-certified neurosurgeons routinely useprophylactic hyperventilation in patientswith severe TBI (13).
Hypocapnia in Children. Hypocapniaremains prominent in the managementof brain-injured children (8). Retrospec-
tive analysis suggests that hypocapnia oc-curs in 52% of patients and that the 2003Pediatric Brain Trauma guidelines (12),which recommend strict limitation of hy-pocapnia, did not alter this (Fig. 3). Theyoungest children (!2 yrs) had the high-est incidence of severe hypocapnia, whichis a concern given the vulnerability of theneonatal brain and potential for associ-ated intraventricular hemorrhage (14)(Fig. 4). Severe hypocapnia was commonin children without elevated ICP (8). Thisis of particular concern because hypocap-nia predicted inpatient mortality (oddsratio, 2.8; 95% confidence interval, 1.3–5.9) independent of the severity of braininjury (8).
Hypocapnia in Early Brain Injury.Hypocapnia occurs in brain-injured pa-tients even before intensive care unit ad-mission. Almost 50% of Michigan emer-gency physicians routinely use prophylactichyperventilation in patients with severeTBI (15), and accidental hyperventilation isalso common (16). The net result is thatsevere hypocapnia (end expired CO2 !30mm Hg) is seen in 70% of patients trans-ferred by helicopter to a U.S. urban level Itrauma center (17). More recently, Warneret al (18) reported that 16% of intubatedTBI patients en route to a level I traumacenter had Paco2 levels !30 mm Hg,whereas 30% had levels of 30 to 35 mm Hg.Such prehospital hypocapnia is clearly asso-ciated with adverse outcome in TBI (16, 19).
What Happens to CerebralBlood Flow and OxygenRequirements in the InjuredBrain?
Cerebral Blood Flow. Hypocapnia isoften used in brain injury to reduce “lux-ury perfusion,” which is thought toworsen edema, especially in children(20). Furthermore, because injury impairsvascular control, if hypocapnia-induced va-soconstriction were more pronounced inuninjured vs. injured brain (21), then per-fusion might be shunted from normal tovulnerable (injured) brain, a concepttermed “inverse steal” (21).
These concepts are now largely dis-credited. CBF and cerebral oxygen deliv-ery are generally decreased after braininjury (22–28), and regional CBF is oftenmarkedly decreased particularly in thefirst 24 hrs (24–26). In 31% of patientswith TBI (26), CBF is below an “ischemicthreshold” in which ischemia and celldeath may occur (29). Transcranial Dopp-ler demonstrates low-flow early after TBI
in two-thirds of patients (30), a situationassociated with poor outcome (24, 31).Such hypoperfusion may be worsened bycerebral vasospasm, further worseningoutcome (32). Of particular concern, 80%of patients who die of head injury dem-onstrate profound ischemic neuronalchanges (27).
Cerebral Oxygen Utilization. Brain-injured patients commonly have lowermetabolisms and cerebral metabolic re-quirements for oxygen (CMRO2) (33, 34).The “mitochondrial dysfunction hypoth-esis” (22, 35) suggests that low CBF issecondary to the reduced CMRO2, whichis, in turn, caused by mitochondrial fail-ure attributable to injury. If true, then itcould be that the injured brain can toler-ate lower levels of O2 supply and thatfurther reducing CBF (e.g., hyperventila-tion) is possible without causing harm(36). Hypocapnia-induced reduction ofCBF may be tolerated after TBI because ofthis lower metabolic rate and perhapshigher oxygen extraction (22). However,assumptions about global events requirecaution in heterogenous injury becauseof focal limitation of oxygen diffusion at-tributable to endothelial swelling, micro-vascular collapse, and perivascular edema(37). Finally, lowered jugular venous ox-ygen extraction (e.g., SjO2) may reflectreduced brain O2 consumption ratherthan increased CBF.
How Does Hypocapnia ReduceCBV?
The aim of hypocapnia in acute braininjury is to reduce intracranial volume.However, the effect of hypocapnia on CBVis indirect and is mediated via reductionsin CBF (38). Positron emission tomogra-phy demonstrates that only 30% of theCBV resides in the arteries (39). Hypocap-nia has little effect on cerebral venoustone, and dynamic positron emission to-mography confirms that CO2-inducedchanges in CBV are mediated by alteredarterial, not capillary or venous, volume(38). Thus, the effect of changing Paco2on CBF (i.e., arterial) is proportionallygreater than its effect on CBV. ReducingCBF by "30% with hyperventilation cor-responds to a reduction of only 7% inCBV (40). Greater degrees of hypocapniafurther reduce CBF but do not reduceCBV or ICP (40).
The effect of CO2 on CBF depends onthe individual patient, baseline bloodflow, and the part of the central nervoussystem in question. In individuals CBF is
Figure 1. Relationship between intracranial vol-ume and intracranial pressure. Because the cra-nial cavity represents a fixed volume, an increasein the volume of brain tissue, tumor, or hema-toma can initially be compensated by displace-ment of volume from another compartment.Acute hypocapnia can reduce cerebral blood vol-ume, thereby attenuating the increase in intra-cranial pressure.
Table 1. Classification of severity of hypocapnia
Target Paco2
Range Classification
!26 mm Hg(!3.5 kPa)
Intensified forcedhyperventilation
26–30 mm Hg(3.5–3.9 kPa)
Forced hyperventilation
31–35 mm Hg(4.0–4.7 kPa)
Moderate hyperventilation
36–45 mm Hg(4.8–6.0 kPa)
Normoventilation
Modified with permission from Neuman et al(10).
1349Crit Care Med 2010 Vol. 38, No. 5
G Curley, Crit Care Med 2010

275 adult pa,ents RCT Oral glycerol 75ml x 4 / day vs. placebo The trial was stopped early on the advice of the data and safety monitoring board aner a planned interim analysis
KMB Ajdukiewicz, Lancet Infec,ous Diseases 2011

98 adult comatose pa,ents with meningi,s RCT induced hypothermia 32-‐34° for 48H versus standard care The trial was stopped early on the advice of the data and safety monitoring board aner a planned interim analysis
B Mourvillier, JAMA 2013

Neurology 1999
Decompressive craniectomy for encephalitis

Decompressive craniectomy for encephalitis
Good outcome
Poor outcome
p
Cause 0.02
Bacterial 9 (23) 7 (78)
Viral 24 (62) 2 (22)
Unkown 6 (15) 0 (0)
J Perez Bovet, Acta Neurochirurgica 2012
N=48 patients Literature review of published cases 39 (81%) had a favorable functional recovery Only two patients (4%) died after surgical treatment

ICU management of acute encephalitis
KEYPOINTS
• Encephalitis patients frequently require ICU admission
• Prognostic factors and the impact of secondary complications on outcome
• Understanding brain dysfunction
• Care in the ICU Cerebral oedema Seizures / status epilepticus Systemic complications
• Specific causes requiring anti-inflammatory therapy
• Conclusions

Seizures in patients with acute encephalitis
• 290 adult patients with encephalitis • Bichat medical ICU, Paris, France (1991-2013)
• Seizures : 99/290 (34%)
– Clinical presentation • Convulsive seizures : 4/5 • Non convulsive seizures : 1/5
– Type • Isolated seizures (n=44) • Non refractory status epilepticus (n=42) • Refractory status epilepticus (n=13)
662 | DECEMBER 2013 | VOLUME 9 www.nature.com/nrneurol
NEWS & VIEWS
many morphological studies. A recently published Canadian study using the diag-nostic gold standard for the evaluation of the extracranial venous system, catheter venography, found a comparable low rate of definite venous abnormalities (<3%), with no differences in prevalence between patients with MS, their siblings, and healthy controls.5 Interestingly, the sono-graphy findings in that study suggested a much higher rate of abnormalities, though again without differences between groups. Collectively, the CoSMo and Canadian studies provide definitive evidence that there is no relevant serious venous anomaly in MS, and that the ultrasound definition of ‘CCSVI’ is a false construct that cannot be reproduced in an objective manner.
Apart from the lack of trustworthy ultra-sound criteria, the normal variability of the venous system, and the fact that the jugular veins can be ligated without a risk of developing MS, render ‘CCSVI’ extremely implausible as a viable concept.7 It is regret-table, therefore, that funding agents such as the US and Canadian MS societies are wasting further resources on this topic, for reasons other than to scientifically dis-mantle this flawed medical concept. Even more worrisome is the treatment of this unproven disorder by means of angio-plasty or venous stenting.8 In the complete absence of evidence, this inappropriate and potentially harmful therapy is delivered at high cost and falsely promoted under the name ‘liberation therapy’ via the Internet (Figure!1). Proponents in turn accuse the CoSMo investigators of deliberately manipulating their data to protect personal interests in pharmaceutical companies,9 illustrating how perceptions can be clouded by!opinions.
In summary, there is insurmountable evidence against CSSVI, a concept that has been effectively deconstructed by a series of recent papers and should now be laid to rest. Doctors and funding agencies, as well as MS societies10 and other patient advocacy groups, should work together to educate lay people, who might be readily influenced by understandable outcries from individu-als who try to manipulate the media via the Internet, thereby giving false hope to patients with MS.
Department of Radiology and Nuclear Medicine, MS Centre Amsterdam, VU University Medical Centre, PO Box!7057, 1007 MB Amsterdam, Netherlands (F. Barkhof, M.!P.!Wattjes). Correspondence to: F. Barkhof [email protected]
AcknowledgementsThe authors thank Jim Reekers and Bob van Oosten for their comments and the multiple sclerosis patient for the permission to reproduce her MRI scan in Figure 1.
Competing interestsF. Barkhof declares associations with the following companies: Bayer-Schering, Biogen Idec, Genzyme, Merck Serono, Novartis, Roche, Teva. M.!P. Wattjes declares associations with the following companies: Bayer Healthcare, Biogen Idec, Janssen-Cilag, Novartis. See the article online for full details of the!relationships.
1. Zamboni, P. et!al. Chronic cerebrospinal venous insufficiency in patients with multiple sclerosis. J.!Neurol. Neurosurg. Psychiatry 80, 392–399 (2009).
2. Zamboni, P. et!al. The value of cerebral Doppler venous haemodynamics in the assessment of multiple sclerosis. J.!Neurol. Sci. 282, 21–27 (2009).
3. Valdueza, J.!M. et!al. What went wrong? The flawed concept of cerebrospinal insufficiency. J.!Cereb. Blood Flow Metab. 33, 657–668 (2013).
4. Comi, G. et!al. Observational case–control study of the prevalence of chronic cerebrospinal venous insufficiency in multiple sclerosis: results from the CoSMo study. Mult. Scler. 19, 1508–1517 (2013).
5. Traboulsee, A.!L. et!al. Prevalence of extracranial venous narrowing on catheter venography in people with multiple sclerosis, their siblings, and unrelated healthy controls: a!blinded, case–control study. Lancet http://dx.doi.org/10.1016/S0140–6736(13) 61747-X.
6. Wattjes, M.!P., Doepp, F., Bendszus, M. & Fiehler,!J. “Chronic cerebrospinal venous insufficiency” in multiple sclerosis—is multiple sclerosis a disease of the cerebrospinal venous outflow system? [German] Rofo 183, 523–530 (2011).
7. Khan, O. et!al. Chronic cerebrospinal venous insufficiency and multiple sclerosis. Ann. Neurol. 67, 286–290 (2010).
8. Reekers, J.!A., Lee, M.!J., Belli, A.!M., Barkhof,!F. Cardiovascular and Interventional Radiological Society of Europe commentary on the treatment of chronic cerebrospinal venous insufficiency. Cardiovasc. Intervent. Radiol. 34, 1–2 (2011).
9. The truth about the COSMO study. Facebook [online], https://www.facebook.com/ notes/ccsvi-in-multiple-sclerosis/the-truth-about-the-cosmo-study/ 10151336647652211 (2013).
10. Chronic cerebrospinal venous insufficiency (CCSVI). MS Society [online], http:// www.mssociety.org.uk/ms-news-and-research/ms-research/potential-treatments/emerging-areas-of-research/ccsvi (2013).
NEUROCRITICAL CARE
Seizures after acute brain injury —more than meets the eyeCecil D. Hahn and Nathalie Jette
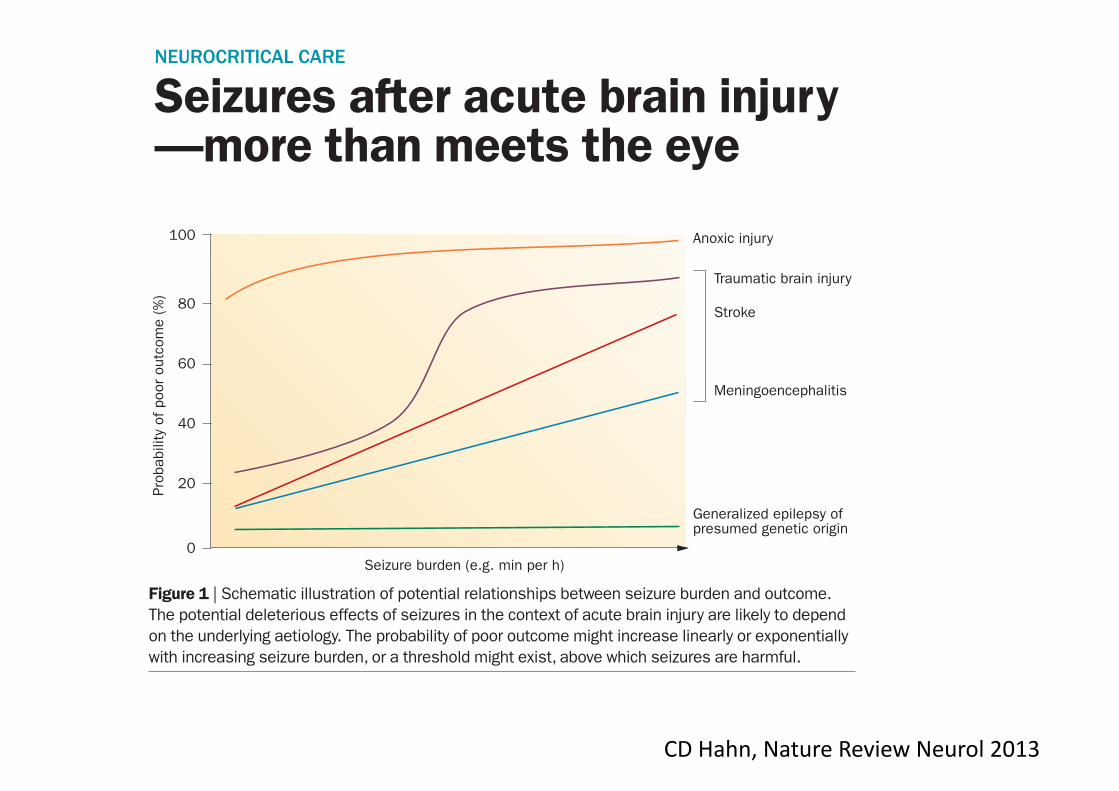
Increasing use of brain monitoring via continuous EEG in intensive care units has revealed that subclinical seizures are common among adults and children with acute brain injury. Subclinical seizures are associated with worse outcomes, but whether their prompt detection and treatment improves outcomes remains a pressing clinical question.Hahn, C.!D. & Jette, N. Nat. Rev. Neurol. 9, 662–664 (2013); published online 19 November 2013; doi:10.1038/nrneurol.2013.231
Seizures have long been recognized as a common consequence of acute brain injury. Convulsive seizures are known to cause brain injury when prolonged or repeated, and are, therefore, considered a neurological emergency warranting prompt treatment with antiepileptic drugs. The increasing use of continuous EEG (cEEG) to monitor brain function among critically ill patients with acute brain injury1 has revealed that con-vulsive seizures represent only the tip of the iceberg. Electrographic seizures detected by cEEG are often accompanied by subtle or no overt clinical signs, and would have previously gone undetected.2,3 The reported prevalence of these so-called subclinical or
nonconvulsive seizures among patients admitted to an intensive care unit (ICU) varies from 7–48%, largely depending on the population studied. Established factors associated with subclinical seizures among both adults and children admitted to ICUs include coma, acute brain injury, past history of epilepsy, convulsive seizures prior to cEEG, younger age, interictal epi-leptiform discharges, and abnormal EEG background activity.2–4
‘‘…children with moderate or severe TBI … should undergo cEEG monitoring’’
© 2013 Macmillan Publishers Limited. All rights reserved
NATURE REVIEWS | NEUROLOGY VOLUME 9 | DECEMBER 2013 | 663
NEWS & VIEWS
A recent report by Arndt et!al.5 high-lights the importance of subclinical seiz-ures among children with traumatic brain injury (TBI) requiring ICU admission. Among the 87 children studied, a remark-able 42.5% experienced seizures, with subclinical seiz ures (seizures without a clear clinical correlate that would have not been detected without cEEG monitoring) occurring in 16.7% and subclinical status epilepticus (subclinical seizures lasting >15 min, or more than three subclinical seizures per hour) in 13.8% of children. Subclinical seizures and status epilepti-cus were more common among younger children, those with abusive head trauma, and those!with intra-axial haemorrhage. Children with!subclinical seizures and status epilepticus required increased length of hospital stay and demonstrated worse outcomes, with lower scores on the King’s Outcome Scale for Childhood Head Injury (KOSCHI; scores range from 1–5, with 1!referring to death and 5 indicating good recovery) at hospital discharge.
The study by Arndt et!al.5 is important and novel because it is the first to apply cEEG monitoring to a consecutive cohort of children with TBI who were admitted to a paediatric ICU, but a few limit ations must be borne in mind. First, the authors chose to combine two quite hetero geneous cohorts from different institutions, some-what limiting the study’s generalizabil-ity. Second, the authors relied on clinical EEG reporting, which might have been influenced by knowledge of the patient’s clinical status. Although inter-rater reli-ability of EEG reporting was assessed, it was performed using a separate sample of cEEG recordings!from another set of pediat ric patients rather from the study parti cipants. It is also unclear what pro-portion of children experienced clinical seizures prior to cEEG monitoring, how soon after injury!cEEG!monitoring!of patients began, and how long it took to record their first seizure. Despite these limitations, this report makes a compelling case that children with moderate or severe TBI—in particular, younger children, and those with abusive head trauma or intra-axial haemorrhage—should undergo cEEG!monitoring.
Subclinical seizures present a pressing clinical dilemma: they clearly represent an important biomarker of acute brain injury, but their potential contribution to brain injury remains controversial. Plausible mechanisms for subclinical-seizure-induced
brain injury identified in experimen-tal animal models include excito toxicity, activation of inflammatory cascades, and hypoxia–ischaemia. Evidence for a similar deleterious effect of subclinical seizures in critically ill children and adults is mount-ing. Among adults with acute brain injury, subclinical seizures have been associated with focal metabolic dysfunction, increased intra cranial pressure, and ipsilateral hippo-campal atrophy.6,7 Among both adults and children, electrographic seizures and status epilepticus have been associated with increased mortality and worse short-term outcomes, even after controlling for diag-nosis and injury severity.8,9 Conclusive proof of a causal link between seizures and worse outcomes has, however, remained elusive. To demonstrate that reduction of seizure burden actually improves outcomes, an inter ventional study would probably be required. Fortunately, one such multi centre study is currently underway in critically ill!adults.10
The potential for subclinical seizures to cause harm is likely to depend on both the seizure burden and the type and severity of the underlying brain injury (Figure!1). Among patients with anoxic brain injury, the probability of a poor outcome might be so high that seizures have a minimal additional effect on outcome. Among patients with generalized epilepsy of pre-sumed genetic origin (formerly referred to as idiopathic generalized epilepsy), a high seizure burden might be respon-sible for persistent encephalopathy, but once seizures are aborted, patients may recover with few or no long-term sequelae. Among patients with acute focal stroke,
meningo encephalitis, TBI, or septic or meta bolic encepha lopathy, however, out-comes are more variable; in these situ ations, seizures might have a more important modu lating effect on neurological outcome. A clearer understanding of the relation-ships between seizure burden and outcome in the context of a patient’s diagnosis is urgently needed to help guide clinicians about when, and how aggressively, to treat subclinical!seizures.
cEEG monitoring remains beyond the reach of many medical centres because of the considerable equipment and staffing costs. Qualified EEG technologists required for electrode application and clinical neuro-physiologists required for interpretation are in short supply, particularly outside normal working hours. Creative strategies can, however, be applied to make cEEG monitoring more feasible. Intensive care nurses can be taught to apply a limited array of EEG electrodes or electrode caps, reducing reliance on EEG technologists. Quantitative EEG trending algorithms that time compress and simplify the EEG display can help to speed up EEG interpretation by clinical neurophysiologists, and enable bedside caregivers to more easily screen for seizures. These and other challenges must be overcome to enable greater access to brain monitoring in both resource-rich and resource-poor settings.
The care of critically ill patients with acute brain injury is challenging. The clinical neurological assessment is often compromised by the use of sedating or paralysing medications. In these situations, the addition of continuous brain monitor-ing has the potential to provide important
Figure 1 | Schematic illustration of potential relationships between seizure burden and outcome. The potential deleterious effects of seizures in the context of acute brain injury are likely to depend on the underlying aetiology. The probability of poor outcome might increase linearly or exponentially with increasing seizure burden, or a threshold might exist, above which seizures are harmful.
Seizure burden (e.g. min per h)
Prob
abili
ty o
f poo
r ou
tcom
e (%
)
0
100
Generalized epilepsy ofpresumed genetic origin
Meningoencephalitis
Stroke
Traumatic brain injury
Anoxic injury
20
80
60
40
© 2013 Macmillan Publishers Limited. All rights reserved
CD Hahn, Nature Review Neurol 2013

Electrophysiological recordings were carried out continu-ously from 15 minutes before the first bicuculline infu-sion, up to 60 minutes from the second bicuculline appli-cation. The position of recording electrodes was visuallycontrolled with a stereoscopic microscope. Depth electrodepositioning was guided by wave-form features of LOT-evoked responses. Signals were amplified via a multichan-nel differential amplifier (Biomedical Engineering, Thorn-wood, NY). Data were acquired and analyzed utilizingcustom-made software (ELPHO) developed by Dr Gnat-kovsky in our laboratory.
Immunohistochemistry. Experimental and controlbrains at the end of the electrophysiological experimentswere prepared for histology. Brains were fixed in 4%paraformaldehyde in 0.1M phosphate-buffered saline(PBS) for 90 minutes at 4!C, then transferred to 20%sucrose in PBS for 24 hours at 4!C. The brains were
rapidly frozen in "50!C isopentane for 3 minutes andstored at "80!C until assayed.
IL-1b Staining. Serial cryostat coronal sections (40lm)were cut throughout the septotemporal extension of thehippocampus (plates 44–56, lambda 6.6–4.2mm, accord-ing to Luparello atlas34). Ten sections were processed foreach brain (1 of every 6). Slices were incubated at 4!Cfor 10 minutes in 70% methanol and 2% H2O2 in0.1M Tris HCl-buffered saline (TBS; pH 7.4), followedby 30 minutes incubation in 10% fetal calf serum in 1%Triton X-100 in TBS. Then slices were incubated over-night in the same medium with the primary goatpolyclonal antibody to IL-1b (1:200; Santa CruzBiotechnology, Santa Cruz, CA). Immunoreactivity wastested by the avidin–biotin–peroxidase technique (VectorLaboratories, Burlingame, CA), the sections were reactedusing diaminobenzidine, and the signal was amplified by
FIGURE 1: (A) Epileptiform discharges simultaneously recorded in medial entorhinal cortex (mEnt) and in hippocampal CA1(see schematic drawing on the left). The first application of bicuculline (bic) induced 1 single seizure (left panel); the secondapplication induced several recurrent ictal discharges (right panel). (B) Anakinra reduced the duration of the first seizureinduced either by the first or the second pulse of bicuculline and prevented seizure recurrence. (C) Irregular firing and periodicbursting typically observed during bicuculline-induced seizure are shown in details in the expanded left lower trace. (D) Ana-kinra perfusion did not affect the irregular phase of seizure, but prevented the periodic regular bursting (right lower trace). (E)Mean values of seizures induced by the first application of bicuculline (light gray) and during coapplication of bicuculline andanakinra (dark gray). (F) Mean duration of the first seizure (left graph) and the subsequent seizures (right graph) induced bythe application of the second bicuculline perfusion with and without anakinra. (G) Total time spent in seizure in the 2 proto-cols, with and without anakinra perfusion. **p < 0.01 by one-way analysis of variance followed by Kruskal–Wallis test.
ANNALS of Neurology
84 Volume 72, No. 1
Epilep,form ac,vity was induced by arterial perfusion of bicuculline in the in vitro isolated guinea pig brain.
The effects of arterially perfused anakinra, a human recombinant IL-‐1b receptor antagonist, were inves,gated on epilep,form discharges, brain inflamma,on, and BBB damage.
ORIGINAL ARTICLE
Seizure-Induced Brain-Borne InflammationSustains Seizure Recurrence andBlood–Brain Barrier Damage
Laura Librizzi, PhD,1 Francesco Noe, PhD,2 Annamaria Vezzani, PhD,2
Marco de Curtis, MD,1 and Teresa Ravizza, PhD2
Objective: Epilepsy is a common neurological disorder characterized by recurrent seizures often unresponsive topharmacological treatment. Brain inflammation is considered a crucial etiopathogenetic mechanism of epilepsy thatcould be targeted to control seizures. Specific inflammatory mediators overexpressed in human epileptogenic fociare known to promote seizures in animal models. We investigated whether seizures induce brain inflammationindependently on extracerebral factors. We also investigated whether brain-borne inflammation is required andsufficient to maintain seizure activity and whether it causes blood–brain barrier (BBB) impairment. We addressedthese questions by studying the relation between seizures, inflammation, and BBB permeability in a brainpreparation isolated from extracerebral compartments.Methods: Epileptiform activity was induced by arterial perfusion of bicuculline in the in vitro isolated guinea pigbrain. Seizure-induced brain inflammation was evaluated by quantitative immunohistochemical analysis of interleukin(IL)-1b in parenchymal cells. BBB damage was assessed by extravasation of intravascular fluorescein isothiocyanate–albumin. The effects of arterially perfused anakinra, a human recombinant IL-1b receptor antagonist, wereinvestigated on epileptiform discharges, brain inflammation, and BBB damage.Results: Seizure induction in the absence of extracerebral factors promoted the release of IL-1b from brain residentcells and enhanced its biosynthesis in astrocytes. Anakinra rapidly terminated seizures, prevented their recurrence,and resolved seizure-associated BBB breakdown.Interpretation: Seizures initiate brain inflammation in glia and promote BBB damage that is independent of eitherleukocytes or blood-borne inflammatory molecules. Brain inflammation contributes to the duration and recurrence ofseizures. This study supports the use of specific anti-inflammatory drugs in clinical conditions that present withintractable recurrent seizures.
ANN NEUROL 2012;72:82–90
Epileptic seizures are not controlled by antiepilepticdrugs in about 1=3 of cases.1 How seizures occur
and the impact of their recurrence in shaping the epilep-togenic process are both central issues in epilepsyresearch.2,3 Elevated levels of specific inflammatory medi-ators are measured both in postsurgical brain specimensof patients with drug-resistant epilepsies of different eti-ologies4–9 and in brain regions involved in both the gen-eration and the propagation of seizures in animal models(reviewed in Vezzani et al4). In particular, the activationof the prototypical proinflammatory axis formed byinterleukin (IL)-1b and its cognate receptor type 1 (IL-
1R1) is functionally involved in the generation andrecurrence of experimental seizures in vivo.10–14 Theseproconvulsive effects are mediated either via rapid post-translational effects on voltage- and receptor-gated ionchannels15 or by activation of genomic programs.4,16,17
In vivo models have shown that IL-1b inductionduring seizures is associated with blood–brain barrier(BBB) damage,6,18 a phenomenon frequently observed inpostsurgical human epileptic tissue6,19 and sporadicallyreported in functional imaging studies.20 BBB damagemay contribute to perpetuate brain inflammation andchronic hyperexcitability through the involvement of
View this article online at wileyonlinelibrary.com. DOI: 10.1002/ana.23567
Received Sep 15, 2011, and in revised form Jan 24, 2012. Accepted for publication Feb 17, 2012.
Address correspondence to Dr Ravizza, Laboratory of Experimental Neurology, Department of Neuroscience, Mario Negri Institute for PharmacologicalResearch, Via G. La Masa 19, Milano, Italy. E-mail: [email protected]
From the 1Unit of Experimental Neurophysiology and Epileptology, Foundation Carlo Besta Neurological Institute; and 2Laboratory of ExperimentalNeurology, Department of Neuroscience, Mario Negri Institute for Pharmacological Research, Milan, Italy.
Additional supporting information can be found in the online version of this article.
82 VC 2012 American Neurological Association
Annals Neurol 2012

Seizure induction in the absence of extracerebral factors promoted the release of IL-1b from brain resident cells and
enhanced its biosynthesis in astrocytes.
brain regions that did not generate seizure activity, suchas the cerebellum (not shown). No colocalization wasfound between IL-1b and the neuronal marker NeuN(Supplementary Fig 3). We could not investigate theexpression of the cytokine in microglia, because the avail-able antibodies for microglia markers did not recognizethe specific epitopes in guinea pig brain tissue (notshown). Brain exposure to a single perfusion of bicucul-line showed that a single seizure was sufficient to induceIL-1b biosynthesis in astrocytes within 60 minutes fromits onset (Supplementary Fig 4). The extent of IL-1bincrease in astrocytes was similar after a single vs a dou-ble bicuculline application (see Fig 2D vs SupplementaryFig 4C; p > 0.05 by Student t test). This set of experi-ments demonstrates that epileptiform discharges promotede novo synthesis of IL-1b in astrocytes in regions specif-ically involved in seizure generation.6 IL-1b and GFAPstaining fully colocalized in parenchymal and perivascularastrocytes (Fig 2E, F).
To determine whether brain endogenous IL-1b con-tributes to seizure activity, we perfused 10lM of thehuman recombinant IL-1R1 antagonist, anakinra, via the
resident arterial system for 30 minutes during the firstand second bicuculline infusion. Anakinra perfusionstarted 5 minutes before bicuculline application. Ana-kinra consistently reduced by 80% (n ! 7) the durationof the first seizure induced by either the first or the sec-ond perfusion of bicuculline (p < 0.01; by one-wayANOVA followed by Kruskal–Wallis test), and virtuallyprevented seizure recurrence induced by the second bicu-culline application. Interestingly, the application of ana-kinra did not alter the early irregular firing phase ofseizures (lower left panels in Fig 1C, D), whereas itmarkedly reduced the late periodic bursting (lower rightpanels in Fig 1C, D), resulting in an average 85%decrease in the total time spent in seizures. These in vitrofindings confirm the anticonvulsant effects of intraven-tricular injection of anakinra in bicuculline-injectedmice,13 and demonstrate that this effect is not mediatedby extracerebral anti-inflammatory actions.23
In a separate set of experiments, we adopted anexperimental protocol to evaluate the effect of anakinraon seizure recurrence independently of its anticonvulsantactivity on the first bicuculline-induced seizure, as
FIGURE 2: Interleukin (IL)-1b immunoreactivity in cortical and hippocampal areas of isolated guinea pig brain following seizuresinduced by 2 pulses of bicuculline, and effect of anakinra. (A–C) Photomicrographs of histological sections from control (A), bicucul-line (B), and bicuculline and anakinra (C) perfused brains, showing frontoparietal cortex (FrPaCtx; first row), medial entorhinal cortex(mEnt; second row), and pyramidal cell layer (CA1) area of the temporal hippocampus (third row). (A) Control sections are devoid ofspecific IL-1b signal. Or5 stratum oriens; Rad5 stratus radiatum. (B, C) IL-1b immunoreactivity in parenchymal and perivascular cells(arrowheads, and white arrows in F) with glia morphology (see enlargements in boxes), 60 minutes after the second pulse of bicucul-line alone (B), or coperfused with anakinra during each of the 2 bicuculline pulses (C). (D) Quantification of IL-1b–positive cells in con-trol brains, and in brains perfused with bicuculline alone or with anakinra (means 6 standard deviation; n 5 5; *p < 0.05 vsbicuculline by Student t test). n.d.5 not detectable in control brains. (E, F) Immunofluorescent IL-1b signal (green); antiglial fibrillaryacidic protein (GFAP; red), and their colocalization (yellow signal, Merge). Scale bars: A–C, 50lm; E, 75lm; F, 150lm; enlargementsin boxes5 100lm. [Color figure can be viewed in the online issue, which is available at annalsofneurology.org.]
ANNALS of Neurology
86 Volume 72, No. 1
Annals Neurol 2012
CONTROL BICUCULINE An) IL1B-‐R
Seizure-‐induced brain inflamma,on was evaluated by quan,ta,ve immunohistochemical analysis of interleukin (IL)-‐1b in parenchymal cells.

Anakinra rapidly terminated seizures, prevented their recurrence, and resolved seizure-‐associated BBB breakdown
observed when the drug was perfused before bicucullineapplication (Fig 1E, F). When 10lM anakinra was per-fused for 45 minutes after the first bicuculline-inducedseizure, it drastically reduced seizure recurrence inducedby the second bicuculline perfusion (p < 0.05 by 1-wayANOVA followed by Kruskal–Wallis test; n ! 4; Supple-mentary Fig 1).
No changes of LOT-evoked potentials in piriformcortex and hippocampus were recorded during perfusionwith anakinra alone (see Supplementary Fig 2).
Rodent epilepsy models show BBB breakdown dur-ing recurrent seizures, which apparently resolves within 2hours from the last experienced seizure.19 In keepingwith this evidence, we found a significant brain extravasa-tion of FITC–albumin 60 minutes after the second pulseof bicuculline in the double application protocol (Fig 3Bvs A and 3D), which was up to 4-fold more prominentin all areas than that measured 60 minutes after a singlebicuculline infusion (p < 0.01 by Student t test; Supple-mentary Fig 5A). This finding indicates that the extentof BBB damage depends on the time spent in seizure ac-tivity (Fig 1E vs F). FITC–albumin extravasation couldbe detected as soon as 5 minutes after bicuculline perfu-sion (Supplementary Fig 5B), thus proving evidence thatseizures may cause very rapid BBB permeability changes.The extent of BBB opening to serum albumin, asassessed by measuring the area of protein extravasation,was significantly higher at 5 minutes than at 60 minutes
after bicuculline-induced seizures only in the entorhinalcortex (p < 0.01 by one-way ANOVA followed by Krus-kal–Wallis test). BBB damage was associated with ZO-1downregulation in endothelial cells, as shown 60 minutesafter either 1 (Supplementary Fig 6) or 2 pulses of bicu-culline (not shown).
Seizure-induced inflammation and BBB breakdownwere both drastically reduced by arterial brain perfusionof the anticonvulsant dose of anakinra (Figs 2C, D and3C, D, respectively).
DiscussionOur study provides the first direct demonstration thatseizure activity per se promotes the induction of inflam-matory mediators in parenchymal/perivascular astrocytesin brain regions involved in seizure generation, and inthe absence of peripheral immune cells or blood-bornemolecules. The experiments with anakinra also demon-strate that brain-borne IL-1b is instrumental for deter-mining both the duration and the recurrence of seizures.The immediate anticonvulsant effect of anakinra, aspecific and competitive IL-1 receptor antagonist with nointrinsic signaling activation properties,35 strongly sup-ports that IL-1b is rapidly released during the initialphase of a seizure from endogenous constitutivepools.10,36 Anakinra has no effect on evoked fieldresponses, indicating that it does not directly modulate
FIGURE 3: Fluorescein isothiocyanate (FITC)–albumin analysis of microvessels in cortical and hippocampal areas of isolatedguinea pig brain following seizures induced by 2 pulses of bicuculline, and effect of anakinra. (A–C) Photomicrographs of FITC–albumin signal in control (A), bicuculline (B), and bicuculline and anakinra (C) perfused brains, showing frontoparietal cortex(FrPaCtx; first row), medial entorhinal cortex (mEnt; second row), and pyramidal cell layer (CA1) area of the temporal hippo-campus (third row). (A) Control sections show intraluminal signal with scattered extravascular spots (white arrows). Or 5 stra-tum oriens; Rad 5 stratus radiatum. (B, C) areas of FITC–albumin parenchymal extravasation around vessels (white arrows), 60minutes after the second pulse of bicuculline alone (B) or coperfused with anakinra during each of the 2 bicuculline pulses (C).(D) Quantification of parenchymal FITC–albumin in control brains, and in brains perfused with bicuculline alone or with anakinra(means 6 standard deviation; n 5 5; *p < 0.05 vs control, #p < 0.05 vs bicuculline by one-way analysis of variance followed byKruskal–Wallis test). n.d. 5 not detectable in control brains. Scale bars 5 75lm. [Color figure can be viewed in the onlineissue, which is available at annalsofneurology.org.]
Librizzi et al: Astrocytic IL-1!
July 2012 87
Annals Neurol 2012
CONTROL BICUCULINE An) IL1B-‐R
BBB damage was assessed by extravasa,on of intravascular fluorescein isothiocyanate– albumin.

Seizures in patients with acute encephalitis
290 adult patients with encephalitis Bichat medical ICU, Paris, France (1991-2013) Factors associated with seizures, multivariate analysis Variable OR 95%CI
GCS < 13 3.2 1.6-‐6.4
Cor,cal involvement on CT 7.0 3.4-‐14.7
Cause
Immune-‐mediated (n=42) 1 -‐
Infec,ous (n=155) 0.4 0.2-‐1
Undetermined (n=93) 1.1 0.4-‐2.9
WBC > 10 000 / microL 1.3 0.7-‐2.5
CSF < 100 cells / microL 1.6 0.8-‐2.9
Natremia 1.0 1.0-‐1.1
N of organ failure(s) 1.1 0.7-‐1.8
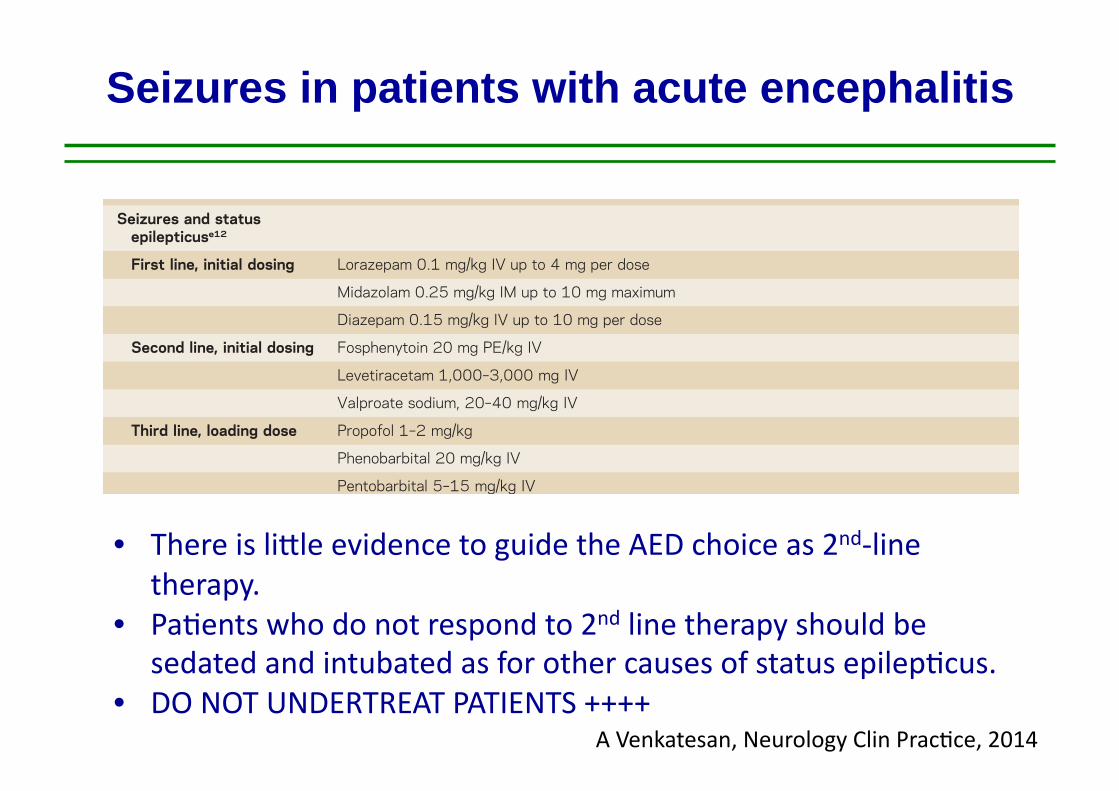
Seizures in patients with acute encephalitis
consciousness (LOC) associated with unilateral or bilateral pupillary dilation and nonreactivityto light may indicate transtentorial brain herniation. A recent review addressed the reversal ofbrain herniation.e8 Normal oxygenation (O2 sats .90%) and hyperventilation to pCO2 30 62 mm Hg and mean arterial pressure to at least 60 mm Hg are reasonable initial targets. Ifmass effect from significant cerebral edema is noted, hyperosmolar therapy with the use ofmannitol or hypertonic saline may be necessary. IV mannitol at 0.25 to 1 g/kg bolus every 4–6 hours can be given via a peripheral line, though it is important to correct the diuresisassociated with mannitol with normal saline solution in order to avoid dehydration. Ourpreference has been the use of hypertonic saline rather than mannitol; we typically useconcentrations of 2% Na via a peripheral line, and 3% or 23.4% Na via a central line.We administer 2% or 3% Na as boluses of 250–500 cc to attain a serum Na of 150–155;maintenance infusion may be necessary over several days. The administration of a 30-cc bolusof 23.4% Na is reserved for active brain herniation. One important caveat in the use of salinesolutions is in the setting of hyponatremia, as can occur in CNS infection. Long-term hy-ponatremia needs to be corrected slowly over several days to avoid myelin injury, and there-fore mannitol may be preferred in such settings. However, for those with normal Na,hypertonic saline is typically safe and may be used aggressively as needed. Mass effect
Table 3 Therapeutics agents commonly used in encephalitis
Indication Typical dosing/administrationa
Cerebral edemae8 Mannitol 0.25 to 1 g/kg bolus every 4–6 hours
Hypertonic saline
Active brain herniation, 23% saline (30 mL bolus via central venous access)
Maintenance, 2%–3% saline (250–500 mL boluses or continuous venous infusion; 3% saline viacentral venous access)
Seizures and statusepilepticuse12
First line, initial dosing Lorazepam 0.1 mg/kg IV up to 4 mg per dose
Midazolam 0.25 mg/kg IM up to 10 mg maximum
Diazepam 0.15 mg/kg IV up to 10 mg per dose
Second line, initial dosing Fosphenytoin 20 mg PE/kg IV
Levetiracetam 1,000–3,000 mg IV
Valproate sodium, 20–40 mg/kg IV
Third line, loading dose Propofol 1–2 mg/kg
Phenobarbital 20 mg/kg IV
Pentobarbital 5–15 mg/kg IV
Herpes simplexencephalitis17
Acyclovir, 10 mg/kg IV q 8 hrs 3 14–21 days
Autoimmune encephalitis,acutee16,e17
First line Methylprednisolone 1,000 mg IV q day 3 5 days
IV immunoglobulin, 0.4 g/kg IV q day 3 5 days
Plasma exchange, 5–7 exchanges administered every other day
Second line Cyclophosphamide, body surface area 3 800 mg IV
Rituximab, 1,000 mg IV 3 1, followed by second dose in 2 weeks
aDrugs and dosing recommendations are provided only as guide; clinical conditions and drug effects must be carefully consideredprior to drug administration.
212 © 2014 American Academy of Neurology
Arun Venkatesan and Romergryko G. Geocadin
A Venkatesan, Neurology Clin Prac,ce, 2014
• There is limle evidence to guide the AED choice as 2nd-‐line therapy.
• Pa,ents who do not respond to 2nd line therapy should be sedated and intubated as for other causes of status epilep,cus.
• DO NOT UNDERTREAT PATIENTS ++++

No SE NRSE RSE
0
20
40
60
80
100Dead
Alive
CLINICAL PRESENTATION
MO
RTA
LITY
(%)
Seizures in patients with acute encephalitis

Seizures in patients with acute encephalitis
Categorical variables were compared using the Chi-Squaretest or the Fisher exact test, as appropriate. Continuousvariables were compared using the two-tailed t-test orMann-Whitney U-test for non-normally distributed data.After identifying variables associated with outcome in theunivariate analysis we performed a binary logistic regres-sion analysis to identify independent outcome predictors.
ResultsDemographicsDuring the study period, 147 patients presented withRSE, 21% (31/147) of whom fulfilled criteria for SRSEtreated with cIV-PTB during cEEG. In the SRSE group,mean age was 48+/!20 years and 56% (17/31) were female(see Table 1). Of the patients, 26% (8/31) had a historyof epilepsy, including two patients with Lennox-Gastautand one patient with cortical dysplasia. Initial seizuresemiology was convulsive in almost two thirds and nonconvulsive in one third of SRSE patients. Of the patientswith acute etiology, 75% (12/31) had encephalitis: 26%(8/31) had catastrophic etiologies including 13% (4/31)with complicated astrocytoma (World Health Organization
grade III), 6% (2/31) with end-stage pancreatic cancer, andone each with acute rejection of cardiac transplant andmeningeal carcinomatosis. In comparison, patients withRSE who did not progress to SRSE were older (odds ratio(OR) 0.96;CI 0.94-0.98), and more frequently had intracere-bral hemorrhage (OR 0.09, 95% CI 0.01, 0.69). Patients withSRSE were more likely to have encephalitis as the under-lying etiology of SE (OR 4.35, 95% CI 1.71, 11.09).
AED treatmentAll patients admitted with SRSE who received cIV-PTBreceived first-, second-, and third-line therapy. Mostpatients received a combination of a BZD and PHT (25/31), followed by combinations of either BZD plus VPA(4/31) or BZD plus LEV (2/31). Administered AED med-ications included PHT/fosPHT in 80% (25/31), VPA in67% (21/31), LEV in 61% (19/31), phenobarbital in 35%(11/31), topiramate in 26% (8/31), lacosamide in 9% (3/31),and ketamine in 9% (3/31) of patients. Midazolam was theprimary third-line choice in 94% of patients (29/31); 13 ofthese later received propofol in addition to midazolam, andthe remainder received only propofol infusions (6%; 2/31).
Table 1 Demographic and etiologySRSE n = 31 RSE n = 116 Odds ratio (95% CI) P-value
Age, years1 48 (+/-20) 61 (+/-17) 0.96 (0.94, 0.98) 0.001*
Women, n (%) 17 (55) 78 (67)
Race, n (%)
White 15 (48) 52 (45) - -
Non white 16 (52) 64 (55) - -
History of epilepsy, n (%) 8 (26) 38 (33)
Etiology, n (%)
Acute 16 (52) 70 (60) - -
Encephalitis 12 (35) 13 (11) 4.35 (1.7, 11.09) 0.002*
Intracerebral hemorrhage 1 (3) 31 (27) 0.09 (0.011, 0.69) 0.021
Stroke 1 (3) 4 (3)
Toxic-metabolic 1 (3) 11 (9)
Traumatic brain injury 1 (3) 11 (9)
Progressive 10 (30) 35 (30) - -
Neoplasia 4 (10) 7 (6)
Degenerative 1 (3) 6 (5)
Epilepsy 5 (16) 22 (19)
Idiopathic/cryptogenic 5 (16) 11 (9)
Catastrophic etiology, n (%) 8 (26) NA - -
Length of SE, days2 6.5 (4, 11) NA - -
Type of SE, n (%)
Convulsive SE 23 (74) 66 (57)
NCSE 8 (26) 50 (43)
Data are given as number (n) (%), 1mean (+/- SD), or 2median (IQR). Catastrophic etiology is defined as life expectancy due to underlying etiology less than 90 days.The odds ratio for encephalitis associated with SRSE was 2.91 (1.08, 7.85) after correcting for age. *Age and encephalitis were independently associated with SRSE. NCSE,non-convulsive status epilepticus; SE, status epilepticus; RSE, refractory status epilepticus; SRSE, super-refractory status epilepticus; NA, not applicable.
Pugin et al. Critical Care 2014, 18:R103 Page 3 of 7http://ccforum.com/content/18/3/R103
Single center, retrospec,ve study 147 pa,ents with refractory status epilep,cus NYC, Columbia, USA Risk factors for super refractory status epilep,cus Mul,variate analysis
D. Pugin Crit Care 2014
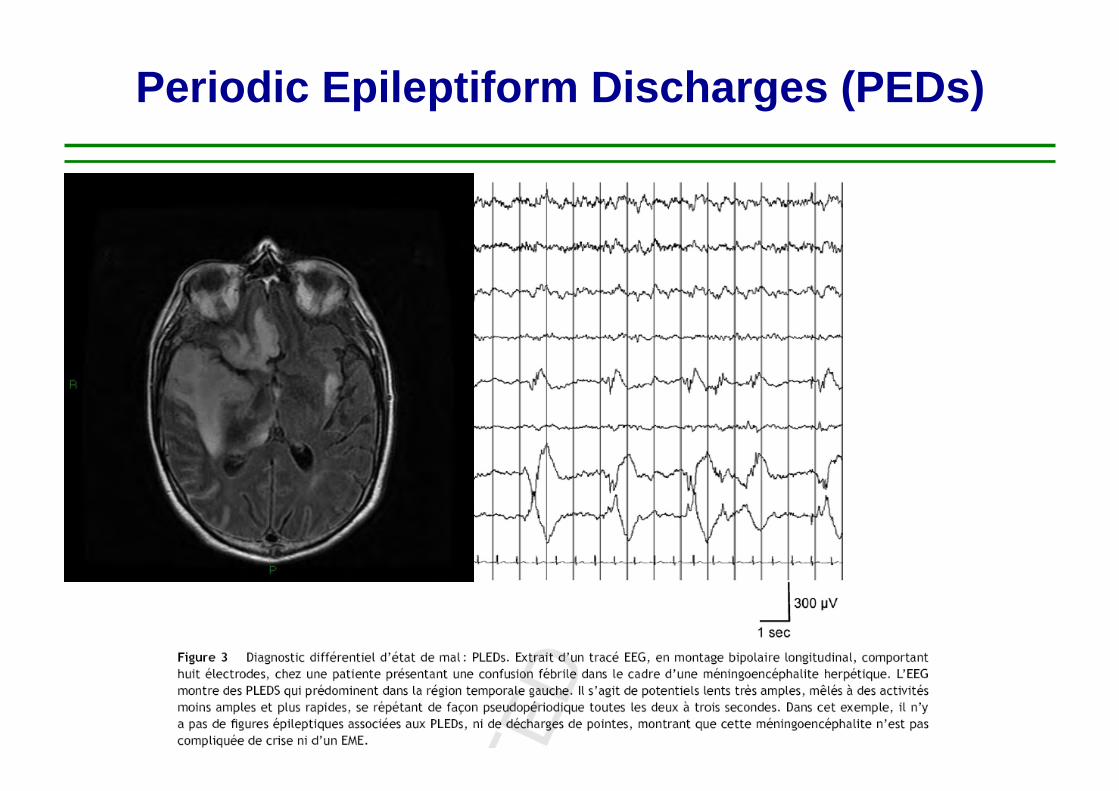
Periodic Epileptiform Discharges (PEDs)

OR p-value Stupor or coma 5.4 0.04 Electrographic seizures, n (%) 5.9 0.02 PEDs (periodic epileptiform discharges)
6.1 0.01
E Carrera, Arch Neurol 2008
42 patients with primary CNS infection Electrographic seizures : 14 (33%) PEDs : 17 (40%)
PREDICTORS OF OUTCOME
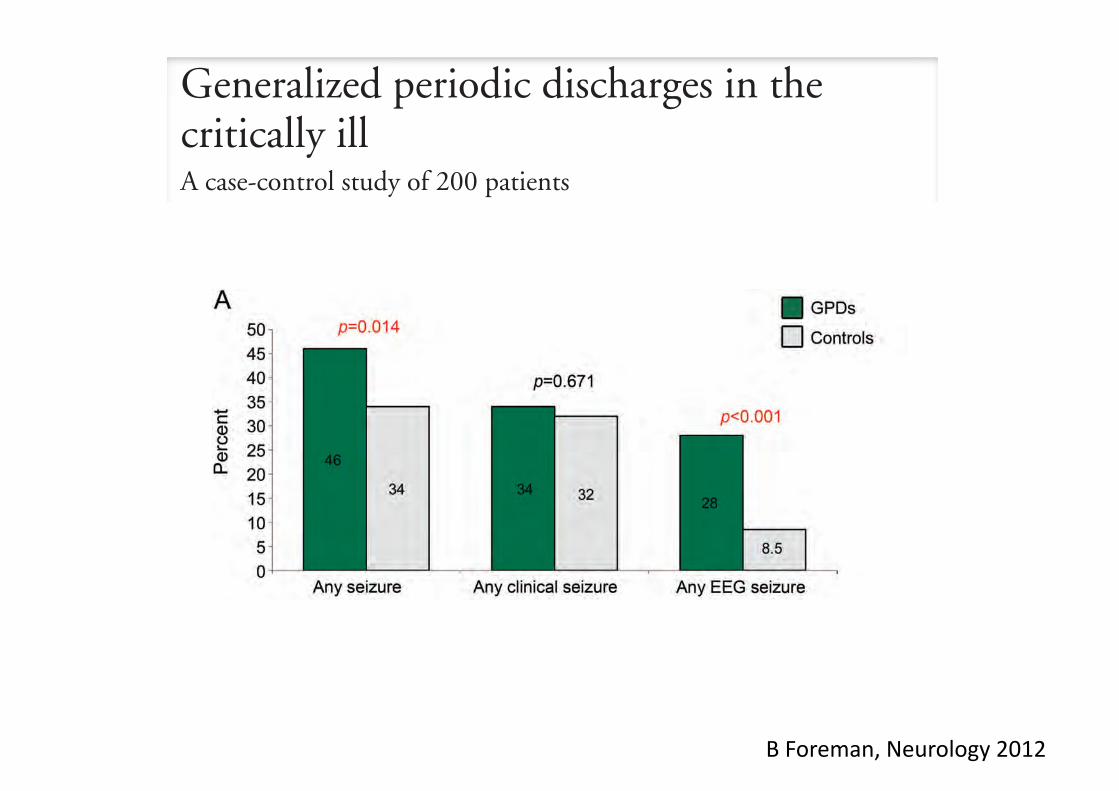
Overall in-hospital mortality for GPD patientswas 41.0% (65.5% with CA and 36.8% withoutCA). A prior study9 documented 64.0% mortality,but anoxia comprised 40.0% of the patients (vs14.5% in our study). Excluding those, 46.7% oftheir patients died, similar to our results. A secondstudy8 documented a mortality of 48.7%, but whiletheir cohort included a similar proportion of CApatients as ours (18.9%), it included 7 with burst-suppression patterns, which we excluded. Burst-suppression is associated with poor outcome,especially after CA, and all 7 patients died. Excludingburst-suppression, mortality in their cohort was
36.7%. One GPD subgroup11 had 29.7% mortalityafter up to 1 year follow-up, lower than ours perhapsbecause 5/17 of these patients had so-called chronic(!8 weeks) GPDs. Again, these prior studies had nocontrol groups. Despite the relatively poor outcomes,when we matched patients for age, category of pre-senting illness, and level of consciousness, there wasno definite independent association between GPDsand outcome, although a small association remainspossible.
The role of underlying illness and its severity indetermining outcome in this cohort of mostly criti-cally ill patients is underscored by multivariate analy-
Figure 2 Generalized periodic discharges (GPDs) and seizures
(A) Comparison of seizure occurrence at any time in patients with GPDs vs controls (%). (B) Comparison of seizures duringcontinuous EEG monitoring (cEEG) in patients with GPDs vs controls (%). (C) Timing of first recorded seizure in patientswith GPDs vs controls (patients with first seizure/total patients consecutively monitored on cEEG). CSE " convulsivestatus epilepticus; CSz " convulsive seizure; NCSE " nonconvulsive status epilepticus; NCSz " nonconvulsive seizure;Sz " seizure.
Neurology 79 November 6, 2012 1955
Generalized periodic discharges in thecritically illA case-control study of 200 patients
Brandon Foreman, MDJan Claassen, MD, PhDKarine Abou Khaled,
MDJeffrey Jirsch, MDDaniel M. AlschulerJohn Wittman, MDRonald G. Emerson,
MDLawrence J. Hirsch, MD
ABSTRACT
Objective: Generalized periodic discharges are increasingly recognized on continuous EEG moni-toring, but their relationship to seizures and prognosis remains unclear.
Methods: All adults with generalized periodic discharges from 1996 to 2006 were matched 1:1to controls by age, etiology, and level of consciousness. Overall, 200 patients with generalizedperiodic discharges were matched to 200 controls.
Results: Mean age was 66 years (range 18–96); 56% were comatose. Presenting illnesses in-cluded acute brain injury (44%), acute systemic illness (38%), cardiac arrest (15%), and epilepsy(3%). A total of 46% of patients with generalized periodic discharges had a seizure during theirhospital stay (almost half were focal), vs 34% of controls (p ! 0.014). Convulsive seizures wereseen in a third of both groups. A total of 27% of patients with generalized periodic discharges hadnonconvulsive seizures, vs 8% of controls (p " 0.001); 22% of patients with generalized periodicdischarges had nonconvulsive status epilepticus, vs 7% of controls (p " 0.001). In both groups,approximately half died or were in a vegetative state, one-third had severe disability, and one-fifthhad moderate to no disability. Excluding cardiac arrest patients, generalized periodic dischargeswere associated with increased mortality on univariate analysis (36.8% vs 26.9%; p ! 0.049).Multivariate predictors of worse outcome were cardiac arrest, coma, nonconvulsive status epilep-ticus, and sepsis, but not generalized periodic discharges.
Conclusion: Generalized periodic discharges were strongly associated with nonconvulsive sei-zures and nonconvulsive status epilepticus. While nonconvulsive status epilepticus was indepen-dently associated with worse outcome, generalized periodic discharges were not after matchingfor age, etiology, and level of consciousness. Neurology® 2012;79:1951–1960
GLOSSARYAED ! antiepileptic drug; BIPLED ! bilateral independent periodic discharge; CA ! cardiac arrest; cEEG ! continuousdigital EEG monitoring; cIV ! continuous IV; CJD ! Creutzfeldt-Jakob disease; CSE ! convulsive status epilepticus; CSz !convulsive; ED ! emergency department; GOS ! Glasgow Outcome Scale; GPD ! generalized periodic discharge; ICU !intensive care unit; NCSE ! nonconvulsive status epilepticus; NCSz ! nonconvulsive; PLED ! periodic lateralized epileptiformdischarge; SE ! status epilepticus; SIRPID ! stimulus-induced rhythmic, periodic, or ictal discharge; SSPE ! subacute sclerosingpanencephalitis; TW ! triphasic-appearing wave.
Although periodic epileptiform discharges have been recognized for over half a century,1,2 theirunderlying pathophysiology and clinical significance remain unclear. Reports have correlatedperiodic epileptiform discharges with seizures,3 and poor outcome in patients with status epi-lepticus,4 intracerebral hemorrhage,5 and subarachnoid hemorrhage.6 Lateralized periodic epi-leptiform discharges (also known as periodic lateralized epileptiform discharges [PLEDs]) haveestablished associations with destructive focal lesions, usually acute, and seizures.7 Generalizedperiodic discharges (GPDs) may result from thalamocortical pathway disruption associatedwith diffuse or multifocal cerebral dysfunction, or even systemic disease, but whether GPDs
From the Comprehensive Epilepsy Center (B.F.), Division of Critical Care Neurology (J.C.), Neurological Institute of New York, ColumbiaUniversity, New York; Hotel-Dieu De France (K.A.K.), Universite Saint-Joseph, Lebanon; Department of Medicine (Division of Neurology) (J.J.),University of Alberta, Edmonton, Canada; Cognitive Neuroscience Division (D.M.A.), New York State Psychiatric Institute, New York; NeurologicalAssociates, Inc. (J.W.), Henrico, VA; Intraoperative Neurophysiologic Monitoring (R.G.E.), Hospital for Special Surgery, New York, NY; andDivision of Epilepsy/EEG (L.J.H.), Yale University School of Medicine, New Haven, CT.
Go to Neurology.org for full disclosures. Disclosures deemed relevant by the authors, if any, are provided at the end of this article.
Editorial, page 1940
Supplemental data atwww.neurology.org
Supplemental Data
Correspondence & reprintrequests to Dr. Foreman:[email protected]
© 2012 American Academy of Neurology 1951
B Foreman, Neurology 2012

ICU management of acute encephalitis
KEYPOINTS
• Encephalitis patients frequently require ICU admission
• Prognostic factors and the impact of secondary complications on outcome
• Understanding brain dysfunction
• Care in the ICU Cerebral oedema Seizures / status epilepticus Systemic complications
• Specific causes requiring anti-inflammatory therapy
• Conclusions

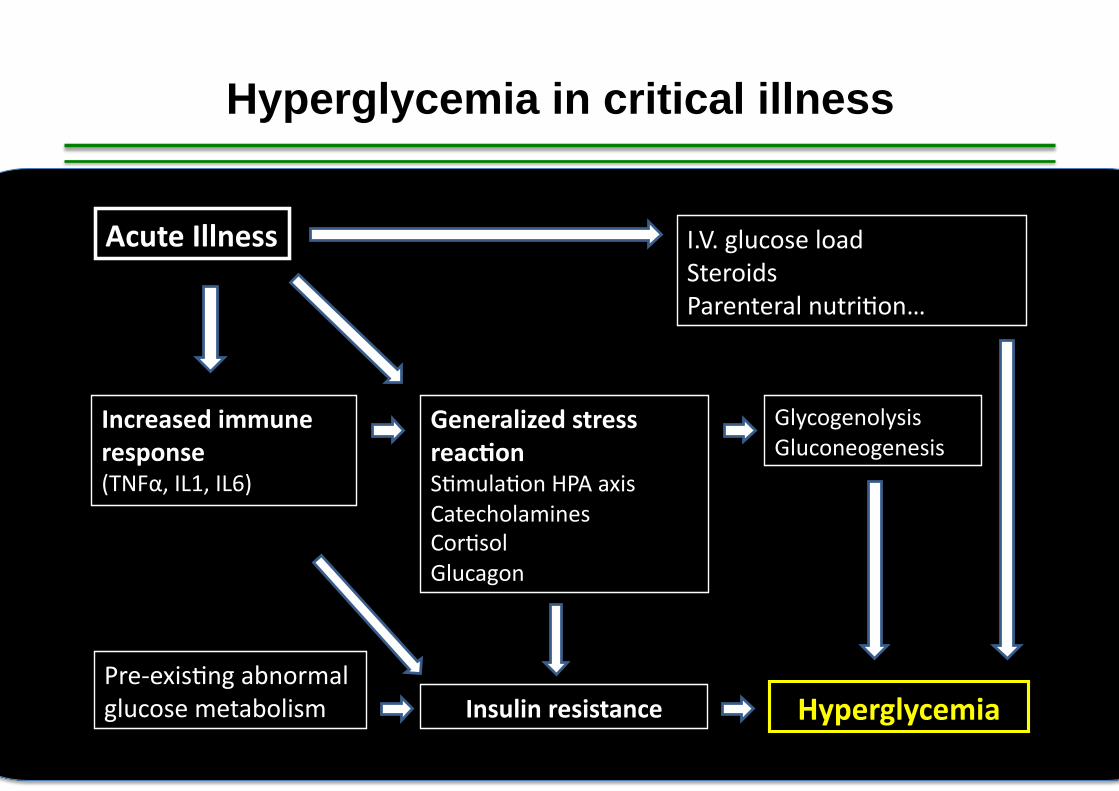
Acute Illness
Pre-‐exis,ng abnormal glucose metabolism
Increased immune response (TNFα, IL1, IL6)
Generalized stress reac)on S,mula,on HPA axis Catecholamines Cor,sol Glucagon
Glycogenolysis Gluconeogenesis
Hyperglycemia Insulin resistance
I.V. glucose load Steroids Parenteral nutri,on…
Hyperglycemia in critical illness

Wild type mice General anesthesia Jugular vein catheteriza,on Sepsis induced by peritoni,s
HYPERGLYCEMIA > 150 mg/dL
NORMOGLYCEMIA 80-110 mg/dL
Sacrifice day 5
HIPPOCAMPUS FRONTAL CORTEX
Broad spectrum antibiotics IV fluid resuscitation
Mouse model of polymicrobial sepsis
CAECAL LIGATION AND PUNCTURE

0
2
4
6
8
10
0
2
4
6
8
16
Neu
rona
l dam
age
(normalized
for controls)
p=0.13
p=0.48
p=0.01
p=0.04
p=0.06 p=0.04
Glucose and neuronal damage
p=0.29
p=0.29
HIPPOCAMPUS FRONTAL CORTEX
Control Moderate hyperglycemia Normoglycemia
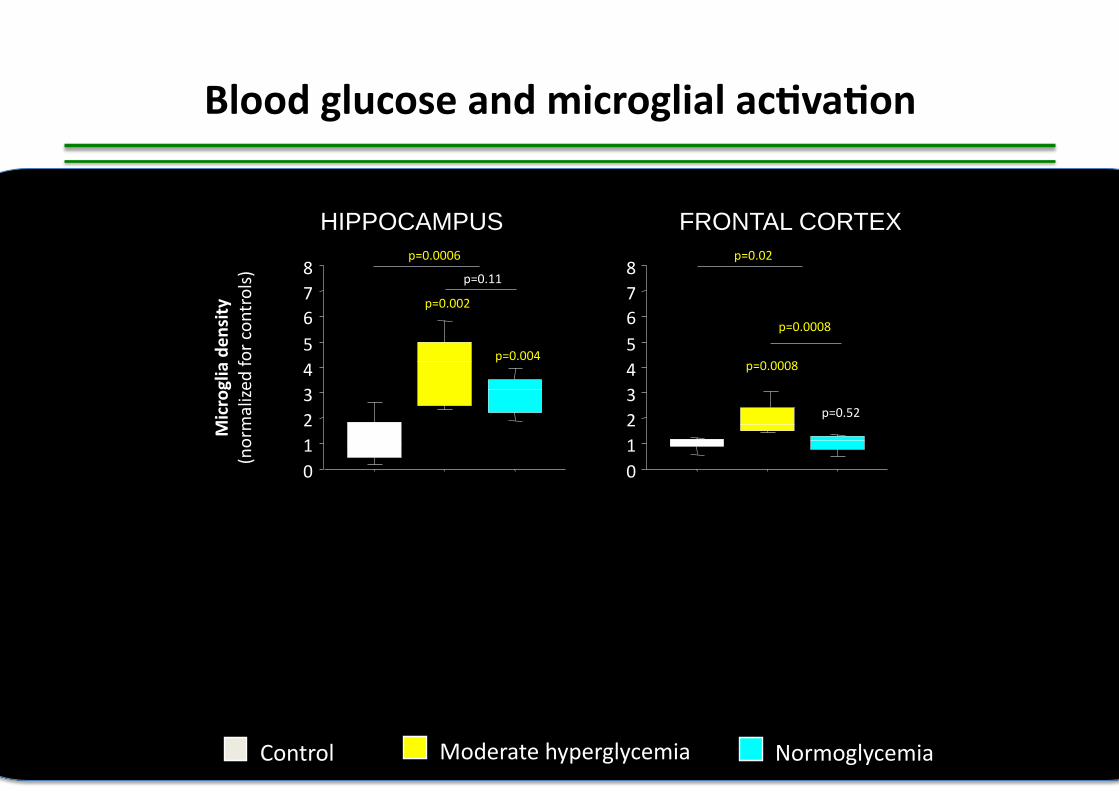
0 1 2 3 4 5 6 7 8
0 1 2 3 4 5 6 7 8
Microglia den
sity
(normalized
for controls)
p=0.002
p=0.004
p=0.11
p=0.0008
p=0.52
p=0.0008
p=0.0006 p=0.02
Blood glucose and microglial ac)va)on
Control Moderate hyperglycemia Normoglycemia
HIPPOCAMPUS FRONTAL CORTEX

SEPSIS (CLP)
SHAM SURGERY (anesthesia, skin incision)
SACRIFICE AT 6, 12 or 24 H NEURONAL DAMAGE
CLINICAL PARAMETERS before sacrifice (locomotor activity, body T°, sickness behavior score)
Frontal Cortex Hippocampus
SEPSIS MODEL (Peritonitis, CLP) Severe clinical phenotype Multiple caecal punctures No antibiotics Subcutaneous rehydration
Early microglial changes during sepsis

0
0.5
1
1.5
2
H06 H12 H24
§ § § § * §
TOTA
L GFP FLU
ORE
SCEN
CE
STANDARD
IZED
FOR CO
NTR
OLS
0
0.2
0.4
0.6
0.8
1
1.2
1.4
1.6
H06 H12 H24 N OF SECO
NDARY
RAMIFICAT
IONS
STANDARD
IZED
FOR CO
NTR
OLS
§ § § § *
Microglial changes in sepsis
§ : p<0.05 vs. healthy controls * : p<0.05 vs. sham SHAM SEPSIS
GFP Laminin

ICU management of acute encephalitis
KEYPOINTS
• Encephalitis patients frequently require ICU admission
• Prognostic factors and the impact of secondary complications on outcome
• Understanding brain dysfunction
• Care in the ICU Cerebral oedema Seizures / status epilepticus Systemic complications
• Specific causes requiring anti-inflammatory therapy
• Conclusions
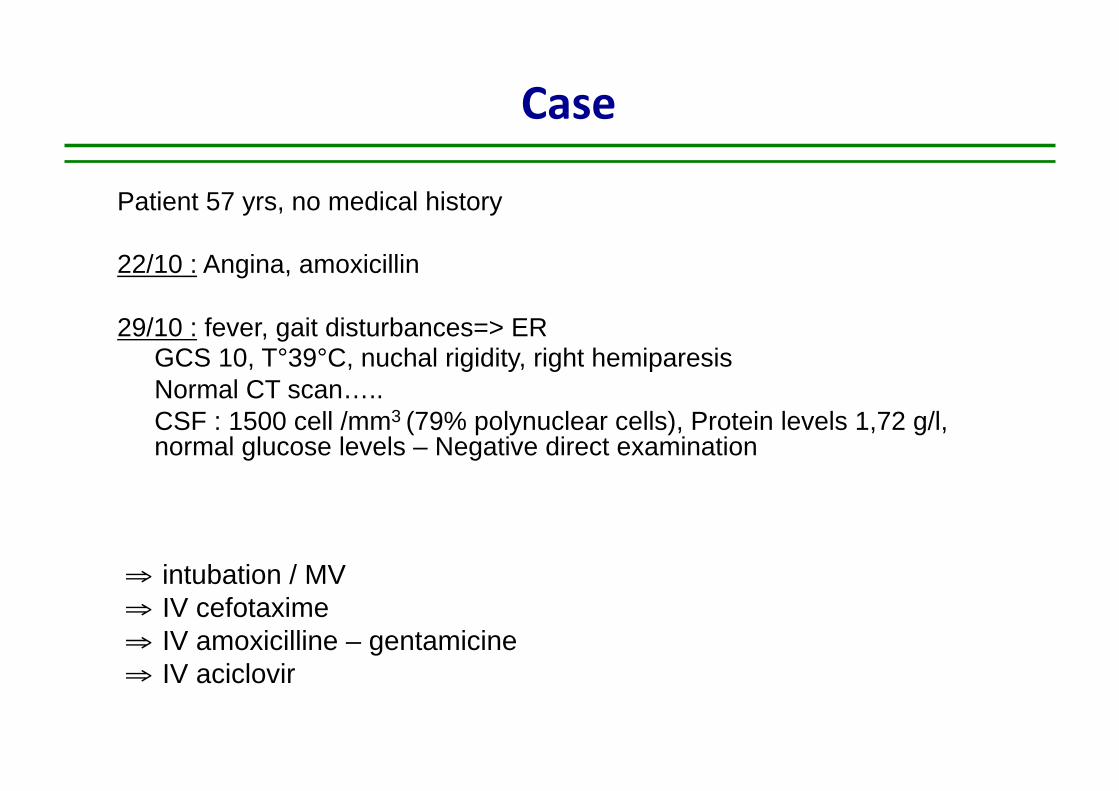
Case
Patient 57 yrs, no medical history
22/10 : Angina, amoxicillin
29/10 : fever, gait disturbances=> ER GCS 10, T°39°C, nuchal rigidity, right hemiparesis Normal CT scan….. CSF : 1500 cell /mm3 (79% polynuclear cells), Protein levels 1,72 g/l, normal glucose levels – Negative direct examination
⇒ intubation / MV ⇒ IV cefotaxime ⇒ IV amoxicilline – gentamicine ⇒ IV aciclovir


FLAIR T1 gadolinium

Acute disseminated encephalomyeli)s (ADEM)

Pathophysiology
MOLECULAR MIMICRY « viral » infec,on
Pathogene = structure homology with myelin components MBP (Myelin Basic Protein)
MOG (Myelin Oligodendrocyte Protein)
PRIMITIVE CNS INFECTION Neurotropic pathogen
BBB disrup,on CNS Ab release in peripheral circula,on
Auto-‐immune response against CNS components
?
Tunkel, Clinical Infec,ous Diseases 2007

Perivenous sleeve of inflammation

NP Young, Brain 2010
-‐ Perivenous distribu,on -‐ White mamer lesions -‐ Cellular infiltrate -‐ Demyelina,on -‐ Axons and arteries spared -‐ No evidence of previous demyelina,on
Perivenous demyelination +/- Confluent demyelination

NP Young, Brain 2010
Immunohistochemistry for KiM1P, 20x
« Depressed level of consciousness is a more specific clinical criterion for pathologically confirmed ADEM than encephalopathy, which overdiagnosed ADEM among MS patients. »
A distinct neuropathological pattern (60% patients) may be the correlate of depressed level of consciousness in ADEM
Cor)cal microglial ac)va)on without cor)cal demyelina)on

ADEM in the ICU
R Sonneville, Intensive Care Med 2007

ADEM Although not fully assessed in randomized, placebo-‐controlled trials high-‐dose intravenous cor)costeroids (methylprednisolone, 1 g IV/day, 3–5 days) are generally recommended for ADEM
Reports of successful treatment with PLEX have also been documented, although no data from randomized trials are available. PLEX should be considered in pa)ents who respond poorly to cor)costeroids
The use of intravenous immunoglobulin has been reported for the treatment of ADEM. This approach may be considered in pa,ents who have not responded to cor,costeroids or PLEX
Tunkel CID 2008
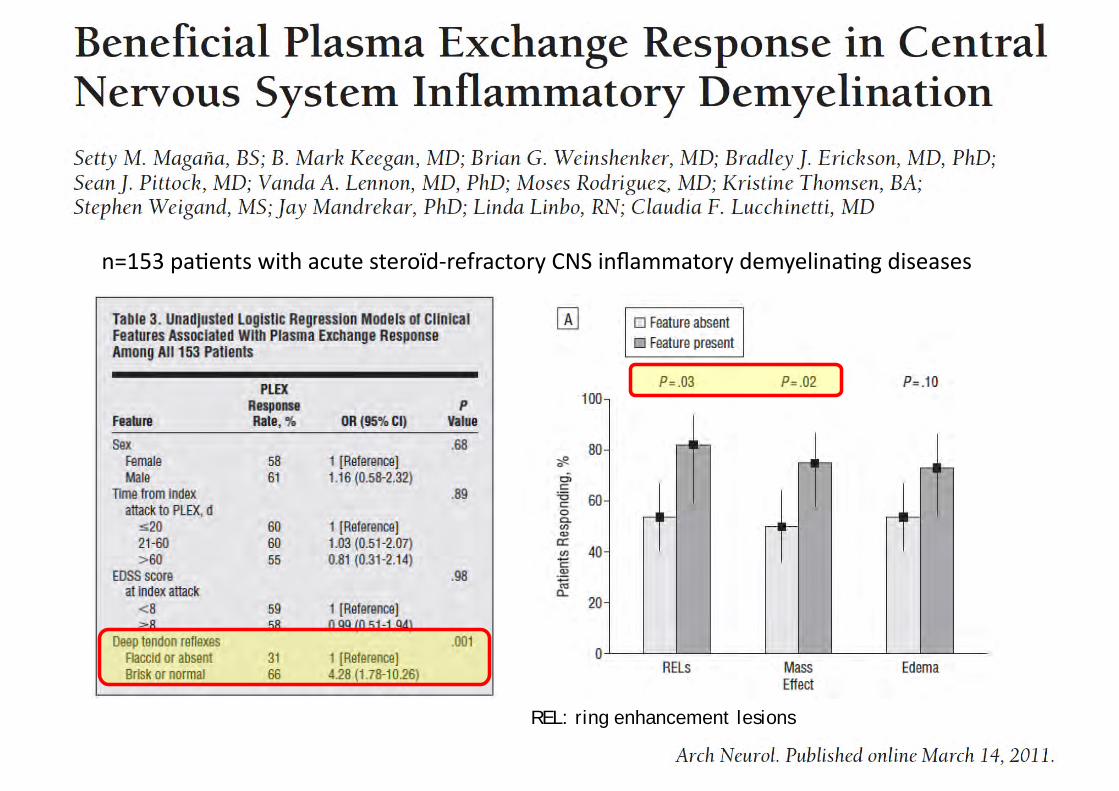
REL: ring enhancement lesions
n=153 pa,ents with acute steroïd-‐refractory CNS inflammatory demyelina,ng diseases

100 patients
Dalmau Lancet Neurol 2008

Articles
www.thelancet.com/neurology Vol 7 December 2008 1093
access to all the data in the study and had fi nal responsibility for the decision to submit for publication.
ResultsTable 1 summarises the clinical information. 86 patients who could be assessed had headache, low-grade fever, or a non-specifi c viral-like illness within 2 weeks before hospital admission. 77 patients presented with prominent psychiatric symptoms, including anxiety, agitation, bizarre behaviour, delusional or paranoid thoughts, and visual or auditory hallucinations. 23 presented with short-term memory loss or seizures alone or associated with psychiatric manifestations.
During the fi rst 3 weeks of symptom presentation, 76 patients had seizures. 88 patients developed decreased consciousness, progressing to a catatonic-like state, with periods of akinesis alternating with agitation, and diminished or paradoxical responses to stimuli (eg, no response to pain but resisting eye opening). Some patients mumbled unintelligible words or had echolalia. Eye contact or visual tracking was absent or inconsistent. During this clinical stage, large proportions of patients developed dyskinesias, autonomic instability, and central hypoventilation (median time of ventilatory support,
8 weeks; range 2–40 weeks). Orofacial dyskinesias were the most common; these included grimacing, masticatory-like movements, and forceful jaw opening and closing, resulting in lip and tongue injuries or broken teeth. 37 patients had cardiac dysrhythmias, including tachycardia or bradycardia, with prolonged pauses in seven patients; four needed pacemakers. 52 patients had dyskinesias,
Patients
Women and girls 91
Median age, range (years) 23, 5–76
Prodromal symptoms (information available for 84 patients) 72
Symptom presentation
Psychiatric (fi rst seen by psychiatrist) 77
Neuropsychiatric (fi rst seen by neurologists) 23
Seizures
Any type 76
Generalised tonic-clonic 45
Partial complex 10
Other* 30
Dyskinesias and movement disorders
Any type 86
Orofacial 55
Choreoathetoid and complex movements with extremities, abdomen or pelvis
47
Abnormal postures (dystonic, extension), muscle rigidity, or increased tone
47
Other† 25
Autonomic instability‡ 69
Central hypoventilation 66
Data are numbers unless otherwise stated. *Eight secondary generalised seizures, six refractory status epilepticus, seven focal motor, seven not classifi ed, two epilepsia partialis continua. †Nine myoclonus, eight abnormal ocular movements (eye deviation, nystagmus or ocular dipping), fi ve tremor, three ballismus. ‡37 cardiac dysrhythmia (16 tachycardia, seven bradycardia, 14 both); 36 dysthermia (27 hyperthermia, three hypothermia, six both); 21 blood pressure instability (12 hypertension, three hypotension, six both); 20 hyperhydrosis; 18 sialorrhoea; six hyperpnoea; four adynamic ileus.
Table !: Characteristics and clinical features
Patients
EEG (information for 92 patients)
Total with abnormal fi ndings 92
Slow activity* 71
Epileptic activity 21
Brain MRI
Total with abnormal fi ndings 55
Medial temporal lobes 22
Cerebral cortex 17
Cerebellum 6
Brainstem 6
Basal ganglia 5
Contrast enhancement in cortex, meninges, basal ganglia 14
Other† 8
CSF
Total with abnormal fi ndings 95
Lymphocytic pleocytosis‡ 91
Increased protein concentration§ 32
Oligoclonal bands positive (information for 39 patients) 26
Tumour (information for 98 patients)
All 58
Women
Mature teratoma of the ovary 35
Inmature teratoma of the ovary 14
Radiologically demonstrated teratoma 4
Other¶ 3
Men
Immature teratoma of the testis 1
Small-cell lung cancer 1
Treatment
Tumour resection 51
Immunotherapy 92
Corticosteroids 76
Intravenous immunoglobulin 62
Plasma exchange 34
Rituximab 10
Cyclophosphamide 9
Azathioprine 1
Other|| 10
Only supportive care 2
*EEG delta or theta activity, generalized or in frontotemporal regions. †Other areas of abnormal signal in MRI FLAIR/T2: four corpus callosum, two hypothalamus, one periventricular, one multifocal white-matter change. ‡Median 32 cells/!L, range 5–480 cells/!L. §Median 67 mg/dL, range 49–213 mg/dL. ¶One sex-cord stromal tumour, one neuroendocrine tumour, one teratoma of the mediastinum. ||Seven chemotherapy, three electroconvulsive therapy.
Table ": Ancillary tests and treatment
Findings of 100 pts with encephalitis and NR1-NR2 antibodies
MRI Normal in 45% of patients
Dalmau Lancet Neurol 2008

PELVIS MRI

Lancet Neurology 2011

ICU management of acute encephalitis
KEYPOINTS
• Encephalitis patients frequently require ICU admission
• Prognostic factors and the impact of secondary complications on outcome
• Understanding brain dysfunction
• Care in the ICU Cerebral oedema Seizures / status epilepticus Systemic complications
• Specific causes requiring anti-inflammatory therapy
• Conclusions

• Patients with acute encephalitis and altered level of consciousness may benefit from early ICU admission
• Understanding the mechanism of brain dysfunction +++
• Prevention and control of cerebral edema represents a major therapeutic goal
• Other complications that may worsen brain inflammation +++ – Seizures – Systemic complications
• Fever • Hyperglycemia • Sepsis
Conclusions

White Light, Jackson Pollock 1954