acurex draft final report fr-82-104/ee study of visible
TRANSCRIPT

Acurex Draft Final Report FR-82-104/EE
STUDY OF VISIBLE EMISSIONS FROM SHIPS WITH STEAM BOILERS
January 1982
Acurex Project 6107
Contract A9-121-30
For
State of California Air Resources Board Research Division
P.O. Box 2815 Sacramento, California 95812
By
A. Walter Wyss, Henry J. Modetz Acurex Corporation
Energy &Environmental Division 485 Clyde Avenue
Mountain View, California 94042

ACKNOWLEDGMENT
Acurex Corporation wishes to acknowledge the technical assistance
provided throughout the course of this study by Mr. Fred H. Merrick and Mr. Grant J. Furgerson of Morris Guralnick Associates, Inc., San Francisco, California, and Mr. Gary J. Baham of The Baham Corporation, Columbia, Maryland. This report was submitted in fulfillment of contract
number A9-121-30 by Acurex Corporation under the sponsorship of the California Air Resources Board. Work was completed as of January 1982.
iii

DISCLAIMER
The statements and conclusions in this report are those of the
Contractor and not necessarily those of the California Air Resources
Board. The mention of commercial products, their source or their use in
connection with material reported herein is not to be construed as either an actual or implied endorsement of such products.
iv

TABLE OF CONTENTS
Section Page
1 INTRODUCTION ....•. 1-1
2 BACKGROUND INFORMATION 2-l
2. 1 PORT ACTIVITIES .. 2-l 2.2 VESSEL TRAFFIC ... 2-3 2.3 SHIPBOARD COMBUSTION •. 2-5 2.4 VISIBLE EMISSION REGULATIONS. 2-13
3 NORMAL AND EXEMPTED MODE OPERATING PRODEDURES 3-l
3. 1 NORMAL MODES OF OPERATION . . 3- 1 3.2 EXEMPTED MODES OF OPERATION . 3-5
3.2.l Maneuvering to Avoid Hazards • . 3-5 3.2.2 Emergency Boiler Shutdowns . . . . . 3-6 3.2.3 Government Testing. • • • . • • • • • • 3-7 3.2.4 Cold-Boiler Light Offs . . • • • . . . 3-9 3.2.5 Operations Required to Dry Wet or Green
Refractory. • . • • . . • • . • . . . • . . . . 3-13
4 PARTICULATE EMISSIONS FROM MARINE OPERATIONS 4-1
4. 1 EMISSION INVENTORY INPUT DATA: NORMAL OPERATING MODES • . • • 4-2
4.1.1 Ship Visits ...•..•• 4-2 4.1.2 Vessel Powerplant Size .•••.••• 4-4 4. 1.3 Maneuvering and At-Berth Time .•.• 4-4 4.1.4 Engine Load Levels •..•. 4-7 4. 1.5 Fuel Consumption Factors .• 4-11 4.1 .6 Particulate Emission Factors • 4-16
4.2 EMISSION INVENTORY INPUT DATA: EXEMPTED OPERATING MODES .•.•••• 4-18
4.3 EMISSION INVENTORY RESULTS .• 4-24
4.3.1 Normal Operating Mode Emissions •. 4-24 4.3.2 Exempted Operating Mode Emissions 4-27
4.4 COMPARISONS OF MARINE EMISSIONS WITH OTHER SOURCE CATEGORY EMISSIONS .• 4-29
5 VISIBLE EMISSION CONTROL OPTIONS •.•...... 5-1
5. 1 APPROPRIATENESS FOR CONTROLS . . . • . . . 5- 1 5.2 ABATEMENT STRATEGIES FOR BOILER LIGHT OFFS . 5-3
V

TABLE OF CONTENTS (Canel uded)
Sectfon
5.2.1 Control Option Identification and Preliminary Screening •.•... 5-4
5.2.2 Increased Operator Awareness .... 5-12 5.2.3 Distillate Fuel Use .••..... 5-21
6 REGULATORY RECOMMENDATIONS AND FUTLRE TRENDS 6-1
6.1 REGULATORY RECOMMENDATIONS . • . . . . . . 6-1 6.2 TRENDS IN MARINE OPERATIONS AND PRACTICES 6-6
APPENDIX A -- NORMAL MODE EMISSION CALCULATIONS. A-1 APPENDIX B -- EMEMPTED MODE EMISSION CALCULATIONS. B-1 APPENDIX C -- VISIBLE EMISSIONS OBSERVATION REPORTS C-1
vi

LIST OF ILLUSTRATIONS
Figure Page
2-1 Typical Fuel-Oil Service System ..•. 2-10
2-2 Visible Emission Violations -- Bay Area Air Quality Management District ••..•.••.•• 2-16
3- 1 Boiler Load -- Excess Air Characteristics for Typical Marine Steam Generating Plant • •
a . ...• 3-4
4-1 Specific Fuel Consumption for Steam-Powered Merchant Vessels .•.•.•....•...•• 4-12
4-2 Marine Steam Plant All-Purpose Specific Fuel Consumption ••••.•••••. 4-14
4-3 Main Diesel Consumption
Plant All-Purpose Specific Fuel .•.•.••.••••.. 4-15
5-1 Sample of Visible Emission Regulation Notice 5-16
Vii
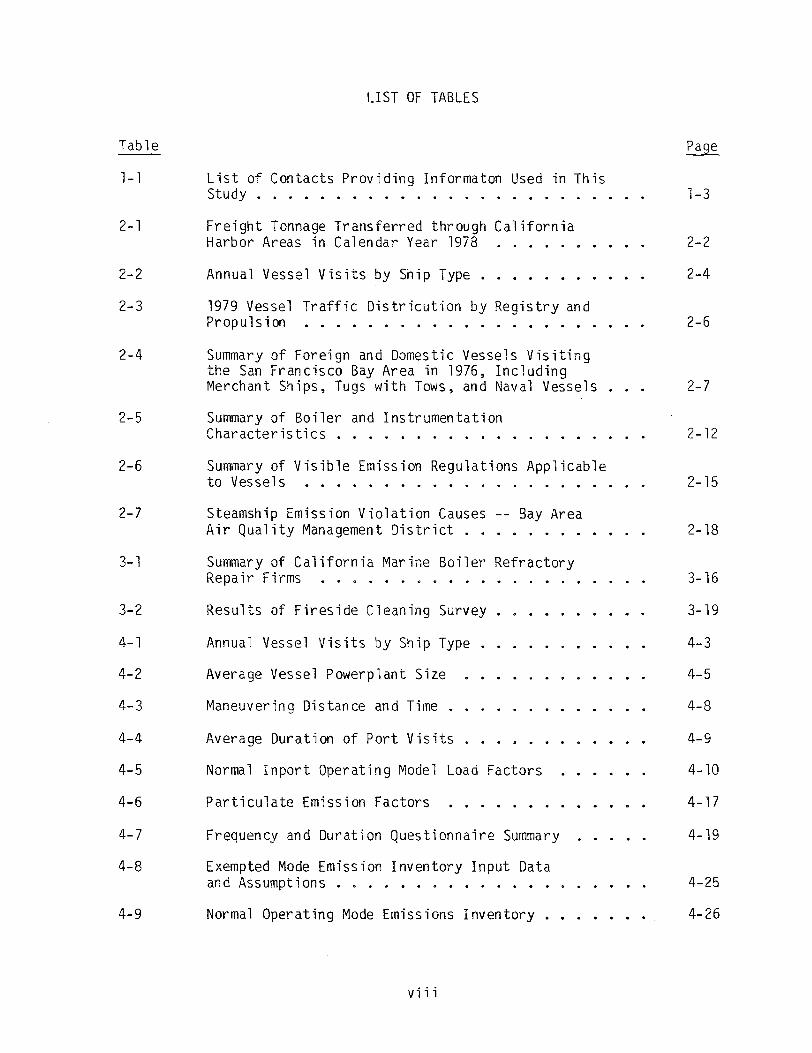
LIST OF TABLES
Table
1-1
2-1
2-2
2-3
2-4
2-5
2-6
2-7
3-l
3-2
4-1
4-2
4-3
4-4
4-5
4-6
4-7
4-8
4-9
List of Contacts Providing Informaton Used in This Study . . . . . . . • . • . . . . . . . . . . . 1-3
Freight Tonnage Transferred through California Harbor Areas in Calendar Year 1978 .... 2-2
Annual Vessel Visits by Ship Type . 2-4
1979 Vessel Traffic Districution by Registry and Propulsion . . . . . . . . • • . ...• 2-6
Summary of Foreign and Domestic Vessels Visiting the San Francisco Bay Area in 1976, Including Merchant Ships, Tugs with Tows, and Naval Vessels 2-7
Summary of Boiler and Instrumentation Characteristics .......... . 2-12
Summary of Visible Emission Regulations Applicable to Vessels • . . • . . . . . . . . . ... 2-15
Steamship Emission Violation Causes -- Bay Area Air Quality Management District .....•.. 2-18
Summary of California Marine Boiler Refractory Repair Firms ........•. 3-16
Results of Fireside Cleaning Survey 3- 19
Annual Vessel Visits by Ship Type .. 4-3
Average Vessel Powerplant Size 4-5
Maneuvering Distance and Time .• 4-8
Average Duration of Port Visits . 4-9
Normal Inport Operating Model Load Factors 4-10
Particulate Emission Factors 4-17
Frequency and Duration Questionnaire Summary 4-19
Exempted Mode Emission Inventory Input Data and Assumptions •...........• 4-25
Normal Operating Mode Emissions Inventory .•• 4-26
Viii

LIST OF TABLES (Concluded)
Table Page
4-10 Exempted Mode Emissions Inventory •..••.•. 4-28
4- 11 Comparison of Ship Particulate Emissions to Other Source Categories for the Bay Area Air Quality Management District •.....••....... 4-30
4-12 Comparison of Ship Particulate Emissions to Other Source Categories for the South Coast Air QualityManagement District •.••..•.••.• 4-30
4-13 Comparison of Ship Particulate Emissions to Other Source Categories for San Diego County ••••. 4-31
4-14 Comparison of Ship Particulate Emissons Source Categories for Ventura County
to Other 4-31
4-15 Comparison of Ship Particulate Emissions to Other Source Categories for San Luis Obispo County ....• 4-32
5- l Preliminary Identification of Potential Control Options for Reducing visible Emissions or Their Impact During Boiler Light Off .•... 5-5
5-2 Summary of Boiler Light-Off Control Options •. 5-13
5-3 Summary of Boiler Light-Off Visible Emission Observation • • •••••••• 5-18
5-4 Evaluation of Increased Operator Awareness Options 5-22
5-5 Analyses of Fuel Oils • 5-26
5-6 Average Fuel Oil Prices for West Coast Ports 5-28
6-l Impacts of Visible Emission Control Options .. 6-4
ix

SECTION l
INTRODUCTION
Visible emissions from any source are restricted by California law
from exceeding specified opacity standards as cited in the California Health and Safety Code, unless exempted. Vessels with steam boilers
operating in coastal and inland waterways are granted specific exemptions in Section 41704 of the Code. Unlimited exemptions are applicable to steam boiler operations during emergency boiler shutdowns for safety reasons, safety and operational tests required by government agencies, and
maneuvering required to avoid hazards. In addition, operations necessary to light off a cold boiler and to dry wet or green refractory materials are exempted until January 1, 1984 as long as they do not generate visible emissions which exceed Ringelmann 2 for 15 min or more in any hour. Prior
to the enactment of the exemptions, emissions generated as a result of these latter two operations were permitted to exceed Ringelmann 2 for only 3 min/hr.
The bill which amended the Health and Safety Code to allow for the
exemptions (SB 2198) also provided that a study be conducted in cooperation with local air pollution control districts and the maritime
industry to determine if vessels using steam boilers can be brought into compliance with existing visible emissions standards by January 1, 1984.
The objectives of this study were to survey ship operations relevant to the visible emission exemption conditions noted above, to investigate
possible modifications to equipment and procedures which will reduce visible emissions, and to develop recommendations for a compliance
schedule to reduce such emissions. The study was to consider the age and physical condition of shipping vessels, safety and operational
requirements, and technological feasibility. The following sections of
1-1

this document describe the findings of this study and present
documentation and recommendations relative to the visible emission
exempt i ans.
In order to meet the objectives of this study, the following tasks
were performed:
• Normal and exempted operating modes were surveyed to identify the sources and periods of excess emissions
• The extent, frequency, duration, causes and quantitative impact
of emissions were characterized
• Modifications to equipment and operating procedures to reduce
visible emissions were investigated
• Regulatory recommendations are suggested
Study efforts were primarily focused upon vessels using steam boilers
since these vessels are granted the exemptions, however particulate emissions from both steam- and motor-powered vessels during normal modes
of operation were quantified.
In addition to this introductory section, this report is subdivided
into five sections followed by the appendixes. A discussion of background information is contained in Section 2 including brief reviews of
California port activities, vessel traffic, shipboard combustion and
visible emission regulations. Section 3 presents a review of both normal
and exempted modes of operation and describes the reasons why steam boiler
visible emissions are generated. Section 4 describes the methodology and
results produced in an effort to establish the quantitative extent of
particulate matter emitted from vessels while in California ports.
Visible emission control options for steam boilers are identified and evaluated in section 5. Regulatory recommendations and a discussion of
future trends in the maritime industry follow in section 6.
Throughout the course of this study, numerous contacts were
consulted. A listing of those contacts providing information which was used in this study is presented in table 1-l.
1-2

Table l-1. List of Contacts Providing Information Used in This Study
------------------a-----------"T-----------.
Contact, Affiliation and Address Information Phone Number
Gary Baham Consultant for develop (301) 596-3252 The Baham Corporation ment of emission in5538 Coltsfood Court ventory technique Columbia, MD 21045
Fred Merrick Consultant for defining (415) 543-8650 Morris Guralnick Associates, Inc. operating modes and 620 Folsom Street establishing control San Francisco, CA 94107 options
Donald Reardon Vessel traffic (415) 322-4020 Marine Consultant statistics 1760 Bay Laurel Drive Menlo Park, CA 94025
Philip Steinberg Exempted mode (415) 986-7900 Pacific Merchant Shipping Assn. frequency and duration 635 Sacramento Street, Suite 300 information San Francisco, CA 94011
Lt. Commander Jim H. Oliver U.S. Coast Guard (415) 556-1380 Commercial Vessel Safety regulations and test Marine Safety Division procedures 12th Coast Guard District 630 Sansome Street San Fr an c is co , CA 94 126
Everett Catlin Exempted mode opera (415) 421-3484 Richard Haggart tions, equipment Babcock & Wilcox characteristics, One California Street control options and San Francisco, CA 94111 their feasibility
Mathew Winkler Sh i p em i s s i on (203) 767-0937 Seaworthy Engine Systems, Inc. factors 36 Ma in Street Essex, CT 06426
1-3

Table 1-1. Continued
Contact, Affiliation and Address
Steve Sabo Combustion Engineering C-E Marine Power SystemsWinsor, CT 06095
H. A. Wi 11 i ams Electromotive Division General Motors La Grange, IL 60525
Charles Hare Quentin Baker Southwest Research Institute P.O. Drawer 28510 San Antonio, TX 78284
Dick Grams Babcox & Wilcox North Canton, OH
Tom Schroppe Foster Wheeler Boiler Corporation110 South Orange Avenue
I Livingston, NJ 07039
Paul Fein R. H. Wager Company, Inc. Passaic Avenue Chatham, NJ 07928
R. A. LongoThe Engineer Company Foot of Peeple Place P.O. Box 39 South Plainfield, NJ 07080
Pete Greco Coen CorporationFuel Handling Division P.O. Box 232 Rockaway, NJ 07866
Inforrnati on
Exempted mode operations, equipment characteristics, control options and their feasibility
Diesel engine emission factors
Diesel engineemission factors
Disti 11 ate fuel use in marine boilers for light off
Distillate fuel use, operating procedures,equipment characteristics
Exhaust gas analyzers
Di st i 11 ate f ue 1 delivery systems
Disti 11 ate fuel delivery systems
Phone Number
(203) 688-1911
(312) 387-6000
(512) 684-5111
(216) 494-7610
(201) 533-3216
(201) 635-9200
(201) 755-2500
(201) 625-4830
1-4

Table 1-1. Continued
Contact, Affiliation and Address Information Ph one Number
Marine burner designNorman Buckland (214) 233-1871 Forney Engineering P. 0. Box 189 Addison, TX 75001
Marine refractoryDick Moore (415) 861-0101 Dee Engineering practices 44 Mississippi Street San Franc is co, CA 94107
Commercial and navalLou Janik (415) 523-0321 Todd Shipyards light-off procedures2900 Main Street Alameda, CA 94501
Bal Wallace Nava 1 1 i ght-off (301) 267-2674 David W. Taylor Naval Ship procedures
Research & Development Center Department of Navy Annapolis Laboratory Annapolis, MD 21402
C. D. Davies Exempted mode frequency (215) 928-2800 Keystone Shipping Co. and duration data 313 Chestnut Street Philadelphia, PA 19106
Frank Dipolito Exempted mode frequency (215) 864-1300 Interocean Management Corporation and duration data Three ParkwayPhiladelphia, PA 19102
M. Andersen Exempted mode frequency (212) 883-4242 Mobil Oil Corporation and duration data Marine Transportation Department 150 East 42nd Street New York, N. Y. 10017
,___________________.______________.___________,
1-5

Table l-1. Continued
Contact, Affiliation and Address Information Phone Number
Michael S. Foster Chevron Shipping Company 555 Market Street San Francisco, CA 94119
Exempted mode frequency and duration data
(415) 894-7700
Karen Sp arks Arco Marine, Inc. 515 South Flower Street Box 2679 -- T.A. Los Angeles, CA 90051
Exempted mode frequency and duration data
(213) 486-3511
W. J. Horn Exxon Company, U.S.A. Post Office Box 1512 Houston, TX 77001
Exempted mode frequency and duration data
(713) 656-1401
Felix S. Childs Farr e 11 Lin es , Inc • One Market Plaza San Francisco, CA 94105
Exempted mode frequency and duration data
(415) 777-3300
Philip Herndon American President Lines, Ltd. 1950 Franklin Street Oakland, CA 94612
Exempted mode frequency and duration data
(415) 271-8705
L. J. Castro Lykes Bros. Steamship Co., 300 Polydras Street New Orleans, LA 70130
Inc. Exempted mode frequency and duration data
(504) 523-6611
J. C. Gos l in g Matson Navigation Company 333 Market Street San Francisco, CA 94105
Exempted mode frequency and duration data
(415) 957-4577
Bill Lovelace Harry Metzger Russ Tate Air Resources Board P.O. Box 2815 Sacramento, CA 95812
Emission inventory data, ship equipment and traffic information
(916) 322-2739
1-6

Table 1-1. Continued
Contact, Affiliation and Address Information Phone Number
Earl Halberg South Coast Air Quality
Management District 9150 Flair Drive E 1 Monte, CA 91731
John Kovac Air Pollution Control District County of San Diego 9150 Chesapeake Drive San Diego, CA 92123
Jack Bean Pat Samson Bay Area Air Quality
Management District 939 Ell is Street San Francisco, CA 94109
Bi 11 Stonehouse San Diego Port District 3165 Pacific Highway San Diego, CA 92122
32nd Street Naval Station Waterfront Operations San Diego, CA 92112
Bruce Katayama Andy Decao Air Pollution Control District County of Ventura 800 South Victoria Avenue Ventura, CA 93009
Emission inventory data, visible emission regulations
Emission inventory data, visible emission regulations
Emission inventory data, visible emission violation data, visible emission regulations
Ship visit statistics
Ship visit statistics
Ship visit statistics, em i s s i on i nv en tory data, visible emission regulations
(213 ) 572- 6319
(714) 565-5901
(415) 777-6000
(714) 291-3900
(714) 235-1432
(805) 654-2667
1-7

Table 1-1. Continued
Contact, Affiliation and Address
Robert Walter Department of Transportation Research & Special Programs Adm. Kendall Square Cambridge, MA 02142
Washington State Department of Ecology
Olympia, WA
Michael Wurl Puget Sound Air Pollution
Control District Seattle, WA
Department of Environmental Quality
Port1an d , OR
Marine Exchange of the San Francisco Bay Region, Inc.
World Trade Center, Room 303 San Francisco, CA 94111
Peter Pope Marine Exchange of Los Angeles--
Long Beach Harbor, Inc. P.O. Box 287 San Pedro, CA 90733
Terry Dress 1er Albert Ronyeca Air Pollution Control District County of San Luis Obispo P.O. Box 637 San Luis Obispo, CA 93406
John Gardner Triple A Shipyard Pier No. 64 San Francisco, CA 94107
In formation
Ship emission factors, research reports
Visible emission regulations
Visible emission regulations
Visible emission regulations
Ship visit statistics
Ship visit statistics
Ship visit statistics, emission inventory data, visible emission regulations
Shipyard survey, fireside cleaning survey
Ph one Number
{ 617) 494-2000
(206) 753-2821
(206) 344-7330
(503) 229-5696
(415) 982-7788
(213) 832-64 ll
(805) 549-5912
(415) 822-8222
1-8

Table 1-1. Continued
Contact, Affiliation and Address Information Phone Number
John Foulk National Steel &Shipbuilding P.O. Box 80278 San Diego, CA 92138
Shipyard survey (714) 232-4011
John Dawson Wes twin d s , I n c • 178 Townsend Street San Francisco, CA 94107
Shipyard survey (415) 982-6339
Tom 01 Toole (Commercial) Ron Miller (U.S. Navy)Frank McE l hill (General) Todd Pacific Shipyards, Inc. P.O. Box 231 San Pedro, CA 90733
Shipyard survey, refractory survey, fireside cleaning survey
(213) 832-3361
Tom ConleyService Engineering P.O. Box 7714 San Francisco, CA 94107
Shipyard survey ( 4 15) 95 7 - 17 77
Wilmington Iron Works 11 C11 Street Wilmington, CA 90744
Shipyard survey (213) 518-3213
Coastal Marine Engineering 1051 25th Street San Francisco, CA 94107
Shipyard survey (415) 826-3400
Cavanaugh Machine 11 811220 E. Street
Wilmington, CA 90744
Shipyard survey (213) 834-5219
Jack Troyer Todd Shipyards 2900 Main Street Alameda, CA 94501
Shipyard survey (415) 523-0321
1-9
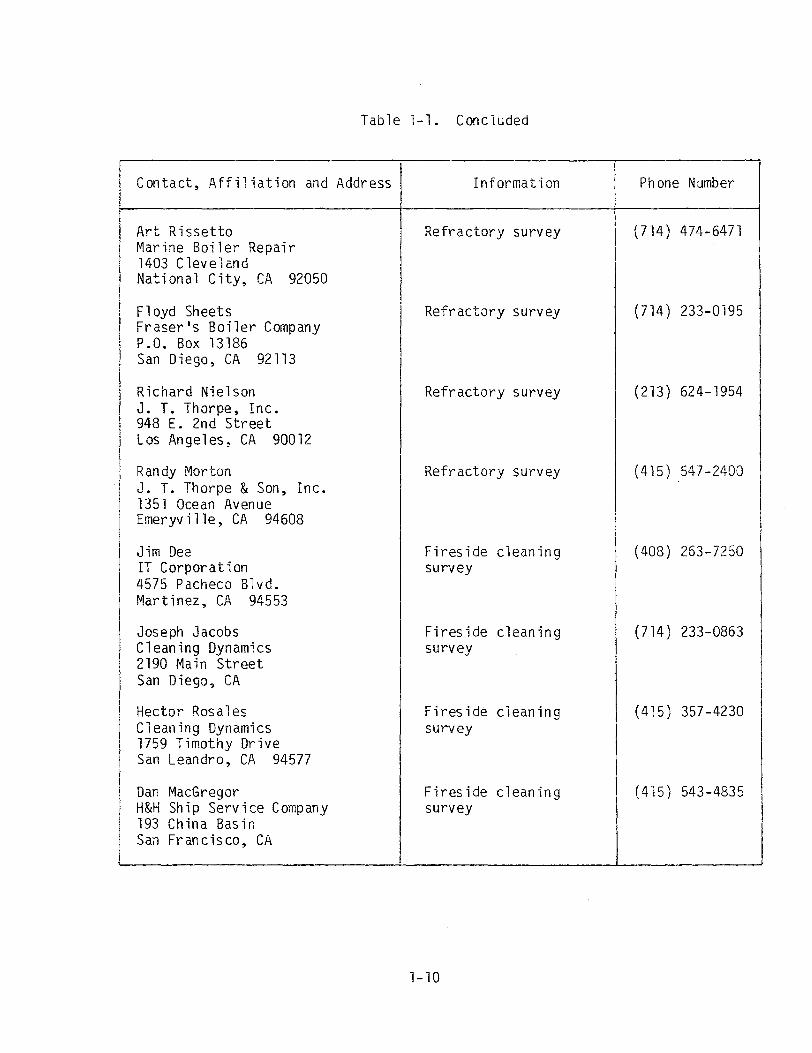
Table l-1. Concluded
Contact, Affiliation and Address Information Ph one Number
Art Rissetto Marine Boiler Repair 1403 Cleve 1 and National City, CA 92050
Floyd Sheets Fraser's Boiler Company P.O. Box 13186 San Diego, CA 92113
Richard Nielson J. T. Thorpe, Inc. 948 E. 2nd Street Los Angeles, CA 90012
I Randy Morton J. T. Thorpe & Son, Inc. 1351 Ocean Avenue Emeryville, CA 94608
Jim Dee IT Corporation 4575 Pacheco Blvd. Martinez, CA 94553
Joseph Jacobs Cleaning Dynamics 2190 Main Street San Diego, CA
Hector Rosales Cleaning Dynamics 1759 Timothy Drive San Leandro, CA 94577
Dan MacGregor I H&H Ship Service CompanyI
193 China Basin San Francisco, CA
Refractory survey
Refractory survey
Refractory survey
Refractory survey
Fi reside cleaning survey
Fireside cleaning survey
Fireside cleaning survey
Fireside cleaning survey
(714) 474-6471
(714) 233-0195
(213) 624-1954
(415) 547-2400
(408) 263-7250
(714) 233-0863
(415) 357-4230
(415) 543-4835
1-10

SECTION 2
BACKGROUND INFORMATION
2.1 PORT ACTIVITIES The State of California has approximately 840 miles of coastline,
with approximately 10 major port areas, over 60 marine terminals, and numerous smaller ports. Many of the marine terminals are located in the state's major port areas. Commercial ship traffic in waters near the
coast has increased steadily over the years and this trend is expected to continue in the future. In 1976 there were approximately 81,000 commercial vessel trips in and between major California ports
( (reference 2-1). The freight traffic transferred through the California harbor areas (summarized in table 2-1) totaled 137 million tons in 1978. This amount does not include crude oil and petroleum products received or shipped via marine terminals located outside of the listed harbor areas.
Port activities primarily include marine operations necessary for the transfer of petroleum products along the coast and into and out of California waters and movements of general, bulk, and containerized cargoes. Other marine operations which result in port activity are military and Coast Guard operations, tug assistance, passenger transport, and small commercial vessel movements. The three primary areas of activity along the coast of California are San Diego, Los Angeles, and the San Francisco Bay Area. The San Diego port handles over 2 million tons of cargo annually and also accommodates a significant volume of military operations. A large proportion of the Navy's Pacific Fleet (i.e., 89 vessels) is home ported in San Diego with 5 to 10 vessel operations being undertaken daily (reference 2-3). The Los Angeles area includes the ports of Los Angeles and Long Beach. Each port handles in excess of 30 million tons of freight annually, not including fuel which is
2-1

Table 2-1. Freight Tonnage Transferred through California Harbor Areas in Calendar Year 1978 (Reference 2-2)
Harbor Areasa
San Francisco Bay and Delta
San Francisco Harbor Oakland Harbor Redwood City Harbor Richmond Harbor San Pablo Bay and Mare Island Strait Carquinez Strait Suisun Bay Channel Sacramento River San Joaquin River and Tributary Other San Francisco Bay Area Ports
Los Angeles Harbor
Long Beach Harbor
San Diego Harbor Ventura County
Port Hueneme
Ventura Harbor
San Luis Obispo County Morro Bay Harbor
Moss Landing Harbor
Humboldt Harbor and Bay Encina
Crescent City Harbor
Other small harbor areas.
Total
Cargo Transferredb (short tons)
2,317,565 6,937,246
474,131 18,986,001 7,385,600
16,130,713 1,406,043 1,760,449 2,638,408 5,911,744
32,827,478
31,586,404
2,571,402
958,668
881,029
31,543
751,626
1,454,665
2,023,129
249,651
32,461
137,316,056 'I
acargo transferred through marine terminals located in areas not listed is not included
b1ncludes foreign imported and exported cargo, danestic coastwise and internal shipments and receipts, and local freight traffic
2-2

bunkered. The San Francisco Bay area contains numerous ports and petroleum transfer terminals. Ships and barges serving the ports of Sacramento and Stockton also pass through the San Francisco Bay. Total cargo transferred in this area in 1978 exceeded 60 million tons.
In addition to the three primary areas of port activity, there are numerous smaller ports and petroleum transfer points. Petroleum transfer points are used to load crude oil for shipment to refineries (primarily in Ventura, Santa Barbara, and San Luis Obispo counties), unload fuel oil at coastal powerplants (e.g., Moss Landing and Morro Bay), receive crude from out of state, and ship refined products to market. 2.2 VESSEL TRAFFIC
Vessels calling on California ports can be classified by function, propulsion method, and registry. With respect to function, categories of vessels include passenger, dry cargo tankers, military and tugs/tows. the dry cargo group includes general cargo carriers, bulk carriers, container ships, roll-on/roll-off vessels, and lighter aboard ship (LASH) vessels. This method of grouping by function was selected for this study since it corresponds with that used by the marine exchanges for the ports of the San Francisco Bay area and Los Angeles/Long Beach. It is primarily these two organizations that collect ship traffic statistics. Propulsion methods of interest in this study included motorships and steam-powered vessels. The small fraction of visits by gas-turbine-powered tankers were included with the motorship visits unless specifically noted. In addition, vessels calling on California ports were categorized by U.S. or foreign registry. Table 2-2 tabulates the annual vessel visits to the areas of the San Francisco Bay, Los Angeles/Long Beach Harbor, San Diego Harbor, Ventura County and San Luis Obispo County (see section 4.1.1 for specific details regarding the collection and sources of these data).
Ship traffic statistics for the five areas studied indicate that 46 percent of the visits were made by steamships and 54 percent by motorships. These proportions vary from port to port, with San Francisco Bay and Los Angeles/Long Beach steamship traffic at 41 and 28 percent, respectively. Table 2-2 shows a breakdown of annual visits by ship type as 231 (2 percent) by passenger ships; 7,779 (53 percent) by dry cargo; 2,874 (19 percent) by tankers; 3,294 (22 percent) by U.S. military
2-3

Table 2-2. Annual Vessel Visits by Ship Typea
Port
Vessel Type
San Francis cob
Los Angeles/ Long Beachc San Diegod
Ventura Countye
San Luis Obispof Totals
Steamship
Passenger 55 72 3 0 0 130 Ory Cargo 648 629 41 17 0 1,335 Tankers 943 954 8 6 239 2,150 Military 1119 323 2,734h 43 0 3,211
Motorships
Passenger 30 69 0 2 0 101 Dry Cargo 2, 113 4,211 111 9 0 6,444 Tankers 184 405 1 129 5 724 Military 449 0 oh 39 0 83 Tugs/Tows 1649 342 92 27 0 625
Totals
Passenger 85 141 3 2 0 231 Dry Cargo 2,761 4,840 152 26 0 7,779 Tankers 1,127 1,359 9 135 244 2,874 Military 1559 323 2,734h 82 0 3,294 Tugs/Tows 1649 342 92 27. 0 625
aData is taken from Marine Exchange Surrmaries for 1979 unless otherwise noted (references 2-4 and 2-5)
bsteamship/motorship distribution based on percentages developed from Reardon and Conklin report for 1976 (reference 2-6)
csteamship/motorship distribution for Los Angeles/Long Beach based on reference 2-6 data and personal corrmunication (reference 2-8)
dpersonal communication (reference 2-7) eoata from 1977 Ship's Inventory Documentation as compiled by the County of Ventura APCD (reference 2-9)
f1977 San Luis Harbor usage data as compiled by the County of San Luis Obispo APCO (reference 2-10). Values do not include 31 visits known to have been made by gas-turbine-powered tankers.
9Data from reference 2-6 hpersonal communication (reference 2-3)
2-4
vessels; and 625 (4 percent) ocean-going tugs/tows. The San Diego area has a high proportion (i.e., 98 percent) of its v1sits being made by steam-powered ships because of the extensive naval facilities located there.
The breakdown of annual ship traffic to the San Francisco Bay, Los Angeles/Long Beach, and San Diego areas by registry and propulsion is given in table 2-3. This information shows that excluding visits by tugs/tows and military ships which are predominately of U.S. registry; 70 percent of the visits were made by foreign passenger, dry cargo, and tanker vessels. This information also reveals that about 96 percent of
the U.S. flag ship traffic was by steam-powered vessels while the majority (i.e., 96 percent) of the foreign traffic was by motorships. (Military and tugs/tows were excluded). The majority of U.S. naval vessels are steam powered while all oceangoing tugs/tows are motor powered.
Since the daily logs of ship movement information as compiled by the San Francisco and Los Angeles marine exchanges were not reviewed for
this study, no recent detailed information regarding the number of individual ships making the above reported number of visits was collected. The 1976 raw data as tabulated by Reardon and Conklin listed 201 U.S. and 93 foreign steamships calling upon San Francisco Bay area ports (reference 2-6). This study also reported results for the San Francisco Bay Area, as summarized in table 2-4. In addition, it was reported that of the 862 foreign merchant vessels calling on San Francisco in 1976, 74 percent made two or less visits. It is believed that a
substantial portion of the ships which call upon the San Francisco Bay area also call upon Los Angeles/Long Beach and other California ports.
A review of the U.S. flag oceangoing fleet reveals that of the 499 vessels in operation in 1980, 7 percent were motor driven, 92 percent were steam powered and 1 percent were gas-turbine driven (reference 2-11). Motor-powered ships are new to the U.S. fleet with an average age of 6
years. Steam-powered U.S. ships average 15 vears while the average age of foreign vessels is 12 years. 2.3 SHIPBOARD COMBUSTION
Boilers on almost all steam-powered commercial vessels built since World War I have been designed primarily to burn residual fuel, while U.S. Naval vessels are equipped to fire relatively 11 clean 11 mid-distillate
2-5

Table 2-3. 1979 Vessel Traffic Distribution by Registry and Propulsiona
~
San Francisco Bay Los Angeles/Long Beach San Diego
Registry and Propulsion Type
I,.. (I) 0, C Q)
"' "'n:, 0.
0 0, I,..n:, w >, I,..
C)
I,.. Q) ~ C n:, I-
"' ~ I---.. "'0, ::, I-
~ n:,...., .,.. ..... .,.. ::i;:
I,.. (I) 0, C Q)
"' "' n:, 0.
0 0, s.. n:, w >, I,.. C)
I,.. Q)
~ ,::: n:, I-
"' 3 0 I-
----"'0, ::, I-
>, I,.. n:, .µ .,.. ..... .,.. ::.:
I,.. (I) 0, C Q)
"' VI n:, 0.
0 0, I,.. n:, w >, I,..
C)
I,.. (I.I ~ C n:, I-
"' l I-
----"'0, :, I-
ti n:, .µ .,.. ..... ::.:
U.S. Steamships 44 583 893 0 NA 48 499 934 0 NA 3 38 8 0 2,734
U.S. Motorships 0 6 67 NA NA 0 0 40 273 NA 0 0 1 92 0
U.S. Total 44 589 960 NA .NA 48 499 974 273 NA 3 38 9 92 2,734
Foreign Steamships 11 65 50 0 NA 24 130 20 0 NA 0 3 0 0 0
Foreign Motorships 30 2,107 117 NA NA 69 4,211 365 69 NA 0 111 0 0 0
Foreign Total 41 2,172 167 NA NA 93 4,341 385 69 NA 0 114 0 0 0
Total 85 2,761 1,127 164 155 141 4,840 1,359 342 323 3 152 9 92 2,734
N I
O'\
aoata compiled from San Francisco and Los Angeles/Long Beach Marine Exchanges, Reardon and Conklin report,South Coast Air Quality Management District and County of San Diego inventories and conversations with San Diego Port personnel (references 2-4, 2-5, 2-6, 2-8, 2-3, and 2-7, respectively)
NA= not applicable
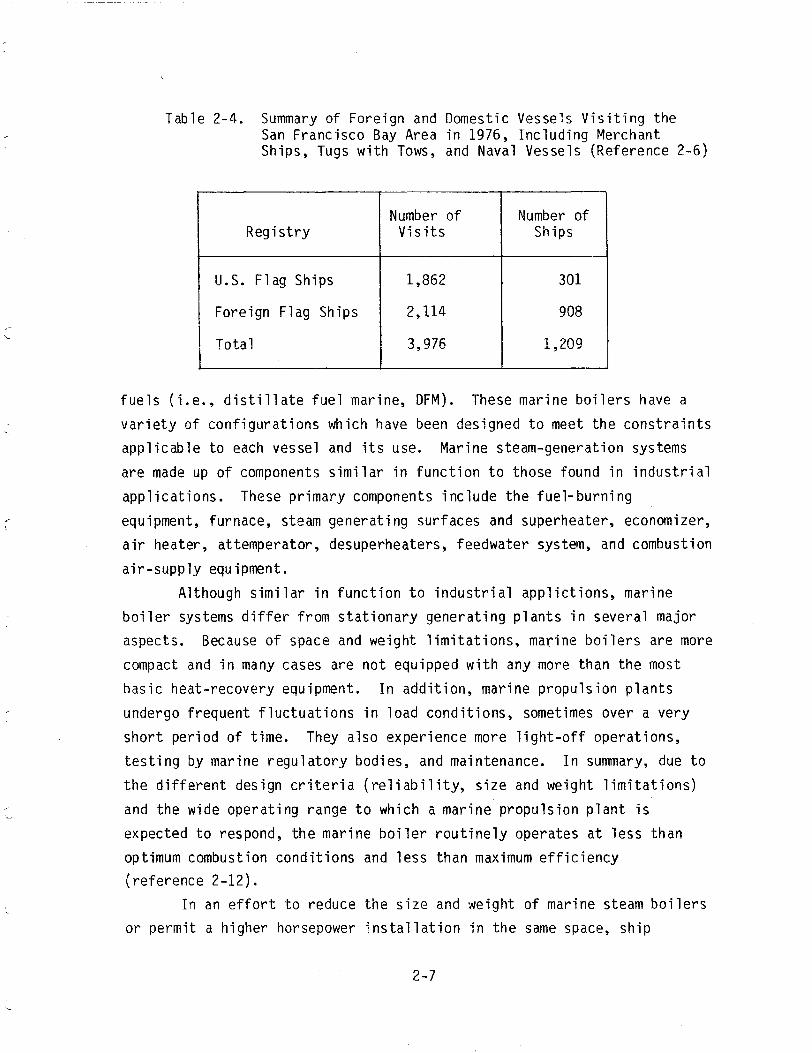
Table 2-4. Summary of Foreign and Domestic Vessels Visiting the San Francisco Bay Area in 1976, Including Merchant Ships, Tugs with Tows, and Naval Vessels (Reference 2-6)
Number of Number of Registry Visits Ships
U.S. Flag Ships 1,862 301
Foreign Flag Ships 2,114 908
Total 3,976 1,209
fuels (i.e., distillate fuel marine, DFM). These marine boilers have a variety of configurations which have been designed to meet the constraints applicable to each vessel and its use. Marine steam-generation systems are made up of components similar in function to those found in industrial applications. These primary components include the fuel-burning equipment, furnace, steam generating surfaces and superheater, economizer, air heater, attemperator, desuperheaters, feedwater system, and combustion
air-supply equipment. Although similar in function to industrial applictions, marine
boiler systems differ from stationary generating plants in several major aspects. Because of space and weight limitations, marine boilers are more compact and in many cases are not equipped with any more than the most basic heat-recovery equipment. In addition, marine propulsion plants undergo frequent fluctuations in load conditions, sometimes over a very short period of time. They also experience more light-off operations, testing by marine regulatory bodies, and maintenance. In summary, due to the different design criteria (reliability, size and weight limitations) and the wide operating range to which a marine propulsion plant is expected to respond, the marine boiler routinely operates at less than optimum combustion conditions and less than maximum efficiency (reference 2-12).
In an effort to reduce the size and weight of marine steam boilers or permit a higher horsepower installation in the same space, ship
2-7

designers have been turning to boilers using higher steam pressures and
temperatures. World War II combat naval vessels operated at steam
pressures and temperatures near 600 psig-8S0°F while merchant ships
operated at 450 psig-7S0°F. In the postwar period, the Navy advanced to
1,200 psig-9S0°F (nominal) for its combat vessels. In the late 1940 1 s
and 1950 1 s new merchant ships were put into service using 600 psig-850°F
and 850 psig-850°F. By the 1960's almost all new construction used
850 psig-950°F steam. Propulsion utilizing steam at pressures of 850 to
1,500 psig and temperatures from 950° to l,000°F are characteristic of
most commercial steamships built during the l970's (reference 2-13).
The size of marine boilers can range from as little as 1,500 lb/hr
in small auxiliary boilers to over 400,000 lb/hr in large main propulsion
boilers. Typical commercial vessels are equipped with two boilers, each
with an average capacity in the range of 70,000 to 125,000 lb/hr. Naval vessels can have from two to eight boilers per ship with steam production
rates in the range of 50,000 to 300,000 lb/hr.
Oil Burner Systems Residual fuel oil or DFM is fired into each marine boiler, usually
via two to four burners, although naval and larger commercial units may
have more. These burners atomize the fuel, mix it with combustion air, and shape the flame for optimum performance. When oil is burned, it is
reduced to finely divided particles through the use of a variety of
atomization techniques which include steam atomization (internal and
external mix), steam mechanical (external mix), straight mechanical,
mechanical with return flow, variable whirl chamber plunger, and rotary or
spinning cup. Most older vessels were originally fitted with the mechanical atomizer which operates over a range of oil pressures from 100
to 300 psi in merchant vessels and up to 600 psi in naval ships. With
these pressure ranges, only limited changes (i.e., 2:1) in the fuel flow
rate can occur, thus the firing rate is controlled by changing the number
and size of burner nozzles in use. Most of these vessels which are still
in service have been retrofitted with steam-atomizing burners. The mechanical return-flow atomizer, used primarily in naval
vessels, provides a 10:1 operating range. With this system, oil is supplied to the atomizer at a pressure of 300 to 1,000 psi and part of the
fuel is returned to the supply tank or pump suction. The variable whirl
2-8

chamber plunger atomizer also installed on U.S. naval vessels, uses variations in the swirl chamber and inlet ports in addition to fuel oil
pressure to achieve an operating range of 10:1. Steam-mechanical atomizers are basically straight-mechanical atomizers to which steam jets have been added. The range of this atomizer is somewhat greater than that of the mechanical atomizer but not as great as that of the internal-mixing
steam atomizer. Steam-atomizing burners, also known as twin-fluid burners, were
developed in the early 1960 1 s and have found use on nearly all currently operating merchant vessels and 50 percent of U.S. naval vessels. Fuel atomization is accomplished by combining a gas stream (usually steam, but in some cases compressed air) and the fuel stream. These streams can be combined inside the burner nozzle (internal mix) or just at the nozzle exit (external mix). In the internal-mixing steam-atomizing burner, the steam entrains the oil and the mixture expands through the outlet nozzles
at a high velocity producing a fine oil spray. External-mixing steam-atomizers keep the fuel and atomizing medium separate until they exit the burner tip and in many designs, the atomizing liquid is given a swirling motion as it exits. Steam atomization provides the greatest
turndown (20:1) and produces the smallest and most uniform particle size over its range of operation. A typical fuel-oil service system with steam-atomizing burners is illustrated in figure 2-1.
The atomized fuel is mixed with combustion air in the air register which functions to control the direction and velocity of the air supply. Two basic air register assemblies are used; one using radial doors and the other using cylindrical doors. Air supply is controlled by adjusting the number and degree of register openings and by increasing the draft
produced by forced or induced draft fans. In automated boilers, air cylinder actuators are applied to the doors and the doors are remotely controlled by the burner sequencing controls. In other installations, the doors are manually operated.
Boiler Control Systems Subsystem instrumentation and control devices are integral to the
marine boiler design. This equipment is used to operate the boiler efficiently and safely by providing information and control of factors such as the water level in the boiler drum; burner performance; pressure
2-9

___ _
r- ✓ '-- ....
)
Heating coils \ ThermometersStea111 to tankr Sounding tube- / Vent-typical \ I r Duplex strainer
r- _t.ypical- -~ _l___ --~ I t4 ► ,"1,
~L • .r-'-- - --·-- - F.0.- service suction ~ t\j1 ,,..set!.!_in.2_t~0 #1.,_f/F.O. service pump ~fa_:: i;~U~--=_)~_C~<ii,L,~
St.ea~1 heating --....._ coil return· ..__,
Recirculating line ~ ____ _ _ Jtr------- -- -- --- ---
valve
\...,
7 1 Steam to F.0.
-
heaters gauge DuplexN I Master valve
I t-' 0 IL---{X] I l l l •iXl I I ( J
.___F .0.F.0. cut-out valve
F.0.
Steam atomization--._ t ► --1
---..S~ I
Fuel oi 1 ___ Steam
F.0.
__T__-Relief~a2;:'_e_ J
Rec i rcu I a tion Discharge to "... inspect ion tank ~
Figure 2-1. Typical Fuel-Oil Service System

of the steam and feedwater; temperatures of the superheated (and reheated) steam; pressure of the gas and air entering and leaving the principal components; feedwater and boiler water chemical conditions; operation of the feed pumps, fans, and fuel-burning equipment; excess air; temperatures of the water, gas fuel and air entering and leaving the principal components; and feedwater, steam, fuel and air flows.
Boiler controls have evolved over the years increasing in complexity and degree of automation. Early marine boilers were completely manually controlled. Later systems were capable of steady operation at sea with little operator participation but required manual adjustments during inport operations such as maneuvering. The newest systems have been designed to have complete automatic control over the full operating
range from standby to full load. No systems are in operation at this time which offer completely automated startup; this task requires manual manipulation of controls and operator-initiated procedures.
Boiler controls installed on ships calling on California ports (specifically the San Francisco Bay area) in 1976 were surveyed and reported in reference 2-6. This study categorized the boiler control systems into four types. Table 2-5 describes system characteristics along with the approximate time period during which the various systems were
installed. Of the ships currently operating in California waters, essentially all fall in the type II, III, or IV categories. In 1976, approximately 56 percent of all the ship visits to the San Francisco Bay area were made by vessels having type II combustion control, 13 percent
had type III, and 31 percent had type IV. The boiler control types of foreign steamships were found to be similar to those of U.S. steamships. It is assumed that the distribution of boiler control systems on ships calling on other California ports is similar to that observed in the San Francisco Bay area since many of the same vessels call on multiple California ports. It is also reasonable to assume that since the 1976 survey, the proportion of visits made by ships with type IV controls has increased to greater than 31 percent while the proportion of visits made by ships with type II controls has decreased. Those with type II controls would be in the 21 to 41 year age group. Most of these vessels have had at least a portion of their control system updated by being retrofitted with steam-atomizing burners.
2-11

Table 2-5. Summary of Boiler and Instrumentation Characteristics
N I
I-' N
Boil er Contra l Category
Approximate Installation Period
Boiler Temperature and Pressure Control System Characteristics
Type I Pre-1936 and Liberty Ships (1941 to 1946)
225 psig-450°F Essentially completely manual control except'for boiler feedwater which was controlled by liquid level (single element)
Type II 1936 to 1961 Except Liberty Ships ( see above) "C" Class, Victory and Mariner Class Ships and T-2 Tankers
Pre-WWII -- 450-psig 7500F for commercial ships, 600 psig-850°F for naval ships Post-WWII -- 600 to 800 psig-8500F for commercial ships,1,200 psig-950°F for naval ships
"Hands off" steady state operation at sea, manual control for maneuvering
Multiple mechanical atomizing burners (low turndown)
Automatic feedwater control (single element)
Manual burner ignition
Type II I 1962 to 1967 850 psig-950°F for most commercial vessels, several large vessels built with 1,500 psig-9500F
Steam atomizing wide range burners (turndown 20:1)
Automatic feedwater control (two and three element)
Automatic ignition Flame scanners Opacity monitors
Type IV 1968 to Present 850 to 1,500 psig-950 to l,000°F for commercial vessels
Solid state controls Fully automatic boiler room Electronic ignitersFlame scanners Opacity monitors Microprocessor-based combustion controls and oxygen analyzers (ships built from early l970's on)
As indicated in table 2-5, improvement in boiler controls over the past three decades has resulted in systems requiring fewer persons to operate and in efficient fuel utilization over a wide range of load changes. However, as has been mentioned, startup operations are still manually controlled. 2.4 VISIBLE EMISSION REGULATIONS
Visible emissions from any source are prohibited by law from exceeding specified opacity standards as cited in the California Health and Safety Code (section 41701), with certain exemptions. Senate Bill 2198, signed into law in September 1978, specifically amended the list of emission sources which are exempted from the visible emission regulation. By passage of this bill into law, exemptions were granted for the following marine vessel operations as provided for in sections 41704(j) and (k) of the California Health and Safety Code:
• Exemptions for emissions from vessels using steam boilers during emergency boiler shutdowns for safety reasons, safety and operational tests required by government agencies, and where maneuvering is required to avoid hazards
• Exemption for em.issions from vessels using steam boilers during cold-boiler light-off operations and while drying wet or green refractory to the extent that such emissions do not equal or exceed Ringelmann 2 (40 percent opacity) for periods aggregating more than 15 min in any 1 hr, until January 1984
While general opacity standards exist for vessels, there are certain modes of operation which require large swings in power or result in periods when shipboard boiler performance is less than optimal. It is at these times that visible emissions may be generated and are thus specifically exempted.
It should be noted that the exemptions presumably apply equally to auxiliary steam boilers, such as those installed upon motor-powered vessels, as to steam boilers used to produce power in steam-turbinepowered vessels. The auxiliary boilers (or 11 donkey 11 boilers), however, do not experience the same operational modes which are typical of main propulsion boilers. The currently exempted modes which may be applicable to auxiliary boilers include emergency shutdowns, cold-boiler light offs and drying wet or green refractory.
2-13

When not specifically exempted, vessels must meet the standard
visible emission regulations (see table 2-6). The California Health and
Safety Code stipulates that visible emissions should not exceed
Ringlemann 2 (40 percent opacity) for more than an aggregate period of 3 min in any 1 hr. Regional air pollution control districts such as the
Bay Area Air Quality Management District, South Coast Air Quality
Management District and the County of San Diego Air Pollution Control
District have more restrictive limitations, as outlined in table 2-6. These regulatory agencies require that emission sources generate visible
emissions with opacities less than 20 percent (i.e., Ringelmann 1) except
for 3 min/hr. These same limitations are imposed on ships calling on
ports in the states of Washington and Oregon as well as many other
locations throughout the U.S. Each West Coast air pollution control district listed in table 2-6
has provisions whereby emissions exceeding any of the applicable limits as
a result of startups, equipment malfunctions or unforeseeable failures may
be determined not to be in violation of the standards. The exact wording
of each regulation varies, and special circumstances need to be met before
relief from the regulation may be granted. Generally the owner or
operator of the malfunctioning equipment must immediately notify the regulatory agency of the occurrence, providing the pertinent facts. A
written report may also be required. Following this procedure does not
ensure that the operator will be relieved of any responsibility for the
regulatory violation, since the agency generally reserves the right to make the final judgment. Utilizing this procedure does, however, provide
a mechanism by which owners and operators can seek relief from being
penalized in those cases where the generation of excessive visible
emissions was caused by malfunctioning equipment or unforeseeable failure.
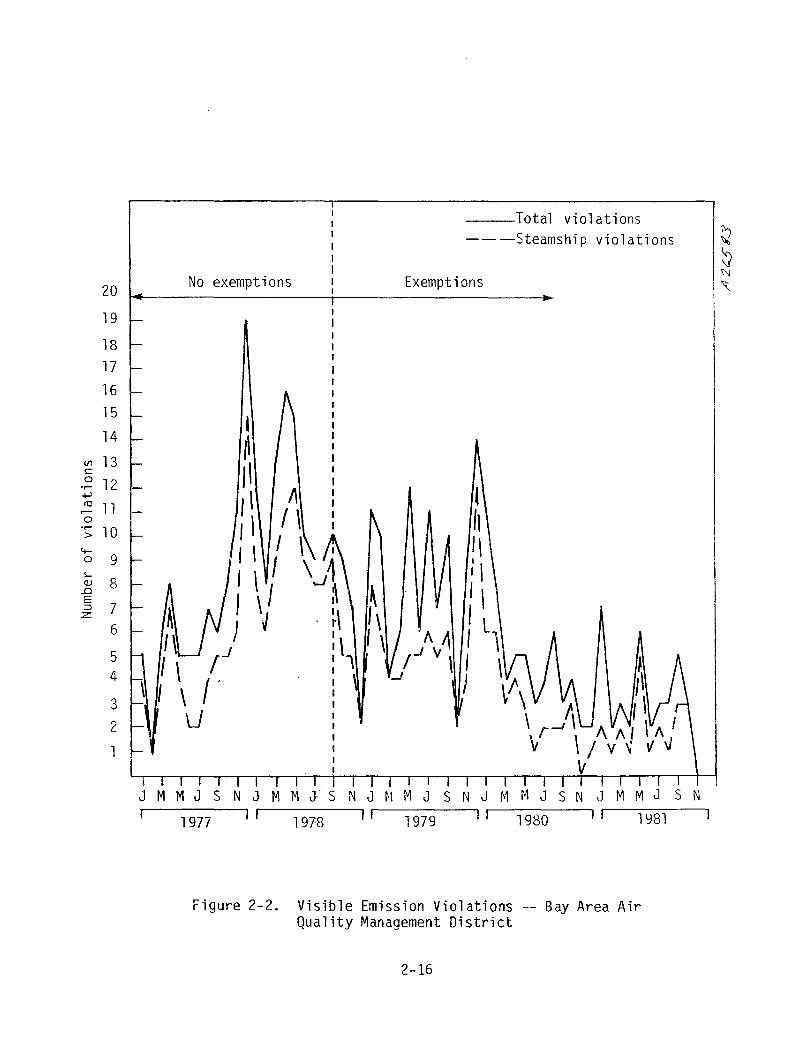
The number of citations issued to vessel operators for visible
emissions violations in the San Francisco Bay area has been plotted for
the period from January 1977 to November 1981, as illustrated in
figure 2-2. The average number of citations issued monthly to steamship operators after the September 1978 enactment of the exemptions is
statistically significant, being lower than the monthly average before that date (i.e., 6.6 +3.5 steamship violations per month from January 1977
to August 1978 and 3.5 +2.4 steamship violations per month from
2-14

----
Table 2-6. Sunmary of Visible Emission Regulations Applicable to Vessels
General Visible Emission Regulations
Location Maximum Maximum (Regulatory Agency) Ringelmann Number Time Special Vessel Exemptions
Washington -- Puget Sound 1 (20% opacity) 3 min/hr Possible exemption granted(Puget Sound Air Pollution under section 9.16 for Control Agency) startup, periodic shutdown
or unavoidable and unfore-seeable failure, etc. if reported and/or a written report submitted.
1 (20% opacity) 3 min/hrOregon (Department of Possible exemption granted Environmental Quality) under Rule 34-21-065 for
scheduled maintenance or-breakdown, upset or ma 1 functions.
California (California 2 (40% opacity) 3 min/hr Unlimited exemptions for Air Resources Board) specific modes, less re-
strictive standards for other modes (Ringelmann numbers of 2 or more not to exceed 15 min/hr) as pro-vided in section 41704(j)and (k) of the California Health and Safety Code.
1 (20% opacity) 3 min/hrCalifornia -- San Francisco Possible exemption avail-Bay Area (Bay Area Air able for breakdown or mal-Quality Management District) functions, under Regula-
tion 1, Section 112.
California -- San Luis Obispo 2 (40% opacity) 3 min/hr Possible exemption avail-County (County of San Luis able for startup, break-Obispo APCD) down, malfunctions, upset,
etc. under Rule 107.
California -- Ventura County 1 (20% opacity) 3 min/hr Possible exemption avail-(County of Ventura APCD) able.for unforeseeable
failure or malfunction Rule 32.
California -- Los Angeles/ 1 (20% opacity) 3 min/hr Possible exemption avail-Long Beach (South Coast Air able for breakdown, mal-Quality Management District) functions, etc., under
Rule 430.
California -- San Diego 1 (20% opacity) 3 min/hr Possible exemption avail-(County of San Diego APCD) able for breakdowns, mal-
fuflctions, etc., under Rule 98.
~
2-15
l
20
19
18
17
16
15
14
Vl 13 !.::
-~ 12 -+:>
~ 11 -0
·; 10
't 9 5.-Q.l 8
..0 E::::) 7
z::
6
2
--Total violations ---Steamship violations
No exemptions Exemptions
I ~ :.\ I\ \ I 1
J M M J S N J M M J. S N J M M J S N J M M J S N J M M J S N
1977 I I 1978 I 1 1979 l I 1980 1 f l Y8l
Figure 2-2. Visible Emission Violations -- Bay Area Air Quality Management District
2-16
September 1978 to November 1981). The fraction of citations issued to ship owners has steadily decreased since 1977. Ship emission violations
made up approximately 5.7 percent of the total citations issued in 1977, while they represented only 1.6 percent of the citations issued during the period from January 1981 through November 1981. Steamship violations made up 60 to 70 percent of the total citations issued to marine vessel operators during the 1977 to 1981 period.
A sampling of the citations issued by the Bay Area Air Quality Management District was reviewed in an effort to determine the nature and cause of the emission violations. A total of 89 citations issued between January 1979 and July 1980 was examined; 56 were for steamships and 33 were for motor-powered vessels including tugboats. Of those issued to motorships and tugs, 55 percent were for excessive emissions from the main engines or electrical generator, 36 percent were for emissions from the auxiliary boiler(s), and no specific emission source was identified for 9 percent. The primary reason given for excessive emissions from the auxiliary boiler was improper air-to-fuel settings. In only one case were
excessive emissions attributed to a cold-boiler light off. Reasons given for excessive emissions resulting from the main propulsion boilers on steamships are listed in table 2-7.
2-17

Table 2-7. Steamship Emission Violation Causes -- Bay Area Air Quality Management District (January 1979 to July 1980)
Cause of Emissions Number of Cases
Cold-boiler light off 12
Poor operation, improper air:fuel ratio or operator negligence 28
Equipment malfunctions 8
Boiler testing 1
Drying refractory 1
Other 4
Unknown 4
Note: The total number of cases exceeds the 56 steamship citations reviewed since multiple reasons were indicated for some violations
2-18

SECTION 2 REFERENCES
2-1. Ailor, D., "Consideration of Model Rule for the Control of Sulfur Oxides and Organic Gas Emissions From Marine Vessel Operations," California Air Resources Control Board, Staff Report 78-20-2, October 1978.
2-2. 11Waterborne Commerce of the United States - Part 4, Waterways and Harbors: Pacific Coast, Alaska and Hawaii, 11 Department of the Army Corps of Engineers, 1978.
2-3. Personal Communication, letter from John M. Kovac, San Diego County Air Pollution Control District, San Diego, CA to A. W. Wyss, Acurex Corp., Mountain View, CA, April 4, 1981 (documentation for the 1978 Ship and Boat Emissions Inventory).
2-4. "Comparative Statistics -- 1979, Ship Arrivals and Departures," Marine Exchange of the San Francisco Bay Region.
2-5. "Vessel Arrivals and Departures at Los Angeles-Long Beach Harbor, 11
Marine Exchange of Los Angeles-Long Beach Harbor, Inc., 1979.
2-6. Reardon, D. V. and C. S. Conklin, 11 Vessel Emission Study," prepared for Pacific Merchant Shipping Association, San Francisco, CA, July 15, 1977.
T -L 2-7. Personal Communication, telephone conversation between Bill
Stonehouse, San Diego Port District, San Diego, CA, and A. W. Wyss, Acurex Corp., Mountain View, CA, December 2, 1980.
2-8. Personal Comnunication, letter from Earl Halberg, South Coast Air Quality Management District, El Monte, CA, to A. W. Wyss, Acurex Corp., Mountain View, CA, January 16, 1981 (documentation from 1979 Ship Emissions Inventory).
2-9. Personal Communication, letter from Andy Delao, Ventura County Air Pollution Control District, Ventura, CA, to G. Murphy, Acurex Corp., Mountain View, CA, December 22, 1980 (1977 Ship Inventorydocumentation).
2-10. Personal Communication, letter from Albert Ronyecz, San Luis Obispo County Air Pollution Control District, San Luis Obispo, CA, to G. Murphy, Acurex Corp., Mountain View, CA, February 20, 1981 (1977and 1980 San Luis Obispo Port Traffic).
2-11. "The U.S. Flag Oceangoing Fleet," Marine Engineering/Log, pp. 92-114, June 15, 1980.
2-19
2-12. Hansen, A. G., et al., "Applicability of Shoreside Air Quality Emission Laws to Merchant Vessels in Port, 11 prepared by Chi Associates, Inc. for the U.S. Maritime Administration, MA-RD-920-79055, July 1979.
2-13. Harrington, R. L., ed., Marine Engineering, Chapter 3, "Boilers and Combustion, 11 Society of Naval Architects and Marine Engineers, New York, NY, pp. 78-129, 1971.
2-20

SECTION 3
NORMAL AND EXEMPTED MODE OPERATING PRODEDURES
In the routine use of marine propulsion systems, various operating modes are necessary. These modes require boiler operation over a wide load range. At the low end, minimum firing rates are used during the light off of a "dead" ship whose boilers are cold. Firing rates at 110 percent of full load represent the upper end of boiler performance and are used in emergency maneuvering situations. The boiler must be capable of rapid response to changes in demand for steam output. This is necessary because of the rapid and wide changes in maneuvering power requirements of large, high-speed ships. The boiler must likewise be capable of prolonged periods of steady operation at its design rating. In addition, boilers are subjected to lengthy periods of operation at low or minimum outputs as are experienced in port. 3. l NORMAL MODES OF OPERATION
For purposes of this study, normal modes of operation are defined as those modes for which visible emission exemptions do not exist. Since exemptions currently exist for cold boiler light offs, operations necessary to dry wet or green refractory, government testing, maneuvering to avoid hazards and emergency boiler shutdowns, normal modes include all other functions necessary for routine ship movement and operation.
While at sea, unconfined by coastal or harbor restrictions, commercial marine propulsion systems usually operate in the cruise mode at 80 to 100 percent of full rated power. Speeds in the range of 15 to 22 knots are typically achieved. These commercial vessels are designed for maximum fuel efficiency at full rated power, while naval combatant vessels are usually designed for maximum efficiency at 35 percent of full rated power. Naval vessels operate at this 35 percent power level about
3-1
85 percent of their service life (reference 3-1). In addition to
propelling the vessel, the power produced is used for space conditioning,
electrical power generation, and petroleum cargo heating, if applicable.
When vessels move to or from a designated sea lane in preparation
to enter a port, they are typically operated in the transit mode. This
requires a lower power level than the cruise mode; the boilers usually
operate at 60 to 80 percent of rated load. This mode of operation is also
used for some interharbor movements where it is not necessary for a vessel
to enter a designated sea lane.
Once a vessel has reached the port entrance, the power level is
reduced and the vessel is in the maneuvering mode. In restricted waters,
ships normally attempt to maintain steady speed at reduced power in order to provide maximum rudder effectiveness for maneuvering. Reduced speed is
required because of liability for wave damage ashore, and by law which requires vessels to proceed at a "safe speed.'' Within port boundaries,
this mode of operation is used as the vessel moves to its berth or
anchorage and when departing these locations for another dock or port.
Maneuvering a vessel into and out of docks or in restricted waters may require frequent changes of power with resulting fluctuations in
boiler steam flow, oil flow, steam pressures and temperatures, and drum
water levels. Older vessels which are still equipped with mechanical
atomizing burners would use burner sequencing to follow the load demand
since these burners have a limited range. This operation requires
frequent manual manipulation of the boiler controls and thus may result in brief periods of less than optimum combustion conditions and excessive
visible emissions. Modern vessels equipped with wide-range steam atomizing burners and automated controls and older vessels which have been
retrofitted can operate in the maneuvering mode with little or no manual boiler manipulation. As a consequence, the probability of generating
excessive visible emissions is greatly reduced.
Once a vessel arrives at its berth, unneeded boilers may be secured
depending upon the expected length of stay and the at-berth power requirements. For most ships having two boilers, one is secured while the
other is operated to provide steam for hotel services and, if applicable, cargo heating and unloading. If a vessel is in port for more than 24 to
48 hours, the likelihood of a boiler being secured increases. During many
3-2

port visits by the newer and larger quick-turnaround tankers and container
ships, no boilers are secured since their time in port is limited. Also,
operators of vessels with boilers capable of producing steam at high pressures and temperatures (in the order of 840 psig-940°F) are less likely to secure their boilers since the warm-up period for these units is
lengthy. Naval vessels berthed at piers with sufficient shore facilities generally secure all boilers when in port since their length of stay is
usually long enough to justify this procedure. While at berth, the operating boiler is at reduced load, producing
steam which is subsequently used for space conditioning, electrical power
r generation, water heating and in some cases, cargo heating. The boiler
operating 100de required to produce steam and electrical power for crew or
passenger living spaces is referred to as hoteling. These power
requirements vary with the size and function of the ship and are discussed
in section 4.1.4.
Cargo heating is a special power requirement applicable to tankers whose cargos must be heated to maintain a certain viscosity in order to be
pumped ashore. Cargo unloading mey also require power from the operating
boiler. Dry cargo vessels use little more than hotelling loads during
offloading. Cargo on container vesels is loaded and unloaded with dockside cranes which draw power from shore utilities. Other types of dry
cargo ships may use minor amounts of vessel-produced power in cargo loading and unloading operations. Tankers use considerable power in
unloading liquid cargo. Boiler firing rates for .the hoteling, cargo heating, and unloading
modes are generally at a steady-state, low-load, or in the case of tanker operations, reduced-load level. In these ranges, efficient combustion is
difficult to achieve without close attention to the boiler controls. This
may be especially true for extremely high-powered ships (i.e., up to
120,000 horsepower) operating at a small percentage of their full rated
power. In this range, combustion control instrumentation is at its limit.
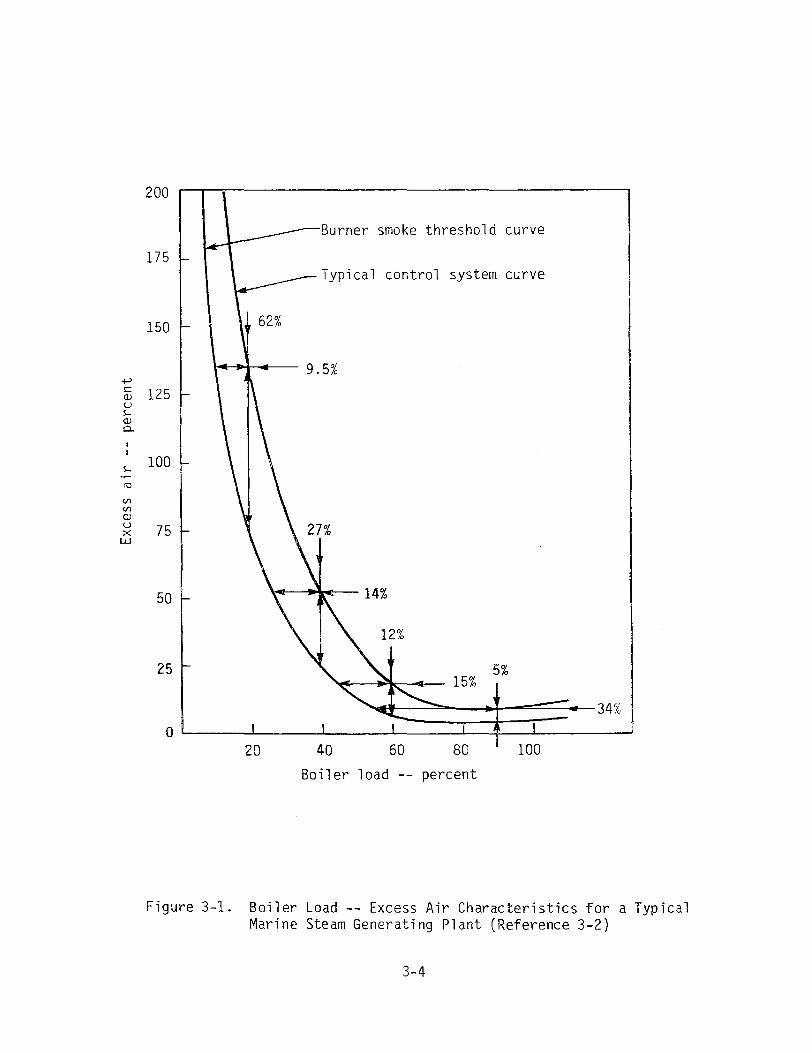
Figure 3-1 illustrates a plot of burner smoke threshold and a typical combustion control system curve on axes of excess air versus boiler load. For a marine boiler operating at 90 percent of its rated load, a 34 percent change in load (i.e., 90 percent down to 56 percent)
would only require a 5 percent change in excess air in order to remain
3-3
+-' C CJ u !,.... CJ a.
!,.... ·~ rtl
V)
V)
CJ u X
w
200
175
150
125
100
75
50
Burner smoke threshold curve
Typical control system curve
9.5%
14%
12%
25 5% 15%
34%
0 20 40 60 80 100
Boiler load -- percent
Figure 3-1. Boiler Load -- Excess Air Characteristics for a Typical Marine Steam Generating Plant (Reference 3-2)
3-4

above the smoke threshold point. At the 20 percent load level, the excess air change necessary for a 9.5 percent load variation is 62 percent. Thus, as a marine boiler operates at smaller fractions of its rated load, small variations in load require large adjustments in air flow to maintain smoke-free combustion. 3.2 EXEMPTED MODES OF OPERATION
As previously noted, the operating modes for which current visible emission exemptions exist are:
• Maneuvering to avoid hazards • Emergency boiler shutdowns • Government testing 1 Cold-boiler light offs • Drying wet or green refractory
These operating modes generally occur infrequently and for very short time periods. They can be scheduled as is the case for the latter three modes or can occur as a consequence of unplanned events. This section will discuss pertinent ship and boiler operating procedures with respect to these modes and the reasons why excessive emissions may be generated. Section 4.2 discusses the frequency and duration of these modes and the emissions generated are quantified. 3.2.l Maneuvering to Avoid Hazards
Maneuvering to avoid hazards is required by legal obligations for ships to take action when risk of collision exists. Risks are compounded by changing current conditions, reduced maneuverability at low power levels, and narrow traffic lanes caused by dredging limits, obstructions
or small craft, particularly sailboats, which have the right-of-way over steamships. During emergency maneuvering, the sole concern of the crew is the safety of the ship -- this is mandated by law. When maneuvering to avoid collision, safety requires that full attention be given to following propulsion orders from the bridge.
Power fluctuations required for maneuvering will cause rapid changes in demand for fuel, air, and water to the boilers. The rapidity with which these changes can be made depends upon the rate of change of steam demand, and the type of control system in use. As a general rule, bridge-operated, automated, solid-state boiler control systems will give the fastest and most accurate (least emissions) response. During rapid
3-5
load changes, these systems have built-in safeguards to prevent fuel-rich mixtures from occurring in the furnace. This is accomplished by employing
limits in the fuel and air flow control loops. The limits work in such a
manner that during increased loads, fuel flow cannot exceed the available
air flow and during decreasing transients, air flow cannot be reduced
below the lowest controllable fuel flow.
Older, less sophisticated automatic control systems and manually
operated boiler systems are less likely to be capable of adjustments to
sudden changes in steam demand without a brief period of less than the optimum air/fuel ratio. Even though standard operating procedure dictates
that the fuel flow will be reduced before air on decreasing demand and air
supply be increased ahead of fuel flow on increasing demands, improper
combustion conditions can occur. As a consequence, excessive emissions are likely to be generated until the boiler controls are adjusted to the
proper points and the combustion conditions stabilize. The emissions
situation will be aggravated if the changes are made too rapidly.
Propulsion changes during maneuvering, including emergencies, are made by controlling steam flow to the propulsion turbines. Safety
interlocks/alarms prevent directing steam to the astern turbine and the ahead turbines at the same time. Shifting from ahead to astern will cause
a momentary drop in boiler load while passing through zero propulsion
steam demand, followed by an increasing boiler load as astern power is
applied. This procedure can also cause unsteady combustion conditions and
excessive visible emissions.
3.2.2 Emergency Boiler Shutdowns
Emergency boiler shutdowns are unusual occurences taken when all preventive measures have not eliminated a casualty. Casualties requiring
inmediate shutdown include failure of the boiler and boiler auxiliaries
and fires in the engineering spaces. Although boilers are subject to
annual inspections to detect and, thus, correct problems and prevent
failure during use, the possibility for such failures still exists.
Boiler material failures could include a tube failure due to localized corrosion or overheating, refractory failure from thermal stress, or fire
or explosion in the economizer or stack due to accumulation of soot. These risks are reduced by close attention to water chemistry, using
3-6

proper operating procedures, conducting routine inspections and maintenance, and cleaning the firesides.
Shutdowns can also become necessary as a result of the failure of equipment integral to the operation of the boilers. This would include such components as the induced or forced draft fans, fuel feed system, boiler feedwater pumps, steam pressure regulating equipment or combustion control system. Loss of lubrication can cause bearing failure and result in the shutdown of any pump or blower. Loss of feedwater or air flow will require immediate shutdown. An electrical or pneumatic failure can
similarly affect the boiler if the boiler control system malfunctions. r U.S. Coast Guard regulation NVIC 1-69 requires that any failure of the
burner management or flame safety systems on an automatic boiler result in shutting off the fuel supply.
Another emergency requiring the immediate shutdown of the boilers waJld be a fire in the engineering spaces. In such an unlikely event, primary attention is given to fighting the fire. Fuel and air feeding the fire are restricted by all possible means, and machinery such as boilers and other propulsion equipment would be shut down as rapidly as possible in the event the space must be abandoned.
Any equipment failure eventually leading to an emergency boiler shutdown could produce improper combustion conditions and consequently, excessive emissions. In automated systems, the shutdown will occur rapidly and emissions would be of short duration. The emissions generated as a result of equipment failure in a manually operated system may be more intense and of longer duration since operator response time is likely to be longer than for an automated system. In either case the most visible emissions would result from a failure of the air flow system and the
subsequent brief period of 11 air-starved 11 combustion prior to the fuel being cut off.
3.2.3 Government Testing Commercial and naval vessels undergo routine inspections by the
U.S. Coast Guard and Navy, respectively. Tests required on naval vessels are somewhat similar to those required by the U.S. Coast Guard, therefore this discussion will primarily focus on tests required by the U.S. Coast Guard. Since naval vessels burn distillate fuel (i.e., DFM) and represent a minor fraction of the vessel visits in most California harbor areas,
3-7

excessive emissions generated as a result of U.S. Navy mandated tests is
considered to be minimal except in San Diego where military vessel traffic
is considerable. Coast Guard tests that could directly or indirectly
affect combustion emissions include any test dealing with the boiler,
propulsion system, or some auxiliaries. Specific tests that most often
affect visible emissions are: 1) automation testing of boiler firing and safety controls, 2) safety valve setting, 3) sea, bay, or dock trials on
new or repaired vessels, and 4) full-load or overspeed protection testing
of equipment (reference 3-3).
All boiler control safety shutdown devices must be demonstrated on
manual and automated systems. These include high/low water level alarms, loss of air draft and loss of flame. The tests require that the failure
of each of these components be simulated and the boiler be shutdown. For
these tests, erroneous signals are fed to the boiler system controls with
the intended consequence of discontinuing the fuel flow to the burners.
After a specific component or function is successfully tested and the
boiler is shut down, it is relit for the testing of another component.
The repeated shutdown and relighting of the oil burners can result in
brief periods of visible emissions. Safety valve testing requires varying the firing rate to produce
steam pressure sufficient to lift each valve. The number of trials necessary to danonstrate proper operation and to adjust improperly set
valves depends upon accuracy of the initial lift pressure settings and the duration of the firing rate fluctuation. Again, brief periods of
excessive visible emissions can be generated because of the unstable combustion conditions.
The above described tests and other tests which may affect the
boiler, boiler auxiliaries, and propulsion system may be required in special situations. New or rebuilt ships undergoing sea or bay trials and
ships undergoing shipyard repair work are subjected to test procedures
which can cause brief periods of excessive emissions. In addition,
hydrostatic testing of the boiler and inspection of the firebox for
structual integrity and internal deposits requires that the boiler be secured to obtain access. Upon completion of these tests and inspections, the boiler is relighted, again possibly generating excessive emissions for a brief period.
3-8

The objective of each Coast Guard mandated test is to ensure proper operation, reliability and safety to the crew and the vessel. As vessels differ, the test procedures differ. The Coast Guard inspector witnesses tests conducted by the crew of the vessel. Their procedure is dictated by vessel design, safety considerations and good marine practice. In the case of automated systems, a written procedure is submitted to the Coast Guard, and upon approval is used by the vessel crew to test the systems.
These tests are normally conducted at least once each year on U.S. Flag Vessels. Passenger vessels may have tests conducted every 3 months. Vessels undergoing repair due to casualties or other reasons could require more frequent testing. The duration of each test procedure varies, again due to the vessel design, age, condition, degree of automation, and crew familiarity with the specific test being conducted.
3.2.4 Cold-Boiler Light Offs Boiler light offs are defined as the collective manually and
automatically initiated operations required to bring a marine boiler on line. This operation occurs at pierside locations either in conjunction
with the normal port visits required for cargo or passenger loading/unloading or in shipyards after repairs have been completed. Virtually all vessels, regardless of the type or sophistication of their boiler control system, conduct this procedure using manual controls. This procedure presents the operating personnel with more problems than during most other operational modes. During light off, the boiler can be severely damaged by overfiring, uncontrolled fuel oil fire in the furnace, failure to maintain an adequate flow through the superheater, furnace puffs, or major explosions. Boiler light offs can also result in the generation of excessive visible emissions.
There are essentially two types of boiler light offs; a cold-boiler light off and a normal boiler light off. The cold-boiler light off occurs on a vessel with no shipboard systems in operation, commonly referred to as a 11 dead 11 ship while the boiler is referred to as being 11 cold iron 11
•
This light-off condition frequently exists on a ship which has been at a shipyard for repairs but can also occur at other locations if all the boilers have been secured. The normal boiler light off occurs on ships with at least one boiler operating or when shore steam is available. This
3-9

situation frequently occurs when a vessel has been dockside for a
relatively short time but has secured any unneeded boiler(s).
For normal light offs on ships equipped with twin-fluid burners,
the fuel oil atomizers are fitted with steam-atomizing wide-range tips. This combination can only be used when one operating boiler is providing
steam and electrical power or the ship is at a location where shore steam
and electricity are available. As mentioned earlier, modern commercial
marine boilers are fired with heavy residual fuel because of its
availability and low cost. This fuel requires preheating prior to being
atomized and combusted. Using steam from the online boiler, residual fuel
is heated in the service tanks and then pumped to the fuel oil heaters
where it is again heated to the optimum atomization temperature
(i.e., viscosity). The fuel is then piped to the fuel oil header
(or manifold) on the burner front. A normal light off using residual fuel is carried out in the following general sequence:
1. Check and set boiler water levels
2. Start forced draft fan to purge furnace
3. Maintain steam flow through the superheater until boiler is online
4. Circulate fuel oil through fuel oil heaters and burner manifold 5. Raise fuel oil temperature
6. Connect and insert atomizer into furnace
7. Adjust air draft and fuel oil pressure
8. Initiate atomizing steam fl ow
9. Initiate fuel oil flow
10. Imnediately ignite fuel with burner ignition system or hand torch
11. Stabilize flame
12. Adjust fuel flow so that steam pressure rises according to
manufacturer's recommendations
13. As the steam pressure increases and combustion stabilizes,
additional burners may be lit
When no atomizing steam or air is available for a cold-boiler light
off under dead plant conditions, distillate fuel is recommended and the procedure varies from that of the normal light off. Electric power is
provided by the auxiliary diesel generator or shore power until such time
3-10

as the boiler is producing sufficient steam to run the turbine-driven auxiliary generators. To light off a cold boiler there must be sufficient electrical power to run the light-off oil pump and a combustion air fan. A cold-boiler light off using distillate fuel is conducted in the
following general sequence: 1. Check and set boiler water levels 2. Drain residual fuel from burner lead piping 3. Assemble burner with mechanical atomizer or twin-fluid atomizer
using compressed air 4. Start forced draft fan to purge furnace 5. Adjust air draft 6. Initiate distillate fuel flow 7. Immediately ignite fuel with burner ignition system or hand
torch 8. Stabilize flame 9. Raise steam pressure according to manufacturer's
recommendations and maintain normal water level 10. Prepare steam atomizing burner 11. When steam is available, supply heat to fuel tanks and heaters 12. Circulate fuel oil through fuel oil heaters and burner manifold 13. Connect and insert atomizer into furnace 14. Secure light-off burner firing distillate fuel 15. Purge furnace 16. Light off residual fuel oil burner as in steps 7 through 11 of
the normal light-off procedure 17. Remove distillate fuel light-off burner and secure light-off
fuel oil service pumps
18. Continue to raise pressure in accordance with manufacturer's recommendations
The cold-boiler light-off procedure for commercial vessels is generally similar to that used for a normal light off except that distillate fuel and a straight mechanical or twin-fluid atomizer using compressed air is used in one burner port until sufficient steam is available to preheat the residual fuel. Since distillate fuel is currently burned as a matter of routine on naval vessels, there is no need to preheat the fuel. However, since approximately half of the Navy's
3-11

ships are equipped with steam-atomizing burners, there is a need for steam
during light off. As in the case of commercial vessels, this steam is
supplied by the online boiler or from shore facilities.
After ignition and during the period when the boiler is being
warmed up, the operator adjusts the draft air pressure to produce a
visually acceptable flame and exhaust gas. Control of the boiler during this period is primarily performed at the boiler or burner front. The
appearance of the flame and exhaust gas is used as a primary indicator of
proper combustion. On most ships the uptake is fitted with an electric
light, peepholes and periscope to aid the operator in observing the
exhaust gases. Normally the operator will adjust the boiler controls to
produce a light brown smoke. On ships fitted with automatic combustion
controls, Coast Guard regulations require that an opacity monitor be installed which will sound an alarm at the propulsion control station when
the exhaust gas opacity exceeds a preset limit. In addition to opacity
monitors, some combustion systems are equipped with oxygen analyzers. It
is difficult to assess the extent to which opacity monitors and oxygen
analyzers are currently in use aboard ships calling on California ports.
Vessels built after the mid-1960's have generally included opacity
monitors and some older ships have been retrofitted. The majority of
steam-powered ships still control light off by visual observation of the
stack conditions.
The period from initial light off to when the boiler is producing
steam at sufficient pressure to bring it online varies according to system
design and operating procedure but can require up to 4 hr. During this
operating mode, there are any number of specific actions which may cause
transients in the combustion conditions and thus momentarily generate
excessive particulate (i.e., visible) emissions. Such actions include
burner light offs, air and fuel flow adjustments, burner cycling, burner
sequencing, manual to automatic control switching and system
malfunctions. It should be noted that in the past, some boilers have been
lit off by alternately lighting and securing a single burner in order to
regulate boiler temperature and steam pressure (i.e. burner cycling). At
present, this practice is being used with less frequency partly due to the almost exclusive use of wide-range burners. In addition, burner cycling
increases thermal shock to the furnace materials and increases the chances
3-12

of excessive emissions being generated.
Aside from the previously cited actions which may upset the combustion process, excessive emissions can also result from numerous
operator-controllable factors. These include the following: t Poor atomization of fuel oil caused by:
Dirty atomizer tips Incorrect fuel oil temperature, usually too low Fuel pressure too low Incorrect or no atomizing spray pressure when firing with steam assisted atomizers Wet atomizing steam Plugged passages in steam-atomizing spray plate
No tip Unequal distribution of fuel or combustion air to burners:•
Root valves of individual fuel oil burners throttled; kinked or dented fuel oil branch lines Air register openings not uniform, (warped venturi housing)
Diffuser badly carboned Air leakage through a register not in service
Register not fully open Air register faults:•
Dirty, warped, or broken register sleeve draw rods Linkage between operating handle and air sleeve, broken or adrift
3.2.5 Operations Required to Dry Wet or Green Refractory During operation of a marine boiler, deposits of ash or slag may
build up on the external heat transfer surfaces (i.e., firesides) in the furnace. When the deposits seriously reduce the efficiency of the boiler, they must be removed through hand cleaning or high-pressure water washing. During washing, exposed refractory surfaces will become wet and must be dried. Similarly, during operation of a marine boiler, degradation of the refractory will occur to a point where repairs are necessary. The newly replaced or applied refractory, called 11 green 11
refractory, must be dryed or cured to effect maximum strength and durability during operation.
3-13

Drying Green Refractory
The gas-tight enclosure for a boiler can be formed by eithe~ welded
boiler tubes (a membrane-wall or waterwall construction) or by
refractories. Marine boilers typically contain varying amounts of refractory and welded membrane-wall. In a marine boiler where the
encl1sure is constructed completely of waterwalls, refractory is used for water tube backing, furnace header corbels (supporting projections or
baffles), burner throats, and other areas, e.g. soot-blower penetrations, where the wall must be interrupted. In other, usually older, designs
refractory will be used for furnace walls and floors. Several factors influence the service life of refractory materials:
Their location in the furnace• Boiler design• Position of burners with respect to walls• Flame length• Fuel type• Other operating conditions•
Additional factors which affect service life are quantity and composition
of fuel ash (particularly vanadium and sodium oxide content), rate of heat
release, furnace temperature and atmosphere, and the amount of mechanical
and thermal abuse, e.g. rapid changes in furnace temperatures.
Maintenance of refractory in boilers is required for safe and economical boiler operation. Poorly maintained refractory can result in
excessive heat loss to the fireroom and the leakage of combustion gases into the fireroom. Inadequate refractory can also result in overheating
of boiler tubes resulting in tube failure and boiler shutdown.
Minor refractory repairs are usually made every 6 to 12 months to
those regions subject to mechanical abuse such as peep holes and burner openings. Repairs to the walls and floor in the form of patches or
replaced brickwork are needed every 12 to 36 months depending on the age
of the boiler; 24 to 36 months is common for newer ships. This is true
for both commercial and U.S. Naval vessels. Major refractory repairs occur only as the result of boiler explosions, flarebacks or, in the case
of U.S. Naval vessels, scheduled overhauling every 5 years. Because of economic considerations, commercial vesels do not generally schedule
routine overhauls.
3-14
Refractory repairs are performed by firms having specialized knowledge and training. Table 3-1 lists the California firms that perform
this work and the annual number of boilers repaired. For minor repairs, the firms located in the major port areas dispatch crews to the berthed vessels whether at dockside or in shipyards. Occasionally repair crews are transported by water taxi to ships at anchorage. Ships requiring extensive refractory repair are relocated to shipyards where the repair work is completed, usually in conjunction with other needed maintenance.
A three to seven man crew is usually employed to make the repairs after the boiler has cooled, approximately 12 to 24 hr after shutdown. Plastic refractory material is usually used to patch walls and corbels although castable refractory can also be used for corbel repair. If the original refractory surface, i.e. floors and walls, were constructed of brick and extensive damage has occurred, similar brick will be used as replacement material. Major rebuilds usually require completely removing the old refractory and replacing it with green (uncured) materials as in minor repairs.
Upon completion of repairs, the green refractory must be cured. Newly installed castable refractory should first be air cured for 24 to
48 hr; plastic refractory and brickwork do not require air curing. The ideal curing procedure requires slow baking. This is accomplished by lighting off one burner at the lowest firing rate possible for approximately 1 hr. Then, the firing rate i~ increased until boiler operating pressure is reached in 3 to 4 hr. On vessels not equipped with wide-range burners, capable of maintaining a stable flame at low firing rates, the burners must be repeatedly cut in and out to prevent thermal stressing of the refractory. At this time the refractory will be adequately dry. Castable refractory materials will have moderate strength, plastic refractory will have less. To develop strength, the furnace temperature is increased gradually by cutting in additional burners. Final firing at full boiler load is desirable. Total duration of the slow bake is approximately 12 hr. Small areas of plastic or castable refractory, such as around a peep hole need not be baked as slowly as described. Complete rebuilds, on the other hand, require much longer baking and many involve cyclical cutting in and out of burners each
3-15

Table 3-1. Sunrnary of California Marine Boiler Refractory Repair Firms
Port Area Number of
Repair Firms
Annual Number of Jobs
Tota·i U.S. Flag Foreign
u. s. Navy
San Francisco/Oakland
DEE Engineering J.T. Thrope & Son Inc.
2 104 59 2 43
Los Angeles/long Beach
J.T. Thorpe Inc.
1 20 N/A N/A N/A
San Diego
Fraser's Boiler Marine Boiler
2 21 0 0 21
N/A -- Distribution data not available
3-16

day, a few days per week, for up to 5 weeks both to cure the refractory and to test boiler operational systems.
The drying of green refractory in new ship construction is very
similar. A typical drying procedure involves lighting one burner using distillate fuel. During the 12 hr the boiler is online, burners are
rotated to ensure even heating of the boiler and its refractory. This procedure will be repeated for 3 to 4 weeks prior to sea trials to ensure
maximum refractory strength and durability, and proper boiler operation
and control. While U.S. Naval vessels strictly follow curing procedures similar
to that described above, commercial vessels for economic reasons cannot afford the time required for ideal refractory curing. Curing is effected during normal or cold-boiler light offs which may result in less than
optimum strength and, in the long run, more frequent repair. Visible emissions which result during the drying of green refractory, therefore,
are similar in magnitude and duration to those generated during boiler light offs and the drying of green refractory becomes a variation of a
normal or cold-boiler light off, as described in section 3.2.4. Drying of Wet Refractory
The marine boiler contains varying amounts of refractory which may become wet during the water washing of firesides which is essential to
proper and economical boiler operation. Deposits of soot, scale or slag on the tubes seriously reduce the efficiency of the boiler and contribute
heavily to failure of materials such as superheater support plates, heat-resisting seals, baffles, protection plates, and soot blowers. These deposits act as an insulating material preventing heat from the furnace and combustion gases from being conducted through the tubes to the water. Blocking of gas passages through the boiler may cause additional heat loss. This blocking of normal passages may increase gas temperature and
velocity (gas laning) over protection plates, baffles, and seal plates resulting in earlier than normal failure of these materials. Although
daily soot blowing will remove the deposits, in extreme conditions, the deposits can build up to a point where hand cleaning of firesides is required. Wire-brushing is recommended for hand cleaning because it is effective and will not harm the tubes. However, further steps, such as
water washing, may be necessary to clean the boiler.
3-17
Factors contributing to the buildup of deposits that would require
water washing are similar to those affecting refractory service li~e: the
boiler design, arrangement and spacing of superheate: tubes, type of fuel,
and operating conditions. Particularly inflt,;.2ntial are the quantity and
composition of -fu.~l ash, especially vanadium, sodium, and sulfur oxide
conte;1t~,. Depending on the quality of the fuel, water washing of
firesides may be required as often as every 3 to 4 months for commercial
vessels which burn resid~al oil. For economic reasons, water washing
frequently is performed at overseas ports. U.S. Naval vessels which burn distillate fuel, DFM, seldom require water washing.
Water washing is performed by firms that specialize in fireside and
waterside cleaning. A listing of the firms in California that perform
this work and the annual number of jobs performed is summarized in
table 3-2. The firms located in the major ports dispatch crews of three to five men to the ships located at dockside or in shipyards. Cleaning
must begin after the boiler is cooled and generally is completed in 8 to
16 hr.
It is recommended that the boiler be dried by firing as soon as
possible after water washing. Immediately upon completion of water
washing, all excess water is drained from the boiler. Any remaining
deposits on drums, in casing corners, and refractories are mechanically
removed. The boiler is closed and one burner lit off using normal lighting
off procedure. Firing is continued at a low rate for 3 to 5 hr. It is
recommended that burners be rotated to ensure all parts of the boiler are heated equally. During the drying out period, superheaters should be
protected by steam flow to some low capacity demand load such as protection steam or bleeding to the bilge and auxiliary exhaust line, or
by steaming the boiler to an idling generator. By far the most satisfactory method is steaming to a generator plus using drains to bilge
or auxiliary exhaust lines.
After the drying period, it is advisable to secure the boiler and
open the furnace for inspection of the refractories. Particular attention
should be given to the refractory corbels, to detect any signs of
shrinkage or damage caused by too rapid evaporation of the water. Subsequently, when firing the boiler while underway, a close watch should
be kept until it can be verified that no damage has occurred to the
3-18

Table 3-2. Results of Fireside Cleaning Survey
Port Area Number of
Repair Firms
Annual Number of Jobs
Total U.S. Flag Foreign
u. s. Navy
San Francisco/Oakland
• IT Corporation • Cleaning Dynamics • H&H Ship Service • Triple A Shipyard
4 57a 51 0 6
Los Angeles/Long Beach 0 -- -- -- --
San Di ego
• Cleaning Dynamics
1 12 0 0 12
aone firm was unable to present an estimate of annual jobs
3-19

refractories. If, after drying, the boile~ is to be idle for a few days,
it is advisable to spray it with metal conditioning compound, to prevent
corrosion of exposed metal surfaces.
During the period when wet refractory is being dried through
minimum operation of the boiler, excessive (i.e., visible) emissions may
result from the initial boiler light off and burner rotation. The causes
of visible emissions from these actions are similar to those described in
section 3.2.4. Most visible emissions are caused by boiler light offs in
commercial vessels. These vessels fire the heavy residual fuels responsible for emissions during burner rotation and do not follow a slow
drying schedule. They generally will light off and fire the boiler at a
rate which will allow them to sail as close to their scheduled departure
time as possible. U.S. Naval vessels which follow a strictly defined slow
drying schedule and burn distillate experience significantly fewer periods
of excessive emissions upon burner rotation. Therefore, the drying of wet
refractory becomes basically a variation of a normal or cold-boiler light
off depending on whether the second boiler is operational.
3-20

SECTION 3 REFERENCES
3-1. 11 Steam -- Its Generation and Use", Company, New York, NY, 1978.
39th edition, Babcock and Wilcox
3-2. Hansen, A.G., et al., "Applicability of Shoreside Air QualityEmission Laws to Merchant Vessl es in Port," prepared by Chi Associates, Inc., for the U.S. Maritime Administration, MA-RD-92O-79O55, July 1979.
3-3. Personal Communication -- Letter from James H. Oliver, U.S. Coast Guard, San Francisco, CA, to A. W. Wyss, Acurex Corporation,Mountain View, CA, May 7, 1981, (Coast Guard test requirements).
'C
3-21

SECTION 4 PARTICULATE EMISSIONS FROM MARINE OPERATIONS
This section describes the methods used to establish the quantitative extent of particulate matter emitted from vessels while in California ports. Results of this inventory are also presented. The emission estimation procedure used was similar to that used for a previous study conducted for the U.S. Maritime Administration titled "Applicability of Shoreside Air Quality Emission Laws to Merchant Vessels In Port. 11
Particulate emissions were estimated for the normal inport operation modes and for the five exempted modes.
To estimate the inport vessel emissions, fuel consumption was calculated for the various vessel types during different operating modes. Fuel consumption was then summed for all vessel types in each port. Emissions were estimated by multiplying fuel consumption by particulate matter emission factors. To obtain the most useful and realistic estimate of both normal and exempted mode emissions, it was necessary to consider steam and motor vessels separately. Ship types considered were passenger, dry cargo (includes container, Ro-Ro, LASH, bulk carrier, and general cargo carriers), tankers, tugs/tows and military.
The quantification of air emissions during normal and exempted operations was limited to an estimation of particulate matter generated by the canbustion of residual oil and diesel fuel while vessels were in the confines of the port or harbpr area. No attempt was made to estimate canbustion-generated par-ti cul ate matter emitted as a result of all movements within California coastal waters. This has been performed for calendar year 1976 and is reported in reference 4-1. The scope cf the inventory was also limited to the port areas of the San Francisco Bay, Los Angeles, San Diego, Ventura County, and San Luis Obispo County. Ports in these areas account for the bulk of California maritime activity and
4-1

represent the areas where the exempted operating modes are most likely to
occur. Vessel movement statistics were generally available for these
areas.
The inventory was also limited by vessel type. Commercial and military vessel operations were compiled along with those of tugs used in
the movement of cargo between ports. Emissions generated by intraport tug
assistance activities, passenger ferries, and the movement of s~all
commercial vessels used for fishing and offshore drilling have not been included.
4.1 EMISSION INVENTORY INPUT DATA: NORMAL OPERATING MODES
4.1.1 Ship Visits
The initial step in inventorying vessel particulate emissions during normal inport operations consisted of collecting vessel movement
statistics for the port areas under study. The San Francisco and
Los Angeles Marine Exchanges, the San Diego Unified Port District and the
Ventura and San Luis Obispo Air Pollution Control Districts served as the primary sources for this information.
The Marine Exchange of the San Francisco Bay Region logs each
vessel that arrives and departs via the Golden Gate. Detailed information including the vessel name, flag, vessel type, and times of arrival and
departure is recorded. Interbay movements are not noted by the Marine
Exchange. In addition to the detailed daily log of ship movements, the
Marine Exchange prepares monthly and annual summaries of ship visits by
flag and generic type. Similar information regarding coJ11Tiercial vessel visits to the ports of Los Angeles and long Beach is collected by Marine
Exchange of Los Angeles-Long Beach Harbor, Inc. A summary of the number of annual vessel visits by ship type was
given in table 2-2 and is reproduced here as table 4-1 for convenience. The majority of the tabulated information is for 1979; however, since a
complete accounting of all visits in 1979 by each vessel category was not
available, supplemental information for other years is reported. It
should also be noted that the reported data, specifically as it relates to the distribution of visits by steam- and motor-powered vessels, was not obtained by reviewing the detailed 1979 daily logs of ship visists. The
San Francisco Bay Area steamship/motorship distribution was based upon a
review of the 1976 ship traffic analysis performed by O.V. Reardon and
4-2
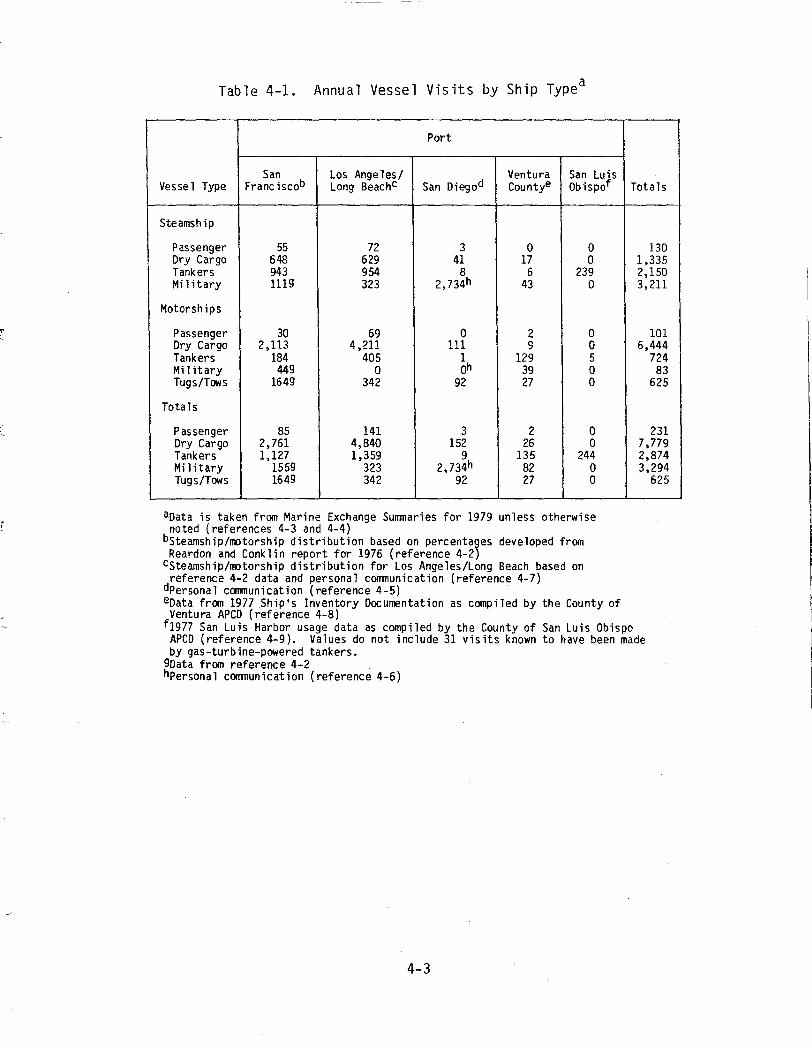
Table 4-1. Annual Vessel Visits by Ship Typea
Vessel Type
Port
Totals San
Franciscob Los Angeles/Long Beachc San Diegod
Ventura Countye
San Luis Obispo
Steamship
Passenger 55 72 3 0 0 130 Dry Cargo 648 629 41 17 0 1,335 Tankers 943 954 8 6 239 2,150 Military 1119 323 2,734h 43 0 3,211
Motorships
Passenger 30 69 0 2 0 101 Ory Cargo 2,113 4,211 111 g 0 6,444 Tankers 184 405 1 129 5 724 Military 449 0 oh 39 0 83 Tugs/TCMs 1649 342 92 27 0 625
Totals
Passenger 85 141 3 2 0 231 Dry Cargo 2,761 4,840 152 26 0 7,779 Tankers 1,127 1,359 9 135 244 2,874 Military 1559 323 2,734h 82 0 3,294 Tugs/TCMs 1649 342 92 27 0 625
aoata is taken from Marine Exchange Sunmaries for 1979 unless otherwise noted (references 4-3 and 4-4)
bsteamship/motorship distribution based on percentages developed from Reardon and Conklin report for 1976 (reference 4-2)
csteamship/motorship distribution for Los Angeles/Long Beach based on reference 4-2 data and personal cornnunication (reference 4-7)
dpersonal communication (reference 4-5) eoata from 1977 Ship's Inventory Documentation as compiled by the County of Ventura APCD (reference 4-8)
f1977 San Luis Harbor usage data as compiled by the County of San Luis ObispoAPCD (reference 4-9). Values do not include 31 visits known to have been made by gas-turbine-powered tankers.
90ata from reference 4-2 hPersonal communication (reference 4-6)
4-3

C.S. Conklin (reference 4-2). The Los Angeles/Long Beach
steamship/motorship distribution was primarily developed from the South
Coast Air Quality Management District's 1979 emissions inventory. 4.1.2 Vessel Powerplant Size
The ship visit information as collected by the marine exchanges and
local air pollution control districts was used to estimate the size of typical propulsion plants installed in the various vessel types which call
upon each port. This information, along with the power factor for each
mode of operation and the specif1c fuel consumption rate, was then used to
calculate fuel consumption. The average powerplant sizes for steam- and
motor-powered vessels calling on the five areas studied are listed in
table 4-2. These values represent an average shaft horsepower rating on a
per visit basis.
As with the port ship visit statistics, powerplant size information was developed by various authors through the review of all or a portion of
the daily port visit data. For the San Francisco Bay area, the Reardon and Conklin data collected for calendar year 1976 was compiled to yield
the desired averages. Powerplant size information for corrrnercial ships calling on Los Angeles, Long Beach, Ventura County and San Luis Obispo
County has been estimated by the regional air quality management districts
in their 1979 emission inventories. Powerplant sizes for ships calling on
San Diego were assumed to be similar to those of the San Francisco Bay Area.
Powerplant sizes for military vessels and tugboats with tows were assumed since minimal data were available in the daily logs. Military
vessels generally have at least three to four times as much installed
total power as a commercial vessel of equivalent size. Military steam
plants of 60,000 SHP and motor plants of 20,000 SHP were assumed. As mentioned earlier, the only tugboat operations included in this inventory
were those relating to the coastal movement of barges by tugs. For these
tugboats, a powerplant size of 1,000 SHP was assumed for all ports except
for Los Angeles/Long Beach where a powerplant size of 3,000 SHP was used. 4.1.3 Maneuvering and At-Berth Time
Another important input parameter to the inventory was the average inport duration for each port and class of vessel investigated.
4-4
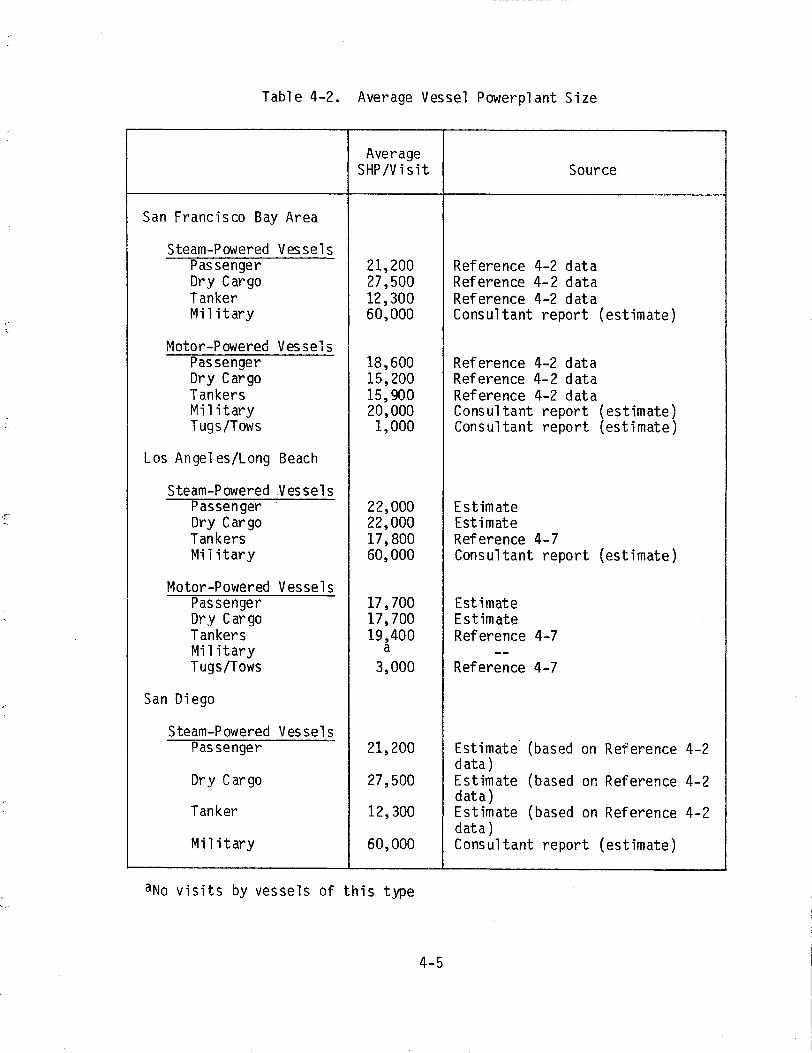
Table 4-2. Average Vessel Powerplant Size
Average SHP /Vi sit Source
San Francisco Bay Area
Steam-Powered Vessels Passenger Dry Cargo Tanker Military
Motor-Powered Vessels Passenger Dry Cargo Tankers Military Tugs/Tows
Los Angel es/Long Beach
Steam-Powered Vessels Passenger Dry Cargo Tankers Military
Motor-Powered Vessels Passenger Dry Cargo Tankers Military Tugs/Tows
San Di ego
Steam-Powered Vessels Passenger
Dry Cargo
Tanker
Military
21,200 27,500 12,300 60,000
18,600 15,200 15,900 20,000 1,000
22,000 22,000 17,800 60,000
17,700 17,700 19,400
a 3,000
21,200
27,500
12,300
60,000
Reference 4-2 data Reference 4-2 data Reference 4-2 data Consultant report (estimate)
Reference 4-2 data Reference 4-2 data Reference 4-2 data Consultant report (estimate) Consultant report (estimate)
Estimate Estimate Reference 4-7 Consultant report (estimate)
Estimate Estimate Reference 4-7
--Reference 4-7
Estimate (based on Reference 4-2 data) Estimate (based on Reference 4-2 data) Estimate (based on Reference 4-2 data) Consultant report (estimate)
aNo visits by vessels of this type
4-5

Table 4-2. Concluded
Average SHP /Visit Source
San Diego (Continued)
Motor-Powered Vessels Passenger a --Dry Cargo 15,200 Estimate (based on Reference 4-2
data)Tanker 15,900 Estimate (based on Reference 4-2
data) Military 20,000 Consultant report (estimate)Tugs/Tows 1,000 Consultant report (estimate)
Ventura County
Steam-Powered Vessels Passenger a --Dry Cargo 16,900 Reference 4-8 Tanker 18,000 Estimate Military 60,000 Consultant report (estimate)
Motor-Powered Vessels Passenger 43,960 Reference 4-8 Dry Cargo 13,424 Reference 4-8 Tanker 14,760 Reference 4-8 Military 20,000 Consultant report (estimate)Tugs/Tows 1,000 Consultant report (estimate)
San Luis Obispo County
Steam- and Motor-Powered Vessels
Tankers 17,800 Weighted average from Reference 4-9 data
aNo visits by vessels of this type
4-6

Specifically, the time when the vessel is underway in each port area and
when at-berth in an anchorage or pierside was estimated. Maneuvering time was calculated by sunming the time used for
docking and for cruising to, from, and within the harbor. The time spent cruising within the harbor was estimated based upon the total reach (distance from harbor entrance to dock) during entrance and exit of the vessel at the rate of 5 nmi/hr. Table 4-3 presents the average one-way distances scaled from NOAA nautical charts, from the harbor entrance to the center of each listed port complex. The total maneuvering time is also listed and includes two one-way trips plus 2 hr for docking and undocking the vessel during each ship visit.
The duration at berth (i.e., at dock and/or at anchor) is also an important parameter necessary for the inventory. Table 4-4 lists the average duration for the ship types and ports under study. Data for ports in the San Francisco Bay Area were developed primarily from the Reardon & Conklin report (reference 4-2) which was based upon their review of 1976 Bay Area marine exchange log. The duration of at-berth stays for vessels in other California ports was obtained from local air pollution control district information. 4.1.4 Engine Load Levels
Vessels generally operate at less than design power and speed within or near a port. Engine load level refers to the amount of power used by a vessel in various operating modes as compared to the rated power of the vessel. This factor will typically vary between 10 and 70 percent of the maximum (rated) power when vessels are operating within the confines of a port. Load levels associated with vessel types and operating modes are presented in table 4-5.
Maneuvering refers to the movement of vessels within the confines of harbor. This activity occurs during movement from the port entrance to the pier or anchorage (and the reverse) and during intraport movements. Power factors for the maneuvering of motor-powered vessels are generally higher than for steam-powered ships; their base values are estimated at 50 and 35 percent, respectively. Hoteling is the mode of operation when the vessel is at berth. Hoteling power requirements vary considerably with vessel size and type. For example, power requirements for passenger vessels are larger than for other vessels because of the power needed for
4-7

Table 4-3. Maneuvering Distance and Time
Port One-Way Distance Tr ave ledb (nmi)
Total Maneuvering Timea (hr)
San Francisco Bay Area San Francisco (passenger) Oakland (dry cargo,
6 4.4
tugs/tows 8 5.2 Richmond (tankers, military) 11.5 6.6
Los Angeles/Long Beach 3.5 3.4
San Diego
Ventura County
8 5.2
Pierpont Bay (tankers)Port Heuneme (dry cargo
10 6
and military) 4 3.6
San Luis Obispo County 11 6.4
aTotal time includes two one-way trips plus 1 hr docking and departing for each visit. Based upon a travel speed of 5 knots.
boistances developed from NOAA nautical maps unless otherwise noted. Distances measured as follows:
San Francisco Bay Area Distance measured from Golden Gate Bridge to the various Bay Area ports
Los Angeles/Long Beach -- Distance measured from San Pedro, Middle and Long Beach Breakwater to center of harbor areas
San Diego -- Distance measured from Point Loma approximately Pier 2
to
Ventura County -- Approximate distance taken as the average reach from north and southbound coastwise traffic lanes to Pierpont Bay marine teminals and Port Hueneme
San Luis Obispo County -- Distance taken as the weighted average of miles traveled within county. This has been defined by the APCD as the number of miles traveled within three miles of coast between 35°00'N and 35°40'N.
4-8

Table 4-4. Average Duration of Port Visits
r
Harbor/Vessel Type Hoteling and/or
Unloading Stay (hr) Source
San Francisco Bay Area Passenger Dry Cargo Tankers Military Tugs/Tows' !
Los Angeles/Long Beach PassengerOry Cargo Tankers Military Tugs/Tows
Ventura County PassengerOry Cargo Tankers Military Tugs/Tows
San Di ego' i Passenger Dry Cargo Tankers Military
Tugs/Tows
San Luis Obispo Tanker
24 40 45 48
No engines operating
40 40 48
Use shore facilities No engines operating
24 40 20
155 No engines operating
24 120
24 All vessels on shore powerNo engines operating
20
Reference 4-2 Reference 4-2 Reference 4-2 Reference 4-10 Reference 4-10
Reference 4-7 Reference 4-7 Reference 4-7 Reference 4-7 Reference 4-7
Estimate Reference 4-8 Reference 4-8 Reference 4-8 Reference 4-8
Estimate Reference 4-6 Estimate Reference 4-6
--
Reference 4-9
4-9

Table 4-5. Normal Inport Operating Mode Load Factorsa
Load Factor (percent of main eng1ne rated power)
Operating Mode Steamship Motor Vessel
Maneuvering
Passenger Dry Cargo Tankers Military Tugs/Tows
55 35 43 15 --
'
55 50 58 35 80
Hoteling and/or Unloading
Passenger Dry Cargo Tankers Military Tugs/Tows
32 12 25 10 --
3zb 12b 25b 10b 0
aReference 4-1 bExpressed as a fraction of the main engine's maximum power rating
4-10
space conditioning, electrical demands, etc. Motor-powered vessels are usually equipped with small boilers and/or auxiliary diesel generators that are usually sized at approximately 12 percent of the main engine's
rated power. Thus, a 12 percent power factor has been estimated as the base power requirement for hoteling (reference 4-1).
Additional power may be required for specific vessel types while undergoing inport activities. Tankers use a portion of their rated power for cargo heating depending upon the type of petroleum cargo carried. This usage has been estimated at 8 percent. For a portion of the inport time, tankers are unloading their cargo and thus power is required for this operation. This power requirement has been estimated at 25 percent with the unloading operation taking one-fourth to one-half of the at-berth time. The weighted hoteling, cargo heating, and cargo unloading power demand for tankers is estimated at 25 percent of rated power. As mentioned earlier, passenger vessels have an additional power requirement caused by heating, cooling, and lighting demands. This has been estimated at 20 percent, thus maneuvering and hoteling power requirements for steam passenger vessels are 55 and 32 percent, respectively. (See reference 4-1 for a more detailed discussion of power factors.) 4.1.5 Fuel Consumption Factors
The quantity of pollutants generated is estimated based upon fuel consumption. The operational parameters and movement statistics detailed in the foregoing sections along with fuel consumption rates are necessary to calculate fuel consumed as a result of inport activities. This quantity can be estimated by tabulating each vessel movement and determining the corresponding fuel consumption rate as published for that vessel in Lloyd's Register of Shipping and/or Clarkson's Tanker Register. In lieu of this time-consuming procedure, a generalized approach using specific fuel consumption factors was used for this study. Through the use of a specific fuel consumption factor, fuel consumption for steam- and motor-powered vessels of different powerplant ratings and modes of operation were calculated. This section describes the basis of these generalized factors. Steamships
Figure 4-1 presents trends in specific fuel consumption (i.e., weight of fuel consumed per unit power per hour) as a function of steam
4-11

0.65
~ ' ~s....
..s:: ~
-I
CL :::r:: ~ V)
..0 450 psig/750°Fr-
0.60 s:: 0 ...... .µ .0...
= ::::l (/)
C 0 u
(lJ 0.55
::::l 4--
u ...... 4--
u (lJ 0.. (/) 850 psig/950°F Q.)
0.50(/)
0 0.. s.... ::s 0.. I
r-r-,:::i::
0.45 0 5 10 15 20 25
Main propulsion SHP (thousands)
Figure 4-1. Specific Fuel Consumption for Steam-Powered Merchant Vessels (Trends Over the Past Several Decades) (Reference 4-11)
4-12

pressure and temperature ratings for post-World War II steam boilers. A statistical analysis of the world merchant fleet indicates the average age of foreign flag vessels is 12 years and that of U.S. vessels is 15 years. The most representative steam plant cycle for currently operating equipment is the 600 psi/850°F single economizer cycle representative of ships constructed in the late 1950 1 s to the mid-l960's, and the 850 psi/950°F cycle for ships built up to the mid-1970's. Figure 4-2 illustrates the specific fuel consumption as a function of boiler load for 1965 and 1975 steam vessels. The curve for a typical 1965 plant was used for all calculations of average vessel fuel consumption except for tankers. Since the tanker fleet operating in California waters was felt to be newer, a specific fuel consumption factor for vessels approximately 10 years old was used. Motors hips
Motorships with sl°"'- and medium-speed engines can use blended fuel oils in their main propulsion systems when cruising at sea. Auxiliary diesel generator sets require light diesel oils during all operating conditions. For this reason motorships are generally fitted with dual fuel systems. However, while in port most of the motorship's fuel consumption can be attributed to using marine diesel oil in the auxiliary electric generator engines. It was assumed that all inport motorship operations were performed using marine diesel oil.
In addition, motorships are equipped with auxiliary boilers used to generate steam. These boilers can be fired with either residual or distillate fuels or main engine wasteheat in addition to residual or distillate fuels. The auxiliary boiler is generally fired while the vessel is maneuvering, moored, or at dock. While the vessel is moored or at dock the main diesel propulsion is cut off, with only the auxiliary boiler and diesel generators in operation to provide power for hotel services and cargo handling. While vessels are unloading, they have at least two diesel generators online, the load factor fo~ each being about 65 percent. When providing hotel services, the vessel utilizes electric power and steam from one auxiliary diesel generator and one auxiliary boiler.
Figure 4-3 represents the all-purpose specific fuel consumption for motorships. The auxiliary boiler and generator engine consumption are included in the upper curve shown. This latter curve was used to estimate
4-13

0.60
0.59
0.58 s..
.s::. I
0.57 Cl.. :r: c.n- 0.56..0 ,-
s::: 0.55 0
.µ 0. E 0.54 :::s (/)
s::: 0
0.53 u ,-QJ :::s 0.52
4--
u .,.... 0.51 4--.,.... u QJ 0.50 0. (/)
QJ 0.49(/)
0 0. s.. :::s 0. 0.48 I
,..... <::( 0.47
0.46
0.45
t-J ~ ~ \)
l\l ""'-
0 10 20 30 40 50 60 70 80 90 100
Boiler load -- percent of rated power
Figure 4-2. Marine Steam Plant All-Purpose Specific Fuel Consumption (Reference 4-11)
4-14

' ,r
C 0 .,... .µ 0.. E :::::l 1/1
'-- C 0 u
,.,, .. Cl) :::::l 4-
u .,... 4-.,... u QJ 0.
V)
0.38
0.37
0.36
0.35
0.34
0.33
0.32
0.31
0.30
engine and auxiliary genrrator
engine only
~ ~ t\)
't
0 10 20 30 40 50 60 70 80 90 100
Load (percent)
Figure 4-3. Main Diesel Plant All-Purpose Specific Fuel Consumption(Reference 4-11)
4-15

the part-load specific fuel consumption of motorships in the maneuvering
mode and represents consumption factors typical of vessels 5 to 10 years old. Fuel consumption for motorships while hoteling and/or unloading
cargo was estimated by using the load factors listed in table 4-5 and the main engine consumption curve of figure 4-3. At dockside, motorships are
generally more fuel efficient than steamships due to the fact that they
operate auxiliary engines near rated capacity. Motorships are estimated
to use 50 percent as much fuel in port as steam plants. Military Vesse1s and Tugboats
The specific fue·1 consumption for both military steamships and
motorships was assumed to be the same as that used for commercial
vessels. Military vessels, however, will generally have at least three to four times as much total power as a commercial vessel of equivalent size.
Thus, higher shaft horsepower amounts were used in calculating fuel consumption for those vessels. Fuel consumption figures for average
military steam plants of 60,000 SHP and average motorships with 20,000 SHP
were used in developing the inventory.
For tugboats, the average power was assumed to range from 1,000 to 3,000 SHP depending upon the port. Only fuel consumption (and emissions)
for maneuvering were estimated, since tugs with tows typically do not
operate their engines at dockside for hotel or cargo unloading functions.
A specific fuel consumption factor of 0.38 lb/SHP-hr and a power factor of
80 percent were used to calculate fuel consumption during maneuvering.
For tugs under tow with powerplant sizes of 1,000 and 3,000 SHP, fuel consumption was estimated at 304 and 912 lb/hr, respectively (43 and
130 gal/ hr) .
4.1.6 Particulate Emission Factors
The particulate emission factors that were used in the development of the inventory for fuel combustion in steam- and motor-powered vessels
are listed in table 4-6. The factors selected are essentially the same as
those published by the EPA in 11 Compilation of Air Pollutant Emission
Factors 11 (AP-42, reference 4-12). Thes2 factors were reviewed and compared with numerous references (e.g., references 4-1, 4-11, 4-13, 4-14,
and 4-15). Although minimal actual testing of marine propulsion units has been performed to verify the particulate factors, the factors published by
different authors reflect reasonable agreement. The AP-42 factors were
4-16
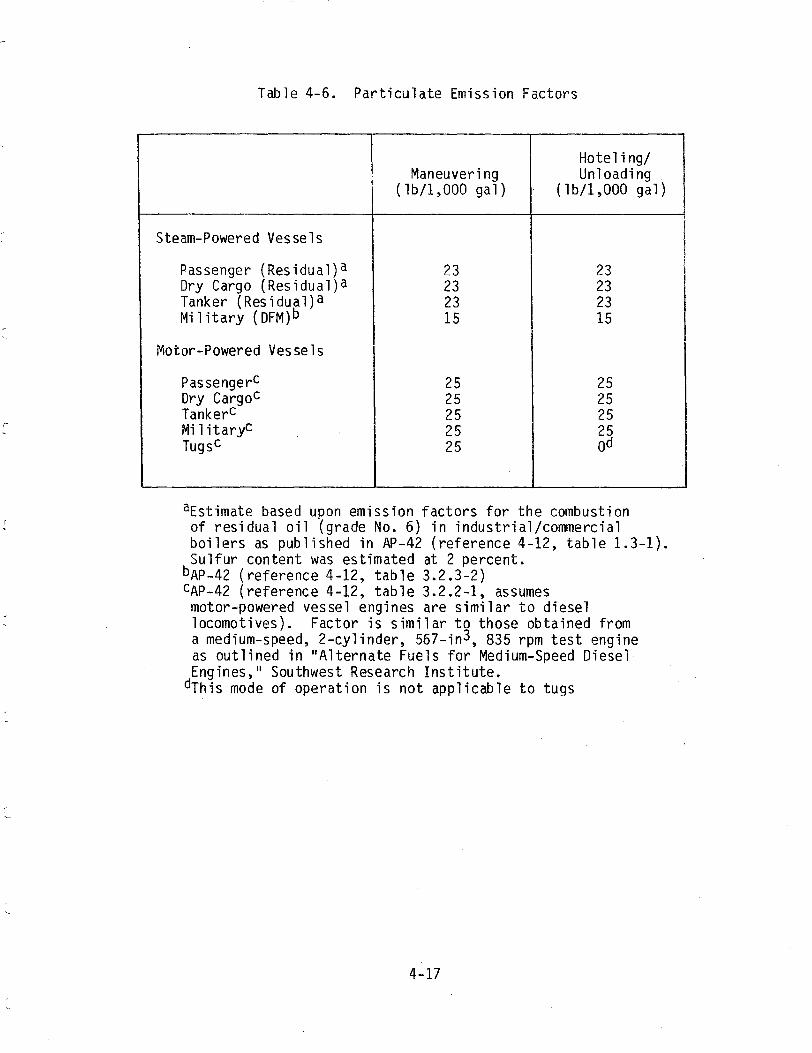
Table 4-6. Particulate Emission Factors
'
Maneuvering(lb/1,000 gal)
Hoteling/ Unloading
(lb/1,000 gal)
Steam-Powered Vessels
Passenger (Residual)a 23 23 Dry Cargo (Residual)a 23 23 Tanker (Residual)a 23 23 Military (DFM)b 15 15
Motor-Powered Vessels
Passengerc 25 25 Dry Cargoc 25 25 Tankerc 25 25 Mil itaryc 25 25 Tugsc 25 od
aEstimate based upon emission factors for the combustion of residual oil (grade No. 6) in industrial/commercial boilers as published in AP-42 (reference 4-12, table 1.3-1). Sulfur content was estimated at 2 percent.
bAP-42 (reference 4-12, table 3.2.3-2) cAP-42 (reference 4-12, table 3.2.2-1, assumes motor-powered vessel engines are similar to diesel locomotives). Factor is similar to those obtained from a medium-speed, 2-cylinder, 567-in3, 835 rpm test engine as outlined in "Alternate Fuels for Medium-Speed Diesel Engines," Southwest Research Institute.
dThis mode of operation is not applicable to tugs
4-17

comparable to those in other references and thus were felt to be the best
available. The particulate emission factors for steam- and motor-powered
vessels were assumed to be the same for all normal modes of operation.
4.2 EMISSION INVENTORY INPUT DATA: EXEMPTED OPERATING MODES
In order to make an estimate of the quantity of particulate matter emitted during the exempted operating modes, additional input data were required to supplement that described in the foregoing sections. Where
specific data with respect to these modes were unavailable, assumptions based upon engineering judgments and discussions were required. This
section provides a review of the data and assumptions characteristic of
the exempted operating modes.
Data relative to the exempted operating modes were used to develop the following values which were then used to quantify particulate
eITTTiissions in the exempted modes:
• Frequency and duration of exempted modes and periods of excessive emissions
• Engine load factors during exempted conditions • Number of individual ships calling on California ports
• Particulate emission factors during exempted modes
These parameters along with the previously described input data (i.e., average powerplant size per ship type, inport specific fuel consumption
factors, and number of ship visits by each generic type to the ports
studied) were used in the emission inventorying procedure.
The frequency of occurrence and the typical duration of the exempted modes was established by soliciting information from 16 U.S. flag
oceangoing fleet operators and the Foreign Shipowners Association. The 16 U.S. companies operated nearly 70 percent of the U.S. merchant fleet which
was 92 percent steam-powered in 1980. Ten responses were received from
U.S. operators of approximately 60 steam-powered vessels which call on
California ports. It is believed that this sampling accounts for a large
portion of the U.S. steam-powered merchant ships that are involved in
California trade. The responses are s~~marized in table 4-7. The information in most cases is at best an estimate, for it is
nearly impossible for most operators to accurately recall the number of times that exempted modes were experienced and the duration of each
occurrence. In some cases these events may be entered into the ship's
4-18

..... w ..J.™O::.,.d..]j_,_,~.,.,. c.a.:.:.-..::::,:.:a~---Lll • .i.Lbo~L,ll&........,,W,tl.i~
----
-- --
,---, .•·-,
Tab 1e 4-7. Frequency and Duration Questionnaire Summary
RefractoryBoilerGovernmentEmergency BoilerManeuvering to DryingLight Offs
Number of Steamships
TestingShutdownsAvoid Hazards
Annual DurationAnnualDurationAnnualDurationAnnualDurationAnnualDurationAnnualCa 11 i ng on Visits to (Min)Freq.(Hin)Freq.Freq. (Min)Freq. (Min)Freq. (Min)CaliforniaShipping Company California
. 25. 1.0 0.5105.010102.04.0 6148Matson Nav. Co. 6
American President 1200.730 to 904.12 to 202 to 10 5.32.74.2 3 to 5150Lines, Ltd, 15
180 to 2401.018012.0603b 1.0NA15 NANA 2 to 6Farrell Lines Inc.
Lykes Bros NANANA18. 5 NAab NA 2.00 NA138Steamship Co., Inc.
24 hr1.012 hrl.O12 hr24 hr 1.02.0179 0Keystone Shipping Co. 10 to 17
Interocean NA0.54.0 NA2b NANA 1.0NA 0.55.0Management Corp. NA
NANANA28 to 36 NA1.033NA1.0 113 30Mobil Oil Corp.
Chevron Shipping+::> 900.5600.5I 5 01.0Companya 148 03..... I..O 6 to 8 hr0.534.021.0301 1.0144 l.OArco Marine, Inc. 6
6 to 8 hr<0.21<l l.O<l 1.0<l 1.0<1.0160Exxon Comp., U.S.A. 6
NOTES:
NA: Not available because information was unkown, not applicable or unclear aReported an estimate of instances l'lhere emissions exceeded the 3-min opacity rule bsome of these vessels may primarily serve other West Coast ports such as Portland or Seattle
c...aL,==~,
log, however, detailed review of past records was not felt to be
warranted. As can be seen in the table, a high degree of variation exists
for responses received for some of the estimates while others are fairly
consistent. This may be because some of the respondents were unclear about the precise meaning of some of the exempted modes. For example, it
was generally felt that most respondents interpreted "maneuvering to avoid
hazards 11 as meaning sudden, unexpected incidents which require unusual
actions to avert an accident, however this may not have been true in all
cases.
Perhaps an even more significant cause for the variation in responses can be attributed to the differences between shipping companies,
vessel types, and operating procedures. Operators of container, tanker or other quick-turnaround vessels are likely to require fewer boiler light
offs than general or bulk cargo vessel operators whose ships experience longer inport stays. The frequency of emergency boiler shutdowns is also
highly dependent upon vessel characteristics including boiler design and
age, and on operating procedures such as the degree of preventive
maintenance. The time that a marine propulsion plant operates in the
various exempted modes reflects the accepted procedures of the vessel type
(e.g., Coast Guard test procedures or company procedures, such as, wet or
green refractory drying).
After reviewing the frequency and duration data, the following
values were assumed to be representative of industry experience:
• Maneuvering to avoid hazards: two occurrences/ship annually; 4 min/occurrence
• Emergency boiler shutdown: one occurrence/ship annually for 10 min/occurrence
• Government testing: one occurrence/ship annually; 1 to 2 hr/ occurrence
• Cold boiler light offs: five occurrences (i.e., boilers)/ship annually; 2 to 3 hr/boiler light off
, Drying refractory: one occu;rence/ship every 2 years (both
boilers); 6 to 8 hr/boiler
Once the frequency and duration of the specific events were established, it was necessary to make an estimate of the length of time that "excessive
emissions" would be emitted during each occurrence. "Excessive" was
4-20

loosely defined as emissions over the amount that is normally emitted under well operated, stable combustion conditions. The normal emission levels which correspond to the emission factors listed in table 4-6 were assumed to produce a plume of 10 and 5 percent opacity for residual and distillate (DFM) fuels, respectively. Since no actual stack test data have been measured for vessels operating in any of the exempted modes, it was necessary to make engineering judgments with respect to the length of time during each exempted mode that the emissions are above the normal levels of 10 and 5 percent opacity.
In addition to making assumptions about the time period of excessive emissions for each exempted modej assumptions concerning the engine load factor were also required. The operating procedure typical of each mode as discussed in section 3.2 was reviewed and considered along with three actual infield visible emission observations (see Appendix C). Values for the time period of excessive emissions and engine load factors were selected which tended to represent a worst case estimate of emissions. As a consequence, the calculated quantity of particulate matter attributed to the exempted modes of operation may actually overstate the true value.
Maneuvering to avoid hazards typically involves sudden propulsion load changes in which steam demand is quickly increased or decreased. The engine load level may fluctuate between 10 to 100 percent of the design value. For purposes of the emission estimates, a load level of 100 percent for commercial vessels and 40 percent for military vessels was selected. (A value of 40 percent for military vessels was selected since these vessels generally operate at approximately 35 percent load for cruising.) Because the duration of an unplanned maneuver is brief, 4 min of excessive emissions was assumed.
It was assumed that the worst case of emergency boiler shutdown would involve the shutdown of a single boiler during the time when the commerical vessel was maneuvering in confined waters at a load factor of 50 percent. Since only a single boiler would generally be involved in the shutdown, it was assumed that this boiler would be producing steam at a level equal to 25 percent of the ships total rated capacity prior to the shutdown (i.e., vessel at 50 percent load with two boilers operating). If the shutdown were required because of a fan failure, fuel may continue to
4-21
be fed to the burner for a short time before the operator stopped it.
Again, this is a worst-case scenario; in most modern ships with flame safeguard systems, a fan failure would automatically result in i11111ediate
stoppage of the fuel flow. A period of 5 min was assumed as the maximum
duration of excessive emissions. This is the time when the excessive fuel in the shutdown boiler would be burning under air-starved conditions and also includes the brief period of unstable combustion in the online boiler
caused by the sudden increase of steam denand resulting from the loss of
one boiler.
Government testing requires varying the boiler firing rate over the
entire operating range and in some cases 1 up to 110 percent of design
load. The 110 percent value was used in the emission estimation
procedure. As noted in section 3.2.3, the entire test procedure varies
with different types of ships and test objectives and therefore may
require 1 to 2 hr to complete. It was assumed that the duration of
excessive emissions may total 10 min when a complete evaluation of the ship's boiler, control, propulsion and safety systems would be performed.
The cold-boiler light-off procedure involves operating the ship's boilers at low load for generally a 2 to 3 hr period. An average engine
load of 5 percent was assumed for each boiler. This corresponded to a firing rate of 300 to 900 lb/hr of residual fuel in comnerical vessels and approximately 2,000 lb/hr of distillate fuel for military steam-powered
vessels. During the light-off procedure, there are a variety of actions
which can result in excessive emissions (see section 3.2.4). The extent
and period of emissions is likely to vary considerably due to the specific
procedures used, equipment and operating characteristics, and operator
proficiency. An estimate of 10 min per boiler was assumed to represent
the maximum aggregate time of excessive emissions for each light-off
occurrence.
The procedures for refractory drying are similar to those used for
a cold-boiler light off. The boiler is fired at a low fuel rate for a
time in order to evaporate the excess moisture. It requires an estimated 6 to 8 hr to bring such a boiler online. As in the case of the boiler light-off procedure, a load level of 5 percent per boiler was assumed. An aggregate period of 30 min of excessive emissions was assumed to occur during each refractory drying.
4-22

An estimate of the number of individual steam-powered vessels calling on California ports was factored into the exempted mode inventory procedure. An estimate of 400 vessels was assumed; this includes both U.S. and foreign commercial and military vessels. The 1976 San Francisco Bay Area traffic infonnation as tabulated by Reardon and Conklin (reference 4-2) listed approximately 300 U.S. and foreign steamships which called upon this area. A similar listing for other ports was not available for this study. However, as mentioned earlier, it is believed that the majority of vessels calling on Bay Area ports are also involved in visits to other California ports. Thus, the number of individual ships calling on the five ports under study was increased from the 300 which are known to have visited the Bay Area by 100 for a total of 400 vessels.
The final factor required in the exempted mode emission inventory procedure was emission rates. Since no emission factors have been obtained by field sampling steam-powered vessels in the operating modes of interest, the factors for normal modes had to be modified to reflect an assumed increase. This increase was calculated based upon assumed stack gas opacity values. The following rates were assumed for excessive emissions during the exempted modes of operation when residual fuel is burned:
1 Maneuvering to avoid hazards 80 percent 1 Emergency shutdowns 80 percent 1 Government testing 60 percent t Cold-boiler light offs 60 percent
• Refractory drying 80 percent Opacity values for excessive emissions resulting from improper
combustion of distillate fuel were assumed at 40 percent. Using the above values and the assumption that normal combustion
results in 10 and 5 percent stack gas opacities for residual and distillate fuel respectively, the Beer-Lambert relationship was used to calculate an adjustment factor by which the normal emission factors were increased. These adjustment factors are listed below.
• For a base opacity level of 5 percent, an increase to 40 percent equates to a mass emission factor increase of 10 (i.e., emission rate at 40 percent opacity= 10 x 15 or 150 lb/ 1,000 gal for distillate fuel)
4-23

• For a base opacity level of 10 percent, an increase to 60
percent equates to a mass emission factor increase of 8.7
(i.e., emission rate at 60 percent opacity= 8.7 x 23 or
200 lb/1,000 gal for residual fuel)
• For a base opacity level of 10 percent, an increase to 80
percent equates to a mass emission factor increase of 15.3 (i.e., emission rate at 80 percent opacity= 15.3 x 23 or
352 lb/1,000 gal for residual fuel). In using the Beer-Lambert relationship to calculate the adjustment
factors, it was assumed: (1) the particle size and hence the mean
projected area remain the same for both normal and exempted modes, (2) the
particle extinction coefficient remains the same and (3) the exhaust gas
path length (i.e., stack diameter) remains the same. The degree to which
each of these assumptions is valid is questionable, however, in the
absence of actual test data obtained under the appropriate operating
modes, this calculation method was felt to be the best available.
Table 4-8 gives a summary of the input data and assumptions used in
the exempted mode emission inventory. 4.3 EMISSION INVENTORY RESULTS
The data described in sections 4.1 and 4.2 formed the basis for the
emission inventory calculations. The necessary calculations were
performed to yield an emission estimate for normal and exempted vessel
operations in the port areas under study. The detailed calculations are
tabulated in appendix A (normal modes) and appendix B (exempted modes).
4.3.1 Normal Operating Mode Emissions
Particulate emissions from normal inport vessel operations are
surrmarized in table 4-9. Fuel consumption and particulate emissions for
each port, ship type, and mode of operation were estimated. For each port
and ship type, the average powerplant size was estimated (table 4-2).
Next, the fuel consumed for a single port visit was calculated for the modes of maneuvering and hoteling/unloading. This estimate was .based upon
the hours per port visit in the specifi~ operating mode (tables 4-3 and 4-4), the propulsion plant load factor (table 4-5), and the specific fuel
consumption factor (figures 4-2 and 4-3). The fuel consumption per visit was then multiplied by the number of visits per year shown in table 4-1 to
obtain the total annual fuel consumption for each ship type. The fuel
4-24

, \1~1( '
Table 4-8. Exempted Mode Emission Inventory Input Data and Assumptions
Parameter Source
Exempted Modes of Operation
Maneuvering to Avoid Hazards
EmergencyShutdowns
Government Testing Boiler Light offs Refractory Drying
Power level, range(%) Consultant 10 to 100 50 to 25 0 to 110 o to 10 0 to 10
Inventory power· level (%) Assumptiona 100/40 25/lOb 110 5c 5c
Duration of procedure Survey 4 min 10 min ~l to 2 hr 2 to 3 hr/boiler 6 to 8 hr/boiler
Duration of excessive emissions Assumption 4 min 5 min 10 min 10 mi n/bo i1 er 30 min/boiler
Annual occurrences/ship Survey 2 1 1 5d o.5e
Total annual occurrencesf
Excessive emission opacity
Calculation
Assumption
800 400 400 2,000 200
Residual fuel (%) 80 80 60 60 80 Distillate fuel (%)
Exempted mode emission factors
40 40 40 40 40
Residual fuel (lb/1,000 gal)
Calculated 352 352 200 200 352
Distillate fuel (lb/1,000 gal)
Calculated 150 150 150 150 150
.j:::,,
I N u,
aupper end of power level range was selected for inventory purposes, second value is for military vessels bAssumes emergency shutdown involves a single boiler on a vessel with two boilers operating at an average inport level of
50 percent typical of maneuvering (military values are lower) CBased upon the assumption that each single boiler on a typical two-boiler vessel is operated at 5 percent of full-load during the
light-off and warmup period dAssumes that each occurrence involves the lighting off of a single boiler, thus on an annual basis, five boiler light offs occur per ship
eAssumes that each occurrence involves the drying of refractory on both boilers of a single ship and that this event occurs once every 2 yr
fBased upon the assumption that approximately 400 individual steamships call on California ports annually

Table 4-9. Nonnal Operating Mode Emissions Inventory (Tons/Year)
Port/Ship Type Steamship Motorship Totals
San Francisco Bay Passenger 9.2 3.3 Ory Cargo 98.l 141.6 Tankers 122 .4 25.9 Military 24.7 3.8 Tugs/Tows -- 0.4
Subtotal 254.4 175.0 429.4
Los Angel es/Long Beach Passenger 18.3 10.4 Dry Cargo 69.4 288.3 Tankers 171.8 64.2 Military 6.1 --Tugs/Tows -- 1.8
Subtotal 265.6 364.7 630.3
San Di ego Passenger 0.5 --Dry Cargo 15.4 17.1 Tankers 0.6 0.1 Military 122.1 --Tugs/Tows -- 0.3--Subtotal 138.6 17.5 156.1
Ventura County Passenger -- 0.5 Dry Cargo 1.7 0.5 Tankers 0. 6 9.5 Military 26.6 7.8 Tugs/Tows ---- 0.1--Subtotal 28.9 18.4 47.3
San Luis Obispo County Tankers 24.6 0.5 25.1
Total 712 .1 576.1 1,288.2
4-26
consumption was then multiplied by the emission factors shown in table 4-6 and surrmed for all ship types.
The calculated estimates for normal inport activities in this limited inventory are in reasonable agreement with those developed by Scott Environmental Technology, Inc. for 1976 as presented in reference 4-1. As mentioned earlier, this inventory did not include emissions resulting from vessels not counted by the local marine exchanges or port authorities (e.g., large fishing craft, Coast Guard vessels, oil drilling service ships) except for military vessels and oceangoing tugs. Emissions from tug assistance activities were not included as they were in the Scott inventory. The contribution made by these vessels is felt to be minimal as the fuel consumption and number of ship visits is small when compared to that of the general merchant and military ships. The limited inventory for nonnal inport emissions was developed to provide information for a quantitative comparison of these emissions with those resulting from exempted operations. 4.3.2 Exempted Operating Mode Emissions
Estimates of particulate emissions generated during the five exempted modes are surrmarized in table 4-10. These estimates were developed by first approximating the fuel consumed during each occurrence. The number of annual occurrences was then used to calculate total fuel consumption for each mode. Finally, emissions were calculated by multiplying the emission factors by fuel consumption and summed for all ship types.
The calculated estimates total 35 tons/yr; operations required for government testing contribute approximately 45 percent of this total. This is primarily due to the brief period of high fuel consumption that is experienced during the test procedure. It is important to understand that the estimates have been based upon numerous assumptions that tend to reflect the worst case of emission generation. Operations necessary for refractory drying only contribute an estimated 2.5 tons/yr due to the low number of annual occurrences (200 or once per ship every 2 yr) and the low engine load level (5 percent per boiler) with its correspondingly low fuel firing rate.
The distribution of emissions by ship type and port has been made on the basis of ship visits only. The exempted mode emission quantities
4-27

Table 4-10. Exempted Mode [missions Inventory (Tons/Year)
Port/Ship Type Maneuvering Emergency Shutdowns
Government Testing Light Offs
Refractory Drying
San Francisco Bay Passenger 0.10 0.03 0.07 0.02 0.03 Dry Cargo 1.56 0.54 1.22 0.35 0.37 Tankers o. 91 0.32 0.71 0.19 0.20 Military 0.13 0.05 0.42 0.12 0.08
Subtotal 2.70 Oo94 2.42 0.68 0.68
Los Angeles/Long Beach Passenger 0.13 0.04 0.10 0.03 0.03 Dry Cargo 1.22 0.42 0.95 0.28 0.30 Tankers 1.34 0.48 1.04 0.28 0.29 Military 0.35 0.12 1.00 0.33 0.21
Subtotal 3.04 1.06 3.09 0.92 0.83
San Diego Passenger -- -- -- -- --Dry Cargo 0.08 0.06 0.13 0.02 0.04 Tankers -- -- -- -- --Military 2.98 1.04 9.68 2.80 0.85
Subtotal 3.06 1.10 9.81 2.82 0.89
Ventura County Passenger -- -- -- -- --Dry Cargo 0.02 0.01 0.02 0.01 --Tankers -- -- -- -- --Military 0.06 0.05 0.18 0.05 0.02
Subtotal 0.08 0.06 0.20 0.06 0.02
San Louis Obispo County Tankers 0.34 0.12 0.26 0.07 0.07
Total 9.2 3.3 15.8 4.6 2.5
4-28

were developed from fuel consumption estimates that were themselves based upon ship characteristics typical of each port and ship type (e.g., average propulsion plant size). Emission quantities were then calculated by approximating the number of exempted mode occurrences for each port and ship type fran generalized values for the annual occurrences per ship and estimates of the number of individual ships calling on specific ports. This latter value was based upon the assumption that a total of 400 individual U.S. and foreign steamships call on California ports. A detailed evaluation of those vessel types or port areas most likely to experience exempted mode operations was not considered in the table 4-10
r inventory. For example, it is known that refractory repairs and fireside cleaning is perfonned in the San Francisco Bay, Los Angeles/Long Beach, and San Diego ports but not in the ports of Ventura and San Louis Obispo county. The same may be true for government testing.
In sunmary, the quantity of particulate matter emitted as a result of exempted mode operations has been estimated to total 35 tons/yr for the five port areas considered. When canpared to the emissions from steam-powered vessels under normal operating modes for the same areas, this quantity amounts to 3 percent of the emissions. 4.4 COMPARISrns OF MARINE EMISSIONS WITH OTHER SOURCE CATEGORY
EMISSIONS A comparison of the estimated emissions from ships operating in the
nonnal and exempted modes is presented in tables 4-11 through 4-15 for the five port areas studied. Quantitative comparisons of the ship emissions are made with canbustion related sources and the total emissions from point and mobile sources.
4-29
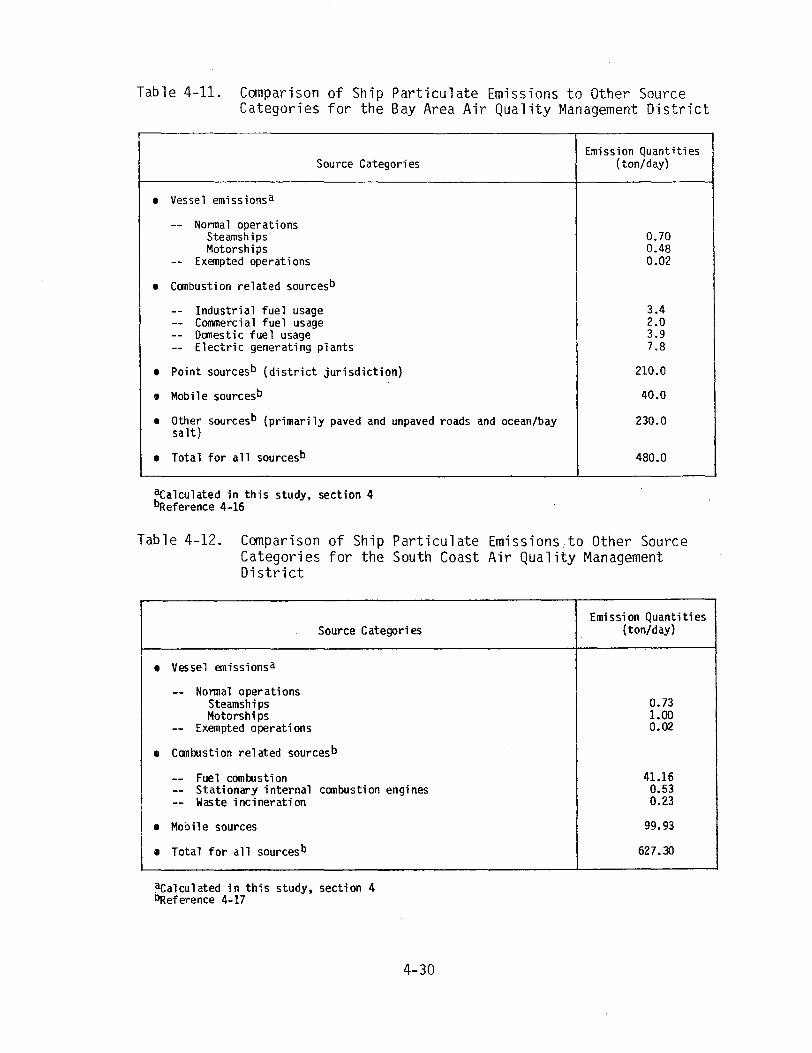
Table 4-11. Comparison of Ship Particulate Emissions to Other Source Categories for the Bay Area Air Quality Management District
Source Categories Emission Quantities
(ton/day)
• Vessel emissionsa
-- Normal operationsSteamships 0.70 Motorships 0.48
-- Exempted operations
• Ccrnbustion related sourcesb
0.02
-- Industrial fuel usage 3.4 -- Commercial fuel usage 2.0 -- Danestic fuel usage 3.9 -- Electric generating plants 7.8
• Point sourcesb (district jurisdiction) 210.0
• Mobile sourcesb 40.0
• Other sourcesb (primarily paved and unpaved roads and ocean/baysalt)
230.0
• Total for all sourcesb 480.0
acalculated in this study, section 4 bReference 4-16
Table 4-12. Canparison of Ship Particulate Emissions,to Other Source Categories for the South Coast Air Quality Management District
Source Categories Emission Quantities
(ton/day)
• Vessel emissionsa
-- Nonnal operations SteamshipsMotorships
-- Exempted operations
• Canbustion related sourcesb
-- Fuel combustion -- Stationary internal canbustion engines -- Waste incineration
ti Mobile sources
• Total for all sourcesb
0.73 1.00 0.02
41.16 0.53 0.23
99.93
627 .30
acalculated in this study, section 4 bReference 4-17
4-30

Table 4-13. Comparison of Ship Particulate Emissions to Other Source Categories for San Diego County
Source Categories
• Vessel emissionsa
-- Normal operations SteamshipsMotorships
-- Exempted operations
• Canbustion related sourcesb
----Utility boilers Industrial, c0111nercial, and institutional (including package boilers)
• Point sourcesb
• Area Sourcesb
• Mobile sourcesb
• Total for all sourcesb
Emission Quantities (ton/day)
0.38 0.05 0.05
9.52 0.09
31.11
270.52
23.05
324.68
acalculated in this study, section 4 bReference 4-18
[ Table 4-14. Comparison of Ship Particulate Emissions to Other Source
Categories for Ventura County
Source Categories
• Vessel emissionsa
-- Normal operationsSteamshipsMotorships
-- Exempted operations
• Canbustion related sourcesb
-- Fuel combustion -- electric utilities -- Fuel combustion -- residential -- Total fuel combustion -- Waste burning
• Industrial processes
• Stationary sources
• Mobile sources
• Total for all sourcesb
Emission Quantities (ton/day)
0.08 0.05
<0.01
2.21 0.18 3.08 0.60
1.00
69.70
5.91
75.61
~alculated in this study, section 4 ~Keference 4-19
4-31
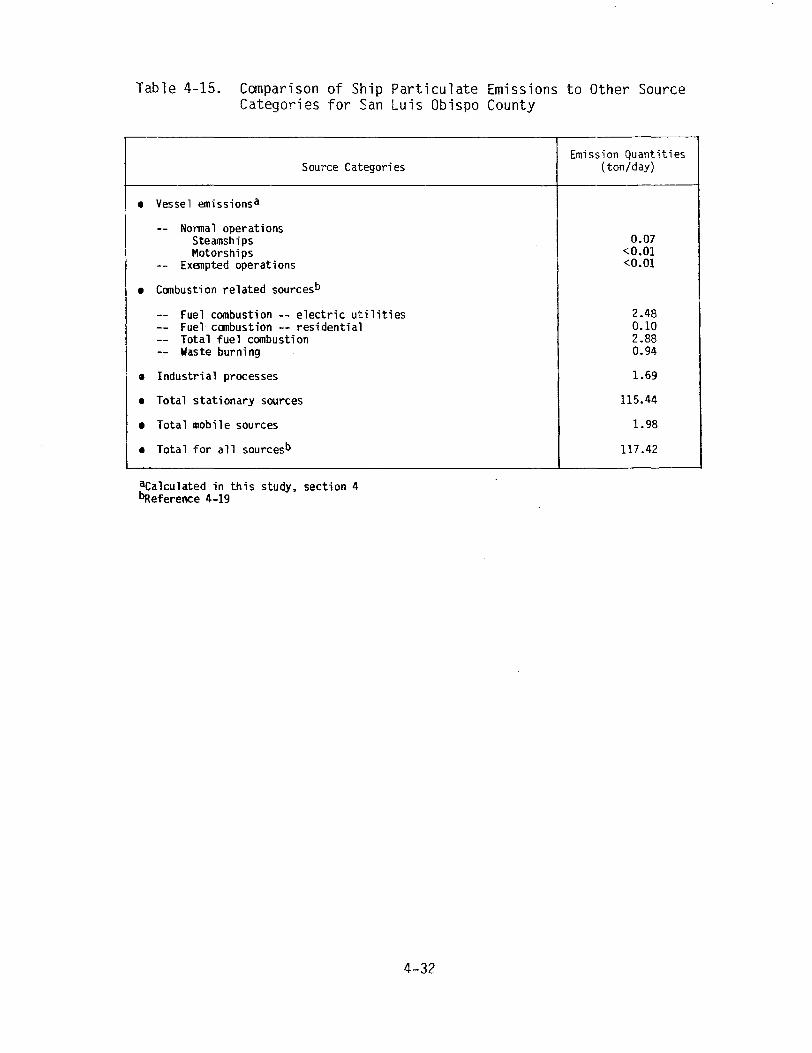
Table 4-15. Canparison of Ship Particulate Emissions to Other Source Categories for San Luis Obispo County
Emission Quantities Source Categories ( ton/day)
• Vessel emissionsa
-- Nonnal operations Steamships 0.07 Motorships <0.01
-- Exempted operations <0.01
• Canbustion related sourcesb
-- Fuel combustion -- electric utilities 2.48 -- Fuel canbustion -- residential 0.10 -- Total fuel combustion 2.88 -- Waste burning 0.94
• Industrial processes 1.69
• Total stationary sources 115.44
• Total mobile sources 1.98
• Total for all sourcesb 117.42
acalculated in this study, section 4 l>Reference 4-19
4-32
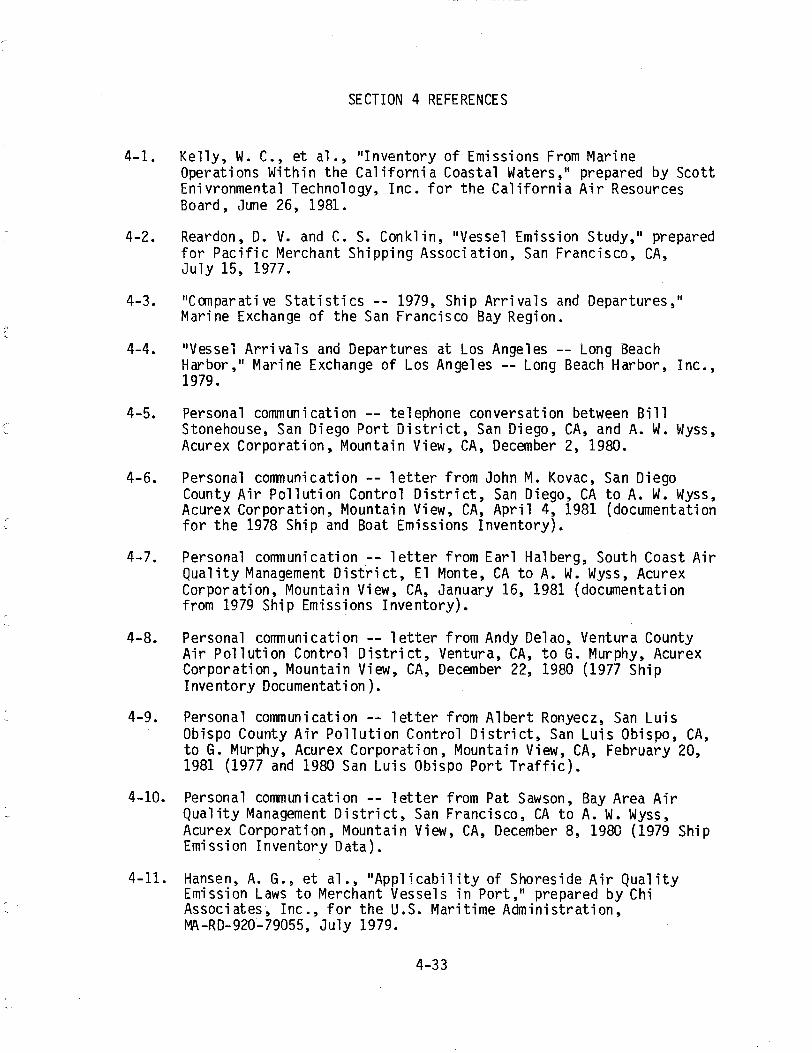
SECTION 4 REFERENCES
4-1. Kelly, W. C., et al., "Inventory of Emissions From Marine Operations Within the California Coastal Waters," prepared by Scott Enivronmental Technology, Inc. for the California Air Resources Board, June 26, 1981.
4-2. Reardon, D. V. and C. S. Conklin, "Vessel Emission Study," prepared for Pacific Merchant Shipping Association, San Francisco, CA, July 15, 1977.
4-3. 11 Canparative Statistics -- 1979, Ship Arrivals and Departures,"Marine Exchange of the San Francisco Bay Region.
4-4. "Vessel Arrivals and Departures at Los Angeles -- Long Beach Harbor," Marine Exchange of Los Angeles -- Long Beach Harbor, Inc., 1979.
4-5. Personal communication -- telephone conversation between Bill Stonehouse, San Diego Port District, San Diego, CA, and A. W. Wyss, Acurex Corporation, Mountain View, CA, December 2, 1980.
4-6. Personal conmunication -- letter from John M. Kovac, San Diego County Air Pollution Control District, San Diego, CA to A. W. Wyss,Acurex Corporation, Mountain View, CA, April 4, 1981 (documentation
[ for the 1978 Ship and Boat Emissions Inventory).
4-7. Personal conmunication -- letter from Earl Halberg, South Coast Air Quality Management District, El Monte, CA to A. W. Wyss, Acurex Corporation, Mountain View, CA, January 16, 1981 (documentationfrom 1979 Ship Emissions Inventory).
4-8. Personal conmunication -- letter from Andy Delao, Ventura CountyAir Pollution Control District, Ventura, CA, to G. Murphy, Acurex Corporation, Mountain View, CA, December 22, 1980 (1977 Ship Inventory Documentation).
4-9. Personal communication -- letter from Albert Ronyecz, San Luis Obispo County Air Pollution Control District, San Luis Obispo, CA, to G. Murphy, Acurex Corporation, Mountain View, CA, February 20, 1981 (1977 and 1980 San Luis Obispo Port Traffic).
4-10. Personal communication -- letter from Pat Sawson, Bay Area Air Quality Management District, San Francisco, CA to A. W. Wyss, Acurex Corporation, Mountain View, CA, December 8, 1980 (1979 ShipEmission Inventory Data).
4-11. Hansen, A.G., et al., "Applicability of Shoreside Air QualityEmission Laws to Merchant Vessels in Port," prepared by Chi Associates, Inc., for the U.S. Maritime Administration, Ml\-RD-920-79055, July 1979.
4-33

4-12. "Compilation of Air Pollutant Emissions Factors," Third Edition, U.S. Environmental Protection Agency, AP-42, February 1976.
4-13. "Draft Environmental Impact Report on the Atlantic Richfield Company Marine Tanker Terminal Relocation to Berths 121-122," prepared by Environmental Resources Group for the Port of Long Beach, CA, September 1979.
4-14. Bryan, R. J., et al., "Air Quality Analysis of the Unloading of Alaskan Crude Oil at California Ports," prepared by Pacific Environmental Services, Inc. for the U.S. Environmental Protection Agency, Contract Number 68-02-1405, Task Number 10, November 1976.
4-15. Krause, K., et al., "Crude Oil Transporation-Tankering Versus Pipelining: An Air Pollution Emission Comparison," prepared by the Ventura County and Santa Barbara County Air Pollution Control Districts, December 1978.
4-16. "Base Year 1979 Emissions Inventory Surrmary Report," Bay Area Air Quality Management District, San Francisco, FA, July 1, 1981.
4-17. "Draft 1979 Emissions Inventory, Working Paper Number 1, 1982 AQMP Revision," South Coast Air Quality Management District, El Monte, CA, July, 1981.
4-18. "Draft 1981 Annual Report, Reasonable Further Progress, Volume II, 11
San Deigo County Air Pollution Control District, San Diego, CA May 1981.
4-19. Personal communication -- preliminary data from Russ Tate, California Air Resources Board, Sacramento, CA to A. W. Wyss, Acurex Corporation, Mountain View, CA, December 12, 1981 (1979 emission inventory for Ventura and San Luis Obispo Counties).
4-34

SECTION 5 VISIBLE EMISSION CONTROL OPTIONS
This section presents a listing and review of numerous potential visible emission abatement strategies available to vessel operators in order to reduce or eliminate visible emissions generated as a result 0f exempted mode operations. Control options judged to be feasible and possessing a reasonable degree of applicability were examined with respect to their potential abatement effectiveness, effect on vessel safety, capital and operating costs, operational and other (e.g., institutional) concerns. However, before control options were identified and evaluated, an assessment was made of the degree of control that vessel operators have over the situation which eventually results in exempted mode operations. This is an important aspect of any proposed solution because many times there are numerous constraints which are beyond the operator's control.
These constraints may require actions which are contrary to the goal of reducing emissions and thus may make implementation of specific solutions
impossible or unrealistic. 5.1 APPROPRIATENESS FOR CONTROLS
After reviewing the vessel operating procedures typical of maneuvering to avoid hazards, emergency boiler shutdowns and government testing, it has been concluded that these events require operational responses which generally conflict with the goal of minimizing visible emissions. In each of these modes, the captain of the ship and hence the boiler operator is primarily concerned with promoting and insuring the safety of the crew, passengers, ship, and the surrounding environment (e.g., other vessels).
In the case of maneuvering to avoid hazards, varying conditions of tide, currents, wind, and ship traffic plus allowances for adequate margins of ~afety can require the operator to rapidly vary the propulsion system and hence the steam demand. As previously noted, these rapid load changes can produce emissions in excess of the normal standard for brief
5-1

periods, estimated to average approximately 4 min per occurrence.
Possible methods of reducing the occurrence of this operating mode include
reducing the need for such sudden maneuvering by improving operator
awareness of navigational hazards and improving boiler response
capability. Because of the ever-present concern for safety and the trend
toward automated boiler control systems, these measures are currently
being practiced to the fullest extent possible. For this reason, it is
felt that ship operators have little or no control to vary operating
procedures to minimize emissions or to implement additional emission
reduction measures for this operating mode.
A similar situation exists with respect to emergency boiler
shutdowns. These events can generate brief periods of excessive emissions
(i.e., approximately 5 min/occurrence) primarily because of the inability
of the operator and/or boiler control system to respond to rapid system
changes caused by component failure. In theory, emission reductions could
be brought about by implementing maintenance measures designed to reduce
system failures and by improving boiler response capability. Because of
safety and economic concerns, it is believed that procedures which in
effect minimize the frequency of equipment failure are already being
practiced to the maximum degree possible. In addition, the increased use
of automated systems has a secondary benefit of minimizing the periods of
less-than-optimum combustion. Operator discretion to alter procedures
specifically to minimize emissions during an emergency boiler shutdown
over and above that which is currently being practiced is severely limited.
Safety and operational tests administered by the U.S. Coast Guard
and U.S. Navy are intended to determine how safely the boiler, propulsion,
control and common safety systems operate and if the apppropriate
standards are being complied with. As in the case of the two previously
described modes in which the conditions requiring large load fluctuations
were generally beyond the control of the operator, government testing
requires the operator to simulate events which tend to produce improper
combustion conditions for brief periods of time. Perhaps emissions could be slightly reduced by restructuring the
test procedures so that large load fluctuations are minimized, however,
since each procedure is system specific, it is difficult to confirm this
assessment. It is good marine practice and in the best interest of the
5-2

L
operator to eliminate combustion-related excessive emissions so that
fireside fouling is minimized. In addition, due to the importance of the
inspections, operating, and supervisory personnel are likely to be fully
aware of c001bustion and exhaust gas conditions during the test
procedures. Thus, it is fair to conclude that the excessive emissions are
test related. The objectives of the tests are to ensure proper operation,
reliability and safety and in some cases this may not be consistent with producing optimum c001bustion conditions and minimum emissions. For these
brief periods of time (i.e., estimated at approximately 10 min of excessive emissions per ship annually) the need to promote safety is
foremost. A review of the boiler light off and refractory drying operating
modes indicates that vessel operators are able to control the timing and
procedures used. The selected procedures can impact the visible emissions
generated. Aside from the environmental constraints, there are additional
constraints which may limit or govern the procedures to be used. For
example, a particular boiler light off may need to be accelerated so that
the ship can get underway and meet its shipping schedule. Vessel operators must continually adjust their procedures in order to meet the
schedule requirements of their shippers. Equipment operating requirements
and economic considerations also govern the procedures used for light offs
and refractory drying •. In spite of these constraints and unlike the other
exempted modes, the boiler operator exercises sufficient control during
light offs and refractory drying to greatly influence the generation of
excess emissions. For this reason, it was decided to limit the
examination of emission abatement options to these two modes. It should also be noted that these operating modes are of much longer duration than
maneuvering to avoid hazards, emergency shutdowns, and government testing.
5.2 ABATEMENT STRATEGIES FOR BOILER LIGHT OFFS In order to provide a thorough identification and consideration of
all possible abatement strategies for steam-powered vessels of various
classes in the two exempted modes, a three-step procedure was followed: • Identification of control options without regard to
practicality, degree of applicability, or the consequences of implementation
5-3

• Preliminary screening of the identified options for feasibility
of implementation, degree of applicability, and poter.tial
effectiveness in reducing emissions
• Detailed evaluation of the options judged to be feasible and effective with respect to the above criteria in addition to
economic costs, operational and safety concerns, and
institutional restrictions.
A listing of the options which were initially identified and analyzed is presented in table 5-1. As has been described earlier, the procedures
employed for refractory drying are essentially the same as for a boiler
light off. As such, the causes leading to excessive emissions are the
same. Therefore no distinction will be made with respect to control strategies available to reduce visible emissions for these two modes.
The identification and preliminary screening of the control options is discussed briefly in section 5.2.1. Justifications for why some
options were judged not feasible are also presented. In subsequent
sections, the options judged feasible are described and the results of
their detailed evaluation are presented.
5.2.1 Control Option Identification and Preliminary Screening
The visible emission control alternatives which were identified as
potentially being available to steamship operators were grouped into the
following categories:
• Boiler light-off procedural changes
• Equipment and/or fuel modifications
• Combustion of alternate fuels • Procedural changes involving vessel operations
• Add-on emission control equipment Some control options involve procedures which require specific
modifications that fall in several of the above groupings. For example,
suggested changes in the boiler light-off procedure may involve the
increased use of combustion monitoring equipment such as stack gas opacity monitors. Although a change in standard operating procedures would possibly result in reduced visible emissions, this change may necessitate
a corresponding addition of new equipment.
5-4

Table 5-1. Preliminary Identification of Potential Control Options for Reducing Visible Emissions or Their Impact During Boiler Light Off
I Changes in Boiler Light-off Procedures
• Increase operator awareness of: Emission regulations through issuance and posting of notices 11 Correct 11 light-off procedure through training Combustion and exhaust gas conditions by installing and using opacity and/or oxygen analyzers
• Increasing the use of steam to preheat the cold boiler and fuel
II Modifying Boiler Equipment or the Fuel Normally Burned
• Using a separate 11 light-off 11 burner or burner tip • Installing additional combustion controls • Blending distillate fuel oil with the residual fuel oil • Using fuel additives designed to reduce products of
incomplete combustion
III Combusting Alternate Fuels
• Use of shipboard or shoreside stored gaseous fuels for lightoff
• Increased use of distillate fuel for boiler light offs
IV Changing Procedures Which Involve Vessel Operations
• Maintain fires in all boilers so that most light offs are not necessary
• Light off boiler(s) at sea instead of in port
V Add-on Emission Abatement Devices
• Wet scrubbers, electrostatic precipitators, fabric filters, mechanical collectors, afterburners
• Procedural changes involving vessel operations • Add-on emission control equipment
5-5

Boiler Light-Off Procedural Changes
Changes in the way a boiler light off is conducted can conceivably
result in lower visible emissions. As previously described, boiler light
offs on nearly all vessels consist of manually initiated and controlled
actions. Thus, if the operator is unaware of the optimum light-off
procedure, combustion conditions which may tend to cause excessive
emissions, or stack gas conditions, emissions may be generated and
emission standards exceeded. In some cases, emission reduction can result
from altering the light-off procedure through increasing the operator 1 s
awareness of the regulatory requirements, instructing him in the "correct"
light-off procedure which minimizes emissions, and increasing his
awareness of the combustion and stack gas conditions so that corrective
actions can be taken. Actions designed to promote increased operator
awareness are viable control options with minimal adverse economic, operational and safety impacts. These are discussed in further detail in
section 5.2.2.
In addition to making sure that existing "good marine practice" for
boiler light-offs is followed, excessive emissions may be reduced by
implementing new light-off procedures or expanding the use of existing
procedures. One cause for visible emissions during the initial period of
the light off is the effect of cold furnace surfaces and the subsequent
quenching of partially burned fuel particles. Using a steam source to
warm the furnace surfaces prior to light off could theoretically make a
smoke-free light off more likely. This could be accomplished by directly
injecting steam through the soot blowers if these units were located in
the furnace section of the boiler. Indirect heating could also be used
but would require the furnace to be retrofitted with some type of heat
exchanger. Although the practicality of these furnace preheating methods
is not fully understood (i.e., length of preheat required, steam quantity
needed, effect on corrosion and boiler maintenance), it is believed that
preheating the furnace through the combustion of a clean burning fuel
offers a more efficient use of heat ene~gy. Thus, it is felt that furnace
preheating by direct or indirect steam injection does not warrant further examination as a widely applicable emission reduction measure.
5-6

When a boiler is to be lit off and steam is available, residual fuel is usually used. Steam from an operating shipboard boiler or shore facility is used to preheat and atomize the residual fuel. However, there conceivably could be instances where light offs using residual fuel are attempted without the full or proper use of steam. It is obvious that in these cases, exceeding the visible emission standard could be minimized by increasing the use of steam. It is believed that this type of light off is infrequent. It is assumed that vessel operators make use of steam for residual fuel preheating and atomization to the fullest extent possible. For this reason, the increased use of onboard or shore supplied steam does not appear to be a widely applicable option for reducing light-off
emissions and will not be considered further. Equipment and/or Fuel Modifications
In some cases, modifying the fuel-burning equipment of the boiler or the fuel itself can result in emission reductions. Such modifications identified for use during boiler light offs include the use of a special light-off burner, installation of additional combustion controls, and use of fuel blending or fuel additives.
The possibility of using a special low-load burner or burner tips designed specifically for light-off conditions with residual fuel was considered and discounted. Discussions with a burner manufacturer indicated that no such burner currently exists and that the development of such a burner was unlikely (reference 5-1). The high development cost and the current existence of the wide-range, steam-atomizing burner which provides adequate performance at light-off firing rates were cited as reasons for the lack of interest in a new design. In addition, there could be problems with retrofitting the burner to the wide variety of fuel delivery systems that currently exist.
The retrofitting of new or additional combustion controls such as solid-state electronic boiler controls, viscosimeters, flame scanners, and electronic igniters was discounted as a widely applicable and effective control option. There is no evidence to indicate that these systems result in a significant lowering of visible emissions during light off, since most. automated systems are not designed for operation at extremely low load or light-off conditions. Modern electronic control systems are designed to become operative at temperature and pressure levels in excess
5-7
of 70 percent of the design operating levels. As mentioned earlier, light
offs are manually controlled. Viscosimeters, while optimizing fuel
viscosity and hence burnability, depend upon the availability of steam and
may perhaps enhance combustion after the intial light off. Flame scanners
when used during light off can indicate loss of flame and shut off fuel
flow, however their benefit is chiefly one of safety improvement. A trained and observant boiler operator can perform the same function
especially during the light-off procedure when operating personnel in sufficient numbers are typically present. The use of electronic igniters
results only in a slight decrease in emissions as compared to the conventional hand-held torch.
Combustion control improvements such as those just described allow for more efficient fuel and manpower use with greater reliability and some
improvement in normal operating mode emissions. Retrofitting such devices on older vessels, however, cannot be justified for the specific purpose of
reducing visible emissions during light off. This statement does not apply to stack gas analyzers such as opacity and oxygen monitors. These
devices are considered aids to increase operator awareness during boiler
light offs and are discussed in section 5.2.2.
Modification of the residual fuel burned through the use of blending and fuel additives was examined. Fuel blending is performed to
produce a fuel with better burning, handling or atomziation properties.
Since light offs present difficulties for achieving proper atomization,
blending distillate fuel with residual fuel for the light off and initial
· boiler warmup could reduce fuel viscosity and thus improve atomization and
reduce the occurrence of exceeding visible emission standards. Fuel blending, however, has certain limitations making it uneconomical or in
some cases not possible. Since specialized equipment and/or skilled
operators are needed to effect successful blending, this option was not
perceived to be practical. Vessel operators would be best advised to
focus their efforts on reducing light-off emissions by increasing operator
awareness and/or by burning straight distillate fuel. This latter option is discussed in subsequent sections.
In some cases, fuel blending is not advised because the fuels to be
blended are incompatible. That is, the addition of some distillate fuels
to certain residual fuels causes the mixture of these fuels to separate
5-8

into fractions of different densities or in some cases, a heavy sludge may form. Work done by the U. S. Navy illustrates the range of possible fuel incompatibility between a heavy residual fuel (NSF0 at API 19.5) and a distillate oil (ND at API 29.7). Mixtures of 40 to 92 percent distillate oil are not recommeneded (reference 5-2). The approximate blend of residual (viscosity of 5,000 SSU) and distillate (37 SSU) fuel required to produce a mixture of comparable viscosity to that which results when residual fuel is heated (i.e., 120 SSU) is in the range of 1 part residual and 1 part distillate. This mixture falls within the Navy's range of possible inc001patibility. Because of the degree of fuel expertise necessary to determine the optimum blending range and whether inc001patibility might result, the blending of distillate with residual fuel was judged not to be a practical option available to many vessel operators.
Modification of the residual fuel through the use of additives was examined as a potential emission abatement strategy for light-off operations. Conceivably, additives could be used to control c001bustion-generated emissions by inhibiting the formation of unreactive combustible materials such as soot, coke and polycyclic organic matter. Emission reduction could also result by increasing the concentration of active oxidants by promoting their formation, inhibiting their destruction, or introducing an active oxidant species not normally present. The effectiveness of additives to reduce particulate emissions is unproven for the c001bustion of residual fuels, since the majority of the work being done concerns distillate fuel (reference 5-3). Furthermore, the studies indicate that the effectiveness of additives is dependent on the identification of the proper additive and dosage for given fuel characteristics. Commercial vessels do not burn one specified fuel but rather a multitude of fuels grouped generically as residual, which are segregated to the greatest extent possible in separate fuel tanks. The use of an additive if shown to be effective on one specific fuel would have to be modified and adapted for each fuel burned. The expertise and equipment necessary for optimal additive use is generally beyond that typically available to most vessel operators.
In summary, since the use of fuel blending or additives to residual fuel has not been widely demonstrated in reducing particulate emissions
5-9

especially during boiler light offs, these options were not felt to
warrant further examination. Purely in terms of their practicality, these
options require specialized expertise and/or equipment which is not
routinely available to vessel operators.
Combustion of Alternate Fuels
The burning of "clean" fuels was examined as an option for reducing
visible emissions during light off. The burning of such fuels as light
distillate oil (i.e., No. 2 distillate fuel, marine gas oil (MGO), diesel
fuel) and gaseous fuels (i.e., natural gas, liquified natural gas,
liquified petroleum gas) would result in lower visible emissions because
these fuels are easier to burn and have lower amounts of impurities which
are transformed during combustion into particulate matter. These fuels
could conceivably be burned during the initial period of a boiler light
off when the generation of excessive visible emissions is most likely to
occur.
Distillate fuel is used for some boiler light offs and therefore
has been determined to be an option available to bring vessel emissions
into compliance with the standard visible emission regulation. This
option is discussed in detail in section 5.2.3. The use of gaseous fuels
for boiler light offs is not feasible under current Coast Guard safety
regulations which prohibit the use of any fuel with a flashpoint less than
140°F (reference 5-4). These restrictions also pertain to burning
gaseous fuels which may be stored dockside and piped onboard ship and also
to shipyard activities. Thus, portable gas-fired heaters for refractory
drying are not allowed.
Procedural Changes Involving Vessel Operations Two procedural changes involving the way vessels are typically
operated were briefly considered. These changes include:
• Maintaining all boilers operating while in port thereby
minimizing the need for light offs; light offs would still be
necessary for ships undergoing repairs or prolonged periods of
inactivity
e Lighting the secured boilers at sea These options were both dismissed as being uneconomical, unsafe, and in
the case of the former, possibly contributing to an increase in emissions.
5-10
Vessel operators generally secure the unneeded boilers if a ship is in port for 12 to 24 hr or more. Ships in port for less than this period usually keep both boilers online unless repairs require a boiler to be shut down. From an economic standpoint, operating all boilers when only a single one is needed could be costly if the minimum firing rate necessary to maintain fire in each boiler exceeds the inport steam demand. Boilers operating at low load are inefficient and can produce more pollutants per unit of fuel consumed when compared to a single boiler producing the same quantity of steam but operating at a higher level of rated load. Operators therefore prefer to secure the unneeded units and operate a single boiler.
As an alternate to maintaining fire in all boilers while in port, the option of lighting off outside the port was considered. Safety requirements rule out this option since full propulsion power must be available while maneuvering in port so as to be able "to take proper and effective action to avoid collision and be stopped within a distance appropriate to the prevailing circumstances and conditions". The use of tugs to maneuver ships out of port is also unrealistic due to cost and the lack of sufficient tugs. For the San Francisco Bay, the cost would range from $1,000 to $2,700 per ship. Due to the prevailing westerly winds in California, emissions from lighting off outside the port would in most cases be carried into the port area air basin. Add-on Emission Control Equipment
The use of add-on emission control devices such as scrubbers, electrostatic precipitators, fabric filters, and afterburners was
discounted as a realistic option to reduce visible emissions from boiler light offs. This option was judged not feasible because of its high cost, operational problems, poor cost effectiveness, and undeveloped status. At present, marine boilers are not routinely equipped with external pollution abatement systems, therefore no commercially available systems exist. Such a system could be designed and constructed by using a corrmercially available particulate collection device and modifying it for this application.
Retrofitting vessels with some type of external gas cleaning device would be costly and require extensive engineering to tailor corrmercially available units to the numerous vessel configurations in use. Available
5-11

deck space for such a unit on many vessels is limited. For example, a
typical wet scrubber system sized to treat exhaust gases from a boiler light off on a 20,000 SHP vessel would require a space of 20 by 6 ft and
be 40 ft high. The system would consist of necessary ducting to convey the exhaust from the ship's stack to the particulate removal device, the device itself, an induced draft fan, associated instrumentation, and control systems. This system is estimated to cost in excess of $100,000
(reference 5-5). Because of the high cost, numerous retrofit and
operational problems, and lack of an existing demonstrated system, this
option was eliminated from further consideration. The results of the control option identification and preliminary
screening process are summarized in table 5-2. Options for reducing visible emissions through increasing operator awareness and increasing the
use of distillate fuel were selected because they have a high degree of applicability, possess sufficient abatement effectiveness, and are realistic to implement. As such, these options are discussed in additional detail in sections 5.2.2 and 5.2.3 which follow. 5.2.2 Increased Operator Awareness
A major cause of visible emissions exceeding the standards, and subsequent citations, is believed to be the lack of operator awareness (see section 2.4). Since boiler light offs are manually initiated and controlled operations, pollutant generation is directly related to the
operator 1 s skill in conducting the procedure. Increasing his awareness of the applicable visible emission regulatory requirements, awareness of the 11 correct ui 1i ght-off procedure that produces mini mi al emi ssi ans, and awareness of the canbustion conditions during light off is seen as an
effective strategy for reducing emissions. Implementing steps to increase operator awareness is one means by which vessel operators can bring their
vessels into compliance with the standard visible emission regulations. Increasing operator awareness is also necessary if other control options are to be effective.
Promoting operator awareness of applicable regulatory requirements is a necessary first step in the effort to bring boiler light offs into compliance with visible emission regulations. It involves not only knowledge of the State of California and local air pollution control district regulations but also knowledge of the potential penalties for
5-12

,,.,,I ,, 1-1 J--'\
Table 5-2. Surrmary of Boiler Light-Off Control Options
Options I Conments
• Feasible options with high degree of applicability
-- Increased operator awareness of visible emission regulations through posting of notices
-- Increased operator awareness of "correct" 1 f ght-off procedure through operator training
-- Installation of smoke meters, oxygen analyzers, and/or alarms to increase operator awareness of flue gas and combustion conditions
-- Increased use of distillate fuel for boiler light offs
• Feasible options with low degree of applicability
-- Increased use of steam from the operating boiler to preheat and atomize residual fuelu,
I ~
w
-- Increased use of shore steam for preheating and atomizing residual fuel thereby improving the combustion conditions
-- Preheat furnace and/or combustion air with steam from operating boiler or shore steam
-- Installation and use of steam-atomized burners
-- Blending of distillate fuel with residual fuel to reduce viscosity
-- Difficult to assess possible impact on visible emissions
-- Difficult to assess possible impact on visible emissions
-- A 1 ready requi red for automated p 1 ants on newer ships, could assist in identifying problems to nonobservant operators
-- Already in use on some ships but could be extended to other vessels
-- Current practice utilizes steam from the operating boiler whenever available. Optimizing current practice appears to have limited applicability since most operators are currently using this procedure.
-- Current practice utilizes shore services when required and available to initiate light-off, optimizing current practice could reduce visible emissions but overall impactis felt to be slight.
-- Possible ff soot blowers or heat exchangers are in appropriate locations, direct heating by burning distillate fuel represents more efficient use of fuel
-- The majority of currently operating vessels already use these burners therefore this option is not available to many operators
-- Specialized expertise and equipment needed to effect successful blending, possible incompatibility exists with some fuels

--------
Table 5-2. Concluded
u, I ......
.j:::,
Options
• Options which are ineffective or not feasible
Installation of new or additional combustion controls including viscosimeter, flame scanners, electronic igniters (does not include opacity monitors and oxygenanalyzers)
Separate burner designed specifically for boiler lightoff
-- Burning of gaseous fuels for boiler light off
-- Modification of residual fuel by additives designed to reduce combustion-generated particulate matter
-- Keep boilers operating while in port thereby reducingthe number of light offs needed
Conments
-- Modern control systems are not designed for light-off conditions, light offs are manually initiated and controlled, thus, installation of more sophisticatedcontrols would result in minimal emission reduction
-- No such burner currently exist, currently available steamatomizing wide-range burner generally performs adequately at low load
-- U. S. Coast Guard regulations prohibit use of machinery fuel with flashpoint less than 14O°F
-- No experimental data exists which demonstrates that such an additive is effective in reducing light-off emissions, expertise and specialized equipment needed to implementoption, would not be widely available
-- Inefficient use of fuel since boilers would be operating at extremely low load, multiple boilers operating at low load also are likely to generate more emissions per unit of fuel burned than a single boiler at higher load. Presently most ships in port less than 12 to 24 hr maintain both boilers operating.
noncompliance. While it is the responsibility of the ship owner/operator to ensure that his ship and its crew comply with visible emission regulations, the California Air Resources Board and the appropriate local air pollution control districts can contribute to an increased awareness of the regulations within California waters. This can be accomplished primarily through the printing and distribution of materials which explain the regulatory requirements. Notices, like that shown in figure 5-1 can be made available to the ship owners/operators for posting on board ship in the boiler room. This practice has been used in the past by the Bay Area Quality Management District and could be continued and expanded to other port areas.
The regulatory advisories could be distributed by direct mailing to the ship owners and operators or through notification by agents, pilots, or unions. Pilots who navigate most vessels within the port area could distribute these notices to each of the incoming ships. The California Bar Pilots Association has indicated they would deliver such regulatory information, if requested by the vessel owners. Another method of distributing regulatory notices is through the steamship company 1 s agent. Inport arrangements are handled by the ship owner himself, his agent or representative. Visits by foreign vessels are frequently handled by agents, therefore notification of local regulatory requirements could be made to the foreign steamship operators throught their respective agents. Notification could also be made through operator union orgainzations by having notices posted in union halls.
Discussions with boiler and burner manufacturers, ship engineers, and boiler operators has indicated that following the 11 correct 11 light-off procedure is essential to minimizing visible emissions. Thus, it is recommended that ship owners review their existing procedures in those cases where the 3-min/hr visible emission limit is exceeded. It is also important that boil er operating personnel be made fully aware of the 11 correct11 procedure. The step-by-step procedure as recorrmended by the boiler manufacturer in the equipment manual should be followed. Modifications to this procedure may be necessary because of subsequent equipment and/or fuel changes, however, such modifications should be implemented with full awareness of their effect upon emissions. The experience of permanently assigned operating personnel and their knowledge
5-15

PUGET SOUND AIR POLLUTION CONTROL AGENCY
901 Tacoma Ave. S. Bremerton: Dial 0 410 W. Harrison S1reet 2730 Colby Ave. Tacoma. Wn. 98402 And ask for: Seattle, Wn. 98119 Everett, Wn. 98201
383-5851 Zenith 8385 344-7330 259-0288
SECTION 9.16 Provides that emissioni exceeding any of the limits enablished by this Regulation as a direct result of start-ups, periodic shutdown, unavoidable upset conditions or unavoidable and unforeseeable breakdown of equipment or control apparatus shall not be deemed in violation provided the following requirements are met:
(1) The condition is immadia1tely reported to the Agency. (2)The person responsible shall upon the request of tlhe Control Officer submit a full report including the known causes and the preventive measures to be taken to minimize or eliminate a re-occurrence.
PENALTY: Each violation may result in criminal penalties of up to $1,000 and/or one year in jail or a civil penalty of up to $250.
Form 66-103 (6/75)
Figure 5-1. Sample of Visible Emission Regulation Notice
5-16

of a ship 1 s specific equipment and peculiarities is likely to be invaluable when conducting a light-off. It is therefore important that the permanently assigned ship 1 s engineer supervise the boiler light offs and that new operators receive sufficient training prior to conducting their tasks. The transfer of information with respect to minimizing emissions during a light off should receive as much emphasis as that given to safety concerns.
Exhaust gas and combustion conditions during light off are a third area in which operator awareness can be increased. Without specific quantitative knowldege of the combustion conditions and the exhasut gas during light off, it is difficult to adjust the controls to minimize visible emissions. Stack and combustion conditions can be monitored through the use of an observer or instrumental monitors such as an opacity or oxygen analyzer. Nearly all steam-powered vessels are currently equipped with periscopes which give the boiler operator a direct look at the exhaust gases by viewing a light source which shines across the boiler uptake. To trained operators the relative appearance of this light source indicates the condition of the boiler exhaust gases. However, a quantitative measure of exhaust gas opacity is not available with this device.
Installation of an opacity monitor and/or oxygen analyzer greatly increases the chances for conducting a light off within the limits of visible emission regulations. This instrumentation allows the operator to monitor stack gas conditions and adjust the boiler controls to minimize smoke. Most vessels built since the mid-1960 1 s have opacity monitors. Oxygen monitors have been installed on some new or retrofitted ships since the early to mid-l970 1 s. Therefore it is believed that a significant number of currently operating vessels could be upgraded with these devices and improve their chances for conducting boiler light offs in compliance with standard visible emission regulations.
If a vessel operator did not wish to install an exhaust gas analyzer, shipboard personnel could become certified to read visible emissions and be used to observe the light off. This technique is employed by at least one major shipyard in California to prevent excessive emissions. Irnnediately upon noticing a change in stack conditions, the observer alerts the boiler room to take remedial action, minimizing the duration and possibly magnitude of the emissions.
5-17

Abatement Effectiveness
The abatement effectiveness of enhanced operator awareness is difficult to quantify. However, observations of actual boiler light offs
with residual fuel indicated that 0bservant and trained operators using
proper procedures could conduct the light off in compliance with the
standard visible emission law (i.e., section 41701 of the California Health and Safety Code). The observations also indicated that limiting
the emissions to an opacity level less than 40 percent except for 3 min/hr
would be difficult in some cases, unless the light off procedure were
altered or distillate fuel used. Results of the visible emission
observations are surrrnarized in table 5-3; the entire observation reports
are included in appendix C.
Results of the first observation of a normal boiler light off using
residual fuel on a 18 year-old passenger vessel indicated that emissions
of 40 percent or greater opacity were generated. Of the 7.5 min when
emissions were equal to or greater than 40 percent opacity, 3.75 min were
attributable to lighting additional burners and sequencing burners after
fire had already been established. These operations were performed
because the particular engineer on duty desired a specific burner
arrangement different from that which existed during the initial light
off. The burner sequencing operation and the resulting brief period of
Table 5-3. Summary of Boiler Light-Off Visible Emission Observation
Ship
Cargo vessel
Cargo vessel
Naval vessel
Fuel
Residual
Residual
Distillate (DFM)
Duration of Observation
(min)
43.50
14.25
12.50
Duration at Opacity Levels (min)
<20% 20% to 40% ~40%
18.50 17.50 7.50
9.25 2.00 3.00
12.50 0.00 0.00
5-18

unstable combustion and emissions could have been delayed because the
vessel could have safely maneuvered out of port using the initial burner configuration. Neglecting the burner sequencing procedure and its 3 75 min contribution to the total time when emissions equaled or exceeded
the 40 percent level still leaves 3.75 min of excessive emissions
attributable to the initial light-off operation. During this period, air flow and register adjustments were made which reduced smoke to below 40 percent opacity. If these adjustments were made sooner after excessive smoke was noticed, full compliance with the 3-min/hr allowance could have
been achieved. In surnnary, in this specific situation, altering the light off
procedure to eliminate the need for burner sequencing and adjusting the boiler controls to optimize combustion sooner after smoke was noticed would have resulted in full compliance. Earlier detection of excessive smoke would have been possible if the vessel were equipped with a calibrated opacity monitor. Visual control of emissions to meet the 3-min
allowance by relying solely on the periscope and the judgment of the operator is difficult.
The second boiler light-off observation on a 14 year-old container
vessel confirmed that such light offs using residual fuel could be accomplished in compliance with the standard. During the light off, emissions of 40 percent opacity or greater were observed for 3 min. This particular vessel had been retrofitted with exhaust gas monitoring instrumentation (opacity and oxygen analyzers). The engineer closely
observed the oxygen analyzer readout and the stack conditions through the periscope during the period initially following the light off. (The opacity monitor did not appear to be operative or properly calibrated).
As a result, timely adjustments to the air flow were made which allowed full compliance with the standard regulation.
A normal boiler light off using distillate fuel was also observed.
At no time during the light off procedure did the emissions exceed the 40 percent opacity limit. In fact, the emissions averaged 10 percent or less. This vessel was approximately 12 years old and well maintained but was not equipped with exhaust gas analyzers.
While the results of these three normal boiler light-off observations (two using residual fuel and one using distillate fuel)
5-19

cannot be extrapolated to all vessels and light-off situations, they do
indicate that it is possible to comply with the standard emission
regulation (not exceeding 40 percent opacity except for 3 min/hr). In the
case of normal light offs with residual fuel, compliance can be
accomplished with increased operator awareness especially as provided by
the use of exhaust gas monitors. Light-off and warmup procedures may need
to be altered in some cases, as burner adjustment, sequencing, and
additional light offs can momentarily destabilize combustion and result in
excessive emissions. Eliminating or delaying these actions can make
meeting the 3-min/hr allowance easier.
Capital and Operating Costs
The capital and operating costs associated with implementing
actions to enhance operator awareness of regulations, correct light-off
procedure, and exhaust gas conditions are generally minimal and should not
preclude their implementation. The cost to the state or local air
pollution control agencies for printing and distribution of regulatory
advisories is considered to be negligible.
There is also minimal additional cost associated with having permanently assigned ship's engineers supervise boiler light offs.
However, there may be a minor cost associated with the time required to
train newly assigned boiler operators in the correct boiler light-off
procedures and the peculiarities of each boiler system or to train
shipboard personnel to observe visible emissions.
The alternative control options to increase operator awareness through the installation and use of opacity monitors and oxygen analyzers,
however, have economic impacts that must be evaluated by the ship owner/operator before a decision is made to retrofit ships with these
devices. While newer steam-powered vessels are routinely equipped with
such instrumentation to monitor stack gas conditions, older vessels must
be retrofitted with monitors and analyzers. Recent estimates place the
cost of retrofitted opacity monitors at $5,000 to $7,000 per boiler. The
addition of an oxygen analyzer would cost an additional $5,000 to $7,000
per boiler (reference 5-6). Analyzers which measure both oxygen and
combustibles (carbon monoxide) are available at additional cost. Operation and maintenance of stack gas instrumentation can be accomplished
5-20
by existing shipboard personnel at minimal additional cost. In addition, it is assumed that the retrofit of stack gas instrumentation would occur during periods of normal maintenance so that no additional costs for loss of shipping would be incurred. Therefore, while the addition of instrumentation could entail an initial expense on the order of $5,000 to $7,000, savings would accrue to the shipowner/operator due to more efficient operation of the boiler in port and at sea. Depending on the
remaining life of the vessel, the resulting savings could easily exceed the initial cost of installation.
Operational, Institutional, and Safety Concerns The available options to increase operator awareness through
notices in the boiler room, notification through agents, pilots and unions, and operator training present minimal concerns. Notification would require the voluntary cooperation of agents, pilots and unions and operator training must be performed in accordance with union regulations. It is expected that such training would be similar to safety training. The use of an observer may, in rare circumstances, require additional personnel. However, it is believed that shipboard assignments can be reschedueld such that existing ship personnel are available to observe the stack during the short periods of boiler light off and burner sequencing while in port. Stack gas instrumentation presents minimal operational problems because existing personnel should be able to operate and maintain the opacity mqnitors and oxygen analyzers. No safety problems are associated with any of the options to increase operator awareness. In fact, instrumentation may result in fewer boiler flarebacks and a lower probability of boiler explosions. This would lower maintenance costs and increase savings to the shipowner/operator.
The results of the evaluation of the options to increase operator awareness are summarized in table 5-4. 5.2.3 Distillate Fuel Use
Increased use of distillate fuel was judged to be a feasible option for operators to implement in order to reduce emissions from boiler light off and refractory drying operations. As noted earlier, these two modes of operation are essentially the same except when major overhauls or new installations of refractory are involved. This control option involves the increased use of distillate fuel for coal-boiler light offs on "dead''
5-21

----------------------------
-------------------
---- -- ----
Tab 1 e 5-4. Evaluation of Increased Operator Awareness Options
------------------------------------------·---------
Control Options Effect on Safety
• Notices in boiler rooms None
-·------------
Applicability to Vessels of
Different Types, Size, and Function
,-------
All --·----------------- ---
I • Notification through pilots, agents, unions
None All
• Operator training None -- possibly increases safety
A 11, as needed
• Observer None
----- ----All
(.11 I
N N
1------------------- r---
• Opacity monitor None -- possibly increases safety
Ships built prior to 1960 or those not already having them
• Oxygen analyzer None -- possibly increases safety
<--------- ----------------------- --------------
Ships built prior to 1970 to 1975 or those not al ready having them
~----~~· ·······~
Abatement Effectiveness
Difficult to quantifya
. .. . , ........ --- --- - -- -- - --
Capital Institutional and Opera-
and Legal Barriers Operating tional Energy to Implementation Costs Concerns Impact
·----------
None Minimal None None ·--·-~
Difficult to quantifya MinimalRequires voluntary None None cooperation of pilots, agents, and unions
Difficult to quantifya
Difficult to quantifya
Must be performed 1n compliance with union regulations, should be similar to safety training
Minimal None Minimal --may enhance optimal use of fuel
·-
May require addi-tional personnel
Labor costs if additional personne 1 are required
None None
Difficult to quantifya None $5,000 to $7,000 for capital costs, negligible operating cost
Minimal --existing personnel shoulrl he ab le to operate
None, can be used along with oxygen analyzer to optimize fuel use
~- -Difficult to quantifya None Same as
for opacity monitor
Minimal --existing personnel should be able to operate
None, can be used to optimize fuel use
--------- -
aThe abatement effectiveness of each of these options is difficult to quantify, however, implementation of these options should allow most operators to conduct a normal boiler light off in compliance with the standard visible emission law. Additional control measures may bP. necessary to keep cold-boiler light offs and other light off, under specific circumstances within the 3-min allowance of the standard regulation.

ships when steam for oil preheating and atomization are unavailable. The use of distillate fuel could also be extended to light offs on vessels
which have one boiler operating and steam available if alternate strategies to bring the emissions into compliance with the standard
visible emissions regulation are unsuccessful or not practical. Currently nearly all commercial marine boilers use heavy residual
fuel because of its availability and low cost. This heavy oil usually has a high ash and sulfur content and requires preheating prior to being
atomized and combusted. Excessive particulate emissions can be generated during the light-off operation as a result of: (1) poor fuel atomization
caused by cold fuel and combustion air, inadequate pressure or improper burner and/or nozzle selection, or (2) lack of sufficient combustion air.
By using a distillate fuel during the light-off operation, smoke-free combustion is easier to accanplish. Degree of Applicability
As far as could be ascertained within the scope of this study, most
if not all steam-propelled vessels are already equipped to use distillate fuel for boiler light offs. Of the 70 U.S. registered oceangoing ships over 2,000 tons that have been identified as being engaged in transoceanic
trade from California ports, owner/representatives have indicated that all are equipped to burn distillate fuel for light offs. Some U.S. registered ships have been identified that do not have the capability to burn distillate fuel however these vessels are not regularly involved in the
Pacific trade. The status of foreign steam-powered vessels with respect to their capability to burn distillate fuel is not known, however since
these vessels make a relatively small number of visits to California ports, the occurrence of foreign steamship boiler light offs is likely to
be minimal.
The degree to which this option could be implemented by vessel operators who could not otherwise meet the standard visible emission regulation by using alternate strategies (e.g., increased operator awareness) is difficult to quantify. Although most ships have the capability to burn distillate fuel, the extent that this fuel is currently being used for cold and normal light offs is not accurately known. Boiler manufacturers recommend that distillate fuel be used when steam is unavailable. It is believed that most vessel operators follow this
5-23

recommendation, however little information was available to confirm or
refute this assumption. When steam for fuel preheating and atomization is
available, residual fuel is usually always burned for the light off
therefore it is believed that the distillate fuel use option could be
extended to normal boiler light-off occurrences if necessary. Retrofit Installations
For those vessels not currently equipped to burn distillate fuel
for light offs, a fuel delivery system would have to be retrofitted if
this fuel were to be fired on a frequent basis. A completely independent
distillate fuel delivery system would most likely be required rather than
one which would simply supply this fuel to the boiler via the existing
onboard pumps and burner fuel system. Problems which could arise if
distillate fuel were passed through a fuel system normally designed to
handle residual fuel include the following: • Deposits, built up in supply piping normally handling residual
fuels, may break loose during the initial use of distillate
fuel due to its solvent action • Handling of distillate fuel in the existing system would
increase the danger of leakage because of distillate fuel's
lower viscosity
• Fuel pump slippage and improper or uncontrollable fuel pressure
regulation may occur since the fuel pumps have been designed
for highly viscous fuel
In addition, a completely separate system having minimal interconnections with the existing system would allow the boiler operator to switch over to
firing residual fuel with a minimum of difficulty once the boiler is warmed up.
The components required for a retrofit installation include a fuel
delivery pump(s), strainer, pressure control valve and appropriate
controller, safety shutoff valves, and interconnecting piping. In some
cases, burner modifications and/or new burner tips may be necessary since
distillate and residual fuels have diff~rent burning characteristics. Extensive alterations to existing fuel storage compartments or the addition of new compartments should not be required. Most ships are
equipped with diesel-powered generators to supply electrical power in
emergency situations and therefore have distillate fuel storage tanks.
5-24

r
Since distillate fuel would only be required for the 2 to 3 hr light-off period, sufficient capacity is available with these tanks. For typical
vessels, 300 to 900 lb/hr of distillate fuel is fired upon light off, therefore, approximately 50 to 400 gal of fuel would be required for a single boiler light off. Abatement Effectiveness
The reduction in visible emissions achieved by using distillate fuel for a boiler light off is difficult to quantify since pollutant formation is related to both fuel and the combustion conditions. The release of particulate matter, including sulfuric acid mist, generated as a result of fuel impurities such as ash and sulfur will be reduced in proportion to the amount by which distillate fuel is cleaner than residual fuel. Table 5-5 lists the range of analysis of typical fuel oils. Since the distillate fuel contains significantly less ash and sulfur than residual fuel, impurity-generated particulate matter is consequently lower.
Perhaps even more significant than impurity-generated pollutants are products of incomplete combustion (e.g., soot). During the light-off procedure, soot can be formed both by reactions in the flame and pyrolysis of organic carbon species. The quantity of soot formed is related to combustion conditions such as fuel atomization or air input and to fuel properties. Fuel parameters such as carbon-to-hydrogen ratio and carbon residue gives some indication of the difficulty in burning the fuel as well as the amount of carbon that can be expected to be carried over in the particulate emissions. Distillate fuel oil has a typical carbon-hydrogen ratio and carbon residue content of 6.8 and 0.35 percent respectively, while residual fuel has typical values of 8.2 and 15 percent. The lower values for the light distillate fuel indicate more complete and easier combustion.
In summary, the exact degree of particulate and visible emission reduction which would occur by using distillate fuel for boiler light offs cannot be quantified; however, by comparison of fuel properties, one can see that distillate fuel will burn cleaner and more easily. As mentioned earlier, pollutant emissions are in large part governed by operatorcontrollable variables .such as fuel atomization and air input. Because of its lower viscosity, distillate fuel does not require preheating and is easier to atomize than residual fuel. The ease by which distillate fuel
5-25

--------
- ---
----
--
----
--
--
----
--
----
----
--
----
--
Table 5-5. Analyses of Fuel Oils (Reference 5-7)
u, I
N O'I
------------------ ,-------------
No. 1Grade of Fuel Oil
Weight, percent Sulfur 0.01 to 0.05 Hydrogen 13.1 to 14.1 Carbon 85. 9 to 86. 7 Nitrogen Nil to 0.1 Oxygen Ash
Gravity Deg AP I 40 to 44 Specific 0.825 to 0.806 Lb per ga 1 6.87 to 6.71
Oto -50Pour point, F
Viscosity Centistokes at 100°F 1.4 to 2.2 SUS at lQOOF SSF at 1220F
Water and sediment, Volume percent
Heating value Btu/lb, grossb 19,670 to 19,860
aEst imated bcalculated
No. 2
0.05 to 1.0 11.8 to 13. 9 86.l to 88.2
Nil to 0.1
28 to 40 0.887 to 0.825
7.39 to 6.87
0 to -40
1. 9 to 3 .0 32 to 38
0 to 0.1
19,170 to 19,750
No. 4
0.2 to 2.0 (10 . 6 to 13 • O ) a ( 86. 5 to 89. 2) a
0 to 0.1
15 to 30 0.996 to 0.876 8.04 to 7.30
-10 to +50
10.5 to 65 60 to 300
tr to 1.0
18,280 to 19,400
No. 5
0.5 to 3.0 (10.5 to 12.o)a (86.5 to 89.2)a
0 to 0.1
14 to 22 0.972 to 0.922 8.10 to 7. 68
-10 to +80
65 to 200
20 to 40
0.05 to 1.0
18,100 to 19,020
No. 6
0.7 to 3.5 (9.5 to 12.o)a
(86.5 to qo,2)
0.01 to 0.5
7 to 22 1.022 to 0.922 8.51 to 7.68
+15 to +85
160 to 750
45 to 300
0.05 to 2.0
17,410 to 18,990

can be atomized and combusted is especially important during the light-off period when steam for preheating and atomization may not be available.
In addition, the overall emission reduction which would result if all boiler light offs were performed using distillate fuel cannot be quantified since it is not known how many of the estimated 2,000 such events occurring in California presently use residual or distillate fuel. It can be said that if an operator uses distillate fuel along with good
marine practices, he should be capable of easily complying with the standard visible emission regulation in nearly all situations. (i.e., less than 20 percent opacity except for 3 min/hr). This is evidenced by the light-off observation of the U.S.S. Wichita (see appendix C).
The use of distillate fuel for cold and normal boiler light offs will greatly reduce visible emissions generated during the initial light-off and boiler warmup procedure. However, short periods of excessive emissions can also result from cutting in the residual-oil burners or switching and lighting additional burners. These operations are performed when steam production is to be increased after the ship's boilers are warmed up. With proper operator attention, these procedures should only cause brief excursions in the visible emission level which can be limited to the 3-min allowance. Capital and Operating Costs
The costs associated with implementing this option for cold and normal boiler light offs consist of the capital cost of retrofitting the fuel delivery system if needed and operating costs. Two vendors that supply fuel delivery systems have provided budget estimates for the previously described equipment of approximately $20,000 to $25,000 (reference 5-8 and 5-9). These estimates did not include the equipment cost of the interconnecting piping or the cost for labor necessary to design and install the equipment. Considering all cost items, a retrofitted distillate fuel delivery system is estimated to require a capital investment of perhaps $40,000 to $80,000. As previously indicated, the number of vessels not presently equipped with such a distillate fuel delivery system and calling on California ports is believed to be small. However, if owners of these vessels are not able to bring their boilers into compliance by using alternate strategies and
5-27
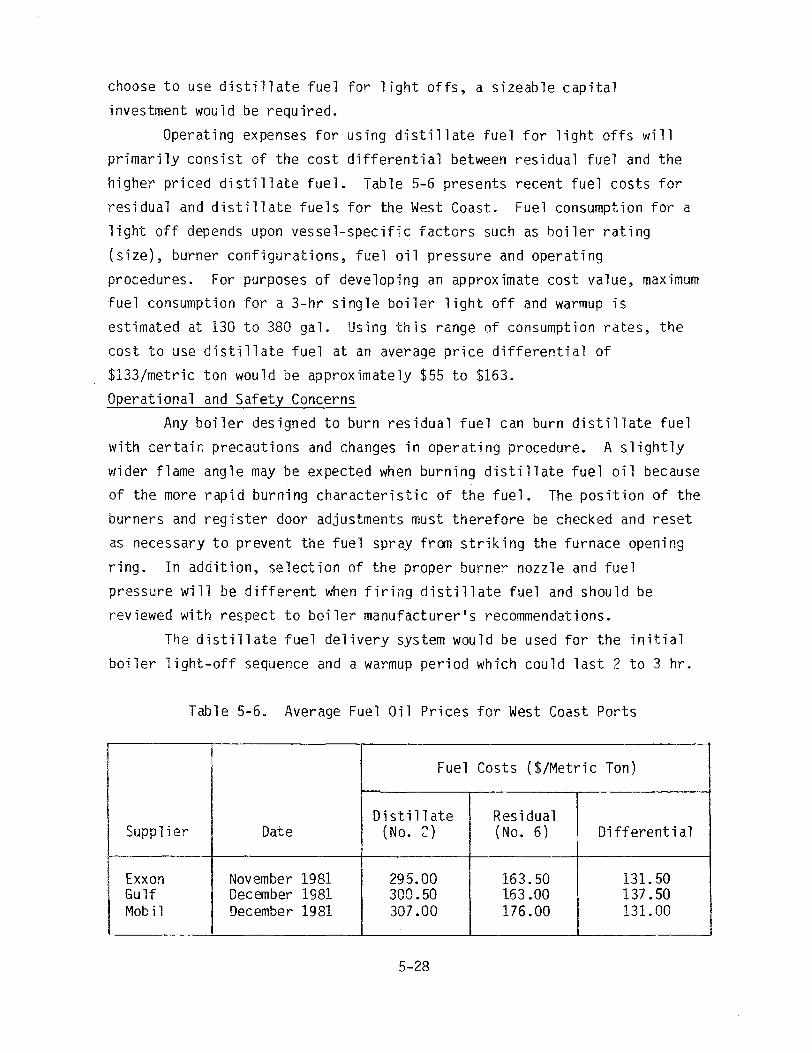
choose to use distillate fuel for light offs, a sizeable capital
investment would be required.
Operating expenses for using distillate fuel for light offs will
primarily consist of the cost differential between residual fuel and the
higher priced distillate fuel. Table 5-6 presents recent fuel costs for
residual and distillate fuels for the West Coast. Fuel consumption for a
light off depends upon vessel-specific factors such as boiler rating
(size), burner configurations, fuel oil pressure and operating
procedures. For purposes of developing an approximate cost value, maximum fuel consumption for a 3-hr single boiler light off and warmup is
estimated at 130 to 380 gal. Using this range of consumption rates, the
cost to use distillate fuel at an average price differential of $133/metric ton would be approximately $55 to $163.
Operational and Safety Concerns Any boiler designed to burn residual fuel can burn distillate fuel
with certain precautions and changes in operating procedure. A slightly
wider flame angle may be expected when burning distillate fuel oil because of the more rapid burning characteristic of the fuel. The position of the
burners and register door adjustments must therefore be checked and reset
as necessary to prevent the fuel spray frcrn striking the furnace opening
ring. In addition, selection of the proper burner nozzle and fuel
pressure will be different when firing distillate fuel and should be
reviewed with respect to boiler manufacturer's recommendations.
The distillate fuel delivery system would be used for the initial
boiler light-off sequence and a warmup period which could last 2 to 3 hr.
Table 5-6. Average Fuel Oil Prices for West Coast Ports
Supplier Date
Fuel Costs {$/Metric Ton)
Distillate (No. ::')
Residual (No. 6) Differential
Exxon Gulf Mobil
November 1981 December 1981 December 1981
295. 00 300.50 307.00
163.50 163 .00 176.00
131.50 137.50 131. 00
5-28
[
The completely independent system would typically require one burner port, leaving the remaining ports available to be readied for firing residual oil when the boiler warmup is complete and the appropriate conditions exist. Since the distillate fuel delivery system is isolated from the installed combustion control and burner management system, close supervision during the light off and warmup period is necessary. Distillate fuel is more volatile than residual fuel, thus flame stability at low firing rates is lower than with residual fuel. Constant observation and care must be exercised in using this system so that unstable and unsafe combustion conditions do not occur.
The increased use of distillate fuel for cold and normal boiler light offs should present no additional safety concerns provided the operating personnel are familiar with the proper procedures for using distillate fuel and proper safeguards are a part of the fuel delivery system. These safety measures should include the use of adequate control
and shutoff valves and system components normally designed for fuel handling. The system must allow the operating crew to maintain complete control of pertinent operating variables such as fuel flow and delivery pressure. It also must meet applicable Cost Guard and other regulatory agency and/or insurance standards and regulations. Distillate fuel (i.e., distillate fuel marine, DFM) is routinely used for all operating modes on U.S. Naval vessels.
5-29

SECTION 5 REFERENCES
5-1. Personal Corrrnunication - Telephone conversation between Norman Buckland, Forney Engineering Company, Addison, TX and A. W. Wyss, Acurex Corporation, Mountain View, CA, October 8, 1981 (Visible Emissions from Boiler Light off).
5-2. 11 Naval Ships Technical Manual, Chapter 9550, Petroleum Fuels Stowage, Use and Testing, 11 Naval Ship Systems Command, Washington, o. c., 1972.
5-3. Eliot, R. C., ed., 11 Boiler Fuel Additives for Pollution Reduction and Energy Saving, 11 Noyes Data Corporation, Park Ridge, NJ, 1978.
5-4. Personal Communication - Letter from James H. Oliver, U. S. Coast Guard, San Francisco, CA, to A. W. Wyss, Acurex Corporation, Mountain View, CA, May 7, 1981 (Coast Guard Emission Test Requirements).
5-5. Personal Communication - TWX from Ahmed Akacem, Koch Co., New York, NY to A. W. Wyss, Acurex Corporation, View, CA, November 5, 1981 (Scrubber Cost Data).
Engineering Mountain
5-6. Personal Corrrnunication - Telephone conversation between Paul Flin, R.H. Wager Co, Chatham, NJ and A. W. Wyss, Acurex Corporation, Mountain View, CA, January 4, 1982 (Opacity Monitor Cost Data).
5-7. 11 Steam - Its Generation and Use", Company, New York, NY, 1978.
39th edition, Babcock and Wilcox
5-8. Personal Communication - TWX from R. A. Longo, The Engineering Company, South Plainfield, NJ to A. W. Wyss, Acurex Corporation, Mountain View, CA, October 27, 1981 (Distillate Fuel DeliverySystem Cost Data).
5-9. Personal Communication - TWX from Albert J. Senterman, Coen Company, Inc., Rockaway, NJ to A. W. Wyss, Acurex Corporation, Mountain View, CA, November 2, 1981 (Distillate Fuel DeliverySystem Cost Data).
5-30
SECTION 6
REGULATORY RECOMMENDATIONS AND FUTURE TRENDS
After considering the nature, quantitative extent, and potential solutions to ·the visible emissions situation characteristic of vessels operating in the exempted modes, regulatory recorrmendations are suggested. This section details and provides justification for these recorrmendations and discusses future trends in the marine industry and expected impacts on visible emissions. 6.1 REGULATORY RECOMMENDATIONS
The California Health and Safety Code as arrmended in 1978 allows for unlimited exemptions to the visible emission standard for vessels using steam boilers during emergency boiler shutdowns, safety and operational tests, and maneuvering to avoid hazards. It is the recorrmendation of this study that this exemption (section 41704j of Chapter 3 of the California Health and Safety Code) remain in effect indefinitely. As discussed in section 5.1, these operating modes and the sebsequent brief periods of excessive emissions come about as a result of
efforts to promote and ensure crew and vessel safety. The paramount need to operate vessels in a safe manner outweighs environmental concerns which may stem from the infrequent and brief periods of excessive emissions. As marine boiler combustion control systems continue to be upgraded and automated, the frequency and duration of less than optimum combustion will decrease since these newer control systems have improved response times.
Section 41704k of Chapter 3 of the Health and Safety Code allows visible emissions from vessels using steam boilers to be in excess of Ringelmann 2 (40 percent opacity) for up to a total of 15 min in any 1 hr during cold-boiler light offs and while drying wet or green refractory. This section is to remain in effect until January 1, 1984. It is the
6-1

recommendation of this study that this exemption remain in effect until
the 1984 date. After January 1, 1984, the exemption should not be
reenacted. Vessels with steam boilers will then be required to comply
with section 41701 of the code. That is, visible emissions cannot exceed Ringelmann 2 for more than 3 min in any 1 hr for boiler light offs and
refractory drying operations.
The findings of this study indicate that vessel operators can, by
1984, confine visible emissions exeeding Ringelmann 2 to 3 min/hr for all
boiler light offs including those associated with refractory drying
operations. Unlike boiler operations required for maneuvering to avoid
hazards, government testing and emergency boiler shutdowns, there appears
to be little or no technical, economic, or operational justification for a special exemption for boiler light offs. By enhancing operator awareness
and/or burning distillate fuel for light offs, vessels with steam boilers
can be brought into compliance with the standard visible emission
regulation (i.e., not to exceed Ringelmann 2 for more than 3 min/hr).
During this study, it became obvious that vessel operators must contend with constraints which make conducting a boiler light off in
compliance with the standard regulation difficult, but not impossible.
Cold and/or wet furnace surfaces, poor fuel quality, inexperienced
operating crews, and schedule demands will contribute to conditions which
can lead to excessive emissions. However, by using informed and observant
operators aided by the use of exhaust gas opacity or oxygen analyzers,
most light offs with residual fuel can be conducted in compliance with the
standard regulation. This is especially true for normal boiler light offs
where steam for residual fuel preheating and atomization is available. It
should be noted that in some cases, the light-off procedure may need to be
altered to confine excessive emissions to the 3-min/hr limit. For
example, since the adjustment, sequencing, and light off of additional
burners once the flame has been established can momentarily destabilize
combustion, these actions should be minimized or perhaps delayed so that
the allowable period of excessive emiss~ons is not exceeded. Extending
the period of boiler light off and warmup can also make meeting the standard limitation easier.
In those cases where light offs with residual fuel cannot be
performed in compliance with the 3~min limitation, the use of distillate
6-2

fuel for light off is suggested. These instances might include light offs
of cold boilers on 11 dead 11 ships or boilers with wet or green refractory. (Note, manufacturer's recommendations call for using distillate fuel in these circumstances.) Use of distillate fuel for light offs may also be necessary for vessels not equipped with wide-range, steam-atomizing burners (believed to be few) or when extremely poor quality fuel is encountered.
The impacts of the operator awareness and distillate fuel use options are summarized in table 6-1. It can be seen that these options have minimal economic, operational, institutional, and safety impacts while possessing a high degree of effectiveness and applicability. These abatement strategies do not require new or untried technology. In the rare instance that these options are not feasible for some vessel operators, additional options as outlined in table 5-1 may be used.
Minimal time should be required for vessel operators to implement
the control options necessary to bring their vessels into compliance with the standard visible emission regulation. It is believed that some operators could implement the necessary procedures almost immediately since compliance can be achieved, in many cases, by merely altering light-off procedures. However, for a realistic transition period applicable to nearly all vessel operators, a 6-month period is suggested as adequate for implementing measures to enhance operator awareness. This period should be sufficient for notifying and training operators, as well as retrofitting exhaust gas instrumentation if necessary. Exhaust gas opacity monitors and oxygen analyzers are readily available items which
can be procured, installed, and checked out in this time. This period should allow such equipment modifications to be made during normally
scheduled port visits. For those cases where distillate fuel is to be used for boiler light offs, minimal advance preparations are needed for most vessels since the fuel delivery systems are already in place. Therefore, if the exemption of section 41704(k) is to be discontinued
after January 1, 1984, vessel operators should be given at least 6 months prior notification so that necessary steps can be taken.
It should be noted that vessels calling on ports in the states of Washington and Oregon are given no special exemptions to the standard visible emission regulation (references 6-1, 6-2 and 6-3). Thus, by not
6-3
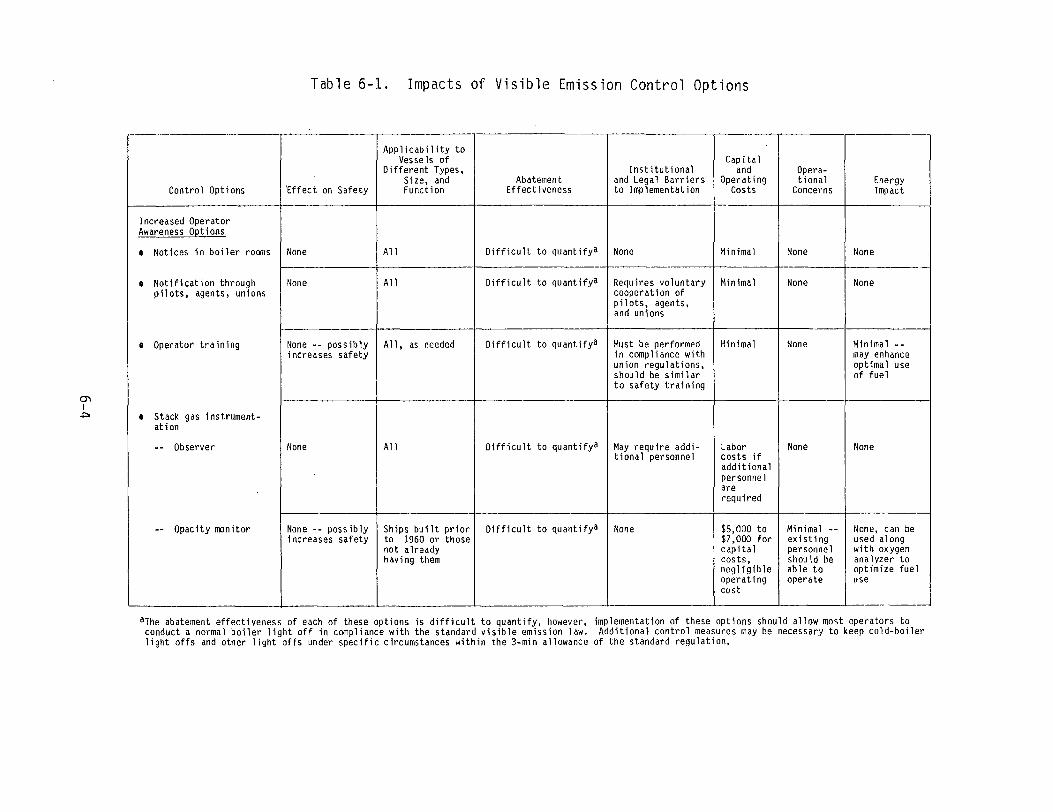
Tab 1 e 6-1. Impacts of Visible Emission Control Options
Control Options 'Effect on Safety
Applicability to Vessels of
Different Types, Size, and Function
Abatement Effectiveness
Institutional and Legal Barriers to Implementation
Capitaland
Operating Costs
Opera-tional
Concerns Energy Impact
Increased Operator Awareness O~tions
None All Difficult to quantifya None Minimal None None• Notices in boiler rooms
• Notification throughpilots, agents, unions
• Operator training
None A11 Difficult to quantifya Requires voluntarycooperation of pilots, agents,and unions
Minimal None None
None -- possibly All, as needed Difficult to quantifya Must be performed Minimal None Minimal --
• Stack gas instrument-at ion
-- Observer
-- Opacity rronitor
increases safety in compliance with union regulations,should be similar to safety training
may enhance optimal use of fuel
None Al1 Difficult to quantifya May require addi-tional personnel
Labor costs if additional personnel are required
None None
None -- possibly Ships built prior Difficult to quantifya None $5,000 to Minimal -- None, can be increases safety to 1960 or those $7,000 for existing used along
not already capital personnel with oxygen having them costs, should be analyzer to
negligible able to optimize fuel operating operate use cost
O'\ I
.i::,.
arhe abatement effectiveness of each of these options is difficult to quantify, however, implementation of these options should allow most operators to conduct a normal boiler light off in compliance with the standard visible emission law. Additional control measures may be necessary to keep cold-boiler light offs and other light offs under specific circumstances within the 3-min allowance of the standard regulation.

,-::-,, ''1r• ('\
Table 6-1. Cone l uded
Control Options
Increased OperatorAwareness Options[Continued)
-- Oxygen analyzer
Increased Use of Distillate Fuel
• Fuel system in place
O') I u,
• Fuel system needed
Effect on Safety
None -- possiblyincreases safety
Potential impact on safety as fuel is more volatile than residual fuel
See note above, must design and insta 11 systemacceptable to safety codes
Applicability to Vessels of
Different Types,Size, and Function
Ships built prior to 1970 to 1975 or those not already havingthem
All, unless specific companypolicy restricts distillate fuel use
Believed to be requied for few vessels
Abatement Effectiveness
Difficult to quantifya
Difficult to quantify,however, should be able to light-off and meet standard in nearly al 1 cases
See above note
Institutional and Legal Barriers to Implementation
None
None, unless specific company or insurance provisions restrict its use
Retrofitted fuel delivery system must conform to U.S. Coast Guard or other app 1 i c-able regulations
Capital and
OperatingCosts
Same as for opacity monitor
Negligible capital cost, $50 to $200 per boiler 1 ight off for aper-ating cost
Capital cost of $40,000 to $80,000, operating costs same as above
Opera-tional
Concerns
Minimal --existingpersonnelshould be able to operate
Minimal --must observe safety precau-tions
Minimal --see above
arhe abatement effectiveness of each of these options is difficult to quantify, however, implementation of thesl! options should allow most
Energy Impact
None, can be used to optimize fuel use
None
None
operators to conduct a normal boiler light off in compliance with the standard visible emission law. Additional control measures may be necessary to keep cold-boiler light offs and other light offs under specific circumstances within the 3-min allowance of the standard regulation.

extending the current California exemption beyond 1984, it is extremely unlikely that vessel operators will switch to ports with less restrictive air emission limitations. This possibility was eluded to by the maritime
industry at the time SB 2198 was being considered. In addition, it should be noted that all five regional regulatory agencies in the port areas studied have adopted 11 breakrlown" rules. Each regulation varies slightly, but has the general effect of giving operators the opportunity to seek relief from the regulation in cases where the generation of excessive emissions was caused by malfunctioning equipment or unforeseeable failure.
Additionally~ it is recommended that vessel operators be required to meet the Ringelmann 2 (40 percent opacity) limitation of the Health and
Safety Code (section 41701) rather than more restrictive visible emission regulations established by most regional air pollution control districts. As indicated in section 2, table 2-6, four of the five air pollution contra 1 districts having j uri sdi cti on in California port areas have adopted and currently enforce visible emission regulations which limit emissions to Ringelmann Number 1 (20 percent opacity) except for 3 min/hr.
Vessel operators lighting off their boilers with residual fuel would have difficulty meeting the Ringelmann 1 limitation even with observant operators using "good marine practice11 and exhaust gas analyzers. The Ringelmann 1 level was exceeded for considerably more than 3 min/hr during both of the observed boiler light offs using residual fuel
(see appendix C). In order to comply with the Ringelmann 1 limitation, most if not all vessel operators would be forced to light off with distillate fuel. It is believed that the less restrictive Ringelmann 2 limitation will allow most operators to comply without having to use
distillate fuel for all boiler light offs. Increased operator awareness and use of distillate fuel in an infrequent number of special situations
(e.g., cold light offs on a 11 dead 11 ship) should allow most operators to comply with a Ringelmann Number 2 limit.
6.2 TRENDS IN MARINE OPERATIONS AND PRACTICES The maritime industry in California is a continuely changing to
meet new opportunities and constraints. Ship traffic changes as new cargo handling capabilities become available in specific ports or as new trade routes are established. The makeup of vessels calling on California ports also varies as old vessels are scrapped and new vessels are built. The
6-6

r
propulsion equipment installed on these new ships is adjusted so that fuel
use is optimized. This fuel, however, fluctuates in price, quality, and availability due to the unstable world supply and demand situation. All
these factors and current trends in the shipping industry can affect ccxnbustion-generated emissions and the need for controls.
Over the last 10 years, port traffic in San Francisco Bay measured by calls for pilots, has increased by an average of approximately 0.5 percent annually. Port traffic in San Diego has actually decreased over the last 3 years, the only years for which figures are available. Traffic for the port of Long Beach has almost doubled over the last 10 years with greater than two-thirds of the ship visits being made by
foreign {diesel) ships. Since world trade is expected to continue to increase, especially trade between China and San Francisco, the rate of ship movement can be expected to continue to increase. Most of these ships can be expected to be built and registered in foreign countries, and
to be diesel powered. In recent years the share of world ship construction performed in
United States yards has dropped dramatically, as has the percentage of ships under United States registry. Therefore, the ship visits to California ports will be predominately by foreign built ships. Since foreign built ships use motor propulsion almost exclusively, future ship visits will be predominately by motor-powered ships~
Many foreign ships seem to be scrapped between 20 and 25 years of age, while U.S. ships are scrapped between 25 and 35 years of age. In general, ships older than 25 years are either rebuilt or scrapped. In the near future this should result in the elimination of old (Type II) boiler control systems from the active fleet. Many of these older vessels have already been upgraded with retrofitted ccxnbustion controls. Improvements in these controls over the last 20 years have been with the primary objectives of:
• Improving equipment safety and reliability • Improving fuel efficiency • Reducing manning requirements • Improving working environment for watchstanders
After safety, econcxnics remains the greatest incentive for control system changes. The tendency to burn different fuel types also requires that
6-7
systems be able to anticipate and compensate for variations in the effects
of different fuels.
Pneumatic control systems introduced about 20 years ago constitute
only 15 percent of new installations, and electric analog controls have undergone a similar decrease in popularity. Most new boiler control systems are based upon microprocessor control, which allows the system to measure fuel quantity and heat content, air volume and density, flue gas
flow and oxygen content, and to integrate these measurements for optimum
burner management and combustion control. The new microprocessor-based
boiler control systems have been available for approximately 7 years. These controls function over the range from standby to in excess of
100 percent of full-power rating and include opacity monitors and oxygen
sensors. This a11 ows thes2 automated systems to provi de the best
available performance in l~miting visible emission over most of the boiler operating range.
Future changes in fuel type and quality will also have a considerable effect on the current operating fleet and on new vessels
brought into service. Recently, fuel costs have become significant and are the largest single operating expense for ship operators. A continual degradation in fuel quality has also been observed and is expected to continue in the future as refiners attempt to obtain more high priced
distillates out of each barrel of crude. Marine use of residual fuel
presently consumes approximately 0.6 perent of refinery production,
therefore, the maritime industry has little or no influence and must accept whatever products the refiners offer.
Alternate fuels for steam-propelled ships must be viewed in terms of two general groups of ships: those already constructed or committed,
and those to be built in the future. For ships in the first category, the
date of purchase of the boilers is significant. Boilers ordered before about the middle 1960 1 s do not have the wider tube spacing, mass-action
retractable soot bl owers and steam atomization essential for burning the
degraded residual fuels expected during the 1980 1 s. These older ships will require reasonably good residual fuel. Steamships whose boilers were ordered after about the middle 1960's generally will be able to burn the degraded residual fuels of the 1980 1 s, provided they have enough capacity
6-8

in the fuel-oil heaters, a readily corrected problem. In general, these ships may be able to burn coal-oil slurry; however, neither the old nor the new ships can readily be retrofitted to burn coal. Steamships to be built in the future can readily be designed to burn coal using stoker-fired boilers. Other forms of coal firing are less likely to be used.
Decisions concerning marine fuels for future ships will undoubtedly be based primarily upon availability of supplies, relative costs and propulsion plant efficiency. The increased efficiency of motorships over steam propulsion ships will significantly influence the choice of propulsion plant selected. During the next 20 years, the probability of corrmercial development of various fuels and their application for existing and future ships is as follows:
Probabi 1ity Existing Ships Future ships
High Synfuels -- Tar Sand Coal, coal/oil slurry -- Shale -- Coa1 liquid Synfuel -- Tar sands
-- Shale -- Coal liquid
Medium Coa1 / o i 1 s1urr y Nuclear, sail assist
Low Coal/methanol, ethanol, Coal/methanol, ethanol, methanol, alcohol blends, methanol, alcohol blends, sail assist, nuclear, methane coal
A great deal of interest has been expressed in the use of coal and coal/oil slurry as a marine fuel. Coal burning ships were in use on the Great Lakes through the 1950's, and new technology is being applied to make its reintroduction attractive. Boiler manufacturer's have recently received orders for coal-fired boilers to be installed on several ships at three different shipyards. Ships burning coal or coal slurry may present new problems in emission controls; however, most designs have provisions for burning an alternate (distillate or other liquid) fuel during cold boiler light offs. This provision should minimize the possibility of excessive emissions during cold light off of these boilers.
6-9

In summary, the near-term situation suggests that visible emisisons
which exceed the limit as a result or steam boiler light offs will likely decrease as old equipment is upgraded and new motor-powered vessels
replace steam units. This is not meant to imply that motor-powered
vessels do not experience operating conditions leading to excessive
visible emis~ions. These vessels currently have no special visible emission exemptions and apparently are able to comply with the standard
regulation in most cases. The long-term situation with respect to marine
propulsion plants and emissions is less certain. As coal and synfuel use
increases, regulatory agencies responsible for the maintenance and improvement of air quality will need to be aware of the potential impacts
and see that appropriate steps are taken to minimize emissions.
6-10

SECTION 6 REFERENCES
6-1. Personal Conmunication - Telephone conversation between Hank Droege, Washington State Department of Ecology, Olympia, WA and A. W. Wyss, Acurex Corporation, Mountain View, CA, January 28, 1981 (Visible Emission Regulations).
6-2. Personal Conmunication - Telephone conversation between Michael Wurl, Puget Sound Air Pollution Control District, Seattle, WA and A. W. Wyss, Acurex Corporation, Mountain View, CA, November 12, 1981 (Visible Emission Regulations).
6-3. Personal Corrmunication - Telephone conversation between Van Kolias, Oregon Department of Environmental Quality, Portland, OR and A. W. Wyss, Acurex Corporation, Mountain View, CA, November 13, 1981 (Visible Emission Regulation Exemptions).
6-11

APPENDIX A
NORMAL MODE EMISSION CALCULATIONS
A-1

( \ ( \ ,.,I 1 /''i
Table A-1. Emission Calculations -- Normal Operations -- San Francisco Bay Steam-Powered Vessels
Parameter
Quantities/Ship Type
Source Passenger . Dry Cargo Tankers Military
1. Average shaft_ horsepower
Maneuvering Fuel Consumetion (eer visit!
Table 4-2
Table 4-3
21,200
4.4
27,500
5.2
12,300
6.6
60,000
6.62. Duration (hr)3. Load (percent) Table 4-5 55 35 43 15 4. SFca factor (lb/SHP-hr) Figure 4-2 0.528 0.546 0.505 0,580 5, Fuel rate (lb/hr) Calculation 6, 156 5,255 2,671 5,220 6. Fuel consumption (lb) Calculation 27,089 27,327 17,628 34,452
Hotelin9/Unloadin9 Fuel Consumetion (eer visit)
Table 4-4 24 40 45 48., I• Duration {hr) 8. Load (percent) Table 4-5 32 12 25 10 9. SFC factor {lb/SHP-hr) Figure 4-2 0,550 0,591 0.525 0.600
10. Fuel rate {lb/hr) Calculation 3,731 1,950 1,614 3,600 11. Fuel consumption (lb) Calculation 89,549 78,012 72,647 172,800
Total Fuel Consumetion - Normal Oeerations
Calculation 116,638 105,339 90,275 207,25212. Per visit {lb ) 13. Number of annual visits Table 4-1 55 648 943 111 14. Annual total {1,000 gal) Calculation 802 8,532 10,641 3,286
Emissions
15. Particulate emission factor {lb/1,000 gal) Table 4-6 23 23 23 15 16. Particulate emissions (short tons/yr) Calculation 9.2 98. 1 122.4 24.7
►I w
aspecific fuel consumption

Table A-2. Emission Calculations -- Normal Operations -- San Francisco Bay Motor-Powered Vessels
Quantities/Ship Type
Parameter Source Passenger Dry Cargo . Tankers Military Tugs/Tows
l. Average shaf_t horsepo~1er Table 4-2 18,600 15,200 15,900 20,000 1,000
Maneuvering Fuel Consumetion {eer visit)
2. 3. 4. 5. 6.
Duration (hr)Load (percent) SFC factor (lb/SHP-hr) Fuel rate (lb/hr)Fuel consumption (lb)
Table 4-3 Table 4-5 Figure 4-3 Calculation Calculation
4.4 55 o. 336
3,437 15, 124
5.2 50 0.337
2,561 13,318
6.6 58 0.335
3,089 20,390
6.6 35 0.341
2,387 15,754
5.2 80 0.365
272 1,518
Hotel in9/Unloadin9 Fuel Consumetion (.eer visit)
;J> l
+'>
7. Duration (hr) 8. Load (percent) 9. SFC ractor (lb/SHP-hr)
10. Fuel rate (lb/hr) 11. Fuel consumption (lb)
Total Fuel Consumetion - Normal 0eerations
Table 4-4 Table 4-5 Figure 4-3 Calculation Calculation
24 32 0.322
1,917 45,997
40 12 0.332
606 24,222
45 25 0.326
1,296 58,313
48 10 0.333
666 31,968
0 --------
12. 13. 14.
Per visit (lb)Number of annual visits Annual total (1,000 gal)
Calculation Table 4-1 Calculation
61, 121 30
262
37,541 2, 113
11,331
78,703 184
2,069
47,722 44
300
1,518 164 36
Emissions
15. 16.
Particulate emission factor (lb/1,000 gal) Particulate emissions (short tons/yr)
Table 4-6 Calculation
25 3.3
25 141.6
25 25.9
25 3.8
25 0.4

( '\ ( ,, ,_., ,.,
Table A-3. Emission Calculations -- Normal Operations -- Los Angeles/Long Beach Harbor Steam-Powered Vessels
)::,, I
u,
Parameter
Quantities/Ship Type
Source Passenger Dry Cargo Tankers Military
1. Average Shaft Horsepower
Maneuvering Fuel Consumetion {eer visit}
Table 4-2
Table 4-3
22,000
3.4
22.000
3.4
22,000
3.4
60,000
. 3.42. Duration (hr)3. Load (percent) Table 4-5 55 35 43 15 4. SFC factor (1 b/SHP-hr) Figure 4-2 0.528 0.546 0.505 0.580 5. Fuel rate (lb/hr) Calculation 6,389 4,204 3,866 5,220 6. Fuel consumption (lb) Cal cul ati on 21,723 14,294 13,142 17,748
Hoteling/Unloading Fuel Consumetion (eer visit}
Table 4-4 40 40 48 oa7. Duration (hr) 8. Load (percent) Table 4-5 32 12 25 --9. SFC factor (l b/SHP-hr) Figure 4-2 0.550 0.591 0.525 --
10. Fuel rate (lb/hr) Calculation 3,872 1,560 2,336 --11. Fuel consumption (lb) Cal cul ati on 154,880 62,409 112,140 --Total Fuel Consumetion - Normal Oeerations
Calculation 176,603 76,704 125,282 17,74812. Per visit (lb) 13. Number of annual visits Table 4-1 72 629 954 323 14. Annual total (1,000 gal) Cal cul ati on 1,589 . 6,031 14,940 819
Emissions
15. Particulate emission factor (lb/1,000 gal) Table 4-6 23 23 23 15 16. Particulate emissions (short tons/yr) Calculation 18.3 69.4 171.8 6.1
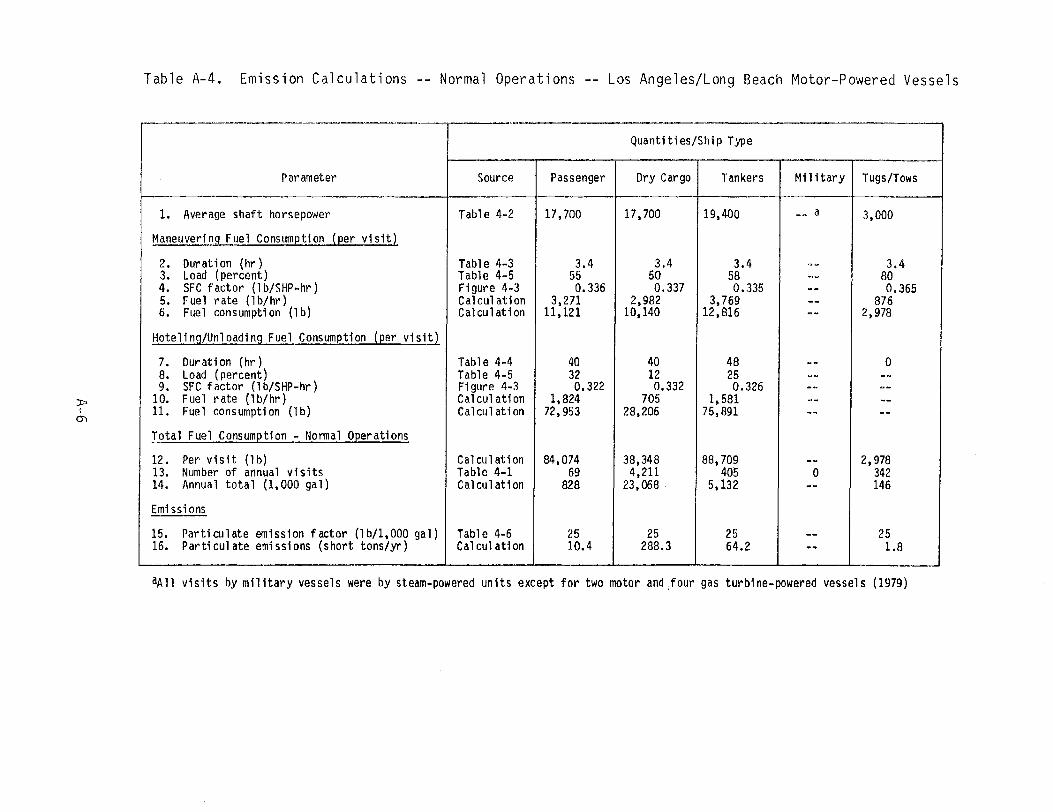
Table A-4. Emission Calculations -- Normal Operations -- Los Angeles/Long Beach Motor-Powered Vessels
Parameter
Quantities/Ship Type
Source Passenger Dry Cargo Tankers Military Tugs/Tows
1. Average shaft horsepower
Maneuvering Fuel Consumetion {eer visit)
Table 4-2
Table 4-3
17,700
3.4
17,700
3.4
19,400
3.4
-- a
--
3,000
3.42. Duration (hr)3. Load (percent) Table 4-5 55 50 58 -- 80 4. SFC factor (lb/SHP-hr) Figure 4-3 0.336 0.337 0.335 -- 0.365 5. Fue l rate ( 1 b / hr ) Cal cul at1on 3,271 2,982 3,769 -- 876 6. Fuel consumption (lb) Cal cul at ion 11,121 10,140 12,816 -- 2,978
Hoteling/Unloading Fuel Consumption (eer visit)
Table 4-4 40 40 48 -- 07. Duration (hr ) 8. Load (percent) Table 4-5 32 12 25 -- --9. SFC factor (1 b/SHP-hr) Figure 4-3 0,322 0.332 0.326 -- --
10. Fuel rate (lb/hr) Ca1cul ati on 1,824 705 1,581 -- --11. Fuel consumption (lb) Ca1cu 1 at i on 72,953 28,206 75,891 -- --Total Fuel Consumetion - Nonnal Oeerations
Ca1cu 1at ion 84,074 38,348 88,709 -- 2,97812. Per visit (1 b) 13. Number of annual visits Table 4-1 69 4,211 405 o 342 14. Annual total (1,000 gal) Ca1cu 1at i on 828 23,068 . 5,132 -- 146
Emissions
15. Particulate emission factor (lb/1,000 gal) Table 4-6 25 25 25 -- 25 16. Particulate emissions (short tons/yr) Calculation 10.4 288.3 64.2 -- 1.8
;p I
0-,
aAll visits by military vessels were by steam-powered units except for two motor and,four gas turbine-powered vessels (1979)

r -, '1
Table A-5. Emission Calculations -- Normal Operations -- San Diego Steam-Powered Vessels
Parameter
Quantities/Ship Type
Source Passenger Dry Cargo Tankers Military
1. Average shaft horsepower
Maneuvering Fuel Consumetion (eer visit)
Table 4-2
Table 4-3
21,200
5.2
27,500
5.2
12,300
5.2
60,000
5.22. Duration {hr)3. Load (percent) Table 4-5 55 35 43 15 4. SFC factor (lb/SHP-hr) Figure 4-2 0.528 0.546 0.505 0.580 5. Fuel rate {lb/hr) Calculation 6,156 5,255 2,671 5,220 6. Fuel consumption {lb)
Hoteling/Unloading Fuel Consumetion (eer visit)
Calculation
Table 4-4
32,011
24
27,326
120
13,889
24
27,144
oa7. Dur at ion (hr)8. Load (percent) Table 4-5 32 12 25 --9. SFC factor {lb/SHP-hr) Figure 4-2 0.550 0.591 0.525 --
10. Fuel rate (lb/hr) Ca lcul at ion 3,731 1,950 1,614 --11. Fuel consumption {lb) Calculation 89,544 234,000 38,745 --Total Fuel Consumetion - Normal 0eerations
Calculation 121,555 261,326 52,634 27,14412. Per visit {lb)13. Number of annual visits Table 4-1 3 41 8 2,73714. Annual total (1,000 gal)
Emissions
Ca lcul at ion 46 1,339 53 10,613
15. Particulate emission factor (lb/1,000 gal) Table 4-6 23 23 23 15 16. Particulate emissions (short tons/yr) Calculation 0.5 15.4 0.6 122.1
)::, I
-...J
~ilitary vessels use shore power

Table A-6. Emission Calculations -- Normal Operations -- San Diego Motor-Powered Vessels
Parameter
Quantities/Ship Type
Source Passenger Dry Cargo Tankers Military Tugs/Tows
1. Average shaft horsepower
Maneuvering Fuel Consumetion (eer visit). 2. Duration (hr)3. Load (percent) 4. SFC factor ( lb/SHP-hr) 5. Fuel rate (lb/hr) 6. Fuel consumption (lb)
Hoteling/Unloading Fuel Consumetion (eer visit)
Table 4-2
Table 4-3 Table 4-5 Figure 4-3 Calculation Calculation
Table 4-4
b
----------
--
15,200
5.2 50 0.337
2I 561 13,317
120
15,900
5.2 58 0.335
3,089 16,062
24
b
----------
--
1,000
5.2 80 0,365
292 1,518
a7. Duration (hr) 8. Load (percent) 9. SFC factor (lb/SHP-hr)
Table 4-5 Figure 4-3
----
12 0.332
25 0.326
----
----
10. Fuel rate (lb/hr) Calculation -- 606 1,296 -- --11. Fuel consumption (lb) Ca 1 cul at ion -- 72,720 31,104 -- --Total Fuel Consumetion - Normal 0eerations
Calculation -- 86,037 47,166 -- 1,51812. Per visit ( lb) 13. Number of annual visits 14. Annual total (1,000 gal)
Table 4-1 Calculation
0 --
111 1,364
1 7
0 -
92 20
Emissions
15. Particulate emission factor (lb/l,000 gal) 16. Particulate emissions (short tons/yr)
Table 4-6 Calculation
----25 17.1
25 0.1
----25 0,3
)=, I
():)
aNo engines operatingbNo visits made by vessels of the respective types

( \ /I '1 ' 1
Table A-7. Emission Calculations -- Normal Operations -- Ventura County Steam-Powered Vessels
Parameter
Quantities/Ship Type
Source Passenger Dry Cargo Tankers Military
1. Average shaft horsepower
Maneuvering Fuel Consumetion {eer visit}
Table 4-2
Table 4-3
a
--
16,g:)0
3.6
18,000
6
60,000
3.62. Duration (hr)3. Load (percent) Table 4-5 -- 35 43 15 4. SFC factor (1 b/SHP-hr) Figure 4-2 -- 0.546 0.505 0.580 5. Fuel rate (1 b/hr) Cal cul ati on -- 3,229 3,909 5,2206. Fuel consumption (lb) Calculation -- 11,627 23,452 18,792
Hoteling/Unloading Fuel Consumetion {~r visit)
Table 4-4 -- 40 20 1557. Duration (hr)8. Lo ad (percent) Table 4-5 -- 12 25 10 9. SFC factor (1 b/SHP-hr) Figure 4-2 -- 0.591 0.525 0.600
10. Fuel rate (lb/hr) Calculation -- 1,199 : 2,362 3,600 11. Fuel consumption (lb) Calculation -- 47,960 47,250 558,000
Total Fuel Consumetion - Nonnal O~rations
Calculation Table 4-1
--0
59,587-17 .
70,702 6
576,792 43
12. Per visit (1 b)13. Number of annual visits 14. Annual total (1,000 gal) Calculation -- 145 53 3,543
Emissions
15. Partirul ate emission factor (lb/1,000 gal) Table 4-6 -- 23 23 15 16. Particulate emission factor (short tons/yr) Calculation -- 1.7 0.6 26.6
::i::, I
I.O
aNo vessel visits of this twe

Table A-8. Emission Calculations -- Normal Operations -- Ventura County Motor-Powered Vessels
Parameter
Quantities/Ship Type
Source Passenger Dry Cargo Tankers Military Tugs/Tows
1. Average shaft horsepower
Maneuvering Fuel Consumetion (eer visit)
2. Duration (hr)3, Load (percent) 4. SFC factor (lb/SHP-hr) 5. Fuel rate (lb/hr) 6. Fuel consumption (lb)
Table 4-2
Table 4-3 Table 4-5 Figure 4-3 Calculation Calculation
43,960
3.6 55 0.336
8,124 29,245
13,424
3.6 50 0,337
2,262 8,143
14,760
6 58 0.335
2,868 17,207
20,000
3.6 35 0.341
2,387 8,593
1,000
3.6 80 0.365
292 1,051
Hoteling/Unloading Fuel Consumetion (eer visit)
7. Duration (hr)8, Load (percent) 9. SFC factor (lb/SHP-hr)
10. Fuel rate (lb/hr) 11. Fuel consumption (lb)
Table 4-4 Table 4-5 Figure 4-3 Calculation Cal cul at ion
24 32 0.322
4,530 108,711
40 12 0.332
535 21,392
20 25 0.326
1,203 24,059
155 10 0.333
666 103,230
a --------
Total Fuel Consumetion - Normal 0eerations
12. Per visit ( lb) 13. Number of annual visits 14. Annual total (1,000 gal)
Calculation Table 4-1 Calculation
137,956 2
39
29,535 9
38
41,266 129 760
111,823 39
623
1,051 27 4
Emissions
15. Particulate emission factor (lb/1,000 gal) 16. Particulate emissions (short tons/yr)
Table 4-6 Calculation
25 0.5
25 0.5
25 9.5
25 7.8
25 0.1
);:, I -' 0
aNo engines operating

(' ( '\ I'\ I I
Table A-9. Emission Calculations -- Normal Operations -- San Luis Obiso County Steam- and Motor-Powered Vessels
Quantities/Ship Type
Parameter Source Steam Powered Tanker . Motor Power Tanker
1. Average shaf~ horsepower
Maneuvering Fuel Consumption (per visit)
2. Duration (hr) 3. Load (percent)4. SFC factor (lb/SHP-hr) 5. Fuel rate (lb/hr)6. Fuel consumption (lb)
Hoteling/Unloading Fuel Consumption (per visit)
7. Duration (hr) a. Load (percent)
):::, 9. SFC factor (lb/SHP-hr)I __, 10. Fuel rate (lb/hr) ..... I 11. Fuel consumption (lb)
Total Fuel Consumption - Normal
12. Per visit (lb)13. Number of annual visits 14. Annual total (1,000 gal}
Emissions
15. Particulate emission factor
Operations
Table 4-2
Table 4-3 Table 4-5 Figure 4-2 &4-3 Calculation Calculation
Table 4-4 Table 4-5 Figure 4-2 &4-3 Calculation Calculation
Calculation Table 4-1 Calculation
16. Particulate emissions (short tons/yr) Calculation I(lb/l ,000 gal) ITable 4-6
17,800 17,800
6.4 6.4 43 58 0.505 0.335
3,865 3,458 24,738 22, 134
20 20 25 25 0.525 0.326
2,336 1,451 46,725 29,014
71,463 51,148 239 5
2, 135 37
23 25 24.6 0.5
APPENDIX B
EXEMPTED MODE EMISSION CALCULATIONS
B-1

( \ ( \ t' .. ~. f· I , '1
Table B-1. Emission Calculations -- Exempted Mode (Maneuvering to Avoid Hazards) Steam-Powered Vessels, San Francisco Bay Area
Parameter
Quantities/Ship Type
Source Passenger Dry Cargo Tankers Military
1. Average shaft horsepower
Fuel Consumetion Per Occurrence
Table 4-2
Table 4-6
21,200
4
27,500
4
12,300
4
60,000
42. Duration of excessive emissions (min)3. Load factor (percent) Tab le 4-6 100 100 100 40 4. SFCa factor (lb/SHP-hr) Figure 4-2 0.510 0.510 0.460 0.540 5. Fuel rate (lb/hr) Calculation 10,812 14,025 5,658 12,960 6. Fuel consumption (lb)
Total Fuel Consumetion Per Year
Calculation
Table 4-6
721
2
935
2
377
2
864
27. Occurrences per ship per year 8. Total annual ship visits Table 4-1 55 648 943 111 9. Number of individual ships making visits Assumed 3 38 55 7
10. Annual number of occurrences Ca lcul at ion 6 76 101 14 11. Total fuel consumption (1,000 gal)
Emissions
Calculation 0.54 8.88 5.18 1.73
12. Particulate emission factor (lb/1,000 gal) Table 4-6 352 352 352 150 13. Particulate emissions (short ton/yr) Ca lcu 1 at ion 0.10 1. 56 0.91 0.13
0:, I w
aspecific fuel consumption
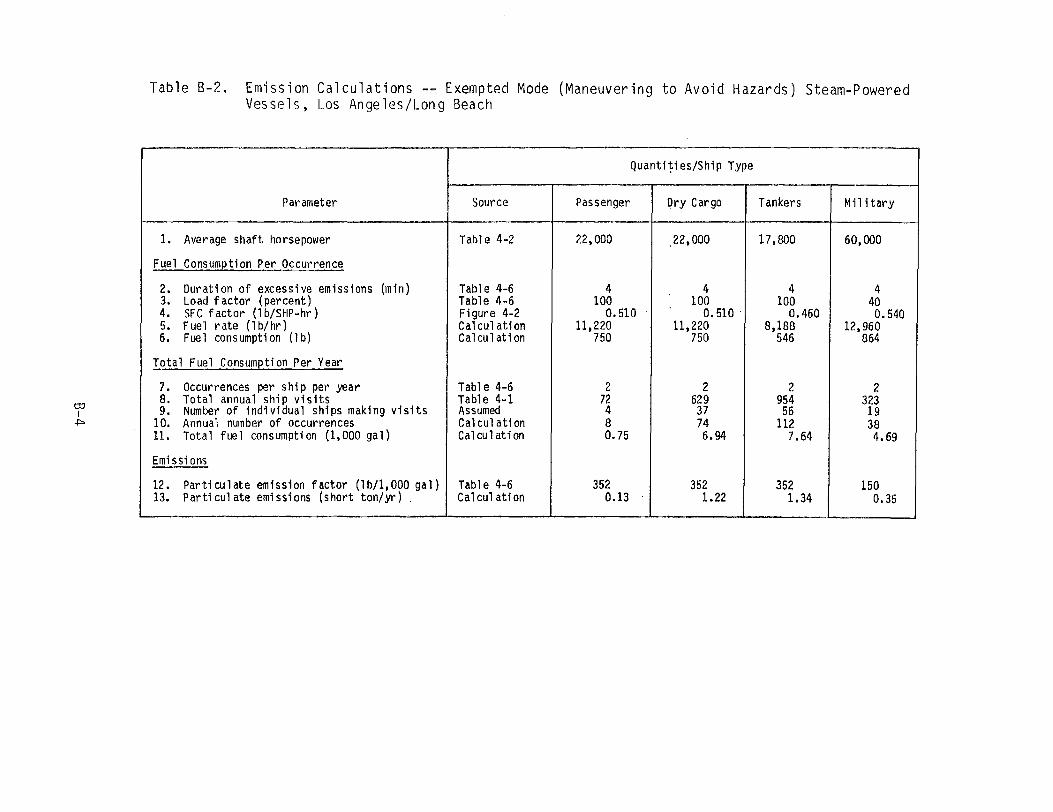
Table 8-2. Emission Calculations -- Exempted Mode (Maneuvering to Avoid Hazards) Steam-Powered Vessels, Los Angeles/Long Beach
a:, I ~
Parameter
Quanti~ies/Ship Type
Source Passenger Dry Cargo Tankers Military
1. Average shaft horsepower
Fuel Consurnetion Per Occurrence
Table 4-2
Table 4-6
22,000
4
,22,000
4
17,800
4
60,000
42. Duration of excessive emissions (min)3. Load factor (percent) Table 4-6 100 100 100 40 4. SFC factor (1 b/SHP-hr) Figure 4-2 0.510 0.510 · 0.460 0.540 5. Fue 1 rate ( 1 b/ hr) Cal cul ati on 11,220 11,220 8,188 12,960 6. Fuel consumption (lb) Cal cul ati on 750 750 546 864
Total Fuel Consumetion Per Year
Table 4-6 2 2 2 27. Occurrences per ship per year 8. Total annual ship visits Table 4-1 72 629 954 323 9. Number of individual ships making visits Assumed 4 37 56 19
10. Annuai number of occurrences Cal cul ati on 8 74 112 38 11. Total fl.X:!l consumption (1,000 gal)
Emi ssi ans
Calculation 0.75 6.94 7.64 4.69
12. Particulate emission factor (lb/1,000 gal) Table 4-6 352 352 352 150 13. Particulate emissions (short ton/yr) Cal cul ati on 0.13 1.22 1.34 0.35

t ~ ·, ,. -1I'
Table B-3. Emission Calculations -- Exempted Mode (Maneuvering to Avoid Hazards) Steam-Powered Vessels, San Diego
Parameter
Quantities/Ship Type
Source Passenger Dry Cargo Tankers Military
1. Average shaft horsepower
Fuel Consum~tion Per Occurrence
Table 4-2
Table 4-6
21,200
4
27,500
4
12,300
4
60,000
42. Duration of excessive emissions (min)3. Load factor (percent) Tab le 4-6 100 100 100 40 4. SFC factor (lb/SHP-hr) Figure 4-2 0.510 0.510 0.460 o. 540 5. Fuel rate (lb/hr) Calculation 10,812 14,025 5,658 12,960 6. Fuel consumption (lb)
Total Fuel Consum~tion Per Year
Calculation
Table 4-6
721
2
935
2
943
2
864
27. Occurrences per ship per year 8. Total annual ship visits Table 4-1 3 41 8 2,737 9. Number of individual ships making visits Assumed a 2 a 161
10. Annual number of occurrences Calculation -- 4 -- 322 11. Total fuel consumption (1,000 gal) Calculation -- 0.47 -- 39.74
Emissions
12. Particulate emission factor (lb/1,000 gal) Table 4-6 -- 352 -- 150 13. Particulate emissions (short ton/yr) Calculation -- 0.08 -- 2.98
ro I
c.n
asecause of the small number of ship visits it was assumed that the vessels making the visits did not experience any emergency boiler shutdown

Table B-4. Emission Calculations -- Exempted Mode (Maneuvering to Avoid Hazards) Steam-Powered Vessels, Ventura County
Parameter
Quantities/Ship Type
Source Passenger qry Cargo Tankers Military
1. Average shaft horsepower
Fuel Consum~tion Per Occurrence
Table 4-2
Table 4-6
--
--
,16,900
4
18,000
4
60,000
42. Duration of excessive emissions (min)3. Load factor (percent) Table 4-6 -- 100 100 40 4. SFC factor (l b/SHP-hr) Figure 4-2 -- 0.510 0.460 0.540 5. Fuel rate (lb/hr) Calculation -- 8,619 8,280 12,9606. Fuel consumption (lb) Cal cul ati on -- 575 552 864
Total Fuel Consumetion Per Year
Table 4-6 -- 2 2 27. Occurrences per ship per year 8. Total annual ship visits Table 4-1 0 17 6 43 9. Number of individual ships making visits Assumed -- 1 a 3
10. Annual number of occurrences Cal cul ati on -- 2 -- 6 11. Total fuel consumption (1,000 gal) Calculation -- 0.14 -- o. 74
Emissions
12. Particulate emission factor (lb/1,000 gal) Table 4-6 -- 352 -- 150 13. Particulate emissions (short ton/yr) Calculation -- 0.02 -- 0.06
c:o I
O'\
aeecause of the small number of ship vis.its it was assumed that the vessels making the visits did not experience any emergency boiler shutdown ·
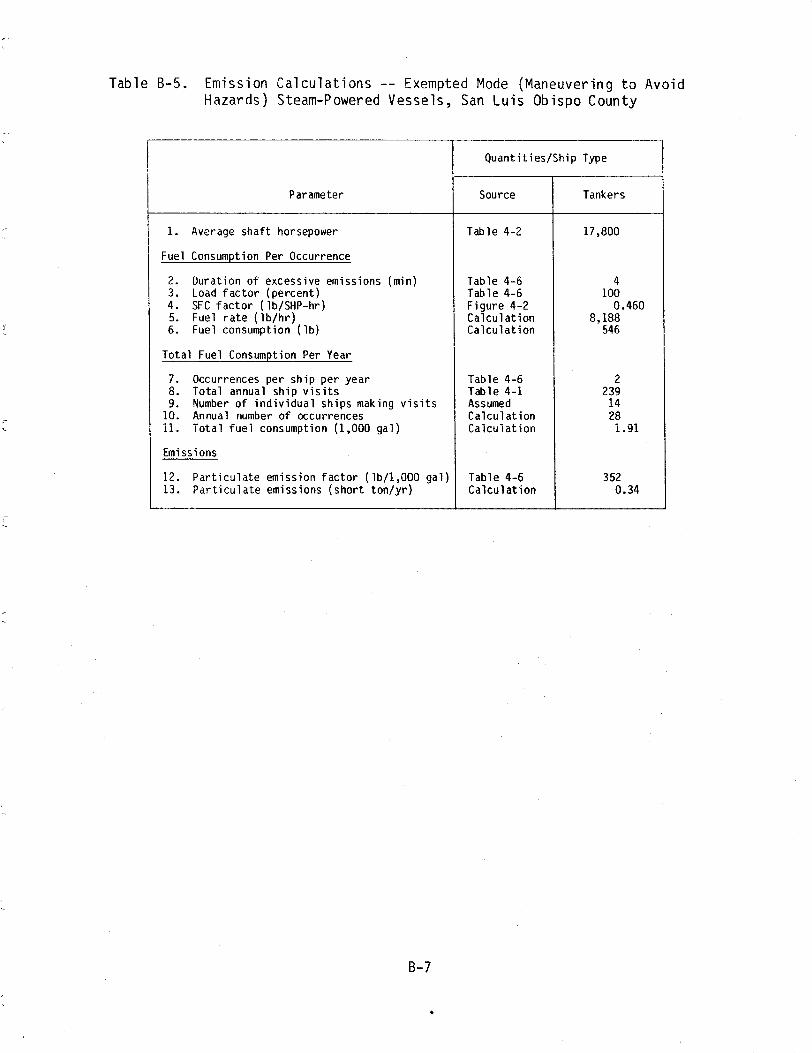
Table B-5. Emission Calculations -- Exempted Mode (Maneuvering to Avoid Hazards} Steam-Powered Vessels, San Luis Obispo County
Quantities/Ship TypeI '
Parameter Source Tankers
1. Average shaft horsepower 17,800
Fuel Consumetion Per Occurrence
Table 4-2
2. Duration of excessive emissions (min) 4Table 4-6 3. Load factor (percent) Table 4-6 100 4. SFC factor (lb/SHP-hr) Figure 4-2 0.460 5. Fuel rate (lb/hr) Calculation 8,188 6. Fuel consumption (lb) 546Calculation
Total Fuel Consumetion Per Year
7. Occurrences per ship per year 2Table 4-6 8. Total annual ship visits Table 4-1 239 9. Number of individual ships making visits Assumed 14
10. Annual number of occurrences Calculation 28 11. Total fuel consumption (1,000 gal) Calculation 1.91
Emissions
12. Particulate emission factor (lb/1,000 gal) Table 4-6 352 13. Particulate emissions (short ton/yr) Calculation 0.34
B-7

--
Table B-6. Emission Calculations -- Exempted Mode (Emergency Boiler Shutdowns) Steam-Powered Vessels, San Francisco Bay
·---------
OJ I
co
Parameter
Quantities/Ship Type
Source Passenger Dry Cargo Tankers Military
1. Average shaft horsepower
Fuel Consum~tion Per Occurrence
Table 4-2
Table 4-6
21,200
10
27,500
10
12,300
10
--
60,000
102. Duration of excessive emissions (min) 3. Load factor (percent) Table 4-6 25 25 25 10 4. SFC factor ( lb/SHP-hr) Figure 4-2 0.560 0.560 0.520 0.600 5. Fuel rate (lb/hr) Calculation 2,968 3,850 1,599 3,600 6. Fuel consumption (lb)
Total Fuel Consum~tion Per Year
Ca lcu 1 at ion
Table 4-6
495
1
642
1
267
1
600
17. Occurrences per ship per year 8. Total annual ship visits Tab 1 e 4-1 55 648 943 111 9. Number of individual ships making visits Assumed 3 38 55 7
10. Annual number of occurrences Calculation 3 38 55 7 11. Total fue1 consumption (1,000 gal)
Emissions
Calculation 0.19 3.05 1.84 0.60
12. Particulate emission factor (lb/1,000 gal) Table 4-6 352 352 352 150 13. Particulate emissions (short ton/yr) Calculation 0.03 0.54 0.32 0.05
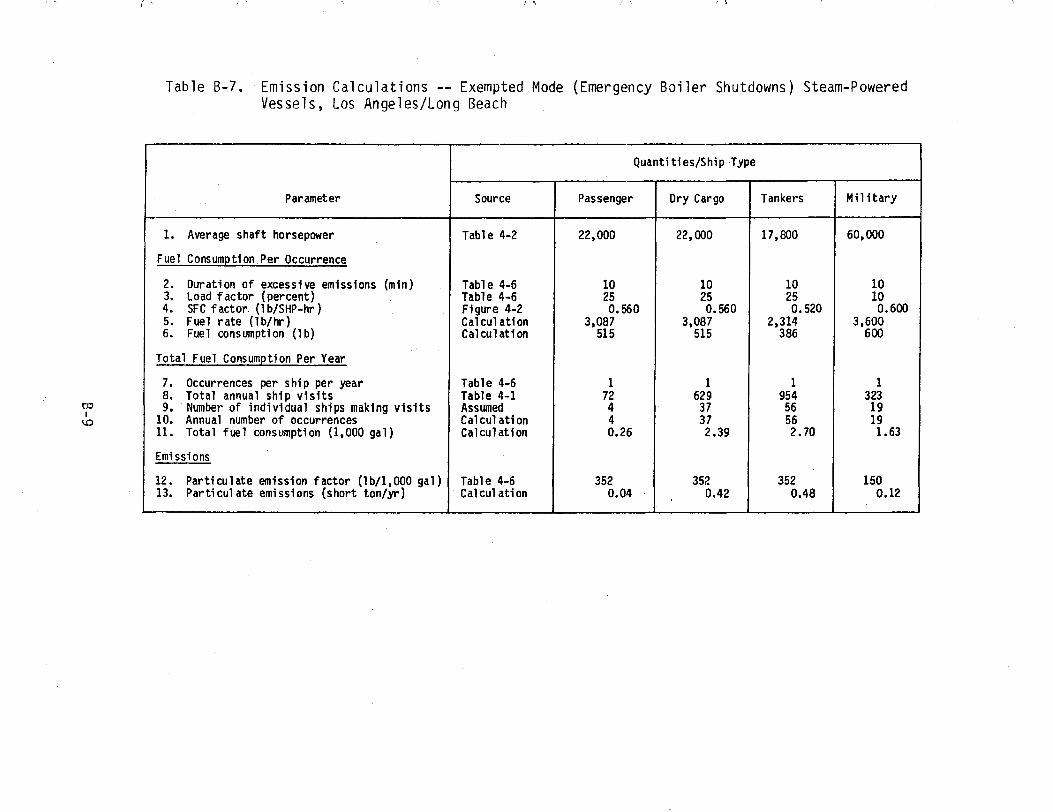
I \ II
Table B-7. Emission Calculations -- Exempted Mode (Emergency Boiler Shutdowns) Steam-Powered Vessels, Los Angeles/Long Beach
co I
\,D
Parameter
Quantities/Ship -Type
Source Passenger Ory Cargo Tankers Military
1. Average shaft horsepower
Fuel Consumetion Per Occurrence
Table 4-2
Table 4-6
22,000
10
22,000
10
17,800
10
60,000
102. Duration of excessive emissions (min)3. Load factor (percent) Table 4-6 25 25 25 10 4. SFC factor (1 b/SHP-hr) Figure 4-2 0.560 0.560 0.520 0.600 5. Fuel rate (1 b/hr) Calculation 3,087 3,087 2,314 3,600 6. Fuel consumption {lb) Cal cul ati on 515 515 386 600
Total Fuel Consumetion Per Year
Table 4-6 1 1 1 17. Occurrences per ship per year 8. Total annual ship visits Table 4-1 72 629 954 323 9, Number of individual ships making visits Assumed 4 37 56 19
10. Annual number of occurrences Calculation 4 37 56 19 11. Total fuel consvmption (1,000 gal)
Emissions
Calculation 0.26 2.39 2. 70 1.63
12. Particulate emission factor (lb/1,000 gal) Table 4-6 352 352 352 150 13. Particulate emissions (short ton/yr) Calculation 0.04 · 0.42 0.48 0.12
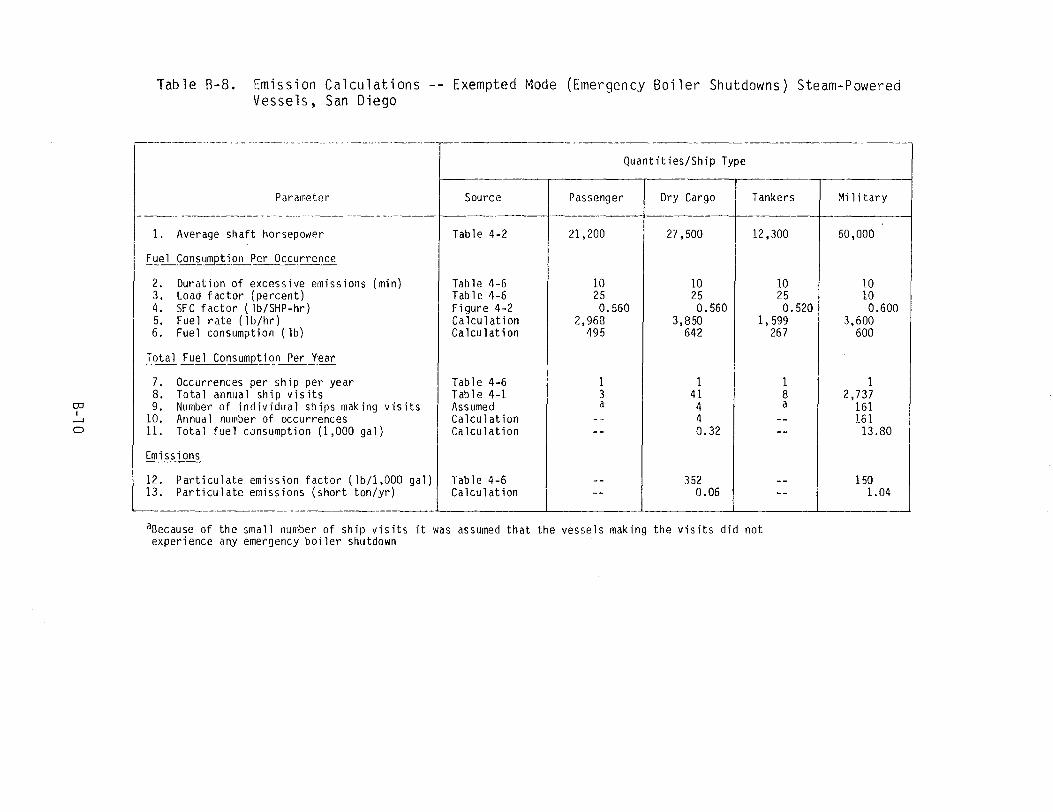
--
Table B-8. Emission Calculations -- Exempted Mode (Emergency Boiler Shutdowns) Steam-Powered Vessels, San Diego
...-----------------
Parameter
Quantities/Ship Type
Source Passenger Dry Cargo Tankers Military
1. Average shaft horsepower
Fuel Consum2tion Per Occurrence
Table 4-2
Table 4-6
21,200
10
27,500
10
12,300
10
60,000
102. Duration of excessive emissions (min)3. Load factor (percent) Table 4-6 25 25 25 10 4. SFC factor (lb/SHP-hr) Figure 4-2 0.560 0.560 0.520 0.600 5. Fuel rate (lb/hr) Ca lcu lat ion 2,968 3,850 1,599 3,600 6. Fuel consumption (lb)
Total Fuel Consum2t ion Per Y·ear
Calculation
Table 4-6
495
1
642
1
267
1
600
17. Occurrences per ship per year 8. Total annual ship visits Table 4-1 3 41 8 2,737 9. Number of individual ships making visits Assumed a 4 a 161
10. Annual number of occurrences Calculation -- 4 -- 161 11. Total fuel consumption (1,000 gal) Calculation -- 0.32 -- 13.80
Emissions
12. Particulate emission factor (lb/l,000 gal) Table 4-6 -- 352 -- 150 13. Particulate emissions (short ton/yr) Calculation -- 0.06 -- 1.04
co I
--' 0
asecause of the small number of ship visits it was assumed that the vessels making the visits did not experience any emergency boiler shutdown

t-7 1-~~
Tab1e B-9. Emission Calculations -- Exempted Mode (Emergency Boiler Shutdowns) Steam-Powered Vessels, Ventura County
co I -' -'
Parameter
Quantities/Ship Type
Source Passenger Dry Cargo Tankers Military
1. Average shaft horsepower
Fuel Consumetion Per Occurrence
Table 4-2
Table 4-6
--
--
16,900
10
18,000
10
60,000
102. Duration of excessive emissions (min)3. Load factor (percent) Table 4-6 -- 25 25 25 4. SFC factor (lb/SHP-hr) Figure 4-2 -- 0.560 0.520 0.600 5. Fuel rate (lb/hr) Calculation -- 2,366 2,340 9,0006. Fuel consumption (lb) Cal cul ati on -- 394 390 1,500
Total Fuel Consumetion Per Year
Table 4-6 -- 1 1 17. Occurrences per ship per year 8. Total annual ship visits Table 4-1 0 17 6 43 9. Number of individual ships making visits Assumed -- 1 a 3
10. Annual number of occurrences Calculation -- 1 -- 3 11. Total fuel consumption (1,000 gal) Cal cul ati on -- 0.05 -- 0.64
Emi ssi ans
12. PartiCillate emission factor (lb/1,000 gal) Table 4-6 -- 352 -- 150 13. Particulate emissions (short ton/yr) Cal cul ati on -- 0.01 -- 0,05

Table 8-10. Emission Calculations -- Exempted Mode (Emergency Boiler Shutdowns) Steam-Powered Vessels, San Luis Obispo County
Quantities/Ship Type
Parameter Source Tankers
1. Average shaft horsepower 17,800
Fuel Consumption Per Occurrence
Table 4-2
Table 4-6 102. Duration of excessive emissions (min) 3. Load factor (percent) Table 4-6 25
Figure 4-2 0.5204. SFC factor (lb/SHP-hr) 2,3145. Fuel rate ( lb/hr) Calculation
6. Fuel consumption ( lb) Calculation 386
Total Fuel Consumption Per Year
7 Occurrences per ship per year Table 4-6 1 8. Total annual ship visits Table 4-1 239
149. Number of individual ships making visits Assumed 1410. Annual number of occurrences Calculation
11. Total fuel consumption (1,000 gal) Ca lcu 1at ion 0.68
Emissions
12. Particulate emission factor (lb/1,000 gal) Table 4-6 352 0.1213. Particulate emissions (short ton/yr) Calculation
B-12

( ~, t'·.;.
Table B-11. Emission Calculations -- Exempted Mode (Government Testing) Steam-Powered Vessels, San Francisco Bay Area
-
0:, I .....
w
Parameter
Quantities/Ship Type
Source Passenger Dry Cargo Tankers Military
1. Average shaft horsepower
Fuel Consumption Per Occurrence
2. Duration of excessive emissions (min) 3. Load factor (percent) 4. SFC factor (lb/SHP-hr) 5. Fuel rate (lb/hr) 6. Fuel consumption ( lb)
Total Fuel Consumetion Per Vear
Table 4-2
Table 4-6 Table 4-6 Figure 4-2 Calculation Ca lcu 1 at ion
Table 4-6
21,200
10 110
0.510 11,893 1,982
1
27,500
10 110
0.510 15,428 2,571
1
12,300
10 110
0.455 6,156 1,026
1
60,000
10 110
0.510 33,660 5,610
17. Occurrences per ship per year 8. Total annual ship visits Table 4-1 55 648 943 111 9. Number of individual ships making visits Assumed 3 38 55 7
10. Annual number of occurrences Ca lcul at ion 3 38 55 7 11. Total fuel consumption (1,000 gal)
Emissions
Calculation 0.74 12.21 7.05 5.61
12. Particulate emission factor (lb/1,000 gal) Table 4-6 200 200 200 150 13. Particulate emissions (short ton/yr) Calculation 0.07 1.22 0.71 0.42

Table 8-12. Emission Calculations -- Exempted Mode (Government Testing) Steam-Powered Vessels, Los Angeles/Long Beach
OJ I_,
.f::,,
Parameter
Quantities/Ship Type
Source Passenger Dry Cargo Tankers Mil 1tary
1. Average shaft horsepower
Fuel Consume ti on Per Occurrence
Table 4-2
Table 4-6
22,000
10
22,000
10
17 I 800
10
60,000
102. Duration of excessive emissions (min)3. Load factor {percent) Table 4-6 110 110 110 110 4. SFCfactor (lb/SHP-hr) Figure 4-2 0.510 0.510 0.455 0.510 5, Fuel rate (lb/hr) Cal cul ati on 12,342 12,342 8,909 33,6606. Fuel consumption (lb) Cal cul at i on 2,057 2,057 1,485 5,610
Total Fuel Consumetion Per Year
Table 4-6 1 1 1 17. Occurrences per ship per year8. Total annual ship visits Table 4-1 72 629 954 323 9. Number of individual ships making visits Assumed 4 37 56 19
10. Annual number of occurrences Calculation 4 37 56 19 11. Total tuel consumption (1,000 gal) Cal cul ati on 1.03 9.54 10.40 13.32
Emissions
12. Particulate emission factor (lb/1,000 gal) Table 4-6 200 200 200 150 13. Particulate emissions (short ton/yr) Cal cul ati on 0.10 0.95 1.04 1.00

/"I / '
Table B-13. Emission Calculations -- Exempted Mode (Government Testing) Steam-Powered Vessels, San Diego
-·
Parameter
Quantities/Ship Type
Source Passenger Dry Cargo Tankers Military
1. Average shaft horsepower
Fuel Consumetion Per Occurrence
Table 4-2
Table 4-6
21,200
10
27,500
10
12,300
10
60,000
102. Duration of excessive emissions (min) 3. Load factor (percent) Table 4-6 110 110 110 110 4. SF C factor ( lb/SHP-hr) Figure 4-2 0.510 0.510 0.455 0.510 5. Fuel rate (lb/hr) Calculation 11,893 15,428 6,156 33,660 6. Fuel consumption (lb)
Total Fuel Consumetion Per Year
Calculation
Table 4-6
1,982
1
2,571
1
1,026
1
5,610
17. Occurrences per ship per year 8. Total annual ship visit:: Table 4-1 3 41 8 2,737 9. Number of individual ships making visits Assumed a 4 a 161
10. Annual number of occurrences Calculation -- 4 -- 161 11. Total fuel consumption (1,000 gal) Calculation -- 1.29 -- 129.03
Emissions
12. Particulate emission factor (lb/1,000 gal) Table 4-6 -- 200 -- 150 13. Particulate emissions (short ton/yr) Calculation -- 0.13 -- 9.68
OJ I_.
(J7
3Because of the small number of ship visits it was assumed that the vessels making the visits did not experience any emergency boiler shutdown

Table B-14. Emission Calculations -- Exempted Mode (Government Testing) Steam-Powered Vessels, Ventura County
0:, I_.
O'I
Parameter
Quan ti ti es/Shi_p Type
Source Passenger Dry Cargo Tankers Military
1. Average shaft horsepower
Fuel Consumetion Per Occurrence
Table 4-2
Table 4-6
--
--
16,900
10
18,000
10
60,000
102. Duration of excessive emissions (min)3. Load factor (percent) Table 4-6 -- 110 110 110 4. SFC factor (1 b/SHP-hr) Figure 4-2 -- 0.510 0,455 0.510 5. Fuel rate (lb/hr) Cal cul ati on -- 9,481 9,009 33,660 6. Fuel consumption (lb) Cal cul at i on -- 1,580 1,501 5,610
Total Fuel Consumetion Per Year
Table 4-6 -- 1 1 17. Occurrences per ship per year 8. Total annual ship visits Table 4-1 0 17 6 43 9. Number of individual ships making visits Assumed -- 1 a 3
10. Annual number of occurrences Cal cul ati on -- 1 -- 3 11. Total fuel constJnption (1,000 gal) Cal cu l at i on -- 0.20 -- 2.40
Emissions
12. Particulate emission factor (lb/1,000 gal) Table 4-6 -- 200 -- 150 13. Particulate emissions (short ton/yr) Cal cul ati on -- 0.02 -- 0.18

Table B-15. Emission Calculations -- Exempted Mode (Government Testing) Steam-Powered Vessels, San Luis Obispo County
Quantities/Ship Type
Parameter Source Tankers
1. Average shaft horsepower 17,800
Fuel Consumetion Per Occurrence
Table 4-2
102. Duration of excessive emissions (min) Table 4-6 1103. Load factor (percent) Table 4-6
0.455Figure 4-24. SFC factor (lb/SHP-hr) 8,9095. Fuel rate (lb/hr) Ca.lcul at ion 1,485
Total Fuel Consumetion Per Year
6. Fuel consumption (lb) Calculation
7. Occurrences per ship per year 1Table 4-6 8. Total annual ship visits Table 4-1 239
149. Number of individual ships making visits Assumed 1410. Annual number of occurrences Calculation
11. Total fuel consumption (1,000 gal) 2.60
Emi ss i ans
Calculation
12. Particulate emission factor (lb/1,000 gal) Table 4-6 200 13. Particulate emissions (short ton/yr) Calculation 0.26
B-17

--
Table B-16. Emission Calculations -- Exempted Mode (Cold-Boiler Light Offs) Steam-Powered Vessels, San Francisco Bay Area
------·-
Parameter
1. Av erage shaft horsepower
Fuel Co nsumetion Per Occurrence
2. Du ration of excessive emissions (min) 3. Load factor {percent) 4. SF C factor ( lb/SHP-hr) 5. Fu el rate {lb/hr) 6. Fu el consumption ( lb)
Total Fuel Consumption Per Year
7. Occurrences per ship per year 8. To tal annual ship visits 9. Nu mber of individual ships making visits
OJ l 10. An nual number of occurrences ..... 11 . Total fuel consumption (1,000 gal)co I
Emissions
12. Particulate emission factor (lb/1,000 gal) 13. Particulate emissions (short ton/yr)
Source
Table 4-2
Table 4-6 Table 4-6 Figure 4-2 Calculation Calculation
Table 4-6 Table 4-1 Assumed Calculation Calculation
Table 4-6 Calculation
Passenger
21,200
10 5 0.65
689 115
5 55 3
15 0.22
200 0.02
Quantities/Ship Type
Dry Cargo
27,500
10 5 0.65
894 149
5 648
38 190
3. 54
200 0.35
Tankers
12,300
10 5 o. 53
326 54
5 943
55 275
1.86
200 0.19
Military
60,000
10 5 0.65
1,950 325
5 111
7 35 1.63
150 0.12
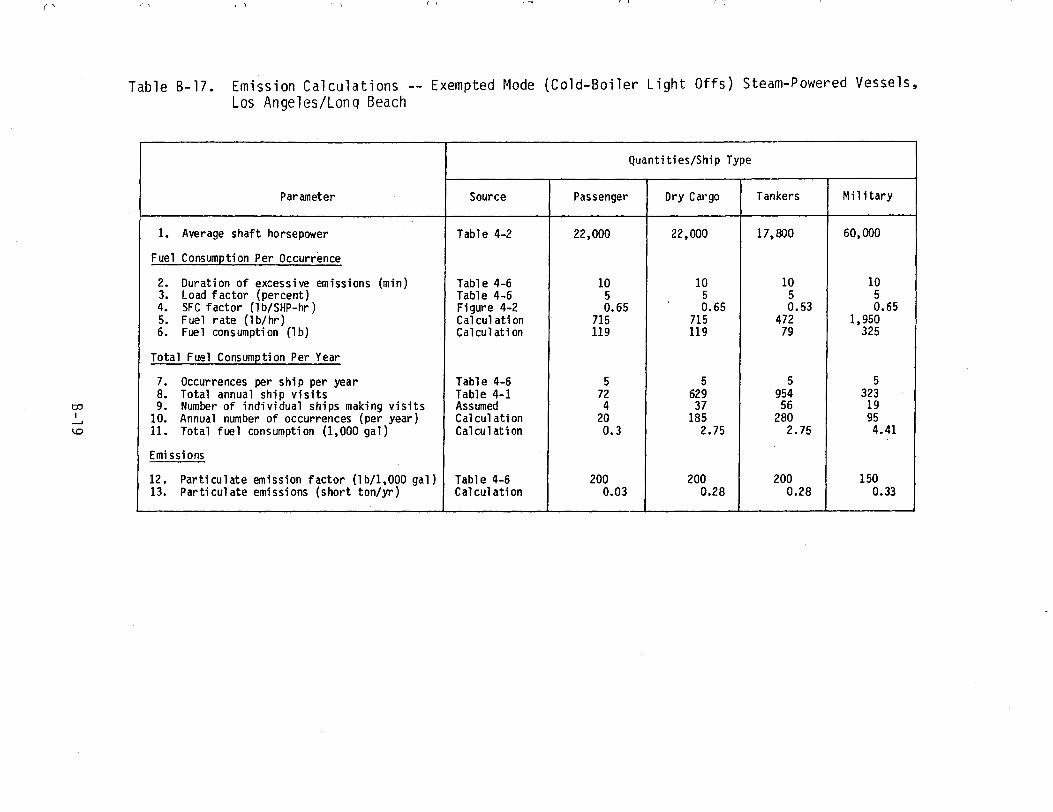
( -,.( /7 'I( '·
Table B-17. Emission Calculations -- Exempted Mode (Cold-Boiler Light Offs) Steam-Powered Vessels, Los Angeles/Long Beach
Quantities/Ship Type
Parameter Source Passenger Dry Cargo Tankers Military
1. Average shaft horsepower Table 4-2 22,000 22,000 17,800 60,000
Fuel Consume ti on Per Occurrence
2. Duration of excessive emissions (min) Table 4-6 10 10 10 10 3. Load factor (percent) Table 4-6 5 5 5 5 4. SFC factor (l b/SHP-hr) Figure 4-2 0.65 0.65 0.53 0.65 5. Fuel rate (lb/hr) Calculation 715 715 472 1,950 6. Fuel consumption (lb) Cal cul ati on 119 119 79 325
Total Fuel Consumetion Per Year
7. Occurrences per ship per year Table 4-6 5 5 5 5 8. Total annual ship visits Table 4-1 72 629 954 323
co 9. Number of individual ships making visits Assumed 4 37 56 19 J....., 10. Annual number of occurrences (per year) Calculation 20 185 280 95 ~ 11. Total fuel consumption (1,000 gal) Cal cu 1 ati on 0.3 2.75 2.75 4.41
Emissions
12. Particulate emission factor (lb/1,000 gal) Table 4-6 200 200 200 150 13. Particulate emissions (short ton/yr) Cal cul ati on 0.03 0.28 0.28 0.33

Table B-18. Emission Calculations -- Exempted Mode (Cold-Boiler Light Offs) Steam-Powered Vessels, San Diego
--
Parameter
Quantities/Ship Type
Source Passenger Dry Cargo Tankers Military
1. Average shaft horsepower
Fuel Consumption Per Occurrence
Table 4-2 21,200 27,500 12,300 60,000
2. Duration of excessive emissions (min) Table 4-6 10 10 10 10 3. Load factor (percent) Table 4-6 5 5 5 5 4. SFC factor ( lb/SHP-hr) Figure 4-2 0.65 0.65 0.53 0.65 5. Fuel rate (lb/hr) Calculation 689 894 326 1,950 6. Fuel consumption (lb)
Total Fuel Consum~tion Per Year
Ca lcu lat ion 115 149 54 325
7. Occurrences per ship per year Table 4-6 5 5 5 5 8. Total annual ship visits Table 4-1 3 41 8 2,737 9. Number of individual ships making visits Assumed a 2 a 161
10. Annual number of occurrences Calculation -- 10 -- 805I 11. Total fuel consumption (1,000 gal)
Emiss ions
Calculation -- 0.19 -~ 37.38
12. Particulate emission factor (lb/1,000 gal) Table 4-6 -- 200 -- 150 13. Particulate emissions (short ton/yr) Calculation -- 0.02 -- 2.80
co l
N C
aBecause of the small number of ship visits it was assumed that the vessels making the visits did not experience any emergency boiler shutdown

,,, , \ I', r'I /''""1 I•;
Table B-19. Emission Calculations -- Exempted Mode (Cold-Boiler Light Offs) Steam-Powered Vessels, Ventura County
Parameter
Quantities/Ship Type
Source Passenger Dry Cargo Tankers Military
1. Average shaft horsepower
Fuel Consumetion Per Occurrence
Table 4-2
Table 4-6
--
--
16,900
10
18,000
10
60,000
102. Duration of excessive emissions (min)3. Load factor (percent) Table 4-6 -- 5 5 5 4. SFC factor (1 b/SHP-hr) Figure 4-2 -- 0.65 0.53 0.65 5. Fuel rate (lb/hr) Calculation -- 549 477 1,950 6. Fuel consumption (lb) Calculation -- 92 80 325
Total Fuel Consumetion Per Year
Table 4-6 - 5 5 57. Occurrences per ship per year 8. Total annual ship visits Table 4-1 0 17 6 43 9. Number of individual ships making visits Assumed -- 1 a 3
10. Annual number of occurrences Calculation -- 5 -- 15 11. Total fuel consumption (1,000 gal) Cal cu 1ati on -- 0.06 -- 0.7
Emi ssi ans
12. Particulate emission factor (lb/1,000 gal) Table 4-6 -- 200 -- 150 13. Par ti cul ate emi ssi ans (short ton/yr) Calculation -- 0.01 -- 0.05
0:, I
N__,
asecause of the small number of ship visits it was assumed that the vessels making the visits did not experience any emergency boiler shutdown
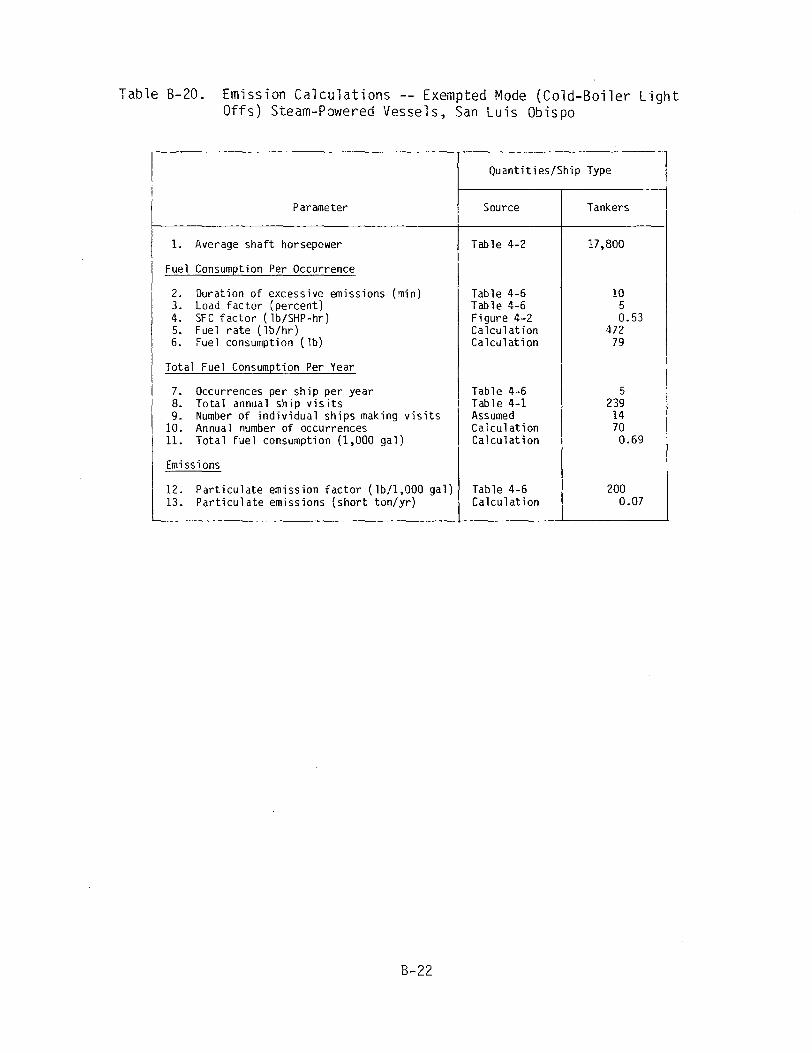
Table B-2O. Emission Calculations -- Exempted Mode (Cold-Boiler Light Offs) Steam-Powered Vessels, San Luis Obispo
Quantities/Ship Type II
Parameter Source Tankers
17,800
Fuel Consumetion Per Occurrence
1. Average shaft horsepower Table 4-2
2. Duration of excessive emissions (min) 10Table 4-6 3. Load factor (percent) Tab le 4-6 5
0.534. SF C factor ( lb/SHP-hr) Figure 4-2 4725. Fuel rate (lb/hr) Calculation
796. Fuel consumption (lb) Calculation
Total Fuel Consumetion Per Year
57. Occurrences per ship per year Table 4-6 2398. Total annual ship visits Table 4-1
Assumed 149. Number of individual ships making visits Calculation 7010. Annual number of occurrences
0.69
Emissions
11. Total fuel consumption (1,000 gal) Calculation
20012. Particulate emission factor (lb/1,000 gal) Table 4-6 0.07Calculation13. Particulate emissions (short ton/yr)
B-22

i ' t-1 I ]
Table B-21. Emission Calculations -- Exempted Mode (Drying Wet or Green Refractory) Steam-Powered Vessels, San Francisco Bay Area
Quantities/Ship Type
MilitaryDry CargoParameter Passenger TankersSource
1. Average shaft horsepower
Fuel Consumetion Per Occurrence
2. Duration of excessive emissions (min)3. Load factor (percent) 4. SFC factor (lb/SHP-hr) 5. Fuel rate (lb/hr) 6. Fuel consumption ( lb)
Total Fuel Consumetion Per Year
7. Occurrences per ship per year 8. Total annual ship visits
0::, 9. Number of individual ships making visitsI
N 10. Annual number of occurrences w 11. Total fuel consumption (1,000 gal)
Emissions
12. Particulate emission factor (lb/1,000 gal) 13. Particulate emissions (short ton/yr)
Table 4-2
Table 4-6a Table 4-6 Figure 4-2 Calculation Ca lcu lat ion
Table 4-6 Table 4-1 Assumed Calculation Calculation
Table 4-6 Calculation
avalues are doubled to account for the emissions from 2 boilers
21,200
60 5 0.65
689 689
0.5 55 3 2 0.17
352 0.03
27,500
60 5 0.65
894 894
0.5 648
38 19 2.12
352 0.37
12,300
60 5 0.53
326 326
0.5 943
55 28 1.14
352 0.20
60,000
60 5 0.65
1,950 1,950
0.5 111
7 4 1.11
150 0.08

Table B-22. Emission Calculations -- Exempted Mode (Drying Wet or Green Refractory) Steam-Powered Vessels, Los Angeles/Long Beach
Parameter
Quantities/Ship Type
Source Passenger Dry Cargo Tankers Military
1. Average shaft horsepower
Fuel Consumetion Per Occurrence
Table 4-2
Table 4-6a
22,000
60
22,000
60
17,800
60
60,000
602. Duration of excessive emissions (min)3. Load factor (percent) Table 4-6 5 5 5 5 4. SFCfactor (lb/SHP-hr) Figure 4-2 0.65 0.65 o. 53 0.65 5. Fuel rate (lb/hr) Cal cul ati on 715 715 472 1,950 6. Fuel consumption (lb)
Total Fuel Consumption Per Year
Ca1cu 1 at i on 715 715 472 1,950
7. Occurrences per ship per year Table 4-6 0.5 0.5 0.5 0.5 B. Total annual ship visits Table 4-1 72 629 954 323 9. Number of individual ships making visits Assumed 4 37 56 19
10. Annual number of occurrences Cal cul ati on 2 19 28 10 11. Total fuel consumption (1,000 gal)
Emissions
Ca1cu 1 at i on 0.18 1. 70 1.65 2. 79
12. Particulate emission factor (lb/l,000 gal) Table 4-6 352 352 352 150 13. Particulate emissions (short ton/yr) Calculation 0.03 0.30 0.29 · 0.21
c:o I
N .,I::>
ava1ues are doubled to account for the emissions from two boilers

' '
----
----
----
----
(
Table B-23. Emission Calculations --Vessels, San Diego
(
Parameter
1. Average shaft horsepower
Fuel Consumption Per Occurrence
2. Duration of excessive emissions (min} 3. Load factor (percent} 4. SFC factor {lb/SHP-hr} 5. Fuel rate (lb/hr) 6. Fuel consumption {lb)
Total Fuel Consumption Per Year
7. Occurrences per ship per year 8. Total annual ship visits 9. Number of individual ships making visits
10. Annual number of occurrences 11. Total fuel consumption (1,000 gal}
Emissions
12. Particulate emission factor (lb/1,000 gal) 13. Particulate emissions {short ton/yr)
OJ I
N 0,
I '
Exempted Mode
Source
Table 4-2
Table 4-6a Table 4-6 Figure 4-2 Ca lcul at ion Calculation
Table 4-6 Table 4-1 Assumed Calculation Calculation
Table 4-6 Calculation
/"':;-1(" \
(Drying Wet or Green Refractory)
Quantities/Ship Type
Passenger
21,200
60 5 0.65
689 689
0.5 3b
Dry Cargo
27,500
60 5 0.65
894 894
0.5 41 2 0.22
352 0.04
Tankers
12,300
60 5 0.53
326 326
0.5 8b
avalues are doubled to account for the emissions from two boilers bsecause of the small number of ship visits, it was assumed that the vessels making the visits did not experience the need for refractory drying
Steam-Powered
Mi 1itary
60,000
60 5 0.65
1,950 1,950
0.5 2,737
81 41 11.28
15D 0.85

Table B-24. Emission Calculations -- Exempted Mode (Drying Wet or Green Refractory) Steam-Powered Vessels, Ventura County
Parameter
Quantities/Ship Type
Source Passenger Dry Cargo Tankers Military
1. Average shaft horsepower
Fuel Consumetion Per Occurrence
Table 4-2
Table 4-6a
--
--
16,900
60
18,000
60
60,000
602. Duration of excessive emissions (min)3, Load factor (percent) Table 4-6 -- 5 5 5 4. SFC factor (1 b/SHP-hr) Figure 4-2 -- o. 65 0.53 0.65 5. Fuel rate (lb/hr) Cal cul ati on -- 549 477 1,9506. Fuel consumption (lb) Cal cul ati on -- 549 477 1,950
Total Fuel Consumption Per Year
7. Occurrences per ship per year Table 4-6 -- 0.5 0.5 0.5 8. Total annual ship visits 9, Number of individual ships making visits
10. Annual number of occurrences
Table 4-1 Assumed Ca1cu l at i on
0 ----
17 1 b
6b
--'43
3 1
11. Total fuel consumption (1,000 gal) Calculation -- -- 0.28
Emissions
12. Particulate emission factor (lb/1,000 gal) Table 4-6 -- -- -- 150 13. Par ti cul ate emissions (short ton/yr) Calculation -- -- -- 0.02
0:, I
N a-,
avalues are doubled to account for the emissions from two boilers bsecause of the small number of ship visits, it was assumed that the vessels making the visits did not experience the need for refractory drying

Table B-25. Emission Calculations -- Exempted Mode (Drying Wet or Green Refractory) Steam-Powered Vessels, San Luis Obispo
Quantities/Ship Type
TankersParameter Source
17,800
Fuel Consumetion Per Occurrence
1. Average shaft horsepower Table 4-2
Table 4-6a2. Duration of excessive emissions (min) 60 3. Load factor (percent) Table 4-6 5
Figure 4-2 0.534. SFC factor (lb/SHP-hr) 4725. Fuel rate {lb/hr) Calculation 4726. Fuel consumption (lb) Calculation
Total Fuel Consumetion Per Year
7. Occurrences per ship per year Table 4-6 0.5 8. Total annual ship visits 239Table 4-1
Assumed 149. Number of individual ships making visits 10. Annual number of occurrences Calculation 7 11. Total fuel consumption (1,000 gal) Calculation 0.41
Emissions
12. Particulate emission factor (lb/1,000 gal) Table 4-6 351 13. Particulate emissions (short ton/yr) Calculation 0.07
avalues are doubled to account for the emissions from two boilers
B-27

APPENDIX C
VISIBLE EMISSIONS OBSERVATION REPORTS
C-1
October 5, 1981
TO: Files - Ship Emissions FROM: Henry Modetz
SUBJECT: Observation of Boiler Light off
1. Purpose The light off of a marine boiler with residual fuel was observed to
better understand the procedure and establish the visible emission profile. 2. Ship/Date
r Santa Mariana, Delta Steamship Lines, Inc. Pier 32 San Francisco, California October 2, 1981
3. Attendees Chief Engineer, 1st Assistant Fred Merrick, ~A Henry Modetz, Acurex Walt Wyss, Acurex
4. Discussion The Santa Mariana is a combined cargo (pallet and container) and
passenger vessel of 19,800 SHP owned and operated by Delta Steamship Lines, Inc. The vessel arrived and tied up at Pier 32, San Francisco, at 10:45, October 2, 1981. The port boiler was secured at 1100 for purposes
of our light-off observation later in the day. While secured, welding repairs to the boiler casing were undertaken. Due to the repairs, light off was rescheduled from 1430-1500 to 1700-1800. At 1700 the repairs were completed and the light-off procedure initiated~ Fuel and Equipment Data Fuel Residual Fuel (Bunker C)
Purchased in Los Angeles or Peru, Specifications not available.
Boilers Babcock &Wilcox (two) Design pressure: 750 psig Maximum steaming rate. 108,000 lb/hr, each
C-3

Normal steaming rate: 72,000 lb/hr, each Built 1963
Burners Babcock & Wilcox (four per boiler)
Steam-atomized "Racer" type (one size covers all operating
ranges)
Controls Type III category (Reardon &Conklin classification) Manual burning lighting
Boiler Light-Off Chronology 11 P11 11 S11Note: refers to port boiler burners 1, 2, 3 or 4; refers to
starboard boiler burners 1, 2, 3 or 4
1700a Opened air registers P3 and P4 to purge boiler S2, S4 online
1703 Inserted P3 burner, Pl already in place
1704 Atomizing steam to P3
1706 Raised drum water level
Checked fuel oil temperature to port boiler 1706 Removed Pl burner
1707 Hand-held torch lighted (three-man job, one at controls, two at boiler)
1708 Torch inserted P3
1708 Light off of P3 (ship's engineer reported he had a small amount
of white smoke)
1708-09 Fan speed adjusted 1710 Checked interlock to ensure it was released
1711.75 Decreased air flow (ship's engineer thought he had too much white smoke)
1714 Inserted Pl 1714.5 Port outlet gas 290°F
1715.5 Alarm sounded - refrigerating unit went down 1718 Inserted Sl and S3
1723 Secured S2 and lighted S3 1724 Starboard boiler: 570 psi, 290°F
Port boiler: 300 psi, 275°F
1727 Port boiler: 350 psi
aTimes are approximate and intended to aid in the relating of commission opacity to event only
C-4

1728 Removed Pl, inserted Sl 1729 Inserted Pl, (last two steps were to align burners and burner
locations) 1731 Port boiler: 400 psi 1735 Port boiler: 450 psi 1740 Port boiler: 500 psi 1743 Port boil er: 550 psi 1744 Port boiler cut in 1746 Pl lighted 1747 Sl lighted Boiler Room Observations
Based upon the experience of Mr. Merrick, the Santa Mariana exhibited a normally maintained boiler room. Likewise, the crew exhibited what would be considered normal training and experience.
This was not a cold-boiler light off as the starboard boiler was being fired (burners S2 and S4 lighted). In addition, the port boiler had been secured only since 1100. Normally 24 or more hours are required to bring temperatue to ambient conditions.
Mechanical atomizers are available for light off when both boilers are cold -- no steam. Then an emergency diesel generator is used to generate electricity to run pumps to force fuel oil into the boiler, atomized by mechanical pressure alone.
This vessel uses only one set of steam atomization burner tips which covers the entire range of fuel flows needed for all operating modes.
The sequencing of burners after the light off was attributed to: • The ship's engineer's desire to use burners on the lower level
in each boiler: ideally, one burner in each boiler on the lower level. As demand for steam increases additional burners are inserted and lighted.
• The burners were numbered according to boiler location and the crew had installed burners in mismatched locations. The Chief Engineer prefers burners always be used at the same location.
C-5

VISIBLE EMISSION OBSERVATION RECORD
"'- ACUREX f~' Aerotherm
VISIBLE EMISSION OBSERVATION RECORD
Company __::::,_._'.::>_~>~A-=~-=-'.:"-'-'-➔~~f~]1~;-",z'-'-,-'--'':zc.c'•'--'','-'...J----'D'-t-~--'--'-T7--'-:t:,__-=L'-,-'-/I,-·~___;:_-~_______ Date j(; /2- /8i Time First Sighted Plume _________
Time Start ·5. O(, PPI 17ol~ Time Stop ___/_)_4--_9~---------
Air Temperature -'"'"' 60°F Relative Humidity_.,_R,__A-'-1'--'-N"'-'1'-'-rv'-:·(.c..'-------
Wind Speed /I/ 5 - IO t"'l;,H Wind Direction ~! •~, TV l-:;:A-<;. t Sky Condition _____________ Background O. :=c~.c.+,:, ~-F( Y
Plume Characteristics: Continuous: &'Yes O No
Color L1c-t-11 Ar-:0,.,'1~· IP Ki:,3-cr<., Dispersion Description __________
Stack Height ~ /DD Er PG;o;t,;:- ii-'1:J.i"F°((ft) Observer Location 40 (ft) of stack"1--4F• D,~.
Sun Location: D Back of Observer D Left Shoulder 0. ..J.. 0 Right Shoulder O Other ---=-"--l'-V-.--=-=--=-c..a.,v1.-.:...c....:::______________
Emission Point
* /7ob
1715
1720
rn5
Mrn 0 15 30 45 Mrn 0 15 30 45 Mrn 0 15 30 4')
01 ),0 bo 4-0 L/0 21 25 20 2_0 2_0 41 70 /0 /00 4U 02 40 40 4-0 4-o 22 2S 2D 25 2.0 42 '20 0 0 (J
03 40 4-0 4-0 4-0 23 2..0 20 Z.o 2..0 43 /0 ID ID 10
04 4-0 4o 4-0 40 24 -;;~, 15 2..0 25 44 /0 10
05 25 35 65 35 I 7 ~o25 20 1.0 20 "2.f; 45
06 ~o 30 sD 30 26 2o Jo 20 2£ 46
07 30 3o "?O 3u 27 Jo LJ) 20 15 47
08 -:;;Jo 30 '30 30 28 2D 20 15 2D 48
09 ?,o "30 s'D sO 29 '.2..0 2£ 20 '2..0 49
10 5£ Jo 2 -s SD 7 ~5 30 15 15 20 15 50
11 3o '"3,o 50 2~ 31 IS 15 15 15 51
12 '25 3o ?o 30 32 20 25 30 2..:5 52
13 s5 s5 .:ss s5 33 ,~ 15 20 /5 53
14 25 so ?,6 35 34 ,s /'5 ,Z() 1..0 54
15 5£, 4o :;;£; 3o I7'rlo 35 1..0 1.S ·2t:> 1£ 55
16 30 20 20 LfO 36 10 1..0 20 ;5 56
17 40 30 '3c) ·20 37 /5 15 ).O ,5 57
18 20 20 30 35 38 4-5 60 so 25 58
19 40 40 ;,O ss 39 25 50 ?D 4-0 59
20 3cJ 2 6 -i.£, 30 , ~40 40 60 55 55 60
NOTES:Z,_,__,i'-'-1!.-'-r,·c..:.-~~"'---'O""-.'--'te;,.,""-_,G.,,_p,.,_,,l"'M'--'Q"-''lc.:.1.!.:f>_'"-c,_,~~----'g"-'~"'-"'-d-'-'-'nc....,!,,:..,•-~-----------
i Ci c.i , d m ¼-- '° ce I" lr " cJ o-f
Inspector -~Z~U_)_a_lt_~~t--/4-~------ Date --=-/D_,_/-=--2+/--=q_,__/___
Forrn AC 430 G 77
C-6

VISIBLE EMISSION OBSERVATION RECORD (Continued)
MAP
+ r
r
Symbols
Point where plume observed = .............. .Sun=*
Plume direction = ~ Observer= ~
Water Vapor Condensate ------------------------------
Photographs: □ File □ Enclosed □ None
Comments
Signature _____________________ Date __________
C-7

Conclusions
The results of the observation indicated that there were 7-1/2 min of excessive visible emissions (emissions exhibiting 40 percent or greater
opacity). Initial light off resulted in 3-3/4 min of excessive
emissions. The opacity of emissions was reduced to compliance levels upon
adjustment by the ship's engineer of the air flow to the boiler as a
result of observation of the stack gas conditions through the periscope.
It was noted by the ship 1 s engineer that the periscope/stack seal was allowing moisture into the periscope and causing an apparent discoloration
to the observed stack gases. After sufficient time, the moisture was
driven off by the heat of the stack gases resulting in a more correct
appearance of stack gases. This problem may have caused a delay in the
detection of excessive visible emissions and adjustment of the air flow to
correct the situation. If an opacity monitor had been available, the
excessive visible emissions would have been detected quicker and it is
possible that the required air flow adjustments made sooner resulting in a
shorter period of excessive emissions.
Subsequent periods of excessive emissions from the Santa Mariana totaling 3-3/4 min were the result of the sequencing of burners described
earlier which caused momentary instabilities. As it was not necessary to
sequence burners for the ship to maneuver safely out of port, this period
of excessive emissions cannot be attributed to normal boiler light 0ffs.
If ship procedures had been followed when arriving .in port, the burners
would have been in the customary locations and sequencing avoided. If, as
was the case, ship procedures were not followed, sequencing of burners
could have been delayed till the vessel was out of the port of San Francisco.
In summary, of the 7-1/2 min of excessive visible emissions, 3-3/4 min could be attributed to boiler light off of residual fuel. It is
possible that early detection of the problem through the use of an opacity
monitor would have resulted in quicker remedial action and, thereby,
compliance with the standard visible emissions law.
C-8

Novomber 3, 1981
TO: Files - Ship Emissions FROM: Henry Modetz SUBJECT: Observation of Boiler Light off
1. Purpose The light-off of a cold boiler using distillate fuel was observed
to better understand the procedure and to obtain the visible emission profile. 2. Ship/Date
U.S.S. Wichita (AOR-1) U.S. Navy Alameda, California October 2, 1981
3. · Attendees Lt. Cmdr. Jennings, U.S. Navy Fred Merrick, MGA Henry Modetz, Acurex Walt Wyss, Acurex
4. Discussion The U.S.S. Wichita is the lead ship of the "Wichita" class of
replenishment oilers of the U.S. Navy. These ships carry petroleum and munitions and have a limited capacity for dry and frozen provisions.
The ship was berthed at Alameda for minor repair and was scheduled to sail October 27, 1981, for Portland, Oregon. The three boilers have been secured for approximately 3 weeks but the ship has been using shore steam to provide a steam "blanket" for the boilers and for hotel services. The light off which occurred on October 20, 1981, was performed
to test the functioning of various systems. Fuel and Equipment Data Fuel Distillate Fuel (DFM)
Specifications not available but must conform to military specification MIL-F-16884G
Boilers Foster Wheeler (three) Design presure 615 psig
C-9

Design temperature 840 to 875°F
Maximum steaming rate 132,000 lb/hr, each
Normal steaming rate 83,000 lb/hr, each
Built 1969
Burners Todd (three per boiler) Steam-atomized "D-20 11 type (two sizes; one for normal
steaming and one for overload) Controls Type III category (Reardon &Conklin classification)
Manual burning lighting
Boiler Light-Off Chronology 8:32 Electric blower has been on for at least (0 min to purge the
furnace of gases. (Electric blower requirement is 20; steam
driven blower is 10 min.)
8:32.45 Torch lighted
8:33.20 Torch inserted
8:33.30 Number 1 burner on number 2 boiler lighted. No adjustments
made to fuel flow (rate not known; full pressure at manifold is
45 psi) Boiler room reported clean stack through use of periscope.
Also all seamen and officers present observed stack through
periscope.
8:40 No measurable rise in temperature or pressure. Fuel flow not changed.
Boiler Room Observations Lt. Cmdr. Jennings described a boiler acceptance test for sea
trials. On DFM, the boiler must be put through a 70 percent power ramp in
45s; stabilize in 4 min (drum water level and steam pressure) and result
in no visible emissions.
Each burner has two tips: normal and overload. Light off occurs
with a hand-held torch and, once lighted, the burner remains in use (i.e,
it is not cycled). Normal port operation calls for one boiler online
while at sea two boilers are fired. The ship is equipped with analog
controls but the controls operate off steam pressure. Therefore control
is manual till sufficient pressure is developed. Each boiler is fitted
with a periscope so that the stack can be observed, however, no flue gas
analyzers (oxygen or opacity monitors) have been installed. For the light
C-10

off, the electric blowers are used to supply combustion air until steam pressure is built up. From a cold start it takes 2 hr to reach this pressure, approximately 400 psi (70 percent of design steam pressure
appears to be commonly accepted as the point at which controls, blowers, etc can function automatically). It takes about 2-1/2 hr to reach the
operating pressure of 600 psi, however, if one boiler is "idling", i.e. online, it takes only 1-1/2 to 2 hr to reach 600 psi.
Posted on the wall near the boilers' control panel was a copy of
E0S Advisory Memo 45 Addendum instructing the boiler operators to secure
the boiler if white smoke is observed and cannot be corrected in 1 min. The reason is to prevent boiler explosions, however this also indicates an
upper limit to the duration of white smoke from boiler light offs by the U.S. Navy. In addition, it indicates an approach to increasing operator awareness. Conclusions
The results of the observation indicated that opacity averaged 10 percent or less during the light off and that the vessel was easily in
compliance with both the standard visible emissions law of the California Health and Safety Code and with the more restrictive local air pollution
control district regulations on visible emissions. Tt was concluded that
boiler light off using a distillate fuel is a viable and effective means
of achieving visible emission limits prescribed by air pollution control
regulations.
C-11

VISIBLE EMISSION OBSERVATION RECORD
~ ACUREX ~ Aerotherm
VISIBLE EMISSION OBSERVATIO.N RECORD
Company _ _,.\)'-S"'-':>---=-W"-1=t..=lf.,_,1'TI'\~-----------------------
Date _ __._l..:::O-+-h.=....:_-o__,__/_,,,g'--'/_________ Time First Sighted Plume ________
Time Start --~8~-~·'3~3_A-_M________ Time Stop /5.'4 7'1"1 Air Temperature ~ b 5 "'I=- Relative Humidity """ 8 C ___q..e.__o..:..:"/.,:c______
Wind Speed O- ? MPH Wind Direction s:Yi' "#1 l,(E'" £,J,;r To W~
Sky Condition O.,e,1.ur,C: Background {) ~ ¼ Plume Characteristics: Continuous: (g'"Yes D No
Color
Stack Height
~- L,c.u-r G,u~'I1
2~ ~ f..,o J...uk... Dispersion Description.1..'11....~===------
(ft) Observer Location 20 (It) 11011TH of stack
Sun Location: 0 0
Back of Observer Right Shoulder
O Left Shoulder . + CL._ O Other __ 0.:::....:,v-(A.:....::...c=~=--"'--'~=:::L.-.---------
Emission Point
M,n 0 15 30 45 Min 0 15 30 45 M,n 0 15 30
.'3 01 t7 0 21 41
02 0 C) 0 0 22 42
03 0 0 0 0 23 43
04 D 5 5 5 24 44
05 IO lo ,o /0 25 45
06 /0 l n Jo ,o 26 46
07 /{) Jo /0 IO 27 47
08 lo ro to to 28 48
09 to 10 /0 10 29 49
10 10 tO ro 10 30 50
11 I{) /0 lb lb 31 51, 12 /0 /(J JO IO 32 52
13 l) 10 JO 10 33 53
14 34 54
15 35 55
16 36 56
17 37 57
18 38 58
19 39 59
20 40 60
4~
Forf"'I AC 430 4 77
C-12

VISIBLE EMISSION OBSERVATION RECORD (Continued}
MAP
+
Symbols
Sun= )f( Point where plume observed = ..................... .
Plume direction = ---") Observer= ~ """£.£ c.c""' ...""·......,.Water Vapor Condensate __";;:>_____··--=~~•-=----------------
Photographs: □ File □ Enclosed ~ne
--------------------------------···
Signature _________________ Date ________
C-13
November 3, 1981
TO: Files -- Ship Emissions FROM: Henry Modetz SUBJECT: Observation of Boiler Light off
1. Purpose The light off of a cold boiler using Bunker C fuel was observed to
better understand the procedure and to obtain a better emission profile of light offs through visible emission readings. 2. Ship/Date
President Truman, American President Lines, Inc. Middle Harbor Terminal, Berth C Oakland, California October 29, 1981
3. Attendees Chief Engineer, President Truman Fred Merrick, MGA Henry Modetz, Acurex Walt Wyss, Acurex
4. Discussion The President Truman is an intermodal freight ship, of 22,000 SHP,
built in 1967. It is owned and operated by American President Lines, Inc. It has been retrofitted twice, the latest being 5 to 6 years ago when flame scanners and electronic igniters were installed. The President Truman arrived in port October 27, 1981, and secured the starboard boiler from repairs to a steam valve. The usual practice is not to shut down either boiler while in port as the usual time in port is 14 hr in Oakland; 36 hr in San Pedro.
The port boiler was online with flame on burners numbers 1 and 2. Steam pressure was 600 psi at 580°F with the oxygen analyzers indicating 5 to 5.5 percent oxygen on the port boiler. (At sea, the Truman runs at 1.5 percent oxygen).
Light off of the starboard boiler was delayed due to a steam leak in the atomizing steam line. The face plate was required to be turned
C-15

down and a new gasket installed. At 9:09 a.m. the repair was completed
and the light-off procedure initiated.
5. Fuel and Equipment Data
Fuel Residual fuel (Bunker C)
Specifications not available.
Boilers - Ccmbustion Engineering (two)
Design pressure - not available
Maximum steaming rate - not available
Normal steaming rate - not available
Built 1960
Burners - Babcock & Wilcox (four per boiler)
Steam atomized
Controls- Type III category (Reardon &Conklin classification Electronic igniter lighting
The President Truman had remote control capability from the bridge
but it is reported union rules do not allow its use. The ship has oxygen
analyzers (it is not clear when they were installed) which are used as
indicators only. Burner controls are not tied to the analyzers. The ship
has a periscope installed for observation of the stack by boiler room personnel.
6. Boiler light-off Chronology
09:06:00 Starboard furnace being purged by opening the air
registers on burners numbers 1 and 2.
09:07:30 Preparations to light off. 09:07:55 Initial attempt to light off failed. The oil in the
line from the manifold to the number 2 burner was cold. The boiler was purged and a second attempt made.
09:08:52 Ignition of number 2 burner. The air register on number 1 is open also as the igniter sometimes will
short out on the air register with the vanes in the
open position.
09:09:00 The air register on number 1 closed.
Chief reported he did observe some black smoke upon
light off. Usually, he stated, it lasts 1 min or so. Adjustment made to air/fuel ratio. Air decreased.
C-16

09:19:00 No measurable pressure/temperature. Port boiler at 600 psi 620°F.
09:22:00 Adjustment made to air/fuel ratio. Air decreased. 09:23:30 Oxygen analyzers read 5.5 percent excess on the port
boiler; 12 percent on the starboard. 09:26:00 Excess air gage was sticking. Correct readings:
Port -- 5.5 percent; Starboard -- 9 percent. 7. Boiler Room Observations
Based upon the experience of Mr. Merrick, the President Truman exhibited a normally well maintained boiler room. Likewise, the crew exhibited wht could be considered normal training and experience.
Recently all burners were replaced due to the unavailability of the original tips. The ship has one set of wide-range steam-atomized tips and one set of mechanical tips for emergencies and cold-boiler light offs. In these instances, mechanical tips are used to atomize the distillate (diesel) fuel with power for the fuel oil pumps supplied by an emergency diesel generator. 8. Conclusions
The results of the observation indicated that there were 3 min of excessive visible emissions (emissions exhibiting 40 percent or greater opacity). Therefore, the visible emissions upon light off with residual fuel were in compliance with the standard visible emissions law, section 41701 of the California Health and Safety Code. However, the results also indicated that there were an additional 2 min of visible emissions between 20 percent and 40 percent opacity. As a result, there were a total of 5 min of visible emissions which were equal to or greater than 20 percent, which meant that the vessel would have violated the more restrictive emission limits in four of the five local air pollution control districts. From these results, it was concluded that while compliance is difficult to achieve, there were no physical or technical reasons which prevented a vessel from complying with the standard visible emission law upon light off with residual fuel. It was also concluded that achieving 20 percent opacity upon light off with residual fuel would be very difficult.
C-17

VISIBLE EMISSION OBSERVATION RECORD
f;\., ACUREX ~ Aerotherm
VISIBLE EMISSION OBSERVATIO_N RECORD
Company ~J~ ~ ''iJ~ ~tJ '5,BD iso,~ L.ia,.rUFic 'P<'ll;:T' J3c1L~ -0~~9
Date /0 /2 't / g I Time First Sighted Plume
Time Start ____q~:_l)_t:,_A-'---1.1\-=------- Time Stop cf-' 2o ll M-'-------Air Temperature __~_ __,7_,,o"---•----'F'-------- Relative Humidity __...!./1'\'--""E:t>="'-"..ic:c......,=-------
Wind Speed --~0~-~5_M-'-i>"----'--'H______ Wind Direction £&sr To SE~ Sky Condition k@'tg_ Background Bt.o.J€" $,<,t Plume Characteristics: Continuous: Drfes D No
Color -4yf LJ..,..c__ k, PotlT &,,;J...,..._ s;,;J...., Dispersion Description __________
Stack Height ~ ~c~,.:Jt i,~~"" (ft) Observer Location -50 (ft) 5~ of stack .,,.~~c:"'4:
Sun Location: ~ack of Observer D Left Shoulder 0 Right Shoulder O Other
gnw -J. ?--t '3~ s~ (5.-.,, ,;...t,)Emission Point
Min 0 15 30 45 Min 0 15 30 45 M,n 0 15 30 45
01 zv 2.5 2.,0 2.0 21 41
02 25 Zo 3cJ 30 22 42
03 35 35 3o 35 23 43
04 I./" 45 5" "-lo 24 44
05 L/.S ,o 70 fo 25 45
06 /()0 /DP I/JO go 26 46
07 z_.o lo 2,.IJ '2..0 27 47
08 2o zv 21? Z.o 28 48
09 Zo 'Z...'7 2.o 2.0 29 49
10 2o lO ,-s 2o 30 50
11 2o 20 2,o 1.0 31 51
12 15 JS 2o 'lo 32 52
13 20 20 20 2o 33 53
14 1.o 1.0 JS 1.0 34 54
15 -z_o 35 55 I
16 36 56
17 37 57
18 38 58
19 39 59
20 40 60
Inspector U ~ Date IO /J.. 9 / f3I Form A( ~ 30 C 77
C-18

VISIBLE EMISSION OBSERVATION RECORD (Continued)
r
MAP
s
L_______________________________..,..., .,.,'
Symbols
Point where plume observed = ................. .
Plume direction = ~ Observer= ~ Water Vapor Condensate -----------,---------------------
Sun= "JI(.
Photographs: □ File □ Enclosed efNone
Comments
S,gnature _____________________ Date ___________
C-19

Illlllll~ill~l(l~~fl~f11111111 05558