acurex corporation/aerotherm. division aerotherm … · carbon phenolic (e.g., fiberite mx 4926)....
TRANSCRIPT

Acurex Corporation/Aerotherm. Division
March 1976
Aerotherm Project 7084
UNIFIED COMPUTER CODESPROPERTIES DATA FOR LOW COST
NOZZLE MATERIALSE. Chu
H. TongR. Bedard
AEROTHERM REPORT TR-76-9
Prepared for
National Aeronautics and Space AdministrationMarshall Space Flight CenterHuntsville, Alabama 35812
Contract NAS8-30264
'" ACUREX,~, Aerotherm
https://ntrs.nasa.gov/search.jsp?R=19760018254 2018-08-31T03:00:14+00:00Z

Section
2
3
4
5
6
TABLE OF CONTENTS
INTRODUCTION AND SUMMARY
MATERIAL SURVEY STUDY .
SUB-SCALE SCREENING TESTS
INTERMEDIATE TEST PROGRAM
MATERIALS FULL CHARACTERIZATION PROGRAM
5.1 Decomposition Kinetics5.2 Elemental Composition.5.3 Heat of Formation ..•5.4 Density .5.5 Specific Heat Capacity5.6 Thermal Conductivity .
5.6.1 Virgin Material Thermal Conductivity5.6.2 Dynamic Thermal Conductivity
5.7 Characterization Summary
CONCLUSIONS
REFERENCES .
APPENDIX A- RESIDUAL VOLATILE MEASUREMENTS
ii
Page
1-1
2-1
3-1
4-1
5-1
5-15-35-35-105-115-11
5-135-13
5-24
6-1
R-l
A-l

Figure
2-1
3-1
3-2
3-3
3-4
3-5
4-1
4-2
5-1
5-2
5-3
5-4
5-5
5-6
5-7
5-8
5-9
5-10
5-11
5-12
5-13
5-14
5-15
5-16
5-17
5-18
5-19
5-20
5-21
5-22
5-23
LIST OF ILLUSTRATIONS
Prepregged ablative material raw costs
Test configuration . • . . .
Screening test sample dimensions
Typical post-fired surface condition of hybrid carbon/phenolic materials
Typical post-fired surface condition of pitch mat/phenolic materials .•
Typical post-fired surface condition of carbon fabric/phenolic materials
Cured versus post-cured intermediate test results
Cured versus post-cured intermediate test results
Comparison of TGA data and CMA prediction
Comparison of TGA data and CMA prediction
Comparison of TGA data and CMA prediction
Comparison of TGA data and CMA prediction
Comparison of TGA data and CMA prediction
Measured virgin material thermal conductivity
Measured virgin material thermal conductivity
Measured virgin material thermal conductivity
Measured virgin material thermal conductivity
Measured virgin material thermal conductivity
Control volumes for in-depth energy and mass balances
Aerotherm constrictor are, rocket simulator configuration
Typical instrumented duct flow test section
0° char thermal conductivity .
90° char thermal conductivity
Comparison of in-depth thermocouple measurements and CMA prediction
Comparison of in-depth thermocouple measurements and CMA prediction
Comparison of in-depth thermocouple measurements and CMA prediction
Comparison of in-depth thermocouple measurements and CMA prediction
Comparison of in-depth thermocouple measurements and CMA prediction
Comparison of in-depth thermocouple measurements and CMA prediction
Comparison of in-depth thermocouple measurements and CMA prediction
Comparison of in-depth thermocouple measurements and CMA prediction
; ; ;
Page
2-4
3-3
3-5
3-9
3-10
3-11
4-3
4-4
5-5
5-6
5-7
5-8
5-9
5-14
5-.15
5-16
5-17
5-18
5-19
5-22
5-23
5-25
5-26
5-27
5-28
5-29
5-30
5-31
5-32
5-33
5-34

Figure
5-24
5-25
5-26
LIST OF ILLUSTRATIONS (Concluded)
Comparison of in-depth thermocouple measurements and CMA prediction
Comparison of in-depth thermocouple measurements and CMA prediction
Char layer profiles for char conductivity test samples .
iv
Page
5-35
5-36
5-37

Table
2-1
2-2
3-1
3-2
3-3
3-4
3-5
3-6
3-7
3-8
4-1
4-2
5-1
5-2
5-3
5-4
5-5
5-6
5-7
5-8
5-9
5-10
5-11
A-l
LIST OF TABLES
Candidate Low Cost Materials for Shuttle SRM Throat Material Screening Test .
Candidate Low Cost Materials for Shuttle SRM Exit Cone Material Screening Test
Comparison of Rocket Motor and APG Environments
Comparison of APG Test Gas and Typical Nozzle Exhaust Gas EquilibriumComposition .....
Screening Test Matrix ..
Shuttle SRM Throat Material Screening Test Results
Shuttle SRM Exit Cone Materials Screening Test Results
Shuttle SRM Throat Materials Performance and Cost Comparisons
Shuttle SRM Exit Cone Materials Performance and Cost Comparisons
Selection of Shuttle SRM Low Cost Nozzle Evaluation Materials
Intermediate Test Matrix ....
Shuttle SRM Evaluation Materials Intermediate Test Results
Decomposition Kinetics of Low Cost Materials
Elemental Composition of Pyrolysis Gas •.
Nominal Values for Resin and Reinforcement Heats of Formation'
Heat of Formation of Virgin Low Cost Materials
Densities of Low Cost Carbon/Carbon Materials
Virgin Material Specific Heat Capacity ....
Thermal and Physical Properties of Pitch Mat Carbon Phemolic
Thermal and Physical Properties of Hybrid Pitch Mat/Rayon Fabric Phenolic
Thermal and Physical Properties of Pitch Mat Molding Compound
Thermal and Physical Properties of Pitch Fabric Phenolic
Thermal and Physical Properties of Canvas Phenolic
Screening Material Residual Volatile Measurements
v
Page
2-2
2-3
3-2
3-2
3-6
3-7
3-8
3-12
3-13
3-14
4-1
4-2
5-5
5-10
5-10
5-10
5-11
5-12
5-38
5-39
5-40
5-41
5-42
A-2


SECTION 1
INTRODUCTION AND SUMMARY
Rocket nozzles for the Space Shuttle SRM are being designed using materials which have been
. proven successful by many years of testing. However, the Shuttle philosophy of providing an econ
omical means of placing material and personnel into earth orbit requires a continued effort to reduce
mission costs. One area in which significant cost reductions can be realized is in the area of the
nozzle ablative liners. The primary high heat load material for current nozzles is a rayon precursor
carbon phenolic (e.g., Fiberite MX 4926). The material for lower heating conditions in the exit
cone and nozzle backside is a silica phenolic (e.g., Fiberite MX 2600). Over the past several years,
a number of low cost materials have been proposed as substitutes for the above materials; however,
the level to which these materials have been characterized was insufficient to allow a thermal anal
ysis of a full scale nozzle design. A need therefore existed to obtain the thermophysical and thermo
chemical properties of promising low cost materials.
low cost carbon phenolic materials development has centered on the replacement of rayon pre
cursor carbon with pitch precursor carbon. Using continuous filament pitch carbon fabrics, the pro
jected costs for carbon phenolic in the early 1980's may be about 23$/pound. Using pitch carbon mats,
the cost may decrease to as low as 12$/pound. Further reductions may be possible as pitch carbon makes
a deeper penetration into consumer goods. These projected costs may be compared to about 30$/pound for
current carbon phenolic prepreg.
Low cost materials development to replace current silica phenolics has centered on the use of
double thickness cloths and elastomeric resins to increase the component fabrication speed. Material
costs are not projected to be altered significantly in the next decade. Alternative reinforcements,
such as canvas, have also been considered.
The objective of this investigation was to develop the analytic capability to predict the thermal
ablation response of promising low cost materials. To achieve this objective, it was necessary to
1. Select potentially viable low cost materials. This was accomplished by a questionnaire and
telephone survey of material prepreggers and nozzle fabricators.

2. Experimentally determine the relative thermal performance of these materials. This was
accomplished by screening potential low cost materials in the Aerotherm arc plasma gener
ator.
3. Determine if materials of the same generic class but from different suppliers performed
differently. This was determined from the screening test data.
4. Select representative materials from each generic class and determine their thermophysical
and thermochemical properties. This was accomplished by appropriate characterization ex
periments.
5. Define these characteristics in a form which is compatible with current thermal performance
prediction techniques.
In the arc plasma generator ablation tests performed in Steps 2 and 4, Fiberite MX 4926 (carbon
phenolic) and MX 2600 (silica phenolic) were used as reference baseline materials. For the low cost
materials primary emphasis was on pitch carbon reinforced phenolics; however silica and canvas rein
forced phenolics were also tested.
The generic classes of materials selected for low cost evaluation were
1. Pitch carbon mat reinforced phenolic
2. Pitch carbon fabric reinforced phenolic
3. Pitch carbon molding compound
4. Hybrid pitch carbon mat/rayon carbon cloth reinforced phenolic
5. Silica reinforced phenolics
6. Canvas cloth reinforced phenolic.
Phenolic or elastomer modified phenolic was the resin for each generic class. Materials were
obtained from a number of prepreg suppliers. These materials were quantitatively compared in terms of
thermal performance by a simulation of propellant environments in an arc plasma generator. It was
found that material response was not very dependent upon the supplier of the material; however, a de
pendence on cure cycle was observed.
In order to provide data for analytic purposes, the thermophysical properties of these low cost
materials were evaluated. These data were assembled in a form which is compatible with current pre
diction procedures. As a result of this program an analytic capability has been established to pre
dict the thermal performance of new low cost rocket nozzle liner materials.
1-2

Aerotherm is pleased to acknowledge the cooperation and contributions of the Fiberite, Ferro,
Hexcel and U.S. Polymeric Corporations. These organizations responded to a lengthy questionnaire
and provided all of the required test materials.
1-3


SECTION 2
MATERIAL SURVEY STUDY
Since there is only limited knowledge of the performance of low cost materials in rocket
nozzles, a material survey study was necessary to capitalize on the background of material suppliers.
Such a survey study will not only enable one to have a better understanding of the thermal behavior
of low cost materials, it will also provide a better perspective in designing a test matrix for the
low cost materials performance study.
The survey study started with data collection. Material manufacturers and nozzle fabricators
were contacted to participate in this program and to propose promising low cost materials. The com
panies which responded were as follows:
• Fiberite Corporation
• Hexcel Corporation
• U. S. Polymeric Corporation
• Ferro Corporation
Questionnaires covering the areas such as material properties, fabrication techniques, cure procedure,
and material characteristics were sent to the above companies for their response. This information
was subsequently compiled and integrated qualitatively into a screening test matrix.
The second part of the survey study was to perform a qualitative analysis on the proposed low
cost materials based upon the information received. By utilizing mechanical and thermal properties
from qualified materials (MX 4926 - Shuttle SRM baseline throat material, MX 2600 - Shuttle SRM base
line exit cone material) as a guideline to analyze the proposed materials, less favorable materials
were eliminated before the screening test ..
The results of this study are shown in Tables 2-1 and 2-2. As can be seen, the properties of
the selected low cost materials are of the same order of magnitude as the qualified materials.
Information on the cost of some of the selected screening materials was also collected from
the above companies. An estimated trend of cost for each generic class of materials for calendar
years between 1975 to 1987 are presented in Figure 2-1.
2-1

N I N
TABL
E2-
1.CA
NDID
ATE
LOW
COST
MAT
ERIA
LSFO
RSH
UTTL
ESR
MTH
ROAT
MAT
ERIA
LSC
REEN
ING
TEST
Res
inT
ensi
leT
ensi
le/
With
Ply
Gen
eric
Tit1
eSo
urce
Mat
eria
lD
ensi
tyC
onte
ntS
tren
gth
F1ex
ure
Con
duct
ivit
yV
olat
ile!
Des
igna
tion
(GR/
CC)
Mod
ulus
Btu
-in
Con
tent
(%)
(KSI
)(M
SI)
Hr-
Ft-2
°F(%
)
Rayo
nCa
rbon
Fib
erit
eMX
4926
1.40
3418
.02.
73.
50.
56C
loth
Phen
olic
Pit
chM
atF
iber
ite
MX49
291.
4050
10.0
2.0
3.6
1.30
Car
bon
Phen
olic
USP
FM47
82BG
1.48
4512
.02.
44.
52.
05Fe
rro
ACX-
C86P
M1.
4043
5.0
1.38
Hyb
rid
Pit
chF
iber
ite
MX49
281.
4052
10.0
2.0
6.7
1.70
Mat
/Ray
onUS
PFM
5790
1.50
4413
.52.
52.
81C
loth
Phen
olic
Hex
cel
4CS
P08/
4C10
0845
1.47
Kyno
1C
arbo
nUS
PXF
M57
951.
4936
15.0
2.5
4.5
5.41
Clo
thPh
enol
icFe
rro
ACX-
CPH
411.
46
Kur
eha
Pit
ch4.
04C
arbo
nC
loth
Fer
roAC
X-C8
6i<42
Phen
olic
Pit
chM
atF
iber
ite
MXC
313P
1.50
377.
02.
02.
51.
08M
oldi
ngUS
PFM
5782
MC1.
6038
6.0
2.4
5.5
1.76
Com
poun
dH
exce
l4C
SPO
BMC
1.50
459.
52.
21.
69
Kur
eha
Pitc
hF
abri
cM
oldi
ngFe
rro
ACX-
C86K
MC
1.40
465.
82.
33Co
mpo
und
Pitc
hCa
rbon
Fib
erit
eMX
G10
33F
1.64
3223
.55.
02.
53.
80C
loth
Phen
olic
USP
FM57
955.
41H
exce
14C
1246
USP
itch
Fab
ric
Fib
erit
eMX
G10
33FM
CM
oldi
ngCo
mpo
und
ICur
edco
mpo
site
I,

N I W
TABL
E2-
2.CA
NDID
ATE
LOW
COST
MAT
ERIA
LSFO
RSH
UTTL
ESR
MEX
ITCO
NEM
ATER
IALS
SCRE
ENIN
GTE
ST
Aga
inst
Ply
Gen
eric
Tit
leSo
urce
Mat
eria
lD
ensi
tyR
esin
Con
duct
ivit
yD
esig
natio
n(G
R/C
C)
Con
tent
Btu
-in
Hr
-Ft
20F
Stan
dard
Sil
ica
Fib
erit
eMX
2600
1.74
334.
1C
loth
Phen
o1ic
Snap
wra
pSi
lic
aF
iber
ite
MXS
E-55
1.30
302.
2C
loth
Phen
olic
Dou
ble
Thi
ckS
ilic
aC
loth
Ferr
oC
A-2
221/
961.
7531
2.7
Phen
olic
Can
vas
Clo
thFi
beri
teM
XKF-
418
1.30
382.
2Ph
enol
icH
exce
l4K
9502
1.20
42-

..0 o ~ CANV
ASCL
OTH
PHEN
OLIC
STAN
DARD
AND
DOUB
LETH
ICK
SILI
CACL
OTH
PHEN
OLIC
RAYO
NFA
BRIC
!I
CARB
ONPHE~OLIC
30
±~W2jz
22
2t2
2<;/1
20~<
::7
P(,-C
H?F~R
IC?
/
10m}
$>$f}
$>S?f«
~
~ co ...J .....
. -~ ~ V'l
0 U W ;;- ..... ~ e:t:
N
...J
I
lXl
-I:>
e:t:
c w <.::l
<.::l w a: Q.
W a: Q.
7577
7981
CALE
NDAR
YEAR
8385
87
Figu
re2-
1.Pr
epre
gged
abla
tive
mat
eria
lra
wco
sts.

SECTION 3
SUB-SCALE SCREENING TESTS
The thermal performance of a number of low cost materials was evaluated by a screening test
program using an arc plasma generator (APG) as a convective heat source. The low cost materials in
this program (see Tables 3-1 and 3-2) included pitch carbon phenolic candidate throat materials, and
silica and canvas phenolic candidate exit cone materials. A major part of the screening program was
devoted to the pitch carbon phenolics since these materials show promise for very significant reduc
tions in material costs.
The screening test conditions were designed to simulate the actual motor firing conditions as
closely as possible. Since the major emphasis was the thermal performance of a meterial in a rocket
nozzle, simulation of the following parameters was considered important:
• Heat flux to the material (q)
• Reactive chemical species (H, 0) composition
These two parameters were chosen because the former represents the simulation of in-depth temperature
profile and the latter represents the simulation of surface chemical erosion. An exact simulation
would, of course, not be possible so some c~mpromises were necessary for testing in an arc plasma gen
erator. Tables 3-1 and 3-2 show the comparisons between the screening test conditions and anticipated
motor firing conditions.
Low cost materials were tested in the APG in a planar nozzle configuration (see Figure 3-1).
As can be seen two samples can be tested simultaneously. Due to supplier difficulties, not all of
the materials selected for screening tests were received in time. The screening tests were there
fore performed in two series. Series I screening tests were performed with the composite plies in
the 0 degree orientation for exit and molding compound materials and 90 degree orientation for
throat materials. Continuous filament pitch carbon phenolic material (Series II) was tested in the
90° orientation with a dummy model on the opposite wall. These dummy models were fabricated from
the same materials but plies were oriented at 20° rather than 90°. A tentative selection of
materials for full characterization was made based on the first screening test series.
3-1

TABLE 3-1. COMPARISON OF ROCKET MOTOR AND APG ENVIRONMENTS
Rocket Motor Convective Environment
A >. Pe ue he peueCH qA* (ft) (atm) (ft/see) (Btu/1bm) (1bm/ft2 -see) (Btu/ft 2 -sec)
1.0 3.1 26 3430 595 0.78 1170
3.0 7.8 3.2 7050 -190 ·.21 277
4.0 9.6 2.2 7440 -320 .15 265
ARC Plasma Generator Environment
A Pe he peueCH qcwA* (atm) (Btu/1bm) (lbm/ft2-see) (Btu/ft2-see)
1.0 2.93 8713 0.074 982
3.0 1.82 2456 .042, 281 .
4.0 1.76 2558 .037 250
TABLE 3-2. COMPARISON OF APG TEST GAS AND TYPICALNOZZLE EXHAUST GAS EQUILIRBIUM COMPOSITION
Test Gas Equilibrium Composition
Typical Nozzle Exhaust Gas H, C, 0 Equilibrium Composition
3-2

W I W
,08
4-0
OG
slo
eP
Lb
lTE
MO
DIF
ICA
TIO
N
,08
4-0
0,
RETAININ~
\(e
yM
OD
EL
.
Figu
re3-
1.T
est
conf
igur
atio
n.
70
84
-00
"2
-rc
':>'T
MO
DE
L..
"13"
~eCTIOt-.l
,08
4-0
01
ie$
TM
OD
EL
.."A
"se
cT
ION
,08
4-
00
'"5
1D
e.
PL
AT
EM
O\?
IFlc
..A
TIO
N

In the Series I tests, the throat entrance insert ("C" section) was fabricated from pyro1ytic
graphite. Very little ablation was observed on this section so that subsequent Series II testing was
done using P03 graphite throat entrance inserts. However, as a precaution, the inlet end of the throat
test section was increased to minimize any possible effects due to material discontinuities. The test
configurations for both Series I and II are shown in Figure 3-2 and the test matrix is shown in Table
3-3. As can be seen, materials from the same generic class were arranged to be tested simultaneously
on the premise that their performance should be similar.
The screening test results are shown in Tables 3-4 and 3-5 respectively for pitch and silica
reinforced material. As can be seen, the ablation performance of the selected low cost materials for
tha Shuttle SRM throat were all comparable to the baseline material, rayon carbon cloth phenolic.
In fact, some materials appeared to be even superior to rayon precursor carbon cloth phenolic. Some
similarity in ablation performance is expected because the thermal and physical properties of the test
ed materials were of the same order of magnitude (see Table 2-1), however superior performance was an
unexpected benefits. Typical post-test surface conditions for some APG screening test samples are
shown in Figure 3-3 to 3-5.
The screening test results for Shuttle SRM exit cone materials indicate that (see Table 3-5)
double thick silica cloth phenolic had the best ablation performance among the silica cloth phenolic
materials. The reason for this superior performance is not clear because no correlation was found
based on the material properties. Canvas cloth phenolic has poorer performance compared to silica
cloth phenolic. The reason here is obvious; canvas cloth phenolic has higher hydrogen and oxygen
contents which result in a higher degree of thermal decomposition.
Also shown in Tables 3-4 and 3-5 are the residual volatiles content for the cured composites
tested in Series I. These measurements were made by Hexcel Corporation.
From the screening test results, five generic materials were selected for full thermophysical
property characterization. Of these five, four were selected from the throat material category and
one from the exit cone material category. Since the main objective of this program was to study low cost
materials, the selection was based on ablation performance as well as cost performance. Cost perfor
mance here is defined as total ablation times material cost per pound. During the first round of
selection, one representative material from each generic title was selected based on ablation perfor
mance. On the second round of selection, a comparison of cost performance among the representative
materials was made (see Tables 3-6 and 3-7), and the five materials were selected accordingly.
3-4

Screening Test Series 1
A,,,,,L::-L 1.0
--I 1.25
Screening Tests Series 2
2.25II-A
1.619I-B
cl",',~ 2.17
--J
Figure 3-2. Screening test sample dimensions.
3-5
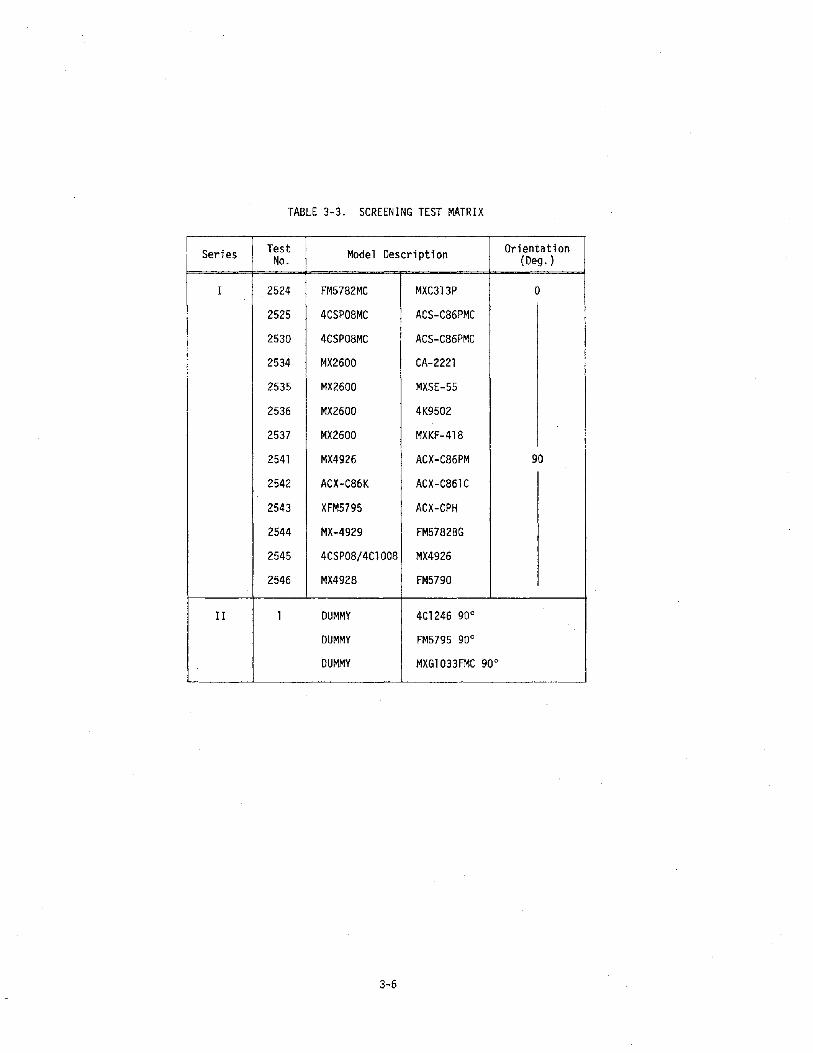
TABLE 3-3. SCREENING TEST MATRIX
Series Test Model Description OrientationNo. (Deg. )
I 2524 FM5782MC MXC313P 0
2525 4CSP08MC ACS-C86PMC
2530 4CSP08MC ACS-C86PMC
2534 MX2600 CA-2221
2535 MX2600 MXSE-55
2536 MX2600 4K9502
2537 MX2600 MXKF-418
2541 MX4926 ACX-C86PM 90
2542 ACX-C86K ACX-C861C
2543 XFM5795 ACX-CPH
2544 MX-4929 FM5782BG
2545 4CSP08/4C1008 MX4926
2546 MX4928 FM5790
II 1 DUMMY 4C1246 900
DUMMY FM5795 90 0
DUMMY MXG1033FMC 900
3-6

TABLE 3-4. SHUTTLE SRM THROAT MATERIAL SCREENING TEST RESULTS
Material Volatile 2 Mass 3
SurfaceGeneric Title Source Content LossDesignation (%) (Grams) Appearance
Rayon Cloth Fiberite MX4926 0.56 5.2 SmoothCloth Phenolic
Pitch Mat Fiberite MX4929 1.30 4.9 SmoothCarbon Phenolic U.S. Polymeric FM5782BG 2.05 4.4 Smooth
Ferro ACX-C86PM 1.38 5.0 Smooth
Hybrid Pitch Fiberite MX4928 1.70 4.8 RoughMat/Rayon U.S. Polymeric FM5790 2.81 4.0 Rough
Cloth Phenolic Hexcel 4CSP08/4C1OO8 1.47 5.3 Rough
Kynol Carbon Fiberite XFM5795 5.41 3.6 SmoothCloth Phenolic Ferro ACX-CPH 1.46 3.3 Smooth
Kureha Pitch Ferro ACX-C86K 4.04 5.8 RoughCarbon Cloth
Phenolic
Pitch Mat 1 Fiberite MXC-3l3P 1.08 5.7 Spa 11 edMolding Compound U.S. Polymeric FM5782MC 1. 76 6.8 Spalled
Hexcel 4CSP08MC 1. 69 6.6 Spalled
Kureha Pitch l Ferro ACX-C86KMC 2.33 4.1 RoughFabric Molding
Compound
Pitch Carbon Fiberite MXC1033F 3.80 (~ )Cloth Phenolic U.S. Polymeric FM5795 5.41 4.6
Hexcel 4C1246 5.2
UC Pitch Fabric Fiberite MSG1033FMC 6.4 RoughMolding Compound
lFabric plies were oriented 90° to the heated surface except for these materials.For these materials, the heated surface was perpendicular to the molding direction.
2Cured composite
3Normalized to 30 seconds and Series I configuration
~APG malfunction
3-7

W I 00
TABL
E3-
5.SH
UTTL
ESR
MEX
ITCO
NEM
ATER
IALS
SCRE
ENIN
GTE
STRE
SULT
Sl
Vol
atil
eM
ass
Sur
face
Mat
eria
lC
onte
ntLo
ssG
ener
icT
ftle
Sour
ceD
esig
natio
n(%
)(G
MS)
App
eara
nce
Stan
dard
Sn
ica
Fib
erit
eM
X260
04.
192.
6Si
02an
dSi
CC
loth
Phen
olic
Fonn
atio
n
Snap
wra
pS
ilic
aF
iber
ite
MXS
E-55
1.83
3.6
Si02
and
SiC
Clo
thPh
enol
icFo
nnat
ion
Dou
ble
Thi
ckS
ilic
aC
loth
Ferr
oC
A-2
221/
962.
221.
8Si
02an
dSi
CPh
enol
icFo
nnat
ion
Can
vas
Clo
thF
iber
ite
MXK
F-41
84.
125.
1S
igni
fica
ntPh
enol
icH
exce
l4K
9502
4.26
6.2
Cha
rrin
g
lAll
test
sco
nduc
ted
inth
e0°
ply
orie
ntat
ion
with
resp
ect
toce
nter
line
2Non
naliz
edto
30se
cond
s

'& \Xl
......~
4C10
08MX
4928
W I ~
MX49
26FM
5790
Fig
ure
3-3.
Typ
ical
po
st-f
ired
surf
ace
cond
itio
no
fhy
brid
carb
on/p
heno
lic
mat
eria
ls.

W I ......
a
~ <:::>~ ~
t~x
4926
ACX-
C86P
M
1
MX49
29
FM57
82BG
Fig
ure
3-4.
Typ
ical
po
st-f
ired
surf
ace
cond
itio
nof
pitc
hm
at/p
heno
lic
mat
eria
ls.

W I --'
--'
~ 0'
~
j
ACX-
C86K
XFM
5795
ACX-
686K
ACX-
CPH
Figu
re3-
5.T
ypic
alp
ost
-fir
edsu
rfac
eco
ndit
ion
of
carb
onfa
bri
c/p
hen
oli
cm
ater
ials
.

W I N
TABL
E3-
6.SH
UTTL
ESR
MTH
ROAT
MAT
ERIA
LSPE
RFOR
MAN
CEAN
DCO
STCO
MPA
RISO
NS
Nom
inal
iNo
mina
lM
ass
Raw
Mat
eria
lM
ass
Loss
xRa
wM
ater
ial
Gen
eric
Tit
leD
ensi
tyC
ost
(197
5$I
lb)
Cos
tPe
rfor
man
ce(G
MS
x$
/lb
)(G
M/C
C)Lo
ss;
(GM
)19
7519
8019
7519
80
Rayo
nC
arbo
n1.
405.
230
.030
.015
615
6C
loth
Phe
noli
c
Pit
chM
at1.
454.
815
.012
.072
58Ca
rbon
Phen
o1ic
Hyb
ridP
itch
Mat
/Ray
on1.
454.
722
.521
.010
699
Clo
thP
heno
lic
Kyn
olC
arbo
n1.
493.
525
.030
.088
105
Clo
thP
heno
lic
Kur
eha
Pit
chCa
rbon
Clo
th5.
8P
heno
lic
Pit
chM
atM
oldi
ng1.
536.
315
.512
.598
79Co
mpo
und
Kur
eha
Pit
chF
abri
cM
oldi
ng1.
404.
1Co
mpo
und
UCP
itch
Fab
ric
Mol
ding
Com
poun
d6.
428
.023
.017
914
7!

(.o
JI -"
(.oJ
TABL
E3-
7.SH
UTTL
ESR
MEX
ITCO
NEM
ATER
IALS
PERF
ORM
ANCE
AND
COST
COM
PARI
SONS
Nom
ina1
Nom
inal
Raw
Mat
eria
lM
ass
Loss
xRa
wM
ater
ial
Gen
eric
Tit
leD
ensi
t)M
ass
Cos
t(1
975
$/lb
)C
ost
Perf
orm
ance
(GM
Sx
$lb)
(GM
S/CC
Loss
(GM
S)19
7519
8019
7519
80
Sil
ica
Phen
olic
1.74
2.6
610
1626
Snap
wra
p1.
303.
66
1022
36S
ilic
aPh
enol
ic
Dou
ble
Thi
ck1.
751.
86
1011
18S
ilic
aPh
enol
ic
Can
vas
1.25
5.6
55
2828
Phe
noli
c

The final selection of low cost materials for further study is shown in Table 3-8. With the
exception of MXG1033F and 4K9502, these selected materials have shown good ablation performance and
low cost potential. MXG1033F was selected arbitrarily since no screening test data was obtained for
this material class. Silica phenolic is an obvious exit cone material; however low cost silica mate
rials are very similar to those that have been previously characterized. Canvas phenolic was there-
fore selected as an exit cone material for full characterization. Canvas cloth phenolic has a
reasonable low cost potential although quality control and material traceability leaves something to
be desired.
TABLE 3-8. SELECTION OF SHUTTLE SRM LOW COST NOZZLE EVALUATION MATERIALS
Generi c Ti t1 e Source MaterialDesignation
Pitch Fabric Carbon Fiberite MXG 1033FPhenolic
Pitch Mat Phenolic Hexce1 4CS P08
Hybrid Pitch MatiRayon Fabric Carbon U.S. Polymeric FM 5790
Phenolic
Pitch Mat Phenolic Fiberite MXC 313PMolding Compound
Canvas Cloth Hexce1 4K 9502Phenolic
3-14

SECTION 4
INTERMEDIATE TEST PROGRAM
In the low cost materials screening test, five generic materials (see Table 3-8) were selected
for further evaluation. Both 20° and 90° composite ply orientation tests were performed on each of
the five intermediate test materials. In addition, some materials were subjected to an extended cure*
to determine whether or not this would affect the ablation performance.
The intermediate test matrix is shown in Table 4-1. The test configuration was the same as
Series II of the screening test program.
TABLE 4-1. INTERMEDIATE TEST MATRIX
CARBON PHENOLIC, A/A* = 1.090° orientation
20° orientationMXG1033 A.R.FM5790 A.R.MXC313P A. R.4CSP08 A.R.
CANVAS PHENOLIC90° orientation
MXG1033FFM5790MXC3l3P4CSP08
A.R.*A.R.A.R.A.R.
MXG1033F P.C. tFM5790 P.C.MXC313P P.C.4CSP08 P.C.
MXG1033F P.C.FM5790 P.C.MXC3l3P P.C.4CSP08 P.C.
4K9502 A.R. 4K9502 P.C.20° orientation
4K9502 A.R. 4K9502 P.C.
*As received material
tPost-cured material
*To be referred to as post-cured material.
4-1

The intermediate test results are shown in Table 4-2.
TABLE 4-2. SHUTTLE SRM EVALUATION MATERIALSINTERMEDIATE TEST RESULTS 1
20°2 90°2Generi c Titl e Source Material Mass Mass A/A*3Designation Loss Loss
(GMS) (GMS)
Pitch Mat Hexcel 4CSP08 2.9 4.8 1.0Carbon Phenolic
Hybrid PitchMat/Rayon USP FM5790 2.5 4.5 1.0Fabric Phenolic
Pitch Fabric Fi beri te MXG1033F Test Faci 1i ty 1.0Phenolic Fa il ure
Pitch Mat Fiberite MXC3l3P 2.6 6.0 1.0Molding Compound------
Canvas Phenolic Hexcel 4K9502 4.6 5.2 4.0
lAll tests conducted in both the 20° and 90° ply orientation2Normalized to 30 seconds and initial screening configuration,
material as received3Simulated Shuttle SRM nozzle expansion ratio
No delamination was observed in the 20° orientation for both cured (as received) and post-cured
materials. It was also found that the post-cured materials (except for pitch mat molding compound)
perform slightly better than the as-received materials (see Figures 4-1 and 4-2). The better perfor
mance is probably due to lower volatile and water contents in the post-cured materials since these
two elements would induce exothermic reactions and chemical erosion at the surface. The results of
the 90° orientation as-received materials did not provide any new information, but do provide as
surance that materials to be fully characterized have a reproducible thermal performance:
The following conclusions can be extracted from this study.
• Intermediate test data are consistent with screening test data.
• The tests provided assurance that materials to be fully characterized are reproducible.
• Post-cured materials have better ablation performance than as-received materials.
• The results indicate that full characterization tests should be performed on post-cured
materials.
4-2

-l'> I W
...J~ ..... c:r
:w i l
V') w I-
200
PLY
ORIE
NTAT
ION
TEST
ING
POST
-CUR
EI
HYBR
IDPH
ENOL
IC
CURE
HYBR
IDPH
ENOL
IC
POST
-CUR
EPI
TCH
ICA
RBON
MAT
.M
.C.
CURE
PITC
HCA
RBON
MAT
.M
.C.
+-POST
-CUR
E4
SILI
CAPH
ENOL
IC,
~__1
4---C
URE
SILI
CAI
PHEN
OLIC
POST
-CUR
EI
CANV
ASPH
ENOL
IC
CURE
CANV
ASPH
ENOL
IC
II
II
II
r-. o 0:> I «
o0.
10.
20
.30.
40.
50.
6
MASS
LOSS
RATE
(GM
S/SE
C)
Figu
re4-
1.C
ured
vers
uspo
st-c
ured
inte
rmed
iate
test
resu
lts.

900
PLY
ORIE
NTAT
ION
TEST
ING
+:> I +:>
-J co: .... ex:
UJ
~ :E: tn UJ
I-
POST
-CUR
EI
HYBR
IDPH
ENOL
IC
CURE
HYBR
IDI
PHEN
OLIC
POST
-CUR
EPI
TCH
ICA
RBON
MAT
.M
.C.
CURE
PITC
H
ICA
RBON
MAT
.M
.C.
IPO
ST-C
URE
,I
SILI
CAPH
ENOL
IC
CURE
SILI
CAI
PHEN
OLIC
POST
-CUR
EI
CANV
ASPH
ENOL
IC
CURE
CANV
ASPH
ENOL
ICI
II
II
.t\ o CO I <l:
a0.
10.
20
.3
MASS
LOSS
RATE
(GM
S/SE
C)0.
40.
5
Figu
re4-
2.C
ured
vers
uspo
st-c
ured
inte
rmed
iate
test
resu
lts.

SECTION 5
MATERIALS FULL CHARACTERIZATION PROGRAM
Since the properties for charring ablative materials are dependent upon fabric orientation
and thermodynamic state (T and p), material properties were evaluated for virgin and charred com
posites in at least two fabric orientations. The properties determined were
• Decomposition kinetics
• Elemental composition
• Heat of formation
• Density
• Specific heat capacity
• Thermal conductivity
The materials for which these properties were determined are
• U.S. Polymeric
• Fiberite
• Hexce1
• Fiberite
• Hexce1
5.1 DECOMPOSITION KINETICS
FM5790
MXG1033F
4K9502
MXC313P
4CSP08
Resinous materials degrade in a highly complex manner. These complex degradation mechanisms
are generally not understood sufficiently to formulate exact analytical expressions. Therefore,
empirical homogeneous kinetics are normally used to describe the degradation.
5-1

The thermal degradation reactions, if assumed to be irreversible, may be described by a psuedo-
order classical rate expression.
(_Eai\ (Pi _ Pri\ 1/Ji
RTJ POi POi j (5-1 )
The kinetic parameters (activation energy Eai , frequency factor Bi , and reaction order 1/Ji) can be
determined by reducing thermogravimetric analysis (TGA) data.
The multiple-linear-regression analysis is one of the procedures which can be used to reduce
TGA data. This analysis has the capability to evaluate the three kinetic parameters simultaneously
and also to curve fit the input data in a theoretically optimal manner.
The evaluation procedure is straightforward. Equation (5-1) is first linearized to yield
the following form
JI, ( d Pi/POi) - Jl,n B. +~ (1) + ,10. Jl,n(Pi - Pri\n - de - , R \T '1', \ POi J (5-2)
The bracketed terms in Equation (5-2) can be obtained from TGA data. As the number of data points
is larger than three, the equations will overdetermine the values of kinetic constants. Hence, an
optimum curve fitting procedure is required. If we write Equation (5-2) in matrix notation, it has
the form
B= AX (5-3)
where B and A are matrices whose elements are determined from the TGA data and X is the matrix of
best fit parameters. The curve fitting procedure is then applied by multiplying Equation (5-3) by
the transpose of A
(5-4)
where ATA is square and determinate. Hence, the Xmatrix can be evaluated by Gaussian elimination
from the transformed normal equations.
The experimental data used for data reduction are obtained from thermogravimetric analysis
(TGA). TGA is an experimental procedure to measure the pyrolysis mass loss history at a prescribed
heating rate. The heating agent is usually an inert gas such as argon or nitrogen in order to pre
vent any surface chemical reaction. Heating rates may range from O.l°C to lOO°C per minute. For the
5-2

low cost materials, a heating rate of 10°C per minute was used to obtain TGA data since the higher
the heating rate, the lower the accuracy of the data. 10°C per minute is a value that has yielded
reliable data in the past. In addition, the pyrolysis kinetics of charring materials behave
almost linearly with respect to heating rate. The experimental data was obtained by a subcontract
to The Boeing Company.
The kinetic constants which were determined for the low cost materials are presented in
Table 5-1. Equation (5-1) was integrated to reproduce TGA results. Excellent agreement was
achieved which indicates the quality of the correlated kinetic constants (see Figures 5-1 to 5-5).
5.2 ELEMENTAL COMPOSITION
The elemental composition of the pyrolysis gas and char must be known in order to generate
surface thermochemistry tables and determine the pyrolysis gas enthalpy. The char composition for
canvas and carbon phenolic materials is often easy to determine as it is merely carbon residue. To
determine the pyrolysis gas composition, however, requires a knowledge of both the virgin material
composition and the residual mass fraction. The virgin material composition is usually provided by
the manufacturers, and the residual mass fraction is known from TGA. With this information,
the elemental composition of pyrolysis gas can then be evaluated by the following equations:
=~KpYi 1 - r (5-5)
(5-6)
where K is the mass fraction; r is the residual mass fraction; and subscripts py, c, v denote py-
rolysis gas, carbon, and virgin material, respectively.
The evaluated pyrolysis gas elemental compositions of the low cost materials are presented
in Table 5-2.
5.3 HEAT OF FORMATION
The virgin material heat of formation is determined from
(5:"7)
5-3

TABLE 5-1. DECOMPOSITION KINETICS OF LOW COST MATERIALS
Material Reaction POi Pri BiWi Eai/R rNo. i (lbm/ft 3) (lbm/ft 3) (sec-I) (OR)
FM5790 1 2.375 0 4.8 0.358 7787.6 1.0
2 19.135 75.560 3.5712 x 10⁶ 2.259 27825.0
3 - - - - -
MXG1033F 1 1.0226 0 6.4977 x 10⁴ 0.838 12095.0 1.0
2 101.2374 90.3949 2.09904 x 10 6 2.667 23372.0
3 - - - - -4K9502 1 6.622 0 5.9285 x 10² 1.091 10096.0 0.5
2 88.906 0 2.39295 x 10¹¹ 1. 317 35602.0
3 81.048 51.206 2.37558 x 10 7 3.101 28225.0
MXC313P 1 2.4756 0 160.464 2.5591 8302.88 0.5
2 8.5764 0 4.884 x 10 9 1.2265 35541.80
3 165.7818 143.2356 1.70007 x 10²² 6.9232 64876.00
4CSP08 1 1.8965 0 0.77715 0.91273 5522.17 1.0
2 79.6735 67.4994 7.791 0.96349 13005.18
3 - - - - -
5-4

~ ~ ...., ...., ~ , c:(
100Iii
)(M
,IIIIIa
&L:I
IFI
1579
0po
st-c
ured
•~
II
II
I. T
=10
°Cjm
;n_
__
data
)(pr
edic
tion
-- ~I0I
I»
I,
II
II
~_
II
II
r.-:R
01 I 01
80
'!
I!
I!
II
,!
!,
o20
040
060
080
010
0012
0014
0016
0018
0020
0022
0CTe
mp
-oR
Figu
re5-
1.C
ompa
rison
ofTG
Ada
taan
dCM
Apr
edic
tion
.

(Jl
I '"
100 90
---;;;
---80
~ :EI~
70
r.
r~
MXC
313P
Pos
t-cu
red
T
.~
. T-1
O°C
/min
""
Dat
a-
XP
redi
ctio
n
\
'-.
Lt> ..,. .., .., .....
. Ic:(
6040
060
080
010
0012
00
Tem
pera
ture
-oR
1400
1600
1800
2000
Figu
re5-
2.C
ompa
rison
ofTG
Ada
taan
dCM
Apr
edic
tion
.

<.n I ......
100 90
.-..
80~ 2£
:1:.:0
70
.I
4CSP
08P
ost-
cure
d.
~T
1OOQ
/min
Dat
a
~I-
)(P
redi
ctio
n
~\
10~ M M ~
I<C
6040
060
000
010
0012
00
Tem
pera
ture
-oR
1400
1600
1800
2000
Figu
re5-
3.C
ompa
rison
ofTG
Ada
taan
dCM
Apr
edic
tion
.

I"'
"."
I
MXG
1033
FP
ost-
cure
d. T
WO
C/m
in
Dat
a
XP
redi
ctio
n
!
~~.
..
c.n I ex>
100
--..
90~ :E
1::!:
o
BOo
200
400
600
BOO
1000
1200
1400
1600
1800
.......
'<!"
M M ~I
<t
2000
Tem
pera
ture
-oR
Figu
re5-
4.C
ompa
rison
ofTG
Ada
taan
dCM
Apr
edic
tion
.

01 I '"
100 90 30 70 60
-50
~ :E
I:E
40 30
--I
II
4K95
02P
ost-
cure
d.
.r"T
10°C
/min
t--
Dat
a
XP
redi
ctio
n.
~ .\ JIl )
.,
)
1
,
~ t")
t") I c:e
20o
200
400
600
800
1000
1200
1400
1600
1800
2000
2200
Tem
pera
ture
-oR
Figu
re5-
5.C
ompa
rison
ofTG
Ada
taan
dCM
Apr
edic
tion
.

TABLE 5-2. ELEMENTAL COMPOSITION OFPYROLYSIS GAS
Type of Mass Fraction
Material H C 0
FM5790 0.14727 0.46301 0.38972MXG1033F 0.19383 0.29337 0.512804CSP08 0.16766 0.38884 0.44350MXC313P 0.13526 0.50679 0.357954K9502 0.08880 0.40760 0.50360
The reinforcement material for the five selected low cost materials is either carbon or canvas.
The nominal values for resin and reinforcement heats of formation are shown in Table 5-3. For the
TABLE 5-3. NOMINAL VALUES FOR RESIN ANDREINFORCEMENT HEATS OFFORMATION
lIH -1083 Btull bmfC2H20
lIH -2569 Btull bmfcanvas
lIH o Btu/lbmfcarbon
char, the heat of formation again is just merely the carbon heat of formation, i.e., zero.
Table 5-4 presents the evaluated heats of formation of the virgin low cost materials.
TABLE 5-4. HEAT OF FORMATION OF VIRGINLOW COST MATERIALS
Type of Material lIHf (Btull bm)
4CSP08 - 487.35FM5790 - 476.52
MXG1033F - 379.05MXC313P - 433.204K9502 -1944.88
5.4 DENSITY
The virgin material density was determined by precise weight and dimension measurement of
samples which have regular geometric shapes. The char density is evaluated by multiplying the vir
gin material density by the residual mass fraction which was obtained from the TGA data.
5-10

The measured or evaluated densities are shown in Table 5-5.
TABLE 5-5. DENSITIES OF LOW COST MATERIALS
Materials Virgin Density Char Density(lbm/ft 3
) (lbm/ft 3 )
4CSP08 81.570 67.500FM5790 93.510 75.560MXG1033F 102.260 90.395MXC313P 88.417 71.61784~5~ 88.288 25.603
5.5 SPECIFIC HEAT CAPACITY
The specific heat of the virgin material was determined by graphical differentiation of spe
cific enthalpy versus temperature curves. The enthalpy was measured using an ice mantle calorim
eter. The calorimeter consists of a copper well. a distilled water vessel surrounding the copper
well, an ice bath surrounding the vessel, and an insulation filled container surrounding the ice
bath. An ice mantle is formed on the outer surface of the copper well.
The material sample is heated to the desired uniform temperature in a muffle furnace and
then dropped directly from the furnace into the calorimeter. The energy lost by the sample as it
cools results in a volume change in the distilled water due to the partial melting of the ice man
tle. This volume change is quantitatively related to the original energy of the sample. A small
leak inherent in the apparatus is calibrated after each test and accounted for in the data reduction.
The samples used in the calorimeter tests are approximately 0.02 cubic inch in volume.
Table 5-6 shows the evaluated virgin material specific heat as a function of temperature.
The char specific heat, however, need not be determined since the specific heat capacity of carbon
is known.
5.6 THERMAL CONDUCTIVITY
The material thermal conductivity was determined by two separate techniques. The applicabil-
ity of each technique is dependent on the temperature and state of the material. The conventional
technique is applicable for the virgin material over the temperature range from room temperature to
approximately 700°F. The dynamic technique is applicable for the virgin, partially charred, or
fully charred material over the temperature range from 700°F to approximately 4000°F.
5-11
<

TABLE 5-6. VIRGIN MATERIAL SPECIFIC HEAT CAPACITY
Materials Temperature Cp(OR) (Btu/1bm- OR)
4K9502 500 0.360
BOO 0.440
1000 0.500
1200 0.540
2000 0.540
6000 0.540
4CSP08 500 0.200
800 0.320
1000 0.400
1200 0.460
1400 0.500
2000 0.500
6000 0.500
MXG1033F 500 0.120
800 0.320
1000 0.380
1200 0.430
1400 0.440
2000 0.4406000 0.440
MXC313P 500 0.160
800 0.340
1000 0.380
1200 0.4201400 0.440
2000 0.440
6000 0.440
FM5790 500 0.160
800 0.360
1000 0.420
1200 0.420
1400 0.420
2000 0.420
6000 0.420
5-12

5.6.1 Virgin Material Thermal Conductivity
Virgin material thermal conductivity was determined using a small thermal conductivity cell.
In this apparatus, the testing sample (1/6" thick wafer) is sandwiched between an aluminum block
(0.75 x 1.25 x 1.50 inches), and an aluminum slab (0.25 x 1.25 x 1.50 inches). The temperature
difference (6T) is then measured across the testing sample as the block is heated at a linear rate
equal to 4°C/min.
For calibration, an aluminum wafer is placed in the cell. The resulting 6T is assumed to be
the temperature baseline. A wafer of fused silica is run as a reference sample, and an instrument
constant is calculated for each 100° interval. The comparative values are then calculated from the
expression:
(5-8)
where k is the thermal conductivity, C is the instrument constant, L is the wafer thickness, and
~T is the temperature difference across the wafer.
Figures 5-6 to 5-10 present the measured thermal conductivity at both 0° and 90° orientation
for the virgin materials.
5.6.2 Dynamic Thermal Conductivity
The dynamic thermal conductivity technique is a combined experimental and analytical technique
which has the inherent advantage that the char characteristics of the materials are accurately du
plicated. This technique has been described in detail in References 2 through 5, and thus, will
only be summarized in the paragraphs below.
The analysis portion of this procedure involves solving the governing equation for transient
one-dimensional heat conduction in a charring ablating material. Incorporated within this equation
is the model for defining the thermal conductivity of the partially-charred and fully-charred mate
rials. This model is represented by the equation
k = (1 - x) k + xkP v (5-9)
where X is the mass fraction of virgin material and kp and kv are the thermal conductivities for
virgin and charred materials, respectively.
5-13

o0\
<:t
(Y')
(Y') I ct:
I
MXG
1033
F(v
irgi
n)•
090
°· ·
IfA
0°
E20
0 I-.
--
----.:.
I-
-.
.:.-
-.... .
I.
,--
....·
I.:.
I,
II
.A
A·
..:..
..:.
·-
I 070
080
090
010
0011
0012
001
100
140
o
2.0
3.0
5.0
1.04.0
u Q)
III I
0:: °I +'
'+-
........ ::> +'
C!l
~
I 0 X I >,
+'
.~ >
.~
<.n
+'
I
U
~
::>
.j::
>
"'0 C 0 U 0 E S-
Q)
..c:.
I-
Tem
pv
oR
Figu
re5-
6.M
easu
red
virg
inm
ater
ial
ther
mal
cond
ucti
vity
.

o U")
M M ~I
<C o
UI
TM
XC31
3P(v
irg
in)
ogo
g
&00
0Q
200
0
.-f:)
-.V
n~
v
Ir;
......
-Q
~A
/\
A~
..:...
_.yo
&~
0 n 600
700
800
900
1000
1100
1200
1300
14
5.
u ClJ
4.el
l I~ 0
I ...., '+- ....... =" ...., co
~3.
I 0 X I >,
Ul
....,I
.-~
>2.
Ul
.- ...., u =" "0 c::
:0 u 0 E ~ CL
J1
..c f-
Tem
p-
oR
Fig
ure
5-7.
Mea
sure
dvi
rgin
mat
eria
lth
erm
alco
nduc
tivi
ty.

5.0
li:4.
0<
II I0
:: ° I ..... .... ......
:::> ..... GO
3.0
... I 0 .- X I >,
..... .~2.
00'
1
.....I
U~
:::>O
'l
"0 <:
0 u ~ ~ ~1.
0I-
I
Fr15
790
(vir
gin)
<:>90
°
A0°
EJ20
°
t:\
,\:I
c:>
~
-J:\
.-
'-
.:.
I~I
-I
II
AI
---I.p
~~
I-~
Ll'l
M M
I<t
:
o 600
700
800
900
1000
Tem
p-
OR11
0012
0013
0014
00
Figu
re5-
8.M
easu
red
virg
inm
ater
ial
ther
mal
cond
ucti
vity
.

N U'>
M M ~I
<C
1400
1300
1200
1100
1000
Tem
p-
oR90
080
070
0
I
4CSP
08(v
irgi
n)
<.:>90
°
A0°
I:l20
°
- " --
~" -
~
-
C.:.
.
I.:..
II
-"I
II
At.
AA
.:..
---
---
----
~--
-o 60
0
5.0
u ~4.
0I ex: °I ...., .... "~ ...., co ~
3.0
I 0 X I >,
01
....,I~
>....
:;;2.
0u ~ "'0 <:
0 u 0 E ~ ClJ t:=
1.0
Figu
re5-
9.M
easu
red
virg
inm
ater
ial
ther
mal
cond
ucti
vity
.

M I.t'l
M M ~I
c:(
1400
1300
1200
900
1000
1100
Tem
pera
ture
-oR
800,
700
I
4K95
02(v
irgi
n)
G>90
°
&.
0°
I!J20
°
I l
-.-
.:.~
.I
,I
-I
.I
)
--[)
-~--
...
o 600
1.03.0
2.0
5.0
4.0
U <II
VI I '" °I ... .... ......
::l ... CO " I 0 OX I >, ... .~ >
.~
0"1
...I
U
~
::l
ex>
"I: 0 U 0 E s.. <II
.s::~
Figu
re5-
10.
Mea
sure
dvi
rgin
mat
eria
lth
erm
alco
nduc
tivi
ty.

The analytical procedure for defining the thermal conductivity of in-depth charring materials in
volves solving the governing one~dimentional conservation of energy and mass equations for an im-
pressed surface boundary condition. The flux terms considered in these equations are illustrated
in Fi gure 5-11.
" ~our < ,'" '" '" '" '" ~..,~
I......,.--J--_--._...,.-..,..-.,....~_c:r
Figure 5-11. Control volumes for in-depth energy and mass balances.
If it is assumed that the pyrolysis gases do not react chemically with the char and the py-
rolysis gases pass immediately out through the char, then the conservation of energy equation
becomes
(5-10)
where
A- area
h - total material enthalpy (chemical plus sensible)
hg - total pyrolysis gas enthalpy
rng - pyrolysis gas flowrate
t - time
T - temperature
y - distance from surface
p - density
and the conservation of mass equation becomes
~\ d)\dY 7t = A '!/fJY
(5-11 )
5-19
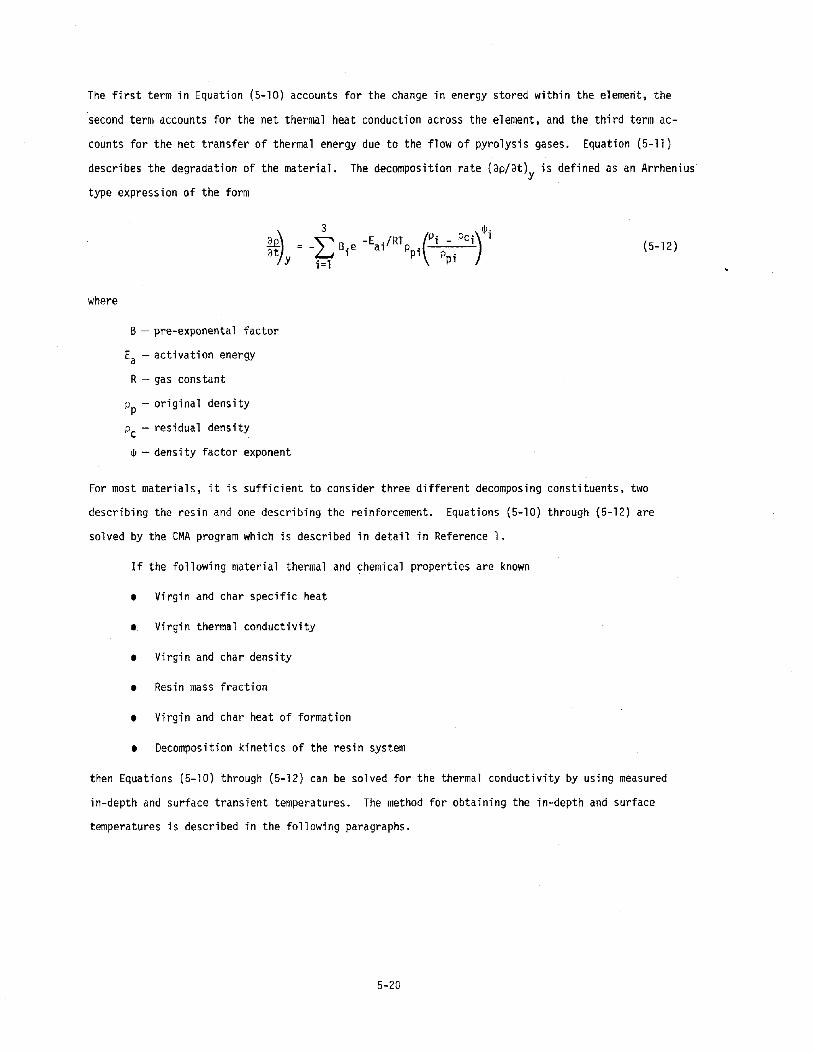
The first term in Equation (5-10) accounts for the change in energy stored within the element, the
second term accounts for the net thermal heat conduction across the element, and the third term ac
counts for the net transfer of thermal energy due to the flow of pyrolysis gases. Equation (5-11)
describes the degradation of the material. The decomposition rate (op/ot)y is defined as an Arrhenius
type expression of the form
where
B - pre-exponental factor
Ea - activation energy
R- gas constant
Pp - original density
Pc - residual density
W- density factor exponent
3 )~.
L -E ./RT (Pi - PCi 1- B.e a1 p.. 1 p1 Ppi1=1
(5-12)
For most materials, it is sufficient to consider three different decomposing constituents, two
describing the resin and one describing the reinforcement. Equations (5-10) through (5-12) are
solved by the CMA program which is described in detail in Reference 1.
If the following material thermal and chemical properties are known
• Virgin and char specific heat
• Virgin thermal conductivity
• Virgin and char density
• Resin mass fraction
• Virgin and char heat of formation
• Decomposition kinetics of the resin system
then Equations (5-10) through (5-12) can be solved for the thermal conductivity by using measured
in-depth and surface transient temperatures. The method for obtaining the in-depth and surface
temperatures is described in the following paragraphs.
5-20

The thermal conductivity test samples were tested in the Aerotherm 1 MW APG. The APG is
shown schematically in Figure 5-12. The test gases and test conditions were chosen to yield a
material thermal response typical of that in the actual application of interest. In addition,
chemically inert test gases were used so that the surface recession due to chemical corrosivity is
zero. Therefore, this surface boundary condition which is required in the data reduction process
was accurately known. The selected test gas, which is shown below, is chemically inert to most
materials at high temperatures and also approximates the specific heat capacity of rocket motor com
bustion products (Reference 2).
Mass Fraction0.2236
0.7764
The test configuration used was a two-dimensional (2-D) supersonic nozzle in which the con-
ductivity test section formed one wall as shown in Figure 5-13. The measurement station was the
nozzle throat which is of finite length and yields a significant region of well-defined, constant
test conditions. The 2-D configuration allowed the test section to be obtained from parts fabricated
by representative techniques (e.g., tape wrapped at any layup angle), allowed an accurate thermo
couple instrumentation technique, and provided an approximately one-dimensional heat flux path.
The surface temperature boundary condition was measured continuously during each test with an
infrared optical pyrometer. The in-depth temperatures were measured continuously during each test
at four locations and, together with the measured surface recession and surface temperature, provided
the test results on which the calculation of thermal conductivity was based. Tungsten-5 percent
rhenium thermocouples were used for temperature measurements at the two locations nearest the surface.
Chromel/alumel thermocouples were used at the other locations. The thermocouple installation tech
nique is illustrated in Figure 5-13. The stepped hole which accepts the thermocouple provides inti
mate contact with the material. The thermocouple wires were brought down the side walls through
alumina sleeving to prevent shorting across the electrically conductive char and/or virgin material.
The thermocouple wire size, compatible with the capabilities of thermocouple hole drilling, was
0.005 inch. The nominal thermocouple depths were 0.075, 0.150, 0.250, and 0.400. The actual thermo
couple depths were accurately determined from x-ray negatives. The details and techniques for
drilling the stepped hole and for thermally instrumenting the model are presented in Reference 3.
Since delamination is likely in 0° orientation testing, this experiment was conducted in
the 20° and 90° orientations.
5-21

01 I N N
TU
NG
ST
EN
CA
THO
DE
CA
THO
DE
MO
DU
LE
20
NO
ZZ
LE
TE
ST
SE
CT
ION
AX
ISY
MM
ET
RIC
TO
20
T
RA
NS
ITIO
NS
EC
TIO
N
Figu
re5-
12.
Aer
othe
rmco
nst
rict
or
are,
rock
etsi
mul
ator
conf
igur
atio
n.

ClJ<::~oa..~
=> ....,0'"u~
o~
E'"~....,
ClJl/l.£:: <::I-'~
5-23
c0, .~....,UQ)
:;, III
....,
"-\ IIIClJ....,3:0:;:....,U=>
""(lJ....,<::(lJE=>~....,III<::.~
~
It!u.~
a.~
M~
ILO
(lJ~
=>Ol.~
LJ...

The following equation was then applied to back out the 0° orientation conductivity after conducti-
vities in the 20° and 90° orientations were evaluated.
The evaluated char conductivities for 0° and 90° orientation are shown in Figures 5-14 and
5-15. The accuracy of the calculated char conductivity can be judged by comparing the calculated
and measured in-depth temperature histories (see Figures 5-16 through 5-25). Except for a few anom
alies the comparisons are excellent for the first 30 seconds of the tests. Subsequently, the pre-
dictions deviate from the measured values. This deviation was due to heat losses to the water
cooled APG components so that no attempt was made to match this data.
Post test char depth profiles are shown schematically in Figure 5-26. Differences in char
penetration between 20° and 90° orientation are obvious as are the effects of sidewall cooling. The
canvas phenolic material exhibited very erratic data and shows a correspondingly poor char profile,
especially for the 20° orientation. Of the data presented in Figures 5-14 and 5-15, the canvas
phenolic has the lowest confidence level.
The anomalies are due to thermocouple breakage or a separation of the thermocouples from the
char. The latter would result in very erratic temperatures which, for instance, were observed for
canvas phenolic (4K9502).
5.7 CHARACTERIZATION SUMMARY
The full characterization data is summarized in Tables 5-7 through 5-11. These tables pro
vided the information required for a thermal analysis of low cost materials.
5-24

40 r------r----~---...,..----r----.....,..----l./') l./')MM~
Ico:
30 t-----+----t-----J----+----+---,A
600050002000 3000 4000Temperature - oR
1000
10 t-----j-----+--
a:::°IUC1JVII~........... 20::J~c:l
...0
x~
Figure 5-14. 0° char thermal conductivity.
5-25

40 ...------.....~.+----_+----t__---+---~
Layup angle90°
4K950230
c:::
°IUQJIIII........
.......:>....coC' I1XG1033F"C> 20x
-'"
10 t------l~---_+--
6000500040003000200010000 ...--.........-------.....-------.....----o
Temperature 'V oR
Figure 5-15. 90° char thermal conductivity.
5-26

60.0o-r----r-----r---~.....--_Test 2785Model 7084-091'MXG1033FPost-cure 900
50.00
Surface
40.00N0.-0::0
TC2Q) 30.00lo-~ TCl.,'"lo-Q)0-s:Q)r-
20.00 CMA Prediction
~TCl
~ 2
8 3
10.00 0 4
80.000.001~---...---~--....I.---....
0.00 20.00 40.00 60.00Time - Seconds
Figure 5-16. Comparison of in-depth thermocouple measurementsand CMA prediction.
5-27

60.00r----.,.----..,..-----r----.....Test 2789I·lodel 7084-09514XG1033FPost-cure 200
50.001-----4------1-
coLt)....,....,....
I~
CllA PredictionTCl Ci.2~3840
TC2
TC3
Surface
10.00 __ Jr-, '.""1.
I 30.00...._--
a::o
OJs...:)....n:ls...OJ0SOJ
I- 20.00
'"o..
0.00 ~--~~~--.oIi!~~--~---...I0.00 20.00 40.00 60.00 30.00Time - Seconds
Figure 5-17. Comparison of in-depth thermocouple measurementsand CMA prediction.
5-28

60.00r----"'T""'----r--=--~~----_Test 2736.ilode1 7084":092~'XC3l3P
Post-cure 900
50.00t----+----+----t----~
40.00N
0
:;
c:::0
TC2QJ~
='.... TC3ttl~QJQ.
EQJ TC4I-
CI1A PredictionTCl ~
2<:)3 B~0
O.O~-_~~_-~~-~~II'__-~0.00 20.00 40.00 60.00 80.00
Time - Seconds
Figure 5-18. Comparison of in-depth thermocouple measurementsand CMA prediction.
5-29

60.00r----,..-----r-----r---.....
50.001---
Test 2788tlode1 7084-094tlXC313PPost-cure 200
i"-_"",_",,:,,...;s::u.:.rf~a:.:c.:.e., ------I
o\0..,..,....
Ic:e
40.00
~'"0;- A
6\ TC2c::0 &QJ 30.00 TC3~
~...,'"~QJ0-SQJI-
20.00
Ct1A Prediction
TCl Ili2~_
3840
o.OO~--~~--~~--~~__~0.00 20.00 40.00 60.00 80.00
Time - Seconds
Figure 5-19. Comparison of in-depth thermocouple measurementsand CMA prediction.
5-30

60.00------,,---------.....----
Test 2793Model 7084-096low conditionPost-cure 900
50. 00 1- -+ +-=4~K9::..:5:.:::0.::.2_ __t_---__I
40.001------1-----+----+-----1
Surface
TC3
TC4
CtlA PredictionTC1 A2~
3 G.4 <:>
10. 00I--~~~~
0.00~_-~~~-_..~~--~~--~0.00 20.00 40.00 60.00 ao.oo
Time - Seconds
I 30.001-=- --1 -+ +- -1CIlI:::J+'IVICIlc..EQI
I- 20.001----
c::o
Figure 5-20. Comparison of in-depth thermocouple measurementsand CMA prediction.
5-31

60.00 r----,..----r---......,.---....,
Test 2796Model 7084-0994K9502
50.00 I-- ~------------~ Post-cure 20°
N\0MM,....
I__.... e:t:
40. 00 t--..:...--+----+-----+----:-~No;-
30 00Surface
. t----~----'-=:__--+---_I
TC3
TC4·,-~~.;r~m Prediction
. & TC1~2
El 3o 4
0.00 ~--~~--~~--.......;;.--...I0.00 20.00 40.00 60.' 80.00
Time - Seconds
1o. 00 r::--",P
cv"~...,'""QJQ.EQJ
I- 20.00
Figure 5-21. Comparison of in-depth thermocouple measurementsand CMA prediction.
5-32

60. oOr-----r---....,.---......---......Test 2784f10de1 7084-0904CSP08 .
50.O. -if- -+-P_~~t-cure 90°
1O. 0....,,,·.110...
Surface
CMA·Prediction.TC1A
2~
384Q
O.O~~_~~~_~~~_~A.. _0,00 20.00 40.00 60.;;:J 80.00
Ti me - Seconds
Figure 5-22. Comparison of in-depth thermocouple ~easurements
and CMA prediction.
5-33
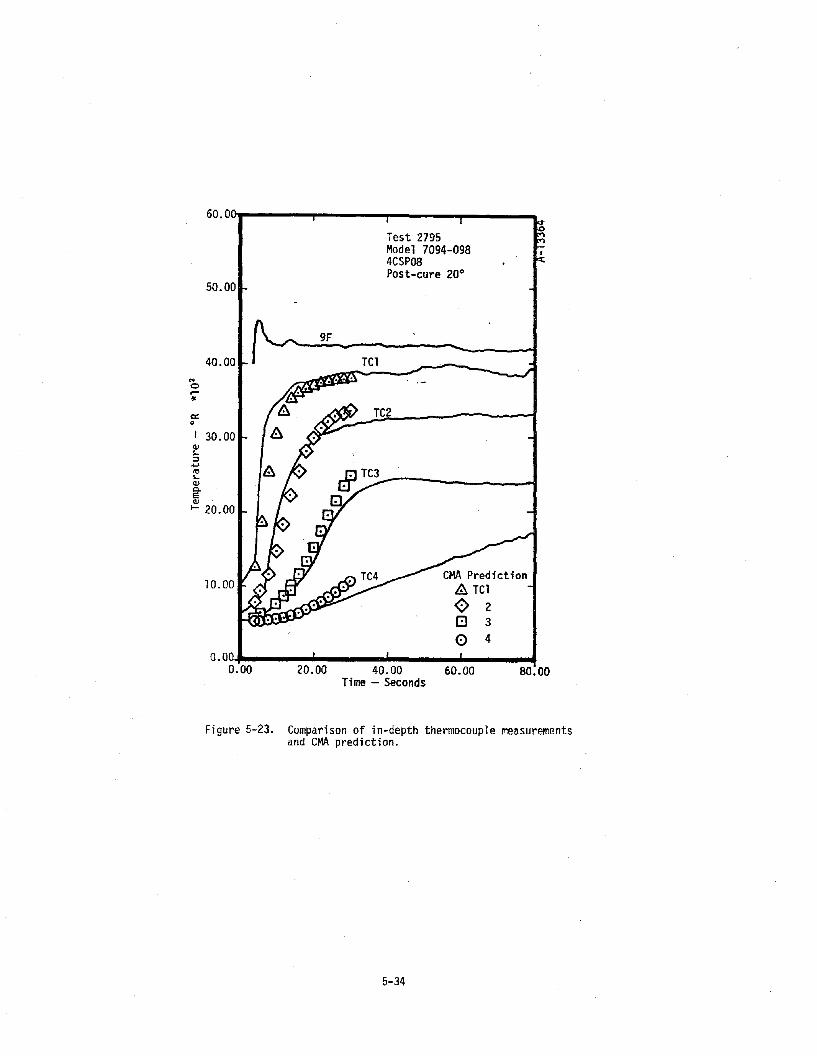
60. 010y0__-""T"---""T"---""---~
Test 2795Model 7094-0984CSP08Post-cure 200
50.00
9F
40.00...o:;a:o
I 30.00CIl~~...,'"~CIl0ECIlI- 20.00
10.00
TCl
CMA Prediction&. TCl~ 28 3
o 4
80.0020.00 40.00 60.00Time - Seconds
0.00.... .... .... ... ....
0.00
Figure 5-23. Comparison of in-depth thermocouple measurementsand CMA prediction.
5-34

60.0D-r---..,..---..,..---..,..----.
50.00
Test 2794Model 7084-097FM5790InstrumentPost-cure 90°
40.00
C1I30.00
s... TC3::s..../ISs...C1Ic.EC1II-
20.00
CMA Prediction
ATCl
~ 210.00 G 3
0 4
0.000.00 20.00 40.00 60.00 80.00
Time - Seconds
Figure 5-24. Comparison of in-depth thermocouple measurementsand CMA prediction.
0::o
..o.-
5-35

10.00
60.00
Test 2787 In<0
Model 7084-093 MM
FM5790 ...I
Post-cure 200 <50.00
9F
40.00..0.- AAA&c:c: AI!:J.A0
30.00 TCl<IISo::l...'"So<IID-e<II.... 20.00
CMA Prediction8 TCl'0 28 3o 4
O.oO.~~-~~~-~~~_~~~_-!"'!'I10.00 20.00 40.00 60.00 80.00
Time - Seconds
Figure 5-25. Comparison of in-depth thermocouple measurementsand CMA prediction.
5-36

0.0" virgin
4CSP08Pos t-cure 90°7084-090
ofr-..""M....J ..w-........~-'---L
MXG-1033FPost-cure 90°7084-091
0.0" virgin
MXC-313PP~st-cure 90°7004-092
f1.0" 0.0" virgin
FM5790Post-cure 20° I7084-093 --L'g 0.53"
1.0" --r-*-
virgin
MXC-313PPost-cure 20°
lW]7084.094-±.1.0" .--.-
-*-
virgin·
MXG-l033FPost-cure 20°7084-095 --*-T~ a.54"1.0" -,-
~
virgin
4K9502Post-cure 90°7084-096
t~J virgin
FM5790Post-cure 90°7084-097
~·a~ virgin
4CSP08Post-cure 20° l7084-098 ---l.-
'~. 0.5.0
11
1.0" t-*-
virgin
4K9502Post-cure 20°7084-099
0.0" virgin
-40"fFigure 5-26. Char layer profiles for char conductivity test samples.
5-37

<.T1
I W (Xl
TABL
E5-
7.TH
ERMA
LAN
DPH
YSIC
ALPR
OPER
TIES
OFPI
TCH
MAT
CARB
ONPH
ENOL
IC
Vir
gin
Mat
eria
lC
har
Nom
inal
Res
inR
ein-
The
rmal
Co
nd
uct
ivit
yT
herm
alC
on
du
ctiv
ity
Nom
inal
Res
inH
eat
of
forc
emen
tF
ail
Mat
eria
lD
ensi
tyM
ass
For
mat
ion
Ele
men
tal
Ele
men
tal
Tem
pera
ture
Sp
ecif
icx1
0'(B
tu/f
t-se
c-°R
)S
pec
ific
x10'
(Btu
/ft-
sec-
°R)
Form
ula
Tem
pera
ture
Em
issi
vit
yE
mis
siv
ity
Fra
ctio
nFo
nnu1
aH
eat
0090
0H
eat
00
900
(lb
/ft'
)(B
tull
bm)
(Ph
eno
lic)
(OR
)(O
R)
(Btu
/1bm
-OR)
layu
pla
yup
(Btu
llbm
-OR
)la
yup
layu
p
Pit
chM
at81
.570
0.17
2-4
87
.35
C 6H 6OC
~53
00
.20
01
.05
2.2
00
.85
0.21
02
.00
40.0
00
.85
Carb
onPh
enol
ic80
00
.32
01
.12
2.6
0-
2.0
04
0.0
0
1000
0.4
00
1.16
2.8
00
.43
02
.00
40
.00
4CSP
0812
000
.46
01.
222.
91-
2.0
040
.00
1400
0.5
00
1.2
5,2
.95
0.4
70
2.0
04
0.0
0
2000
0.48
42
.15
39
.40
3000
0.49
33
.10
36
.10
4000
0.49
84
.25
30
.50
5000
0.50
05
.75
23.2
0
a)T
hede
com
posi
tion
kin
etic
con
stan
tsfo
rp
hen
oli
cre
sin
are
tab
ula
ted
belo
w.
Rea
ctio
nPO
iP
riSi
'l>i
Eai
/Rr
i(l
bm
/ft'
)(l
bm
/ft'
)(s
ec-'
)(O
R)
11.
8965
00.
7771
50.
9127
355
22.1
7
279
.673
567
.499
47.
791
O.9
6349
1300
5.18
1.0
3-
--
--
b)T
hefo
llo
win
geq
uat
ion
issu
gg
este
dfo
rla
yup
ang
les
oth
erth
an0
0an
d90
0
{.(k
900
)}
k a=
k oo
1+
l<Qo""
"-1
sin
a
whe
ree
isth
ela
yup
ang
lere
fere
nce
dto
ata
ng
ent
toth
esu
rfac
e.
c}T
heco
nd
uct
ivit
yis
9ive
nby
k=
110kp
(T)
+(l
-x
)kc(
T)
whe
rex
isth
ev
irg
inm
ater
ial
mas
sfr
acti
on
,an
dk
and
k car
eth
ev
irg
inm
ater
ial
and
char
con
du
ctiv
ity
,re
spec
tiv
ely
.p

t.T1
I W \0
TABL
E5-
8.TH
ERM
ALAN
DPH
YSIC
ALPR
OPER
TIES
OFHY
BRID
PITC
HM
AT/R
AYON
FABR
ICPH
ENOL
IC
Vir
gin
Mat
eria
lC
har
Nom
inal
Res
inR
ein-
The
rma1
Con
duct
ivit
yT
herm
alC
on
du
ctiv
ity
,N
omin
alR
esin
Hea
to
ffo
rcem
ent
Fai
li
Mat
eria
lD
ensi
tyM
ass
For
mat
ion
Ele
men
tal
Ele
men
tal
Tem
pera
ture
Sp
ecif
icx
10
'(B
tu/f
t-se
C-°
R)
Sp
ecif
icx
lO'
(Btu
/ft-
seC
-°R
)I
Form
ula
Tem
pera
ture
Em
issi
vit
yE
mis
siv
ity
Fra
ctio
nFo
rmul
aH
eat
0°90
·H
eat
0°90
°(l
b/f
t')
(Btu
/lbm
)(P
hen
oli
c)(O
R)
(OR
)(B
tu/l
bm-O
R)
layu
pla
yup
(Btu
llbm
-OR
)la
yup
layu
p
Hyb
rid
Pit
ch93
.510
0.19
2-4
76.5
2C 6H 6O
C-
530
0.16
01.
032.
200
.85
0.2
10
0.3
014
.00
0.85
Mat
/Ray
on80
00.
360
1.2
32.
62-
Fab
ric
Phen
olic
1000
0.42
01
.30
2.75
0.4
30
FM57
9012
002.
77-
1600
0.4
70
2000
0.48
4
3000
0.49
3
4000
0.49
80
.40
13.7
5
5000
0.5
00
0.7
01
1.6
0-
a)Th
ede
com
posi
tion
kin
etic
con
stan
tsfo
rph
enol
icre
sin
are
tab
ula
ted
belo
w.
Rea
ctio
nPO
iP
riB i
1/Ji
Ea/
Rr
i(l
bm
/ft'
)(l
bm
/ft'
)(s
ec-'
)(O
R)
12.
375
04
.80.
358
7787
.6
291
.135
75.5
603.
5712
x1
0·
2.25
927
825.
01
.0
3-
--
--
'---
b)Th
efo
llow
ing
equ
atio
nis
sugg
este
dfo
rla
yup
ang
les
oth
erth
an0°
and
90°
k e=
koo{
l+(~
-l)s
ine}
whe
ree
isth
ela
yup
ang
lere
fere
nce
dto
ata
ng
ent
toth
esu
rfac
e.
c)Th
eco
nd
uct
ivit
yis
give
nby
k=
'xkp
(T)
+(1
-x)
kc(T
)
whe
rex
isth
ev
irg
inm
ater
ial
mas
sfr
acti
on
,an
dk p
and
k car
eth
ev
irg
inm
ater
ial
and
char
con
du
ctiv
ity
,re
spec
tiv
ely
.

U1 I ..,. o
TABL
E5-
9.TH
ERM
ALAN
DPH
YSIC
ALPR
OPER
TIES
OFPI
TCH
MAT
MOL
DING
COMP
OUND
Vir
gin
Mat
eria
lC
har
Nom
inal
Res
inR
ein-
The
rmal
Co
nd
uct
ivit
yT
herm
alC
on
du
ctiv
ity
Mat
eria
lN
omin
alR
esin
Hea
to
fE
lem
enta
lfo
rcem
ent
Fai
lx1
0"(B
tu/f
t-se
c-O
R)
x1
0'
(Btu
/ft-
sec-
OR
)D
ensi
tyM
ass
For
mat
ion
Form
ula
Ele
men
tal
Tem
pera
ture
Tem
pera
ture
Sp
ecif
icE
mis
siv
ity
Sp
ecif
icE
mis
siv
ity
Fra
ctio
nFo
rmul
aH
eat
0°90
°H
eat
0°90
°(l
b/f
t')
(Btu
/1bm
)(P
hen
oli
c)(O
R)
(OR
)(B
tu/1
bm-O
R)
layu
pla
yup
(Btu
llbm
-OR
)la
yup
layu
p
Pit
chM
at88
.417
0.19
0-4
33
.20
C 6H 6OC
-53
00
.16
01
.30
2.1
00
.85
0.2
10
3.6
511
.25
0.8
5[M
oldi
ng80
00
.36
01
.50
2.6
0-
Com
poun
d10
000
.42
01
.50
2.72
0.4
30
.M
XC3
13P
1200
-14
000.
470
2000
0.48
4
3000
0.49
34
.00
12.0
0
4000
0.49
85
.00
13
.90
5000
0.5
00
6.7
01
6.7
5
a)T
hede
com
posi
tion
kin
etic
con
stan
tsfo
rp
hen
oli
cre
sin
are
tab
ula
ted
belo
w.
Rea
ctio
nPO
iP
riB i
1/Ii
Eai
/Rr
i(l
bm
/ft'
)(l
bm
/ft'
)(s
ec')
(OR
)
12.
4756
016
4.46
42.
5591
8302
.88
28.
5764
04.
884
x1
0'
1.22
6535
541.
800
.5
316
5.78
1814
3.23
561.
7000
7x
10
"6.
9232
6487
6.00
b)T
hefo
llo
win
geq
uat
ion
issu
gg
este
dfo
rla
yup
ang
les
oth
erth
an0°
and
90°
k e=
koo{
l+(~
~~O
-l)
sin
e}
whe
ree
isth
ela
yup
angl
ere
fere
nce
dto
ata
ng
ent
toth
esu
rfac
e.
c)T
heco
nd
uct
ivit
yis
give
nby
k=
xkp
(T)
+(1
-x)
kc(T
)
whe
rex
isth
ev
irg
inm
ater
ial
mas
sfr
acti
on
,an
dk p
and
k car
eth
ev
irg
inm
ater
ial
and
char
con
du
ctiv
ity
,re
spec
tiv
ely
.

U1 I :::
TABL
E5-
10.
THER
MAL
AND
PHYS
ICAL
PROP
ERTI
ESOF
PITC
HFA
BRIC
PHEN
OLIC
Vir
gin
Mat
eria
lC
har
Nom
inal
Res
inR
ein-
The
rma1
Con
duct
i vit
yT
herm
a1C
ondu
ctiv
ity
Nom
inal
Res
inH
eat
of
forc
emen
tF
ail
Mat
eria
lD
ensi
tyM
ass
For
mat
ion
E1em
enta
1E
lem
enta
lT
empe
ratu
reS
pec
ific
x1
0'
(Btu
/ft-
sec-
OR
)S
pec
ific
x1
0'
(Btu
/ft-
sec-o
R)
Fra
ctio
nFo
rmu1
aFo
rmu1
aT
empe
ratu
reH
eat
Em
issi
vit
yH
eat
Em
issi
vit
y0°
90°
0°90
°(l
b/f
t')
(Btu
/1bm
)(P
hen
oli
c)(O
R)
(OR)
(Btu
llbm
-OR
)la
yup
layu
p(B
tull
bm-O
R)
layu
pla
yup
I-
Pit
chF
abri
c10
2.26
00
.11
9-3
79
.05
C 6H 6OC
-53
00.
120
1.3
02
.90
0.8
50
.21
01
.60
18
.75
0.8
5P
heno
lic
800
0.3
20
1.4
52.
94-
MX
G10
33F
1000
0.3
80
1.5
03
.24
0.4
30
1200
0.43
01
.50
3.43
-14
000
.44
03.
450
.47
0
2000
0.48
4
3000
0.4
93
17.2
5
4000
0.49
81
2.3
0
5000
0.50
01
.20
7.2
0----
a)T
hede
com
posi
tion
kin
etic
con
stan
tsfo
rp
hen
oli
cre
sin
are
tab
ula
ted
belo
w.
Rea
ctio
nPO
iP
riB i
'l>i
Ea/
Rr
i(l
bm
/ft'
)(l
bm
/ft'
)(s
ec')
(OR
)
11.
0226
a6.
4977
x1
0'
0.83
812
095.
02
101.
2374
90.3
949
2.09
904
xla
'2.
667
2337
2.a
1.0
3-
--
--
bl
The
foll
ow
ing
equ
atio
nis
sug
ges
ted
for
layu
pan
gle
so
ther
than
O~an
d9
0.
{(
k900
).
}k e
=ko
o1
+~
-1
S1
0e
whe
ree
isth
e1,
ayup
ang
lere
fere
nce
dto
atM
gen
tto
the
surf
ace.
clT
heco
nd
uct
ivit
yis
give
nby
k=
xkp
(T)
+(1
-x)
kc(T
)
whe
rex
isth
ev
irg
inm
ater
ial
mas
sfr
acti
on
.an
dk p
and
k car
eth
ev
irg
inm
ater
ial
and
char
con
du
ctiv
ity
.re
spec
tiv
ely
.

U1 I .j
:>N
TABL
E5-
11.
THER
MAL
AND
PHYS
ICAL
PROP
ERTI
ESOF
CANV
ASPH
ENOL
IC
Vir
gin
Mat
eria
lC
har
Nom
ina
1R
esin
Rei
n-T
herm
a1
Con
duct
ivit
yT
herm
a1
Con
duct
ivit
yN
om;n
a1
Res
;nH
eat
of
forc
emen
tFa
i1M
ater
ial
Den
sity
Mas
sF
orm
atio
nE
lem
enta
lEl
emen
ta1
Tem
pera
ture
Sp
ecif
icx
lD'
(Btu
/ft-
sec·
oR
)S
pec
ific
xl0
'(B
tu/f
t-se
CO
R)
For
mul
aT
empe
ratu
\"e
Emis
siv
ity
Em
issi
vit
yF
ract
ion
Form
ula
Hea
t0°
,90°
Hea
t0°
90°
(lb
/ft'
)(B
tul1
bm)
(Phe
noli
c)
(OR
)(O
R)
(Btu
/1bm
-OR
)la
yu
pla
yu
p(B
tu/l
bm-O
R)
layu
pla
yu
p
Can
vas
Phe
nol
ic8
8.2
88
0.7
10
-19
44
.88
C 6H 6OC 6H
lOO 5
-53
00
.36
00
.86
1.1
70
.85
0.2
10
2.5
02
.50
0.8
5.
800
0.4
40
0.9
0-
4K95
0210
000.
500
0.9
20
.43
0
1200
0.54
00
.93
-14
000
.47
0
2000
0.4
84
5.0
05
.00
3000
0.4
93
12
.50
12
.50
4000
0.4
98
19
.75
19
.75
5000
0.5
00
28
.50
28
.50
a)T
hed
eco
mp
osi
tio
nk
ineti
cco
nst
ants
for
ph
eno
lic
resi
nar
eta
bu
late
dbe
low
.
Rea
ctio
nPO
iP
riB
iW
iE
a;lR
ri
(lb
m/f
t')
(lb
m/f
t')
(sec'
)(O
R)
16
.62
20
5.92
85x
10
'1.
091
1009
6.0
28B
.906
02.
3929
5x
10
"1.
317
3560
2.0
0.5
38
1.0
48
51.2
062.
3755
8x
10
'3.
101
2822
5.0
b)T
hefo
llo
win
geq
uat
ion
issu
gg
este
dfo
rla
yu
pan
gle
so
ther
than
0°an
dgo
o
k e=
koo{
l+(~
~~O
-l)s
ine}
whe
ree
isth
ela
yup
ang
lere
fere
nce
dto
ata
ng
ent
toth
esu
rfac
e.
c)T
heco
nd
uct
ivit
yis
giv
enby
k=
xkp
(T)
+(l
-x
)kc(
T)
whe
rex
isth
ev
irg
inm
ater
ial
mas
sfr
acti
on
.an
dk p
and
k car
eth
ev
irg
inm
ater
ial
and
char
con
du
ctiv
ity
,re
specti
vely
.

SECTION 6
CONCLUSIONS
In summary, the following conclusions can be extracted from this study:
• With the exception of molding compounds and Kureha fabric, all carbon phenolics perform
equal to or better than MX4926 in the APG.
• With the exception of hybrid materials the performance of a particular generic class was
not especially dependent upon the material supplier.
• Higher mass losses in the 90° orientation are due to thicker char formations (higher con
ductivities).
• Kynol materials had satisfactory thermal performances in the APG, but they are not really
low cost materials. However, these materials may be considered as good alternate materials.
• Pitch carbon mat materials have a combination of good performance and low cost.
• There was a large variance in residual volatile measurements but no obvious correlation
between this and ablation performance was found. However, post-cured materials generally
performed better than as received materials.
• Data required for thermal performance predictions were determined for thermal conducti
vity (both 0° and 90° orientations), specific heat, density, pyrolysis kinetics, heat of
formation, and pyrolysis gas elemental composition. These data will subsequently be used
as inputs to the Aerotherm computer codes (ACE and CMA).
6-1

REFERENCES
1. Moyer, C. B. and Rindal, R. A.: "An Analyses of the Coupled Chemically Reacting Boundary Layerand Charring Ablator, Part II Finite Difference Solution for the In-Depth Response of CharringMaterials Considering Surface Chemical and Energy Balances," NASA CR-1061 (Aerotherm FinalReport 66-7, Part II), June 1968.
2. Schaefer, J. W. and Dahm, T. J.: "Studies of Nozzle Ablative Material Performance for LargeSolid Boosters," NASA CR-72080 (Aerotherm Report No. 66-2), December 15, 1966.
3. Baker, D. L., Wool, M. R., and Schaefer, J. W.: "A Dynamic Technique for Determining theThermal Conductivity of Charring Materials," Paper presented at the Eighth Conference on ThermalConductivity, October 7-11, 1968, Thermophysical Properties Research Center, West Lafayette,Indiana.
4. McCuen, P. A., Schaefer, J. W., Lundberg, R. E., and Kendall, R. M.: "A Study of SolidPropellant Rocket Motor Exposed Materials Behavior," Report No. AFRPL-TR-65-33 (Vidya ReportNo. 149), February 26, 1965.
5. Schaefer, J. W., et al.: "Studies of Ablative Material Performance for Solid Rocket NozzleApplication," NASA CR-72429 (Aerotherm Report No. 68-30), March 1, 1968.
R-l

APPENDIX A
RESIDUAL VOLATILE MEASUREMENTS
Coded samples of each screening test material were sent to Hexcel Corporation for a determin
ation of the residual volatile concentrations. These tests were performed in an attempt to resolve
the anomalous arc plasma jet performance of MX4926 in the Series tests. In these screening tests,
MX4926 exhibited severe delamination when convectively heated with the fabric plys parallel to the flow
direction. This delamination was of special concern since all other materials exhibited little or
no delamination problems. The residual measurement was one of two steps being taken to determine
the reasons for this delamination.
The residual tests were conducted by crushing appropriate size samples which were then des
iccated for 48 hours and weighed. These dried samples were heated at 325°F for 4 hours, removed
from the oven and desiccated for an additional 3 hours and weighed again. The percentage weight
loss was defined as the percent residual volatiles content. In some cases, two measurements were
made on the same material (but not necessarily the same physical block) to determine consistency.
Since the cure size may influence the magnitude of the residuals the approximate dimensions of the
as-received materials are shown along with the volatiles content in Table A-l. For cases where two
samples were measured the block sizes of each sample, if different, are also shown.
From Table A-l it can be seen that the measurement repeatability was very good when samples
were taken from the same size blocks. However, there is some dependence on block size as seen in
sample numbers 2, 5, 12, and 14. The Fiberite materials showed consistently higher volatile contents
for 2" diameter samples than for flat blocks (e.g., 4 x 4 x 1-1/2). The reverse is true for the
Hexcel material although only 1 material was tested redundantly.
The residuals content of the MX4926 was the lowest of all materials tested. This measured
value of 0.56 percent may be compared with a value of 1.1 percent as measured by Fiberite. This
difference is probably due to measurement techniques since there is no industry-wide accepted standard
for residual volatiles measured techniques. The significance of the reported measurements is that
all materials were measured under identical conditions and can therefore be ranked in a relative
A-l

TABLE A-1. SCREENING MATERIAL RESIDUAL VOLATILE MEASUREMENTS
Number Material Supplier Designation As Received %ResidualDimensions* Volatiles
1 Pitch Mat/Phenolic USP Fr~5782BG 5-1/2 x 5-1/2 x 3/8 2.05
2 Pitch Mat/Phenolic Fiberite MX4929 4 x 4 x 1-1/2 1.15/1.40
3 Pitch Mat/Phenolic Ferro ACX-C86PM 2-1/2 x 2-11/16 x 1-7/8 1. 38/1. 39
4 Hybrid Hexcel 4CSP08/4C1008 2-1/8 x 1-3/16 x 1-5/16 1.49/1.455 Hybrid Fiberite MX4928 20 x 1-3/4 1. 97/1.446 Hybrid USP FM5790 6 x 6 x 1-1/4 2.81
7 Kyno1/Phenolic Ferro ACX-CPH -4x4x3 1. 45/1. 47
8 Kyno1/Pheno1 i c USP XFM5795 6 x 6 x 1-1/4 5.41
9 Kureha/Phenolic Ferro ACXCB6K 2-1/2 x 2-11/16 x 1-7/16 4.08/4.0010 Molding Compound USP FM5782MC 20 x 1-3/4 1. 7611 Molding Compound Fiberite MXC313P 20 x 1-3/4 1.0812 Molding Compound Hexcel 4CSP08MC 30 x 1-1/2 1. 44/1. 69
2-3/8 x 1-3/8 x 1-3/8
13 Molding Compound Ferro ACX-CB6PMC 4 x 4 x 2 2.3314 Sil i ca/Pheno1i c Fiberite MX-260D 20 x 1-7/8 4.19/1.23
4 x 4 x 1-1/215 Sil ica/Pheno1 ic Ferro CA/2221/96 1-9/16 x 2-3/8 x 1-3/4 2.22
16 Sil ica/Pheno1 ic Fiberite MXSE-55 4x4x1-1/4 1.8317 Canvas/Phenolic Hexce1 4K9502 4 x 4 x 1 4.2618 Canvas/Phenolic Fiberite MXKF-418 4 x 4 x 1-1/4 4.1219 Canvas/Phenolic Fiberite MX4926 20 x 1-3/4 0.56*First 2 dimensions define plane of fabric or mat layup. Cylindrical samples have layup
perpendicular to axis.
A-2

sense. Since the residual's content of MX4926 was lower than the other materials, the delamination
problem cannot be attributed to a high volatile content. Since there is no rationale for relating
delaminations to low volatiles content, it is concluded that volatiles evolution during APG testing
did not cause the observed delaminations.
A-3