actuarial report fountaingate gardens · january 30, 2017 mr. patrick donnellan chief financial...
TRANSCRIPT

ACTUARIAL REPORT FOR
FOUNTAINGATE GARDENS BASED ON JULY 1, 2019, OPENING DATE
January 30, 2017
400 E. Red Bridge Road, Suite 215
Kansas City, Missouri 64131 816.943.6430
www.avpowell.com

January 30, 2017 Mr. Patrick Donnellan Chief Financial Officer Gurwin Independent Housing, Inc. 68 Hauppauge Road Commack, New York 11725 Dear Mr. Donnellan: A.V. Powell & Associates LLC has prepared an actuarial report on Fountaingate Gardens based on move-ins beginning July 1, 2019. This report has been prepared for the following purposes:
1. To estimate the level of reserves needed to cover the obligations associated with residents upon fill-up of the community
2. To evaluate the proposed fee structure for new entrants 3. To assess the ability of Fountaingate Gardens to meet cash requirements 4. To estimate the level of reserves needed to cover the obligations associated with
contractholders based on the requirements of New York Insurance Code, Part 350, Regulation 140 (“NYR 140”)
Your attention is called to the reliance, limitations, and cautionary notes set forth in the report, since they describe the restrictions on the use of the report and the reliance that A.V. Powell & Associates LLC placed on the source and accuracy of data and assumptions. This report is provided for use by the management of Fountaingate Gardens and the New York Department of Financial Services and may not be distributed to other parties without the express written consent of A.V. Powell & Associates LLC. Thank you for allowing us to perform this analysis on your behalf. We are available to answer any questions about our report. BY:
AMY M. LAMPO, MAAA, ASA
FOR A.V. POWELL & ASSOCIATES LLC
Providing actuarial and financial projections to organizations serving senior populations 400 E. Red Bridge Road, Suite 215 Kansas City, MO 64131-4030 404.845.0360 phone X265
OTHER OFFICES: Atlanta, GA Eureka, MO Virginia Beach, VA

TABLE OF CONTENTS Section Page
EXECUTIVE SUMMARY ..............................................................................................................1 Population Projection ..........................................................................................................1 Actuarial Valuation .............................................................................................................3 New Entrant Pricing ............................................................................................................4 Cash Flow Projection ..........................................................................................................5 Funding of NYR 140 Retrospective and Prospective Reserve Liabilities ..........................6 Actuarial Opinion ................................................................................................................6
BASIS OF EVALUATION .............................................................................................................8 Community Description .......................................................................................................8 Contract Definition ..............................................................................................................8 Actuarial and Demographic Assumptions ...........................................................................9 Occupancy Assumptions ......................................................................................................9 Financial Assumptions .........................................................................................................9 Economic Assumptions .....................................................................................................10 Methodology ......................................................................................................................11
EXPLANATION OF REPORT TABLES ....................................................................................12
RELIANCE, LIMITATIONS AND CAUTIONARY NOTES .....................................................16 Use of Report .....................................................................................................................17 Variation between Projections and Actual Results ............................................................17 Actuarial Assumptions and Need for Monitoring and Updates .........................................18 AVP’s Model .....................................................................................................................18

- 1 -
EXECUTIVE SUMMARY The actuarial report on Fountaingate Gardens is based on move-ins beginning on July 1, 2019. The
purpose of the actuarial study is to assess the long-term financial condition of Fountaingate Gardens.
Due to the long-term nature of CCRC contracts and uncertainties regarding health care and refund
guarantees, sound financial management requires integration of actuarial methods into CCRC
financial projections. It is our opinion that the financial condition of Fountaingate Gardens will meet
the New York funding requirements in the year that stabilized occupancy is achieved.
The actuarial analysis performed by A.V. Powell & Associates LLC (“AVP”) includes the
following:
A population projection of contractholder movements and independent living turnover
An actuarial valuation of reserve adequacy for residents after fill-up
An actuarial pricing analysis of fees charged to new entrants
A cash flow projection of cash sources and uses
A NYR 140 reserve liability projection compared to assets
These projections, evaluated together, provide a sound basis for determining whether the CCRC
contracts are priced adequately. The actuarial valuation, new entrant pricing analysis, and cash flow
projection are the three tests set forth by the American Academy of Actuaries for evaluating the
actuarial condition of a CCRC, in the Actuarial Standards of Practice No. 3 (“ASOP#3”). In
addition, we have calculated the reserve requirements pursuant to the methodology prescribed by
NYR 140.
Population Projection (Tables 2.x)
The population projection shows expected independent living turnover and assisted living and
nursing care utilization by contractholders for the next 20 years. Contractholders are defined as
residents who entered the community in the independent living level of care. The population
projection is based on a 36-month fill-up schedule with independent living occupancy stabilizing at
165 units by June 30, 2022.

- 2 -
Independent Living Turnover
0
10
20
30
2020 2021 2022 2023 2024 2025 2026 2027 2028 2029 2030
Likely Minimum Average Likely Maximum
The population projection
indicates that independent living
turnover is expected to average
about 14 units per year after fill-
up. Due to potential random
variations in experience, we
estimate that the 90th confidence
interval for independent living
turnover is 9 units per year to 20
units per year.
The population projection indicates that Fountaingate Gardens’ residents will need 35 assisted living
beds and 35 nursing care beds per year by the end of the projection period. Residents on the life care
agreement are projected to
annually utilize 17 beds in
assisted living and 17 beds in
nursing care. In addition, the
covered days provided to
residents on the continuing
care agreement are projected
to be about 1.5 beds on
average at the end of the
projection period. The
remainder of the projected
health care utilization will be self-pay for the continuing care residents.
The health center utilization projections are reasonable based upon the historical practices of other
similar CCRCs around the country. Health center utilization can be influenced by several factors:
contract provisions and initial health screening criteria
management philosophy regarding aging-in-place
number and acuity mix of health care beds
availability of home care services and private duty nurses
Health Center Usage by Contractholders
0
25
50
75
2020 2021 2022 2023 2024 2025 2026 2027 2028 2029 2030
AL NC

- 3 -
Therefore, if transfer policies, health care protocols, or medical treatments change in the future,
actual utilization could be different than projected.
Actuarial Valuation (Table 4.1)
Timely actuarial valuations provide an early warning of deficiencies in pricing policies, alerting
management to the potential of a financial crisis. The purpose of the actuarial valuation is to
determine whether Fountaingate Gardens has adequate reserves to meet its contractual obligation to
residents as of the study date. Actuarial reserves should be sufficient to offset the difference between
future revenues and future expenses. Liquid assets and non-liquid assets, such as the actuarial value
of fixed assets, are considered toward the funding of actuarial reserves.
The actuarial valuation for Fountaingate Gardens is projected as of June 30, 2022, which is the first
fiscal year end after full occupancy is achieved.
The methodology used for this calculation, as well as the new entrant pricing analysis in the
following section, is different from that prescribed by NYR 140. This methodology has been
promulgated by the American Academy of Actuaries in their ASOP#3 for CCRCs and is used to
prepare actuarial studies in every other state. We provide this information as a point of reference.
The projected funded status for Fountaingate Gardens as of June 30, 2022, is 103.0%. The funded
status represents the portion of
future expenses covered by
future monthly fees and
reserves. A funded status of
100% means the community is
fully funded. A funded status of
at least 105% is desirable to
assure an appropriate surplus to
protect against unforeseen
fluctuations in any of the
underlying assumptions. AVP
has a database of 150 communities with fiscal 2015 results. The median funded status in the FYE
2014 AVP database is 104.4%. The projected funded status for Fountaingate Gardens places it in the
second quartile (between the 25th and 50th percentiles) of CCRCs in our database.
Actuarial Reserves
104%
22%
103%
47%
0%
25%
50%
75%
100%
125%
Funded Status Liquid Reserve Ratio
FG AVP 50th

- 4 -
New Entrant Surplus: Typical Entrant by Contract Type
10%13%14%
18%16%
0%
10%
20%
80% Ref CC 50% Ref CC 80% Ref LC 50% Ref LC AVP Median
Another statistic related to the actuarial valuation is the liquid reserve ratio (LRR). The LRR
measures the degree by which actuarial liabilities are covered by liquid assets. It is neither necessary
nor desirable that a community show a 100% LRR. Often, the LRR will be lower in the earlier
operating years of a community. It is expected to increase over time as the physical plant ages. The
median LRR in the FYE 2015 AVP database is 47.3%. The projected LRR for Fountaingate
Gardens as of June 30, 2022 is 22.3%, which places it in the bottom quartile (below the 25th
percentile) of CCRCs in our database.
New Entrant Pricing (Table 5.x)
The results of the new entrant
pricing analysis indicate whether
the entrance fee and monthly fees
to be charged to new entrants are
expected to cover the cost of care
associated with the contractual
obligations. The pricing analysis
shows surpluses for the proposed fee structures for each contract type offered by Fountaingate
Gardens, indicating that entrance fees plus monthly fees cover the costs of care. The FYE 2015 AVP
database shows a median surplus of 10.3%. Fountaingate Gardens is in the third quartile (between
the 50th and 75th percentiles) of CCRCs in our database.
The pricing analysis is projected to fiscal year 2023, after stabilized occupancy is achieved. The
pricing analysis for the continuing care contracts reflects the contracts terminating after 60 days
of care are utilized; neither the expense nor the revenue for time spent in health care after the 60
covered days is included in the pricing analysis.
A review of fee adequacy by unit type shows that larger units yield more of an actuarial surplus than
smaller units, which is typical within the continuing care industry. One explanation for this situation
is that the portion of expenses related to health care is the same regardless of unit type, which means
that a substantial portion of the future liabilities do not change with the size of the independent living
unit, even though the pricing varies by unit size.

- 5 -
The new entrant
pricing analysis also
includes a
comparison of
results for singles
and couples.
Couples generate
lower surpluses than
singles within each
unit type.
Cash Flow Projection (Table 6.1)
The cash flow projection shows future cash sources and uses and provides information for
management to determine whether debt service coverage ratios will be met. Reserves must increase
at an average annual rate at least equal to the inflation rate in order to maintain the balance between
increasing liabilities and revenues.
The cash flow projection shows increasing cash balances after fiscal 2021. The 10-year reserve
increase factor represents the projected growth in liquid
reserves. The median 10-year reserve increase factor in the
FYE 2015 AVP database is 2.37. The cash balances
(liquid reserves) for Fountaingate Gardens are expected to
increase by a factor of 5.73 times over the first 10 years of
operations, which places it in the top quartile (above the
75th percentile) of CCRCs in the AVP database.
This analysis integrates the population projection with
financial information. Each projection year includes the
projected independent living turnover and new entrance fees, projected population movements and
likely health center utilization by contractholders, and the resulting revenues. Offsetting these cash
sources are the expenditures associated with providing services to residents.
The cash flow projection is based on the assumption that 40% of new entrants will select the 50%
refundable life care agreement, 35% the 50% refundable continuing care agreement, 15% the 80%
New Entrant Surplus 50% Refundable Life Care: Selected Unit Types
0%5%
10%15%20%25%30%35%
1 BR Large 2 BR Small 2 BR DenSmall
Villa 2BRMedium
Typical AVP 50th
Single Couple
10-Year Reserve Increase Factor
2.02.53.03.54.04.55.05.56.0
FG AVP 50th

- 6 -
refundable continuing care agreement, and 10% the 80% refundable life care agreement. The cash
flow projection is also based on the assumption that all residents are able to pay the fees charged
without significant subsidies for financial aid.
Funding of NYR 140 Retrospective and Prospective Reserve Liabilities (Tables 7.x and 8.1)
NYR 140 requires that a CCRC: (a) accumulate assets that equal or exceed the greater of the
retrospective and prospective reserve calculations according to a formula specified in Sections
350.2(a)(1) and 350.2(a)(2); and (b) hold liquid assets that exceed certain amounts as specified in
Section 350.6(a). The projections show that the prospective reserve requirement is higher than the
retrospective reserve requirement projected as of June 30, 2022. Fountaingate Gardens is projected
to have sufficient assets to meet the New York funding requirement as of June 30, 2022.
Actuarial Opinion
It is our opinion that the financial condition of Fountaingate Gardens will meet the reserve
funding requirements as of June 30, 2022, as prescribed by NYR 140, provided that future
experience substantially follows the underlying assumptions that are contained in this actuarial
report. The key assumptions are:
a) fill-up to 94% occupancy is achieved within 36 months of opening;
b) increases in monthly fees will match assumed increases in operating expenses;
c) the difference between interest earnings/discount rate and expense inflation (“real rate-of-
return”) is 1.5%;
d) construction and financing costs match management’s projections; and
e) projected accumulated cash balances are all available for the exclusive benefit of
continuing care and life care contractholders and all cash outflows have been reflected in
the report to the best of our knowledge.
AVP believes that the assumptions and projections in this report form a reasonable basis for
evaluating the long-term financial condition of Fountaingate Gardens. We also believe that the
methods employed in developing these calculations are consistent with sound actuarial principles
and practices. Provision has been made for all actuarial liabilities and related statement items
that ought to be recognized, except no assessment has been of potential liabilities for residents’
inability to pay their fees.

- 7 -
In order to monitor the appropriate level of fees required to maintain the long-term financial
solvency of Fountaingate Gardens, we recommend that actuarial studies be conducted regularly.
It should be noted that any number of variations from the underlying assumptions may occur and
such variations could have a material impact on the projections and observations contained herein.

- 8 -
BASIS OF EVALUATION
Community Description
Fountaingate Gardens will have 176 independent living units. Assisted living and nursing care will
be provided at the Fay J. Lindner Residences and Gurwin Jewish Nursing and Rehabilitation Center,
respectively. Table 0.3.1 shows the community unit mix and square footage.
Contract Definition
Residents will be offered the following contracts:
The 80% refundable continuing care contract (Contract 10) provides for 60 lifetime
days of nursing care at no additional charge. For assisted living stays and nursing care stays beyond the 60 covered days, residents will pay 100% of the per diem rates. The refund for death, withdrawal, or permanent transfer to health care is 100% of the entrance fee during the first 90 days of occupancy. After 90 days, the refund for death, withdrawal, or permanent transfer to health care is reduced by a 4% administrative fee plus 2% per month of occupancy, with a minimum refund of 80% of the entrance fee.
The 50% refundable continuing care contract (Contract 11) has the same health care
provisions as Contract 10. The refund for death, withdrawal, or permanent transfer to health care is 100% of the entrance fee during the first 90 days of occupancy. After 90 days, the refund for death, withdrawal, or permanent transfer to health care is reduced by a 4% administrative fee plus 2% per month of occupancy, with a minimum refund of 50% of the entrance fee.
The 80% refundable life care contract (Contract 20) provides for assisted living and
nursing care at no additional charge. A life care entry fee is charged for this plan. The refund for death or withdrawal is 100% of the base plus life care entry fees during the first 90 days of occupancy. After 90 days, upon death or withdrawal, the refund of the base entry fee is reduced by a 4% administrative fee plus 2% per month of occupancy, with a minimum refund of 80%. After 90 days, upon death or withdrawal, the refund of the life care entry fee is reduced by a 4% administrative fee plus 2% per month of occupancy, with no refund of the life care entry fee after 48 months.
The 50% refundable life care contract (Contract 21) provides for assisted living and
nursing care at no additional charge. A life care entry fee is charged for this plan. The refund for death or withdrawal is 100% of the base plus life care entry fees during the first 90 days of occupancy. After 90 days, upon death or withdrawal, the refund of the base entry fee is reduced by a 4% administrative fee plus 2% per month of

- 9 -
occupancy, with a minimum refund of 50%. After 90 days, upon death or withdrawal, the refund of the life care entry fee is reduced by a 4% administrative fee plus 2% per month of occupancy, with no refund of the life care entry fee after 48 months.
Actuarial and Demographic Assumptions
The underlying assumptions are an important component of any actuarial analysis. AVP used
information on Fountaingate Gardens’ contracts, along with AVP’s database of continuing care
retirement communities, to select mortality, morbidity (i.e., temporary and permanent transfers to
health care), move-out, and new entrant assumptions. Mortality and morbidity rates are based on
experience from AVP’s database on CCRC residents since Fountaingate Gardens does not have
historical experience to warrant modifications to the standard assumptions.
New entrant assumptions regarding age and gender distributions and double occupancy rates by unit
type are shown on Table 1.4 and reflect the presales experience of Fountaingate Gardens. The
population projection is based on these assumptions and includes a factor to increase average age at
entry one year every five projection-years to reflect the experience of other CCRCs with increases in
average entry age.
Occupancy Assumptions
The projections in this report are based on occupancy assumptions provided by management and are
shown in Tables 0.3.2 and 0.3.3. Variations in occupancy that result in rates lower than assumed
may have a material impact on the projections. Independent living is assumed to be 93.8% (165
units) occupied within 36 months of opening.
Financial Assumptions
Fountaingate Gardens provided the financial assumptions about operating and capital expenses.
Operating expenses and other revenues, excluding monthly fees, are based on the fiscal years 2020
through 2027 projections. Table 3.5.1 shows total operating expenses for the first 10 years of
operations. Tables 3.6.x show the operating expenses as allocated by level of care, based on
information provided by Fountaingate Gardens. Within each level of care, costs vary by factors that
reflect the unit size, number of residents in the unit, or number of units in that level of care.

- 10 -
Capital expenditures are based on the 2020 through 2027 projections. After 2027, capital spending
was assumed to increase to approximately $3.9 million per year by 2035, after the 15th year of
operations. Capital expenditures from opening and for the next 20 years are shown in Table 3.5.2.1.
Capital expenditures were allocated by level of care based on information provided by Fountaingate
Gardens. Within each level of care, capital expenditures vary by factors that reflect the unit size,
number of residents in the unit, or number of units in that level of care. Actuarial depreciation for the
first 10 years of operations is shown in Table 3.5.2.2. These amounts are derived from the capital
expenditures in Table 3.5.2.1 and the imputed interest rate for capital.
Monthly fees and entrance fees were provided by management and are outlined in Table 0.2.
Entrance fees are assumed to increase 2.5% twice pre-opening. The initial entrants are assumed to be
split 35% on the initial schedule of entrance fees, 40% on the first increase, and 25% on the second
increase. The financial analysis of Fountaingate Gardens has been based on the assumption that
residents will pay the monthly fees that are scheduled. If residents do not have the resources to pay
the assumed level of fees, the potential financial aid requirements could have a material impact on
the projections.
Economic Assumptions
The projections in this report are based on economic assumptions provided by management as listed
in the table below. For 2028 and future years, the expense inflation rate was assumed to be 3.5% and
the interest earnings rate (present value discount rate) was assumed to be 5.0%, with a resulting
spread of 1.5%. If the inflation and interest spread falls below 1.5% for an extended period, the
variance is likely to have a material impact on the projections.
Key Economic Assumptions Value
Inflation Assumptions
Operating expenses 3.5%
Other revenues 3.5%
Capital expenditures 3.5%
Entrance fees 3.0%
Monthly fees
3.5%
Interest Discount Rate 5.0%

- 11 -
Methodology
The methodology used in preparing this report is consistent with guidelines set forth in Actuarial
Standard of Practice No 3. Practices Relating to Continuing Care Retirement Communities. Our
procedures include:
1. Review selection of baseline assumptions with management by analyzing Fountaingate
Gardens’ resident, financial, and economic data and comparing with other CCRCs.
2. Identify the fill-up schedule and apply the actuarial decrement assumptions along with
contract provisions to project monthly fees, refunds, unit occupancy by type, independent
living turnover, health care usage, and other financial data, using a twenty-year open-group
resident population projection.
3. Use a closed-group resident projection based on the projected census as of the valuation date
to calculate the actuarial present value of future monthly fees, refunds, and expenses for the
actuarial valuation.
4. Use a closed-group resident projection for an entrant cohort (a typical set of single and
couple contractholders during a 12-month period) to determine whether the combination of
the entry fee and future monthly fees covers the future costs of care for the cohort.
5. Use the open-group resident projection to indicate whether future cash balances will remain
positive.
6. Interpret and provide observations and recommendations for pricing and/or policy changes
based on the results of projections.
The text and tables in this report summarize the results of this methodology. No other source of
information about the actuarial study is available and all models used to prepare information for this
report are considered proprietary to AVP.
- 12 -
EXPLANATION OF REPORT TABLES
Tables 0.2 and 0.3.x contain the fee and occupancy assumptions used in this analysis.
Table 0.4 summarizes other financial assumptions used in the analysis. Table 0.5 contains age-
and gender-specific probabilities of actuarial decrement assumptions.
Tables 1.3 and 1.4 contain the actuarial assumptions used in the analysis. Table 1.3 shows the
individual life expectancy and health care lifetime for new entrants to Fountaingate Gardens and last
survivor life expectancies. Table 1.4 shows the demographic assumptions for new entrants to
independent living.
The open-group population projections are presented in Tables 2.1, 2.2, 2.3, 2.4, 2.5, 2.13,
2.14, 2.15 and 2.16. Table 2.1 summarizes the key population flow statistics including
independent living turnover and health care usage. Table 2.2 shows the beginning of year
demographic statistics for Fountaingate Gardens’ residents. This table indicates the projected
number of residents in each level of care. Table 2.3 shows the projected movements (deaths and
permanent transfers) by care level for all residents. Table 2.4 shows turnover statistics. Not all
deaths and permanent transfers will result in a unit turnover because of the double occupancy in
some independent living units. Table 2.5 presents projected resident days by level of care.
Table 2.13 shows projected turnover by unit type. Table 2.14 contains move-out and refund
statistics. Table 2.15 projects variations in independent living turnover and health care utilization.
Table 2.16 projects variation in refunds and health care utilization per 100 independent living
residents.
Table 3.5.1 shows the total operating expenses net of other revenues for the next 10 projection
years. Table 3.5.2.1 shows the investment in fixed assets since inception and for the next 20 years.
Table 3.5.2.2 shows the actuarial depreciation, interest on debt, and imputed interest.
Table 3.5.3 shows the complete debt service schedule of principal and interest payments.
Tables 3.6.x show operating expenses, net of other revenues, allocated to each level of care.
Tables 3.7.x show the resulting daily costs of care per person, for each level of care.

- 13 -
Table 4.1 contains the results of the actuarial valuation. The actuarial valuation indicates whether
existing reserves are sufficient to cover the obligations associated with current residents. This
analysis compares the sum of the current assets and the present value of future monthly fees
associated with current residents to the present value of future operating and capital expenses
associated with those residents. If the sum of the net assets plus the present value of monthly fees
exceeds the present value of expenses, Fountaingate Gardens is in an actuarial surplus position and
meets Condition 1 for satisfactory actuarial balance. If the sum does not exceed the present value of
expenses, the deficit indicates the amount of care for current residents to be funded by new entrants
or other sources.
The first component of the actuarial valuation is defined as net assets, which is derived from assets
and liabilities that are found in the Fountaingate Gardens’ balance sheet in accordance with ASOP-3.
The values for fixed assets and long-term debt are adjusted to consider present values. A detailed
documentation of the net asset values is given in Table 4.4.
The second component of the actuarial valuation, actuarial liabilities, is equal to the present value of
future net operating expenses plus actuarial depreciation for fixed assets. The present values are
discounted for interest and survivorship. This liability represents the expected cost of care for current
residents. It is based on the assumption that the community will continue operation and that new
entrants will pay at least their actuarially adequate portion of total costs.
Actuarial assets, the third component, equal the present value of future monthly fees for current
residents based on the assumed annual rate of increase.
The difference between actuarial liabilities and actuarial assets is given in item four. Item five
contains the present value of future refunds for death, move-out, or permanent transfers (if
applicable), which is the actuarial refund liability. The expected refund is based on the average
refund paid out during the year that death, move-out, or permanent transfer occurs and is discounted
for interest.
The actuarial surplus or deficit, item six, equals net assets minus the excess of actuarial liabilities
over actuarial assets plus the actuarial refund liabilities. The funded status, item seven, represents the
portion of actuarial liabilities (operating and capital expenses and refunds) that are covered by
existing assets and actuarial assets (future fees). The actuarial ratio, item eight, represents the portion

- 14 -
of actuarial liabilities covered by assets that can be adjusted for inflation and longevity variations in
experience.
Table 4.4 contains the documentation for the net asset calculation for the actuarial valuation.
Table 4.5 contains the documentation for the initial cash balance used in the cash flow projections.
Tables 5.x contain the results of the actuarial pricing analysis of the fee structure for new entrants.
This analysis compares the present value of future monthly fees (PVMF) plus the entrance fee, net of
the present value of expected refund payments (NEF), to the present value of future operating and
capital expenses (PVFE). If the actuarial assets (future monthly and entrance fees) exceed the
actuarial liabilities (future operating and capital expenses), the fee structure is considered actuarially
adequate and meets Condition 2 for satisfactory actuarial balance. If the actuarial assets are less than
actuarial liabilities, some costs of the current cohort of new entrants will be passed on to future
generations. The new entrant pricing analysis tests adequacy by unit type and for typical single and
couple entrants. The typical entrant analysis is based on a weighting by (a) expected unit turnover;
(b) projected occupied units; and (c) projected double occupancy. The actuarial liability differences
among units are caused by variations in the allocation of operating and capital costs.
Table 6.1 contains cash flow projections for Fountaingate Gardens. Monthly fees for independent
living, assisted living, and nursing care are based on actual rates paid by life care and continuing
care contractholders. Entrance fees from unit turnover are based on the annual turnover shown in
Table 2.4 and fees shown in Table 0.2. Entrance fees from vacant units represent fees associated
with units needed to fill up to the desired occupancy level. Interest income is calculated as the
interest rate times the beginning of year cash balance plus six months’ interest on the change in cash
balance net of interest income.
Debt service interest and principal payments were based on a schedule provided by Fountaingate
Gardens. The initial cash balance was developed based on the projected financial statements as of
June 30, 2019, and is presented in Table 4.5. The debt service ratio is calculated as cash sources less
cash uses, excluding debt service and capital expenditures, divided by debt service. The cash to debt
ratio is calculated as end of year cash balance divided by end of year debt principal.
If positive cash balances are projected with respect to current and future residents for a period of
least 20 years, then the community meets Condition 3 for satisfactory actuarial balance.

- 15 -
Table 7.1 contains the documentation for the retrospective reserve liability used in the reserve
projections. The retrospective reserve liability is an accumulation of:
Entrance fees received less refunds paid plus
Monthly fees received plus revenue from non-residents for services rendered plus
Interest income minus
Operating expenses minus
Capital expenses minus
Interest payments on bonds
Table 7.2 contains the calculation of the prospective reserve liability. The prospective reserve
liability is the present value of future operating expenses plus the present value of depreciation,
imputed interest and interest payments on bonds plus the present value of future refunds minus the
present value of future monthly fees.
Table 7.2 Expanded contains the closed group projection for the projected census as of June 30,
2022.
Table 7.3 contains the calculation of the amount of assets required to fund the minimum liquid
reserves. The required short-term investments to fund the debt reserve fund are equal to the principal
and interest payments due within the next twelve months. The required short-term investments to
fund the operating reserve fund are equal to 35% of the sum of the following:
Taxes and insurance premiums due within the next twelve months
Operating expenses for the next twelve months
Projected refunds for the next twelve months
Table 8.1 is a balance sheet comparison of the prospective and retrospective reserve liabilities to
projected assets. If the assets exceed the reserve liabilities, Fountaingate Gardens is deemed to meet
the test for solvency under New York regulations. If the reserve liabilities exceed the assets,
Fountaingate Gardens is deemed to be impaired and must submit a corrective action plan.

- 16 -
RELIANCE, LIMITATIONS AND CAUTIONARY NOTES
In developing this report, AVP relied on data and information supplied by the management of
Fountaingate Gardens. AVP relied on the general accuracy of this information without independent
verification. However, AVP did review the data for reasonableness based on our knowledge of the
continuing care retirement industry.
Reliance is placed on, but not limited to, the accuracy of the following information:
Information concerning the current and projected design and pricing structure of resident
agreements
Information relating to current and projected levels of occupancy for independent living
Information relating to the number and size of independent living, health center and other
physical structures
Information relating to operating expense adjustments due to increasing occupancy
Information about capital expenditures for initial construction and after opening
Projected financial statements through June 30, 2027
Operating and capital budgets for the years ending June 30, 2020 through June 30, 2027
Information about long-term debt and the sources and uses of new funds
AVP relied on Fountaingate Gardens for the assumed level of occupancy and fees. We are not
experts in the marketing of continuing care contracts. It would be inappropriate for any reader of this
report to place reliance on AVP concerning future occupancy levels and the ability of Fountaingate
Gardens to attract residents who are willing to pay the assumed future fees.

- 17 -
Use of Report
AVP has performed the work assigned and prepared this report in conformity with its intended use
by persons technically competent in the areas addressed and for the stated purpose only. Any
judgment regarding the data contained in the report should be made only after studying the entire
report. Furthermore, members of AVP’s staff are available to explain any item presented in this
report.
This report is provided for the exclusive use of the management and the New York regulators of
Fountaingate Gardens. This limitation is included for the following reasons:
1. The report was prepared for your internal use and assumes a high level of knowledge relative
to the operations of your community, the data used in preparing the report and the external
factors affecting your business. We would not expect a third party to have such knowledge.
2. As stated in the report, we relied on you for certain data without independent verification.
Any other distribution or reference to the report is expressly prohibited without the prior
written consent of AVP.
Variation between Projections and Actual Results
AVP’s estimates and projections in this report were developed in conformity with generally
accepted actuarial principles and practices and were based on AVP’s understanding of Fountaingate
Gardens' current operating environment. AVP’s calculations are projections, not forecasts of future
results. Deviations between projected and actual results are normal and should be expected. Even
without any change in perceived environments and in the parameters used to reflect them, actual
results will vary from those projected due to normal random fluctuations and those variations may be
material.

- 18 -
Actuarial Assumptions and Need for Monitoring and Updates
New entrant assumptions and actuarial assumptions were selected based on data from similar
communities in AVP’s database. Although AVP believes that these assumptions may reflect the
future experience of Fountaingate Gardens, its actuarial position should be carefully monitored.
Future studies of Fountaingate Gardens’ experience may indicate a material deviation from the
actuarial assumptions used in this study. AVP recommends that updates be conducted at least every
two years.
AVP’s Model
AVP believes that the most important value of this analysis is that it provides management with a
credible tool to continually assess the implications of pricing policies. To that end, AVP is willing to
generate additional analyses based on other assumptions that may be selected by management and/or
to provide management with direct access to AVP’s models. AVP is available to further discuss
these options at management's request.

- 19 -
APPENDIX OF REPORT TABLES AND PROJECTIONS

List of Tables (NOTE: THE TABLE LABELING PURPOSELY SKIPS CERTAIN NUMBERS) TABLE 0.2......................................................................... Fee Structure TABLE 0.3.1....................................................................... Unit Capacity TABLE 0.3.2.................................................... Beginning of Year Unit Occupancy TABLE 0.3.3................................................ Average Number of Unit/Beds Occupied TABLE 0.3.4......................................................... Average Number of Residents TABLE 0.4........................................................... Other Financial Assumptions TABLE 0.5....................................................... Actuarial Decrement Assumptions TABLE 1.3..................................................................... Life Expectancies TABLE 1.4............................................................... New Entrant Assumptions TABLE 2.1........................................... Summary of Population Projection Statistics TABLE 2.2....................................... Beginning of Fiscal Year Demographic Statistics TABLE 2.3.......................................................... Resident Movement Statistics TABLE 2.4................................................ Independent Living Turnover Statistics TABLE 2.5........................................................ Resident Days by Level of Care TABLE 2.13................................... Projected Independent Living Turnover by Unit Type TABLE 2.14....................................................... Move-out and Refund Statistics TABLE 2.15....................... Projected Variation in IL Turnover and Health Care Utilization TABLE 2.16................................ Projected Variation in Refunds and Health Care Ratios TABLE 3.5.1.............................................................. Net Operating Expenses TABLE 3.5.2.1.............................................................. Capital Expenditures TABLE 3.5.2.2............................................................ Actuarial Depreciation TABLE 3.5.3............................................................... Debt Service Schedule TABLES 3.6.x............................................. Net Operating Expense by Level of Care TABLES 3.7.x.......................................... Daily Per Capita Expense by Level of Care TABLE 4.1......................................................... Actuarial Valuation Statement TABLE 4.4................................................ Documentation of Net Asset Calculation TABLE 4.5................................................. Documentation of Initial Cash Balance TABLES 5.x......................................................... Analysis of New Entrant Fees TABLE 6.1.................................................................. Cash Flow Projection TABLE 7.1................................................................. Retrospective Reserve TABLE 7.2................................................................... Prospective Reserve TABLE 7.2 Expanded................................................ Expanded Prospective Reserve TABLE 7.3................................................................ Minimum Liquid Reserve TABLE 8.1................................................................. NYR 140 Balance Sheet

Table 0.2
Fountaingate GardensFee Structure as of July 1, 2019
Contract 10 (80% REFUNDABLE MODIFIED)
Monthly FeeUnit Type One Person Second Person --------- ---------- -------------
Initial Advance FeeOne Person Second Person ---------- -------------
INDEPENDENT LIVING:ONE BEDROOM SMALL . . . . . . . . . $ 3,450 $ 850 $ 565,000 $ 26,000ONE BEDROOM LARGE . . . . . . . . . 3,450 850 570,000 26,000ONE BR DEN SMALL . . . . . . . . . 3,880 850 648,000 26,000ONE BR DEN MEDIUM . . . . . . . . . 4,230 850 718,000 26,000ONE BR DEN LARGE . . . . . . . . . 4,540 850 797,000 26,000TWO BEDROOM SMALL . . . . . . . . . 4,230 850 707,000 26,000TWO BEDROOM LARGE . . . . . . . . . 4,500 850 744,000 26,000TWO BEDROOM DEN SMALL . . . . . . . 4,880 850 824,000 26,000TWO BEDROOM DEN LARGE . . . . . . . 5,080 850 852,000 26,000VILLA ONE BR . . . . . . . . . . . 4,140 850 723,000 26,000VILLA ONE BR DEN . . . . . . . . . 4,330 850 771,000 26,000VILLA TWO BR SMALL . . . . . . . . 4,920 850 841,000 26,000VILLA TWO BR MEDIUM . . . . . . . . 5,330 850 928,000 26,000VILLA TWO BR LARGE . . . . . . . . 5,370 850 961,000 26,000VILLA TWO BR DEN . . . . . . . . . 5,630 850 973,000 26,000
PER DIEM RATES
ASSISTED LIVING:ASSISTED LIVING . . . . . . . . . . 202 per day 202 per day
NURSING CARE:NURSING CARE . . . . . . . . . . . 532 per day 532 per day
Entry fees are assumed to increase 2.5% twice before opening. First generation entry fees are assumed to be 35% on the initial schedule, 40% on the 1st increase (2.5% higher than initial), and 25% on the 2nd increase (2.5% + 2.5% higher than initial).

Table 0.2 (continued)
Fountaingate GardensFee Structure as of July 1, 2019
Contract 11 (50% REFUNDABLE MODIFIED)
Monthly FeeUnit Type One Person Second Person --------- ---------- -------------
Initial Advance FeeOne Person Second Person ---------- -------------
INDEPENDENT LIVING:ONE BEDROOM SMALL . . . . . . . . . $ 3,450 $ 850 $ 424,000 $ 20,000ONE BEDROOM LARGE . . . . . . . . . 3,450 850 428,000 20,000ONE BR DEN SMALL . . . . . . . . . 3,880 850 486,000 20,000ONE BR DEN MEDIUM . . . . . . . . . 4,230 850 539,000 20,000ONE BR DEN LARGE . . . . . . . . . 4,540 850 598,000 20,000TWO BEDROOM SMALL . . . . . . . . . 4,230 850 530,000 20,000TWO BEDROOM LARGE . . . . . . . . . 4,500 850 558,000 20,000TWO BEDROOM DEN SMALL . . . . . . . 4,880 850 618,000 20,000TWO BEDROOM DEN LARGE . . . . . . . 5,080 850 639,000 20,000VILLA ONE BR . . . . . . . . . . . 4,140 850 542,000 20,000VILLA ONE BR DEN . . . . . . . . . 4,330 850 578,000 20,000VILLA TWO BR SMALL . . . . . . . . 4,920 850 631,000 20,000VILLA TWO BR MEDIUM . . . . . . . . 5,330 850 696,000 20,000VILLA TWO BR LARGE . . . . . . . . 5,370 850 721,000 20,000VILLA TWO BR DEN . . . . . . . . . 5,630 850 730,000 20,000
PER DIEM RATES
ASSISTED LIVING:ASSISTED LIVING . . . . . . . . . . 202 per day 202 per day
NURSING CARE:NURSING CARE . . . . . . . . . . . 532 per day 532 per day
Entry fees are assumed to increase 2.5% twice before opening. First generation entry fees are assumed to be 35% on the initial schedule, 40% on the 1st increase (2.5% higher than initial), and 25% on the 2nd increase (2.5% + 2.5% higher than initial).

Table 0.2 (continued)
Fountaingate GardensFee Structure as of July 1, 2019
Contract 20 (80% REFUNDABLE LIFECARE)
Monthly FeeUnit Type One Person Second Person --------- ---------- -------------
Initial Advance FeeOne Person Second Person ---------- -------------
INDEPENDENT LIVING:ONE BEDROOM SMALL . . . . . . . . . $ 4,380 $ 1,780 $ 630,000 $ 65,000ONE BEDROOM LARGE . . . . . . . . . 4,380 1,780 635,000 65,000ONE BR DEN SMALL . . . . . . . . . 4,810 1,780 713,000 65,000ONE BR DEN MEDIUM . . . . . . . . . 5,160 1,780 783,000 65,000ONE BR DEN LARGE . . . . . . . . . 5,470 1,780 862,000 65,000TWO BEDROOM SMALL . . . . . . . . . 5,160 1,780 772,000 65,000TWO BEDROOM LARGE . . . . . . . . . 5,430 1,780 809,000 65,000TWO BEDROOM DEN SMALL . . . . . . . 5,810 1,780 889,000 65,000TWO BEDROOM DEN LARGE . . . . . . . 6,010 1,780 917,000 65,000VILLA ONE BR . . . . . . . . . . . 5,070 1,780 788,000 65,000VILLA ONE BR DEN . . . . . . . . . 5,260 1,780 836,000 65,000VILLA TWO BR SMALL . . . . . . . . 5,850 1,780 906,000 65,000VILLA TWO BR MEDIUM . . . . . . . . 6,260 1,780 993,000 65,000VILLA TWO BR LARGE . . . . . . . . 6,300 1,780 1,026,000 65,000VILLA TWO BR DEN . . . . . . . . . 6,560 1,780 1,038,000 65,000
ASSISTED LIVING:ASSISTED LIVING . . . . . . . . . . Pay same fees as ILU
NURSING CARE:NURSING CARE . . . . . . . . . . . Pay same fees as ILU
PER DIEM RATES
ASSISTED LIVING:ASSISTED LIVING . . . . . . . . . . 202 per day 202 per day
NURSING CARE:NURSING CARE . . . . . . . . . . . 532 per day 532 per day
Entry fees are assumed to increase 2.5% twice before opening. First generation entry fees are assumed to be 35% on the initial schedule, 40% on the 1st increase (2.5% higher than initial), and 25% on the 2nd increase (2.5% + 2.5% higher than initial).

Table 0.2 (continued)
Fountaingate GardensFee Structure as of July 1, 2019
Contract 21 (50% REFUNDABLE LIFECARE)
Monthly FeeUnit Type One Person Second Person --------- ---------- -------------
Initial Advance FeeOne Person Second Person ---------- -------------
INDEPENDENT LIVING:ONE BEDROOM SMALL . . . . . . . . . $ 4,380 $ 1,780 $ 489,000 $ 65,000ONE BEDROOM LARGE . . . . . . . . . 4,380 1,780 493,000 65,000ONE BR DEN SMALL . . . . . . . . . 4,810 1,780 551,000 65,000ONE BR DEN MEDIUM . . . . . . . . . 5,160 1,780 604,000 65,000ONE BR DEN LARGE . . . . . . . . . 5,470 1,780 663,000 65,000TWO BEDROOM SMALL . . . . . . . . . 5,160 1,780 595,000 65,000TWO BEDROOM LARGE . . . . . . . . . 5,430 1,780 623,000 65,000TWO BEDROOM DEN SMALL . . . . . . . 5,810 1,780 683,000 65,000TWO BEDROOM DEN LARGE . . . . . . . 6,010 1,780 704,000 65,000VILLA ONE BR . . . . . . . . . . . 5,070 1,780 607,000 65,000VILLA ONE BR DEN . . . . . . . . . 5,260 1,780 643,000 65,000VILLA TWO BR SMALL . . . . . . . . 5,850 1,780 696,000 65,000VILLA TWO BR MEDIUM . . . . . . . . 6,260 1,780 761,000 65,000VILLA TWO BR LARGE . . . . . . . . 6,300 1,780 786,000 65,000VILLA TWO BR DEN . . . . . . . . . 6,560 1,780 795,000 65,000
ASSISTED LIVING:ASSISTED LIVING . . . . . . . . . . Pay same fees as ILU
NURSING CARE:NURSING CARE . . . . . . . . . . . Pay same fees as ILU
PER DIEM RATES
ASSISTED LIVING:ASSISTED LIVING . . . . . . . . . . 202 per day 202 per day
NURSING CARE:NURSING CARE . . . . . . . . . . . 532 per day 532 per day
Entry fees are assumed to increase 2.5% twice before opening. First generation entry fees are assumed to be 35% on the initial schedule, 40% on the 1st increase (2.5% higher than initial), and 25% on the 2nd increase (2.5% + 2.5% higher than initial).

Table 0.3.1
Fountaingate GardensFacility Unit Configuration
Unit Capacity
SquareUnit Type Feet 2020 2021 2022 2023 2024 2025 2026 2027 2028 2029+ --------- ---- ---- ---- ---- ---- ---- ---- ---- ---- ---- -----
INDEPENDENT LIVING:
ONE BEDROOM SMALL . . . 824 8 8 8 8 8 8 8 8 8 8 ONE BEDROOM LARGE . . . 828 16 16 16 16 16 16 16 16 16 16 ONE BR DEN SMALL . . . . 954 14 14 14 14 14 14 14 14 14 14 ONE BR DEN MEDIUM . . . 1,040 8 8 8 8 8 8 8 8 8 8 ONE BR DEN LARGE . . . . 1,170 8 8 8 8 8 8 8 8 8 8 TWO BEDROOM SMALL . . . 1,057 16 16 16 16 16 16 16 16 16 16 TWO BEDROOM LARGE . . . 1,126 8 8 8 8 8 8 8 8 8 8 TWO BEDROOM DEN SMALL . 1,280 16 16 16 16 16 16 16 16 16 16 TWO BEDROOM DEN LARGE . 1,350 8 8 8 8 8 8 8 8 8 8 VILLA ONE BR . . . . . . 984 11 11 11 11 11 11 11 11 11 11 VILLA ONE BR DEN . . . . 1,064 8 8 8 8 8 8 8 8 8 8 VILLA TWO BR SMALL . . . 1,225 11 11 11 11 11 11 11 11 11 11 VILLA TWO BR MEDIUM . . 1,349 22 22 22 22 22 22 22 22 22 22 VILLA TWO BR LARGE . . . 1,403 11 11 11 11 11 11 11 11 11 11 VILLA TWO BR DEN . . . . 1,555 11 11 11 11 11 11 11 11 11 11
---- ---- ---- ---- ---- ---- ---- ---- ---- ----- 176 176 176 176 176 176 176 176 176 176
---- ---- ---- ---- ---- ---- ---- ---- ---- -----
ASSISTED LIVING:
ASSISTED LIVING . . . . N/A 0 0 0 0 0 0 0 0 0 0 ---- ---- ---- ---- ---- ---- ---- ---- ---- -----
0 0 0 0 0 0 0 0 0 0 ---- ---- ---- ---- ---- ---- ---- ---- ---- -----
NURSING CARE:
NURSING CARE . . . . . . N/A 0 0 0 0 0 0 0 0 0 0 ---- ---- ---- ---- ---- ---- ---- ---- ---- -----
0 0 0 0 0 0 0 0 0 0 ---- ---- ---- ---- ---- ---- ---- ---- ---- -----

Table 0.3.2
Fountaingate GardensFacility Unit Configuration
Beginning of Year Unit Occupancy
Unit Type 2020 2021 2022 2023 2024 2025 2026 2027 2028 2029+ --------- ---- ---- ---- ---- ---- ---- ---- ---- ---- -----
INDEPENDENT LIVING:
ONE BEDROOM SMALL . . . . . . 0 4 7 7 7 7 7 7 7 7 ONE BEDROOM LARGE . . . . . . 0 9 13 15 15 15 15 15 15 15 ONE BR DEN SMALL . . . . . . 0 8 12 13 13 13 13 13 13 13 ONE BR DEN MEDIUM . . . . . . 0 4 7 8 8 8 8 8 8 8 ONE BR DEN LARGE . . . . . . 0 4 7 8 8 8 8 8 8 8 TWO BEDROOM SMALL . . . . . . 0 9 13 15 15 15 15 15 15 15 TWO BEDROOM LARGE . . . . . . 0 4 6 7 7 7 7 7 7 7 TWO BEDROOM DEN SMALL . . . . 0 9 13 15 15 15 15 15 15 15 TWO BEDROOM DEN LARGE . . . . 0 4 7 8 8 8 8 8 8 8 VILLA ONE BR . . . . . . . . 0 6 9 10 10 10 10 10 10 10 VILLA ONE BR DEN . . . . . . 0 4 7 8 8 8 8 8 8 8 VILLA TWO BR SMALL . . . . . 0 6 9 10 10 10 10 10 10 10 VILLA TWO BR MEDIUM . . . . . 0 12 19 21 21 21 21 21 21 21 VILLA TWO BR LARGE . . . . . 0 6 9 10 10 10 10 10 10 10 VILLA TWO BR DEN . . . . . . 0 6 9 10 10 10 10 10 10 10
---- ---- ---- ---- ---- ---- ---- ---- ---- ----- 0 95 147 165 165 165 165 165 165 165
---- ---- ---- ---- ---- ---- ---- ---- ---- -----
ASSISTED LIVING:
ASSISTED LIVING . . . . . . . 0 0 0 0 0 0 0 0 0 0 ---- ---- ---- ---- ---- ---- ---- ---- ---- -----
0 0 0 0 0 0 0 0 0 0 ---- ---- ---- ---- ---- ---- ---- ---- ---- -----
NURSING CARE:
NURSING CARE . . . . . . . . 0 0 0 0 0 0 0 0 0 0 ---- ---- ---- ---- ---- ---- ---- ---- ---- -----
0 0 0 0 0 0 0 0 0 0 ---- ---- ---- ---- ---- ---- ---- ---- ---- -----

Table 0.3.3
Fountaingate GardensFacility Unit Configuration
Average Number of Unit/Beds Occupied
Unit Type 2020 2021 2022 2023 2024 2025 2026 2027 2028 2029+ --------- ---- ---- ---- ---- ---- ---- ---- ---- ---- -----
INDEPENDENT LIVING:
ONE BEDROOM SMALL . . . . . . 3 6 7 7 7 7 7 7 7 7 ONE BEDROOM LARGE . . . . . . 5 12 14 15 15 15 15 15 15 15 ONE BR DEN SMALL . . . . . . 4 11 12 13 13 13 13 13 13 13 ONE BR DEN MEDIUM . . . . . . 3 6 7 8 8 8 8 8 8 8 ONE BR DEN LARGE . . . . . . 3 6 8 8 8 8 8 8 8 8 TWO BEDROOM SMALL . . . . . . 5 12 14 15 15 15 15 15 15 15 TWO BEDROOM LARGE . . . . . . 2 6 7 7 7 7 7 7 7 7 TWO BEDROOM DEN SMALL . . . . 5 12 14 15 15 15 15 15 15 15 TWO BEDROOM DEN LARGE . . . . 3 6 7 8 8 8 8 8 8 8 VILLA ONE BR . . . . . . . . 3 8 10 10 10 10 10 10 10 10 VILLA ONE BR DEN . . . . . . 3 6 7 8 8 8 8 8 8 8 VILLA TWO BR SMALL . . . . . 3 8 10 10 10 10 10 10 10 10 VILLA TWO BR MEDIUM . . . . . 7 16 20 21 21 21 21 21 21 21 VILLA TWO BR LARGE . . . . . 3 8 10 10 10 10 10 10 10 10 VILLA TWO BR DEN . . . . . . 3 8 10 10 10 10 10 10 10 10
---- ---- ---- ---- ---- ---- ---- ---- ---- ----- 55 131 157 165 165 165 165 165 165 165
---- ---- ---- ---- ---- ---- ---- ---- ---- -----
ASSISTED LIVING:
ASSISTED LIVING . . . . . . . 0 0 0 0 0 0 0 0 0 0 ---- ---- ---- ---- ---- ---- ---- ---- ---- -----
0 0 0 0 0 0 0 0 0 0 ---- ---- ---- ---- ---- ---- ---- ---- ---- -----
NURSING CARE:
NURSING CARE . . . . . . . . 0 0 0 0 0 0 0 0 0 0 ---- ---- ---- ---- ---- ---- ---- ---- ---- -----
0 0 0 0 0 0 0 0 0 0 ---- ---- ---- ---- ---- ---- ---- ---- ---- -----

Table 0.3.4
Fountaingate GardensFacility Unit ConfigurationAverage Number of Residents
Care Level 2020 2021 2022 2023 2024 2025 2026 2027 2028 2029+ ---------- ---- ---- ---- ---- ---- ---- ---- ---- ---- -----
INDEPENDENT LIVING . . . . . . . 84 198 234 234 227 221 216 213 211 210 ASSISTED LIVING . . . . . . . . 0 0 0 0 0 0 0 0 0 0 NURSING CARE . . . . . . . . . . 0 0 0 0 0 0 0 0 0 0

Table 0.4
Fountaingate GardensOther Financial Assumptions
Monthly Fee Inflation Rate: . . . . . . . . . . . . . . . . . . . . 3.5Entry Fee Inflation Rate: . . . . . . . . . . . . . . . . . . . . . 3.0Other Revenue Inflation Rate: . . . . . . . . . . . . . . 2.4 to 147.7Operating Expense Inflation Rate: . . . . . . . . . . . . . 3.5 to 26.5Capital Expenditure Inflation Rate: . . . . . . . . . . . -88.6 to 75.8Interest Rate for Valuing Fixed Assets
and Corresponding Liabilities: . . . . . . . . . . . . . . . . 5.0Discount Rate for Determining Present Value
and Rate of Return on Invested Assets: . . . . . . . . . . . . 5.0
Useful Life of Capital Assets (Years):- LAND: . . . . . . . . . . . . . . . . . . . . . . . . . Unlimited- BUILDING: . . . . . . . . . . . . . . . . . . . . . . . . . . 36- DESIGN & OTHER FEES: . . . . . . . . . . . . . . . . . . . . 35- BLDG IMPROVEMENTS: . . . . . . . . . . . . . . . . . . . . . 20- FURNISHINGS & EQUIPMENT: . . . . . . . . . . . . . . . . . . 10- DEFERRED MARKETING: . . . . . . . . . . . . . . . . . . . . . 11- DEFERRED FINANCING ST: . . . . . . . . . . . . . . . . . . . . 4- DEFERRED FINANCING LT: . . . . . . . . . . . . . . . . . . . 30- CAPITALIZED AMORT OF DEF FIN: . . . . . . . . . . . . . . . . 35- CAPITALIZED CONSTR INTEREST: . . . . . . . . . . . . . . . . 35- CAPITALIZED INTEREST: . . . . . . . . . . . . . . . . . . . . 35
Fiscal Year: . . . . . . . . . . . . . . . . . . . . . July 1 To June 30Initial Year of Operations: . . . . . . . . . . . . . . . . . . . 2019Current Fiscal Year: . . . . . . . . . . . . . . . . . . . . . . . 2020Schedule Monthly Fee Increases: . . . . . . . . . . . . . . . . July 1

TABLE 0.5 Fountaingate Gardens BASELINE DECREMENT ASSUMPTIONS FOR 2020 ACTUARIAL STUDY ATT FEMALE DURATION MALE DURATION AGE 1 2 3 4 ULT 1 2 3 4 ULT --- ------- ------- ------- ------- ------- ------- ------- ------- ------- ------- MORTALITY RATES (PER 100 LIVES) FOR INDEPENDENT LIVING RESIDENTS 60 0.11 0.18 0.24 0.27 0.30 0.34 0.77 0.77 0.81 0.85 65 0.31 0.53 0.71 0.80 0.89 0.57 1.28 1.28 1.35 1.42 70 0.64 1.10 1.47 1.65 1.84 0.82 1.85 1.85 1.95 2.05 75 0.84 1.45 1.93 2.17 2.41 2.04 4.59 4.59 4.84 5.10 80 1.07 1.84 2.46 2.76 3.07 2.88 6.47 6.47 6.83 7.19 85 1.56 2.68 3.57 4.02 4.47 3.62 8.14 8.14 8.59 9.04 90 2.59 4.45 5.93 6.67 7.41 4.15 9.33 9.33 9.85 10.37 95 4.35 7.46 9.95 11.19 12.44 5.31 11.95 11.95 12.61 13.28 100 5.37 9.21 12.28 13.81 15.35 6.76 15.20 15.20 16.04 16.89 105 8.10 13.89 18.52 20.83 23.15 12.11 27.25 27.25 28.76 30.28 110 14.01 24.01 32.01 36.01 40.02 23.00 51.74 51.74 54.62 57.49 115 100.00 100.00 100.00 100.00 100.00 100.00 100.00 100.00 100.00 100.00 MORTALITY RATES (PER 100 LIVES) FOR ASSISTED LIVING RESIDENTS 60 2.68 4.87 4.87 4.87 4.87 0.75 2.15 2.15 2.15 2.15 65 3.10 5.63 5.63 5.63 5.63 1.48 4.23 4.23 4.23 4.23 70 3.19 5.80 5.80 5.80 5.80 2.13 6.08 6.08 6.08 6.08 75 3.44 6.25 6.25 6.25 6.25 2.81 8.02 8.02 8.02 8.02 80 4.22 7.68 7.68 7.68 7.68 3.70 10.56 10.56 10.56 10.56 85 5.19 9.44 9.44 9.44 9.44 5.90 16.85 16.85 16.85 16.85 90 6.32 11.48 11.48 11.48 11.48 8.17 23.36 23.36 23.36 23.36 95 8.21 14.94 14.94 14.94 14.94 9.32 26.64 26.64 26.64 26.64 100 13.52 24.58 24.58 24.58 24.58 15.59 44.56 44.56 44.56 44.56 105 22.83 41.51 41.51 41.51 41.51 21.44 61.26 61.26 61.26 61.26 110 35.47 64.49 64.49 64.49 64.49 25.34 72.39 72.39 72.39 72.39 115 100.00 100.00 100.00 100.00 100.00 100.00 100.00 100.00 100.00 100.00 MORTALITY RATES (PER 100 LIVES) FOR NURSING CARE RESIDENTS 60 4.58 10.68 11.44 14.49 15.25 13.24 16.55 16.55 16.55 16.55 65 5.38 12.54 13.44 17.02 17.92 19.48 24.36 24.36 24.36 24.36 70 5.50 12.83 13.75 17.41 18.33 23.02 28.78 28.78 28.78 28.78 75 5.69 13.27 14.22 18.01 18.96 25.17 31.46 31.46 31.46 31.46 80 5.77 13.45 14.42 18.26 19.22 27.49 34.37 34.37 34.37 34.37 85 6.62 15.46 16.56 20.98 22.08 28.63 35.79 35.79 35.79 35.79 90 8.46 19.73 21.14 26.78 28.19 30.30 37.88 37.88 37.88 37.88 95 9.30 21.70 23.25 29.44 30.99 34.05 42.57 42.57 42.57 42.57 100 11.91 27.78 29.77 37.71 39.69 38.57 48.22 48.22 48.22 48.22 105 15.29 35.67 38.22 48.41 50.96 46.66 58.32 58.32 58.32 58.32 110 20.98 48.95 52.44 66.43 69.92 62.35 77.94 77.94 77.94 77.94 115 100.00 100.00 100.00 100.00 100.00 100.00 100.00 100.00 100.00 100.00

TABLE 0.5 (CONTINUED) Fountaingate Gardens BASELINE DECREMENT ASSUMPTIONS FOR 2020 ACTUARIAL STUDY ATT FEMALE DURATION MALE DURATION AGE 1 2 3 4 ULT 1 2 3 4 ULT --- ------- ------- ------- ------- ------- ------- ------- ------- ------- ------- MOVE-OUT RATES (PER 100 LIVES) FOR INDEPENDENT LIVING RESIDENTS 60 1.00 1.00 1.00 1.00 0.00 1.00 1.00 1.00 1.00 0.00 65 1.00 1.00 1.00 1.00 0.00 1.00 1.00 1.00 1.00 0.00 70 1.00 1.00 1.00 1.00 0.00 1.00 1.00 1.00 1.00 0.00 75 1.00 1.00 1.00 1.00 0.00 1.00 1.00 1.00 1.00 0.00 80 1.00 1.00 1.00 1.00 0.00 1.00 1.00 1.00 1.00 0.00 85 1.00 1.00 1.00 1.00 0.00 1.00 1.00 1.00 1.00 0.00 90 1.00 1.00 1.00 1.00 0.00 1.00 1.00 1.00 1.00 0.00 95 1.00 1.00 1.00 1.00 0.00 1.00 1.00 1.00 1.00 0.00 100 0.00 0.00 0.00 0.00 0.00 0.00 0.00 0.00 0.00 0.00 105 0.00 0.00 0.00 0.00 0.00 0.00 0.00 0.00 0.00 0.00 110 0.00 0.00 0.00 0.00 0.00 0.00 0.00 0.00 0.00 0.00 115 0.00 0.00 0.00 0.00 0.00 0.00 0.00 0.00 0.00 0.00 MOVE-OUT RATES (PER 100 LIVES) FOR ASSISTED LIVING RESIDENTS 60 0.00 0.00 0.00 0.00 0.00 0.00 0.00 0.00 0.00 0.00 65 0.00 0.00 0.00 0.00 0.00 0.00 0.00 0.00 0.00 0.00 70 0.00 0.00 0.00 0.00 0.00 0.00 0.00 0.00 0.00 0.00 75 0.00 0.00 0.00 0.00 0.00 0.00 0.00 0.00 0.00 0.00 80 0.00 0.00 0.00 0.00 0.00 0.00 0.00 0.00 0.00 0.00 85 0.00 0.00 0.00 0.00 0.00 0.00 0.00 0.00 0.00 0.00 90 0.00 0.00 0.00 0.00 0.00 0.00 0.00 0.00 0.00 0.00 95 0.00 0.00 0.00 0.00 0.00 0.00 0.00 0.00 0.00 0.00 100 0.00 0.00 0.00 0.00 0.00 0.00 0.00 0.00 0.00 0.00 105 0.00 0.00 0.00 0.00 0.00 0.00 0.00 0.00 0.00 0.00 110 0.00 0.00 0.00 0.00 0.00 0.00 0.00 0.00 0.00 0.00 115 0.00 0.00 0.00 0.00 0.00 0.00 0.00 0.00 0.00 0.00 MOVE-OUT RATES (PER 100 LIVES) FOR NURSING CARE RESIDENTS 60 0.00 0.00 0.00 0.00 0.00 0.00 0.00 0.00 0.00 0.00 65 0.00 0.00 0.00 0.00 0.00 0.00 0.00 0.00 0.00 0.00 70 0.00 0.00 0.00 0.00 0.00 0.00 0.00 0.00 0.00 0.00 75 0.00 0.00 0.00 0.00 0.00 0.00 0.00 0.00 0.00 0.00 80 0.00 0.00 0.00 0.00 0.00 0.00 0.00 0.00 0.00 0.00 85 0.00 0.00 0.00 0.00 0.00 0.00 0.00 0.00 0.00 0.00 90 0.00 0.00 0.00 0.00 0.00 0.00 0.00 0.00 0.00 0.00 95 0.00 0.00 0.00 0.00 0.00 0.00 0.00 0.00 0.00 0.00 100 0.00 0.00 0.00 0.00 0.00 0.00 0.00 0.00 0.00 0.00 105 0.00 0.00 0.00 0.00 0.00 0.00 0.00 0.00 0.00 0.00 110 0.00 0.00 0.00 0.00 0.00 0.00 0.00 0.00 0.00 0.00 115 0.00 0.00 0.00 0.00 0.00 0.00 0.00 0.00 0.00 0.00
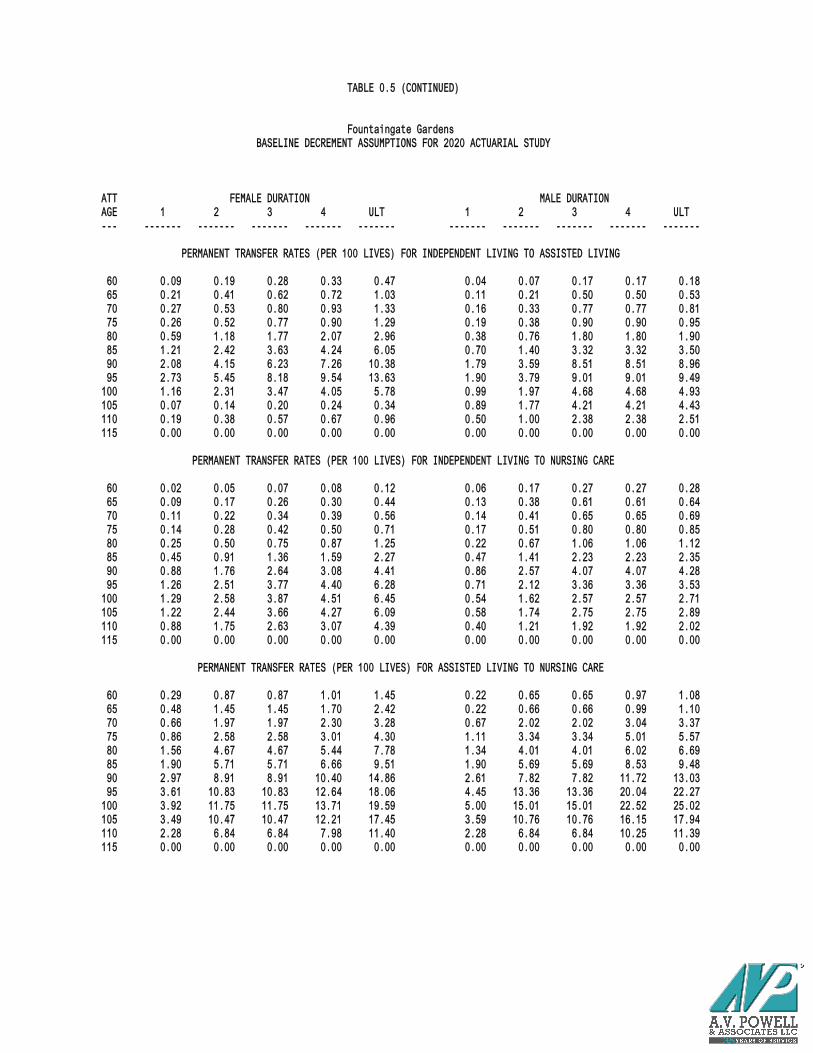
TABLE 0.5 (CONTINUED) Fountaingate Gardens BASELINE DECREMENT ASSUMPTIONS FOR 2020 ACTUARIAL STUDY ATT FEMALE DURATION MALE DURATION AGE 1 2 3 4 ULT 1 2 3 4 ULT --- ------- ------- ------- ------- ------- ------- ------- ------- ------- ------- PERMANENT TRANSFER RATES (PER 100 LIVES) FOR INDEPENDENT LIVING TO ASSISTED LIVING 60 0.09 0.19 0.28 0.33 0.47 0.04 0.07 0.17 0.17 0.18 65 0.21 0.41 0.62 0.72 1.03 0.11 0.21 0.50 0.50 0.53 70 0.27 0.53 0.80 0.93 1.33 0.16 0.33 0.77 0.77 0.81 75 0.26 0.52 0.77 0.90 1.29 0.19 0.38 0.90 0.90 0.95 80 0.59 1.18 1.77 2.07 2.96 0.38 0.76 1.80 1.80 1.90 85 1.21 2.42 3.63 4.24 6.05 0.70 1.40 3.32 3.32 3.50 90 2.08 4.15 6.23 7.26 10.38 1.79 3.59 8.51 8.51 8.96 95 2.73 5.45 8.18 9.54 13.63 1.90 3.79 9.01 9.01 9.49 100 1.16 2.31 3.47 4.05 5.78 0.99 1.97 4.68 4.68 4.93 105 0.07 0.14 0.20 0.24 0.34 0.89 1.77 4.21 4.21 4.43 110 0.19 0.38 0.57 0.67 0.96 0.50 1.00 2.38 2.38 2.51 115 0.00 0.00 0.00 0.00 0.00 0.00 0.00 0.00 0.00 0.00 PERMANENT TRANSFER RATES (PER 100 LIVES) FOR INDEPENDENT LIVING TO NURSING CARE 60 0.02 0.05 0.07 0.08 0.12 0.06 0.17 0.27 0.27 0.28 65 0.09 0.17 0.26 0.30 0.44 0.13 0.38 0.61 0.61 0.64 70 0.11 0.22 0.34 0.39 0.56 0.14 0.41 0.65 0.65 0.69 75 0.14 0.28 0.42 0.50 0.71 0.17 0.51 0.80 0.80 0.85 80 0.25 0.50 0.75 0.87 1.25 0.22 0.67 1.06 1.06 1.12 85 0.45 0.91 1.36 1.59 2.27 0.47 1.41 2.23 2.23 2.35 90 0.88 1.76 2.64 3.08 4.41 0.86 2.57 4.07 4.07 4.28 95 1.26 2.51 3.77 4.40 6.28 0.71 2.12 3.36 3.36 3.53 100 1.29 2.58 3.87 4.51 6.45 0.54 1.62 2.57 2.57 2.71 105 1.22 2.44 3.66 4.27 6.09 0.58 1.74 2.75 2.75 2.89 110 0.88 1.75 2.63 3.07 4.39 0.40 1.21 1.92 1.92 2.02 115 0.00 0.00 0.00 0.00 0.00 0.00 0.00 0.00 0.00 0.00 PERMANENT TRANSFER RATES (PER 100 LIVES) FOR ASSISTED LIVING TO NURSING CARE 60 0.29 0.87 0.87 1.01 1.45 0.22 0.65 0.65 0.97 1.08 65 0.48 1.45 1.45 1.70 2.42 0.22 0.66 0.66 0.99 1.10 70 0.66 1.97 1.97 2.30 3.28 0.67 2.02 2.02 3.04 3.37 75 0.86 2.58 2.58 3.01 4.30 1.11 3.34 3.34 5.01 5.57 80 1.56 4.67 4.67 5.44 7.78 1.34 4.01 4.01 6.02 6.69 85 1.90 5.71 5.71 6.66 9.51 1.90 5.69 5.69 8.53 9.48 90 2.97 8.91 8.91 10.40 14.86 2.61 7.82 7.82 11.72 13.03 95 3.61 10.83 10.83 12.64 18.06 4.45 13.36 13.36 20.04 22.27 100 3.92 11.75 11.75 13.71 19.59 5.00 15.01 15.01 22.52 25.02 105 3.49 10.47 10.47 12.21 17.45 3.59 10.76 10.76 16.15 17.94 110 2.28 6.84 6.84 7.98 11.40 2.28 6.84 6.84 10.25 11.39 115 0.00 0.00 0.00 0.00 0.00 0.00 0.00 0.00 0.00 0.00

TABLE 0.5 (CONTINUED) Fountaingate Gardens BASELINE DECREMENT ASSUMPTIONS FOR 2020 ACTUARIAL STUDY ATT FEMALE DURATION MALE DURATION AGE 1 2 3 4 ULT 1 2 3 4 ULT --- ------- ------- ------- ------- ------- ------- ------- ------- ------- ------- TEMPORARY TRANSFER (DAYS PER YEAR PER LIFE) FOR INDEPENDENT LIVING TO ASSISTED LIVING 60 0.0 0.0 0.0 0.0 0.0 0.0 0.0 0.0 0.0 0.0 65 0.0 0.0 0.0 0.0 0.0 0.0 0.0 0.0 0.0 0.0 70 0.0 0.0 0.0 0.0 0.0 0.0 0.0 0.0 0.0 0.0 75 0.0 0.0 0.0 0.0 0.0 0.0 0.0 0.0 0.0 0.0 80 0.0 0.0 0.0 0.0 0.0 0.0 0.0 0.0 0.0 0.0 85 0.0 0.0 0.0 0.0 0.0 0.0 0.0 0.0 0.0 0.0 90 0.0 0.0 0.0 0.0 0.0 0.0 0.0 0.0 0.0 0.0 95 0.0 0.0 0.0 0.0 0.0 0.0 0.0 0.0 0.0 0.0 100 0.0 0.0 0.0 0.0 0.0 0.0 0.0 0.0 0.0 0.0 105 0.0 0.0 0.0 0.0 0.0 0.0 0.0 0.0 0.0 0.0 110 0.0 0.0 0.0 0.0 0.0 0.0 0.0 0.0 0.0 0.0 115 0.0 0.0 0.0 0.0 0.0 0.0 0.0 0.0 0.0 0.0 TEMPORARY TRANSFER (DAYS PER YEAR PER LIFE) FOR INDEPENDENT LIVING TO NURSING CARE 60 0.0 0.0 0.0 0.0 0.0 0.0 0.0 0.0 0.0 0.0 65 1.0 1.0 1.0 1.0 1.0 0.0 0.0 0.0 0.0 0.0 70 3.5 3.5 3.5 3.5 3.5 0.0 0.0 0.0 0.0 0.0 75 6.0 6.0 6.0 6.0 6.0 0.0 0.0 0.0 0.0 0.0 80 8.5 8.5 8.5 8.5 8.5 0.0 0.0 0.0 0.0 0.0 85 11.0 11.0 11.0 11.0 11.0 0.0 0.0 0.0 0.0 0.0 90 13.5 13.5 13.5 13.5 13.5 0.0 0.0 0.0 0.0 0.0 95 16.0 16.0 16.0 16.0 16.0 0.0 0.0 0.0 0.0 0.0 100 18.5 18.5 18.5 18.5 18.5 0.0 0.0 0.0 0.0 0.0 105 21.0 21.0 21.0 21.0 21.0 0.0 0.0 0.0 0.0 0.0 110 23.5 23.5 23.5 23.5 23.5 0.0 0.0 0.0 0.0 0.0 115 0.0 0.0 0.0 0.0 0.0 0.0 0.0 0.0 0.0 0.0 TEMPORARY TRANSFER (DAYS PER YEAR PER LIFE) FOR ASSISTED LIVING TO NURSING CARE 60 0.0 0.0 0.0 0.0 0.0 0.0 0.0 0.0 0.0 0.0 65 0.0 0.0 0.0 0.0 0.0 0.0 0.0 0.0 0.0 0.0 70 1.4 1.4 1.4 1.4 1.4 1.4 1.4 1.4 1.4 1.4 75 5.0 5.0 5.0 5.0 5.0 5.0 5.0 5.0 5.0 5.0 80 8.6 8.6 8.6 8.6 8.6 8.6 8.6 8.6 8.6 8.6 85 12.1 12.1 12.1 12.1 12.1 12.1 12.1 12.1 12.1 12.1 90 15.7 15.7 15.7 15.7 15.7 15.7 15.7 15.7 15.7 15.7 95 19.3 19.3 19.3 19.3 19.3 19.3 19.3 19.3 19.3 19.3 100 22.8 22.8 22.8 22.8 22.8 22.8 22.8 22.8 22.8 22.8 105 26.4 26.4 26.4 26.4 26.4 26.4 26.4 26.4 26.4 26.4 110 30.0 30.0 30.0 30.0 30.0 30.0 30.0 30.0 30.0 30.0 115 0.0 0.0 0.0 0.0 0.0 0.0 0.0 0.0 0.0 0.0

Table 1.3 Individual Life Expectancies for 2020 Residents in INDEPENDENT LIVING in Fountaingate Gardens (Based on Baseline Decrements) Life Expectancy for Portion of Portion of Portion of Residents in Lifetime in Lifetime in Lifetime in INDEPEND- INDEPEND- ASSISTED NURSING Current Age ENT LIVING ENT LIVING LIVING CARE ----------- --------------- ----------- ----------- ----------- FEMALE 60 23.8 years 19.4 years 2.5 years 1.9 years 65 20.5 16.4 2.2 1.9 70 17.5 13.7 2.0 1.8 75 14.6 10.8 2.0 1.8 80 * 11.8 8.2 1.9 1.7 85 9.3 6.1 1.6 1.6 90 7.4 4.8 1.3 1.3 95 6.1 4.4 0.7 1.0 100 5.2 4.4 0.1 0.7 MALE 60 19.7 years 18.0 years 1.1 years 0.6 years 65 16.4 14.8 1.0 0.6 70 13.2 11.8 0.9 0.5 75 10.4 9.1 0.8 0.5 80 8.6 7.3 0.8 0.5 82 * 7.9 6.6 0.8 0.5 85 7.0 5.6 0.9 0.5 90 6.0 4.7 0.8 0.5 95 5.3 4.6 0.4 0.3 100 4.2 3.9 0.2 0.1 * Average age at entry for residents of INDEPENDENT LIVING.

Table 1.3 Individual Life Expectancies for 2020 Residents in ASSISTED LIVING in Fountaingate Gardens (Based on Baseline Decrements) Life Expectancy for Portion of Portion of Portion of Residents in Lifetime in Lifetime in Lifetime in ASSISTED INDEPEND- ASSISTED NURSING Current Age LIVING ENT LIVING LIVING CARE ----------- --------------- ----------- ----------- ----------- FEMALE 60 13.7 years 0.0 years 11.6 years 2.1 years 65 12.7 0.0 10.4 2.3 70 11.5 0.0 9.1 2.4 75 9.9 0.0 7.5 2.4 80 8.3 0.0 6.0 2.3 81 * 8.0 0.0 5.8 2.2 85 7.0 0.0 4.9 2.1 90 5.8 0.0 3.9 1.9 95 4.6 0.0 3.2 1.4 100 3.3 0.0 2.4 0.9 MALE 60 13.8 years 0.0 years 12.8 years 1.0 years 65 11.1 0.0 10.0 1.1 70 9.0 0.0 7.9 1.1 75 7.4 0.0 6.4 1.0 80 5.9 0.0 5.0 0.9 82 * 5.3 0.0 4.4 0.9 85 4.5 0.0 3.7 0.8 90 3.7 0.0 2.9 0.8 95 3.1 0.0 2.3 0.8 100 2.2 0.0 1.8 0.4 * Average age for residents of ASSISTED LIVING.

Table 1.3 Individual Life Expectancies for 2020 Residents in NURSING CARE in Fountaingate Gardens (Based on Baseline Decrements) Life Expectancy for Portion of Portion of Portion of Residents in Lifetime in Lifetime in Lifetime in NURSING INDEPEND- ASSISTED NURSING Current Age CARE ENT LIVING LIVING CARE ----------- --------------- ----------- ----------- ----------- FEMALE 60 6.8 years 0.0 years 0.0 years 6.8 years 65 6.6 0.0 0.0 6.6 70 6.4 0.0 0.0 6.4 75 6.1 0.0 0.0 6.1 80 5.5 0.0 0.0 5.5 81 * 5.4 0.0 0.0 5.4 85 4.7 0.0 0.0 4.7 90 4.1 0.0 0.0 4.1 95 3.6 0.0 0.0 3.6 100 2.9 0.0 0.0 2.9 MALE 60 4.6 years 0.0 years 0.0 years 4.6 years 65 3.6 0.0 0.0 3.6 70 3.1 0.0 0.0 3.1 75 2.8 0.0 0.0 2.8 80 2.6 0.0 0.0 2.6 82 * 2.6 0.0 0.0 2.6 85 2.5 0.0 0.0 2.5 90 2.3 0.0 0.0 2.3 95 2.0 0.0 0.0 2.0 100 1.7 0.0 0.0 1.7 * Average age for residents of NURSING CARE.

TABLE 1.3 Continued Last Survivor Life Expectancies for 2020 Residents in INDEPENDENT LIVING in Fountaingate Gardens (Based on Baseline Decrements) ¦ M 60 M 65 M 70 M 75 M 80 M 85 M 90 M 95 M100 _____________________________________________________________________________________ F 60 ¦ 27.9 26.6 25.6 24.9 24.5 24.3 24.1 24.1 24.0 ¦ F 65 ¦ 25.7 24.2 22.9 22.0 21.5 21.1 21.0 20.8 20.7 ¦ F 70 ¦ 24.0 22.1 20.6 19.4 18.8 18.3 18.1 18.0 17.8 ¦ F 75 ¦ 22.5 20.3 18.4 17.0 16.2 15.6 15.3 15.1 14.9 ¦ F 80 ¦ 21.4 18.9 16.6 14.9 13.9 13.1 12.7 12.5 12.2 ¦ F 85 ¦ 20.7 17.9 15.4 13.4 12.1 11.2 10.6 10.3 9.9 ¦ F 90 ¦ 20.3 17.3 14.6 12.3 10.9 9.8 9.1 8.7 8.1 ¦ F 95 ¦ 20.1 17.1 14.1 11.7 10.2 9.0 8.3 7.8 7.1 ¦ F100 ¦ 20.0 16.9 13.8 11.4 9.7 8.4 7.6 7.1 6.4

Table 1.4 New Entrant Assumptions for Fountaingate Gardens Entrants to INDEPENDENT LIVING Entry Age Female Male --------- ------ ---- 55- 59 0.0 % 0.0 % 60- 64 0.0 0.0 65- 69 5.0 0.0 70- 74 15.0 10.0 75- 79 30.0 30.0 80- 84 30.0 35.0 85- 89 15.0 20.0 90 and over 5.0 5.0 ------- ------- 100.0 % 100.0 % Average age at entry 80.0 81.5 Probability that New Unit Entrants will be a Couple ---- ------------------------- ONE BEDROOM SMALL...............................................................0.0 % ONE BEDROOM LARGE...............................................................0.0 ONE BR DEN SMALL...............................................................10.0 ONE BR DEN MEDIUM..............................................................25.0 ONE BR DEN LARGE...............................................................25.0 TWO BEDROOM SMALL..............................................................50.0 TWO BEDROOM LARGE..............................................................50.0 TWO BEDROOM DEN SMALL..........................................................75.0 TWO BEDROOM DEN LARGE..........................................................90.0 VILLA ONE BR...................................................................25.0 VILLA ONE BR DEN...............................................................50.0 VILLA TWO BR SMALL.............................................................75.0 VILLA TWO BR MEDIUM............................................................90.0 VILLA TWO BR LARGE.............................................................90.0 VILLA TWO BR DEN...............................................................90.0 Probability that: Gender Distribution ----------------- ------------------- Single Entrant is Female.......................................................80.0 % Coupled Entrants Same Sex.......................................................0.0 Probability the New Contract Selection Distribution Contract will be Selected ------------------------------- ------------------------- 80% REFUNDABLE MODIFIED........................................................15.0 % 50% REFUNDABLE MODIFIED........................................................35.0 80% REFUNDABLE LIFECARE........................................................10.0 50% REFUNDABLE LIFECARE........................................................40.0

Table 2.1 Fountaingate Gardens Summary of Population Projection Statistics Total Average - - - - Excludes Direct Entrants - - - - Independ- Number Number Number Total Total Total Fiscal ent Living of New of Deaths Total ASSISTED NURSING Health Year Turnover Entrants or Move-outs Residents LIVING * CARE * Care * ------ ---------- -------- ------------ --------- ---------- ---------- ---------- 2020 ** 96 147 2 84 0 1 2 2021 ** 56 85 8 199 2 3 5 2022 ** 25 37 12 237 4 5 9 2023 9 13 13 247 8 8 16 2024 11 16 16 247 13 10 24 2025 12 18 16 249 18 14 32 2026 13 20 18 251 22 16 39 2027 14 21 19 253 25 19 44 2028 14 21 19 256 28 22 49 2029 14 22 20 258 29 24 53 2030 15 23 20 261 31 26 56 2031 14 22 20 263 31 27 59 2032 15 23 21 265 32 28 61 2033 15 22 21 266 33 29 62 2034 16 25 22 268 34 30 64 2035 16 24 22 270 35 32 67 2036 15 23 23 271 35 32 67 2037 16 25 23 273 35 33 68 2038 15 23 22 274 35 34 69 2039 16 23 23 275 35 35 70 * The values in columns six, seven, and eight reflect the average during the year. ** The values in column five reflect average occupancy. SOME COLUMNS OR ROWS MAY NOT ADD DUE TO ROUNDING.

Table 2.2 Fountaingate Gardens Beginning of Fiscal Year Demographic Statistics Units Occupied - - - - - - Number of Permanent Residents - - - - - - Fiscal INDEPEND- INDEPEND- ASSISTED NURSING Average Yrs In Year ENT LIVING ENT LIVING LIVING CARE Total Age Comm. ------ ---------- ---------- ---------- ---------- --------- ------- ------- 2020 * 0 84 0 0 84 80.1 0.5 2021 * 95 198 1 0 199 80.4 0.9 2022 * 147 234 2 1 237 81.1 1.6 2023 165 238 6 3 247 81.8 2.4 2024 165 231 11 5 247 82.5 3.3 2025 165 223 16 8 247 83.2 4.0 2026 165 218 20 11 250 83.7 4.7 2027 165 215 24 13 252 84.2 5.2 2028 165 212 27 16 254 84.7 5.7 2029 165 210 29 18 257 85.1 6.2 2030 165 209 30 20 259 85.4 6.5 2031 165 209 31 22 262 85.8 6.9 2032 165 209 32 23 264 86.1 7.1 2033 165 209 33 24 265 86.4 7.4 2034 165 209 34 24 267 86.7 7.6 2035 165 209 35 26 269 86.9 7.7 2036 165 209 35 27 271 87.1 7.8 2037 165 210 35 27 272 87.4 7.9 2038 165 211 35 28 274 87.6 8.0 2039 165 211 35 29 275 87.8 8.1 * The values in column three reflect the average during the years with asterisks. SOME COLUMNS OR ROWS MAY NOT ADD DUE TO ROUNDING.
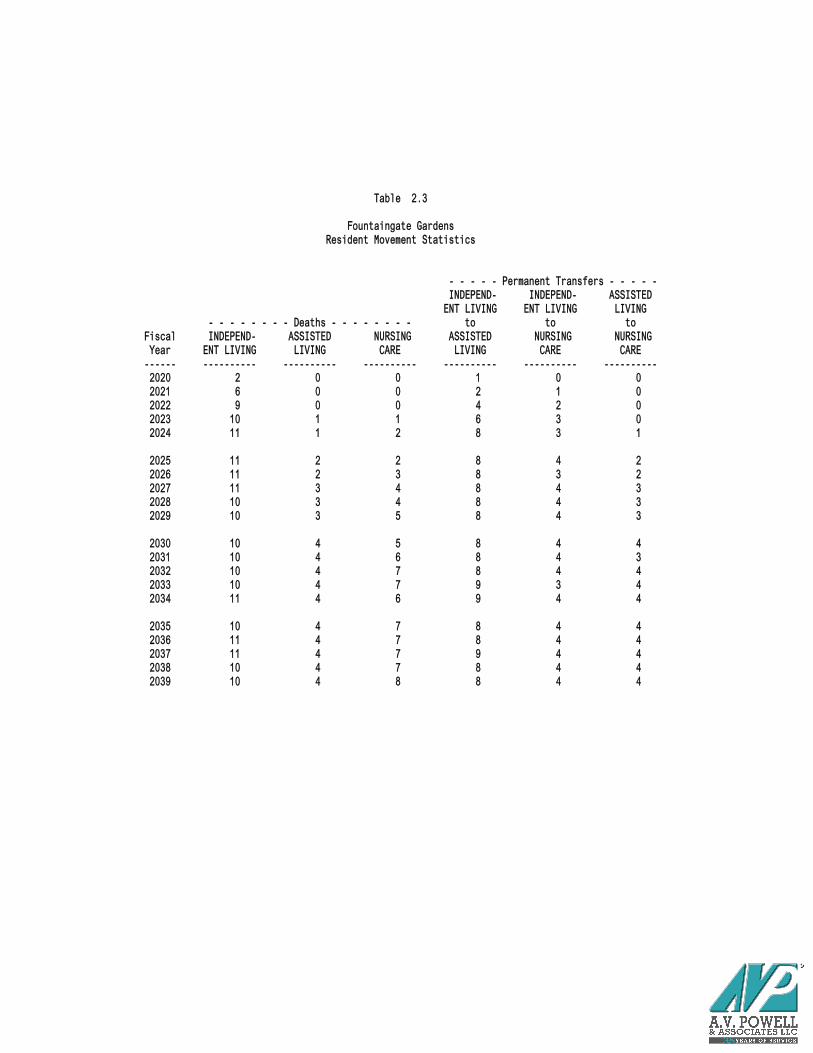
Table 2.3 Fountaingate Gardens Resident Movement Statistics - - - - - Permanent Transfers - - - - - INDEPEND- INDEPEND- ASSISTED ENT LIVING ENT LIVING LIVING - - - - - - - - Deaths - - - - - - - - to to to Fiscal INDEPEND- ASSISTED NURSING ASSISTED NURSING NURSING Year ENT LIVING LIVING CARE LIVING CARE CARE ------ ---------- ---------- ---------- ---------- ---------- ---------- 2020 2 0 0 1 0 0 2021 6 0 0 2 1 0 2022 9 0 0 4 2 0 2023 10 1 1 6 3 0 2024 11 1 2 8 3 1 2025 11 2 2 8 4 2 2026 11 2 3 8 3 2 2027 11 3 4 8 4 3 2028 10 3 4 8 4 3 2029 10 3 5 8 4 3 2030 10 4 5 8 4 4 2031 10 4 6 8 4 3 2032 10 4 7 8 4 4 2033 10 4 7 9 3 4 2034 11 4 6 9 4 4 2035 10 4 7 8 4 4 2036 11 4 7 8 4 4 2037 11 4 7 9 4 4 2038 10 4 7 8 4 4 2039 10 4 8 8 4 4

Table 2.4 Fountaingate Gardens INDEPENDENT LIVING Turnover Statistics Average Age of Number INDEPEND- - - - - - Cause of INDEPENDENT LIVING Turnover - - - - Fiscal New of New ENT LIVING Move Permanent Year Entrants Entrants Turnover Out Death Transfer New Sales* ------ ---------- ---------- ---------- ---------- ---------- ---------- ---------- 2020 80.0 147 96 1 0 0 95 2021 80.0 85 56 1 2 1 52 2022 79.9 37 25 2 3 2 18 2023 80.0 13 9 1 4 4 0 2024 80.2 16 11 1 4 6 0 2025 80.8 18 12 0 5 7 0 2026 80.8 20 13 1 6 6 0 2027 81.3 21 14 1 6 7 0 2028 81.1 21 14 1 6 7 0 2029 81.1 22 14 0 6 8 0 2030 81.9 23 15 1 6 8 0 2031 82.0 22 14 0 6 8 0 2032 82.0 23 15 1 6 8 0 2033 82.0 22 15 1 6 8 0 2034 82.0 25 16 0 7 9 0 2035 82.9 24 16 1 7 8 0 2036 83.2 23 15 1 6 8 0 2037 83.2 25 16 1 7 8 0 2038 83.0 23 15 0 6 9 0 2039 83.2 23 16 0 7 9 0 * This column reflects the annual change in the beginning of year INDEPENDENT LIVING occupancy (see Table 2.2, column 2).

Table 2.5 Fountaingate Gardens Projected Resident Days by Level of Care (All Contractholder Days) Permanent Temporary Total Permanent Temporary Total Fiscal INDEPEND- ASSISTED ASSISTED ASSISTED NURSING NURSING NURSING Year ENT LIVING LIVING LIVING LIVING CARE CARE CARE ------ ---------- ---------- ---------- ---------- ---------- ---------- ---------- 2020 30,660 106 0 106 49 396 445 2021 72,423 555 0 555 256 938 1,194 2022 85,231 1,506 0 1,506 770 1,169 1,939 2023 85,591 3,017 0 3,017 1,515 1,290 2,805 2024 82,919 4,873 0 4,873 2,413 1,376 3,789 2025 80,556 6,645 0 6,645 3,508 1,453 4,961 2026 78,968 8,158 0 8,158 4,473 1,523 5,996 2027 77,920 9,271 0 9,271 5,291 1,593 6,884 2028 77,070 10,059 0 10,059 6,198 1,653 7,851 2029 76,526 10,729 0 10,729 6,942 1,711 8,653 2030 76,367 11,154 0 11,154 7,599 1,753 9,352 2031 76,396 11,456 0 11,456 8,143 1,803 9,946 2032 76,343 11,806 0 11,806 8,455 1,839 10,294 2033 76,241 12,114 0 12,114 8,713 1,876 10,589 2034 76,210 12,487 0 12,487 9,116 1,906 11,022 2035 76,325 12,760 0 12,760 9,594 1,939 11,533 2036 76,475 12,707 0 12,707 9,890 1,960 11,850 2037 76,710 12,682 0 12,682 10,118 1,977 12,095 2038 76,911 12,735 0 12,735 10,424 2,008 12,432 2039 76,929 12,795 0 12,795 10,596 2,019 12,615 SOME COLUMNS OR ROWS MAY NOT ADD DUE TO ROUNDING.

Table 2.13 Fountaingate Gardens Projected INDEPENDENT LIVING Turnover by Unit Type INDEPEND- INDEPEND- ENT LIVING Fiscal - - - - - - - - - - - - - - - - Turnover by Unit Type - - - - - - - - - - - - - - - - ENT LIVING Turnover Year Group I Group II Group III Group IV Group V Group VI Turnover Percentage ------ ---------- ---------- ---------- ---------- ---------- ---------- ---------- ---------- 2020 13 21 8 13 16 25 96 174.5 % 2021 8 12 5 7 10 14 56 42.7 2022 3 6 3 4 4 5 25 15.9 2023 2 2 1 1 2 1 9 5.5 2024 2 3 1 1 2 2 11 6.7 2025 2 4 1 1 2 2 12 7.3 2026 2 3 1 2 2 3 13 7.9 2027 2 4 1 2 2 3 14 8.5 2028 2 4 1 2 2 3 14 8.5 2029 2 4 1 2 2 3 14 8.5 2030 2 5 1 2 2 3 15 9.1 2031 2 4 1 2 2 3 14 8.5 2032 2 4 1 2 3 3 15 9.1 2033 2 5 1 2 2 3 15 9.1 2034 2 3 2 2 3 4 16 9.7 2035 2 5 2 2 2 3 16 9.7 2036 2 3 2 2 3 3 15 9.1 2037 2 4 1 2 3 4 16 9.7 2038 2 3 2 2 3 3 15 9.1 2039 3 4 1 2 3 3 16 9.7 Unit Type Groupings ------------------- Group I = ONE BEDROOM SMALL Group II = ONE BR DEN SMALL Group III = ONE BR DEN LARGE ONE BEDROOM LARGE ONE BR DEN MEDIUM TWO BEDROOM LARGE TWO BEDROOM SMALL Group IV = TWO BEDROOM DEN SMAL Group V = VILLA ONE BR Group VI = VILLA TWO BR MEDIUM TWO BEDROOM DEN LARG VILLA ONE BR DEN VILLA TWO BR LARGE VILLA TWO BR SMALL VILLA TWO BR DEN

Table 2.14 Fountaingate Gardens Move-out and Refund Statistics Direct Transfers - - - - - - - - Refund Amounts Due to - - - - - - - - Fiscal Entry to to Number of Permanent Year ALU ALU Refunds Death Move-out Transfer Total ------ ---------- ---------- ---------- ---------- ---------- ---------- ---------- 2020 0 1 1 $ 189,902 $ 312,522 $ 73,334 $ 575,758 2021 0 2 3 718,094 651,278 212,441 1,581,813 2022 0 4 6 1,179,978 731,037 475,303 2,386,318 2023 0 6 7 1,622,853 658,657 680,414 2,961,924 2024 0 8 9 1,865,121 544,203 1,034,845 3,444,169 2025 0 8 10 2,314,336 257,092 1,287,006 3,858,434 2026 0 8 11 2,720,356 251,155 1,460,711 4,432,221 2027 0 8 12 3,048,376 267,701 1,510,645 4,826,722 2028 0 8 11 2,986,779 321,076 1,587,985 4,895,840 2029 0 8 12 3,445,427 293,675 1,573,532 5,312,634 2030 0 8 13 3,673,108 346,176 1,960,879 5,980,163 2031 0 8 13 3,977,311 222,955 1,749,757 5,950,023 2032 0 8 14 4,030,018 391,829 1,939,273 6,361,120 2033 0 9 14 3,969,423 399,730 1,892,998 6,262,150 2034 0 9 15 4,693,795 316,166 2,032,522 7,042,483 2035 0 8 15 4,970,449 451,917 2,063,710 7,486,076 2036 0 8 14 4,878,733 356,486 1,936,087 7,171,307 2037 0 9 16 5,323,670 526,965 2,230,870 8,081,505 2038 0 8 14 4,917,773 338,407 2,159,140 7,415,319 2039 0 8 16 5,823,549 342,020 2,034,988 8,200,557 SOME COLUMNS OR ROWS MAY NOT ADD DUE TO ROUNDING.
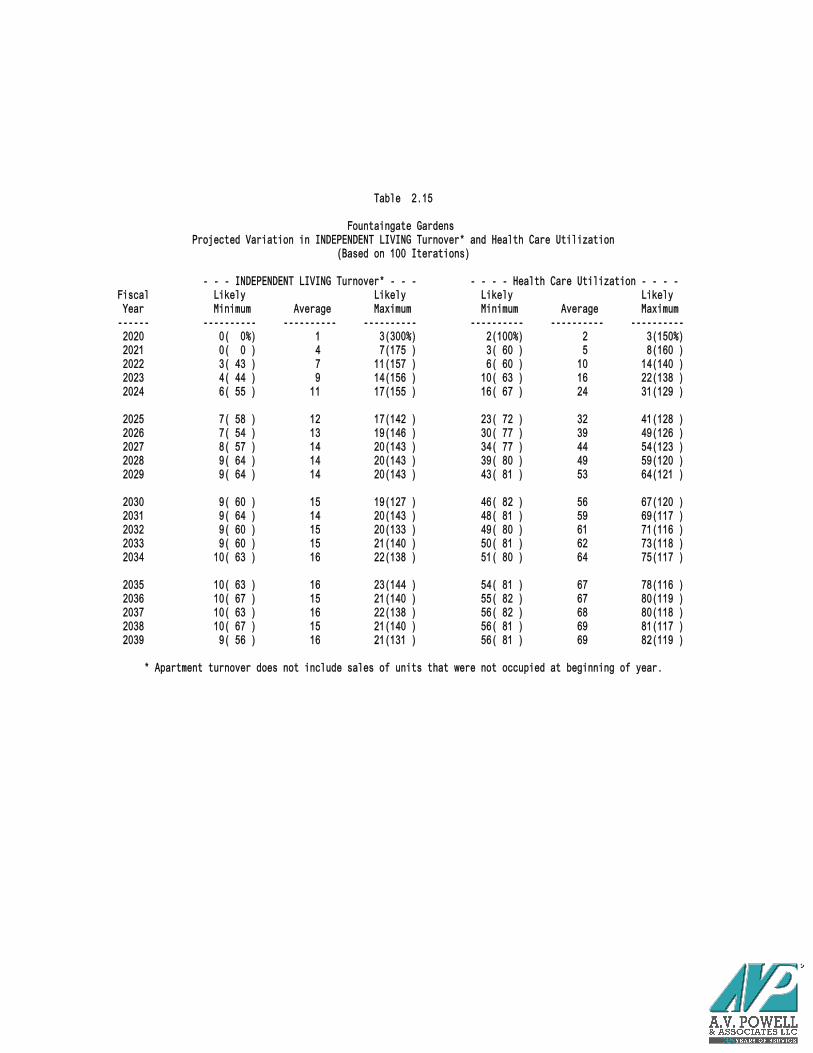
Table 2.15 Fountaingate Gardens Projected Variation in INDEPENDENT LIVING Turnover* and Health Care Utilization (Based on 100 Iterations) - - - INDEPENDENT LIVING Turnover* - - - - - - - Health Care Utilization - - - - Fiscal Likely Likely Likely Likely Year Minimum Average Maximum Minimum Average Maximum ------ ---------- ---------- ---------- ---------- ---------- ---------- 2020 0( 0%) 1 3(300%) 2(100%) 2 3(150%) 2021 0( 0 ) 4 7(175 ) 3( 60 ) 5 8(160 ) 2022 3( 43 ) 7 11(157 ) 6( 60 ) 10 14(140 ) 2023 4( 44 ) 9 14(156 ) 10( 63 ) 16 22(138 ) 2024 6( 55 ) 11 17(155 ) 16( 67 ) 24 31(129 ) 2025 7( 58 ) 12 17(142 ) 23( 72 ) 32 41(128 ) 2026 7( 54 ) 13 19(146 ) 30( 77 ) 39 49(126 ) 2027 8( 57 ) 14 20(143 ) 34( 77 ) 44 54(123 ) 2028 9( 64 ) 14 20(143 ) 39( 80 ) 49 59(120 ) 2029 9( 64 ) 14 20(143 ) 43( 81 ) 53 64(121 ) 2030 9( 60 ) 15 19(127 ) 46( 82 ) 56 67(120 ) 2031 9( 64 ) 14 20(143 ) 48( 81 ) 59 69(117 ) 2032 9( 60 ) 15 20(133 ) 49( 80 ) 61 71(116 ) 2033 9( 60 ) 15 21(140 ) 50( 81 ) 62 73(118 ) 2034 10( 63 ) 16 22(138 ) 51( 80 ) 64 75(117 ) 2035 10( 63 ) 16 23(144 ) 54( 81 ) 67 78(116 ) 2036 10( 67 ) 15 21(140 ) 55( 82 ) 67 80(119 ) 2037 10( 63 ) 16 22(138 ) 56( 82 ) 68 80(118 ) 2038 10( 67 ) 15 21(140 ) 56( 81 ) 69 81(117 ) 2039 9( 56 ) 16 21(131 ) 56( 81 ) 69 82(119 ) * Apartment turnover does not include sales of units that were not occupied at beginning of year.
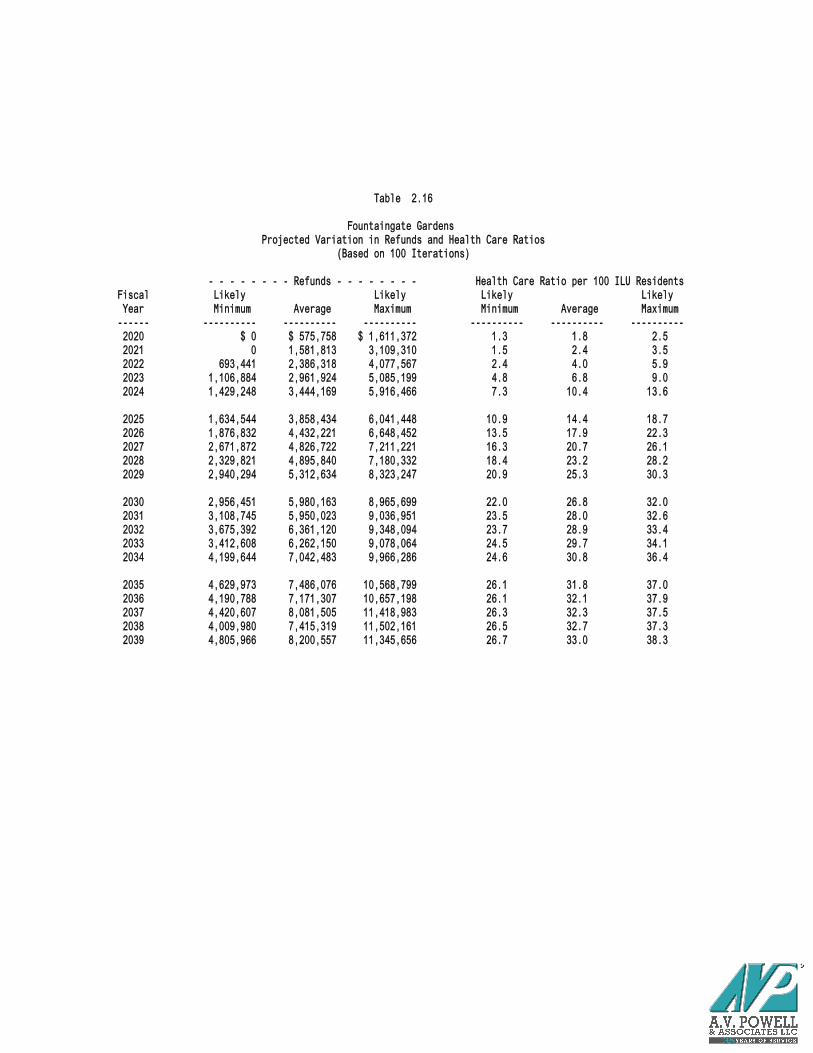
Table 2.16 Fountaingate Gardens Projected Variation in Refunds and Health Care Ratios (Based on 100 Iterations) - - - - - - - - Refunds - - - - - - - - Health Care Ratio per 100 ILU Residents Fiscal Likely Likely Likely Likely Year Minimum Average Maximum Minimum Average Maximum ------ ---------- ---------- ---------- ---------- ---------- ---------- 2020 $ 0 $ 575,758 $ 1,611,372 1.3 1.8 2.5 2021 0 1,581,813 3,109,310 1.5 2.4 3.5 2022 693,441 2,386,318 4,077,567 2.4 4.0 5.9 2023 1,106,884 2,961,924 5,085,199 4.8 6.8 9.0 2024 1,429,248 3,444,169 5,916,466 7.3 10.4 13.6 2025 1,634,544 3,858,434 6,041,448 10.9 14.4 18.7 2026 1,876,832 4,432,221 6,648,452 13.5 17.9 22.3 2027 2,671,872 4,826,722 7,211,221 16.3 20.7 26.1 2028 2,329,821 4,895,840 7,180,332 18.4 23.2 28.2 2029 2,940,294 5,312,634 8,323,247 20.9 25.3 30.3 2030 2,956,451 5,980,163 8,965,699 22.0 26.8 32.0 2031 3,108,745 5,950,023 9,036,951 23.5 28.0 32.6 2032 3,675,392 6,361,120 9,348,094 23.7 28.9 33.4 2033 3,412,608 6,262,150 9,078,064 24.5 29.7 34.1 2034 4,199,644 7,042,483 9,966,286 24.6 30.8 36.4 2035 4,629,973 7,486,076 10,568,799 26.1 31.8 37.0 2036 4,190,788 7,171,307 10,657,198 26.1 32.1 37.9 2037 4,420,607 8,081,505 11,418,983 26.3 32.3 37.5 2038 4,009,980 7,415,319 11,502,161 26.5 32.7 37.3 2039 4,805,966 8,200,557 11,345,656 26.7 33.0 38.3

Table 3.5.1 Fountaingate Gardens All operating expenses less all Direct Billing Revenues Summed for all care levels Total expenses per year for years 2020 to 2029 Category 2020 2021 2022 2023 2024 2025 -------------------- --------------- --------------- --------------- --------------- --------------- --------------- GENERAL & ADMINISTRA 2,198,575 2,182,009 2,287,953 2,228,130 2,306,115 2,386,829 HOUSEKEEPING 385,742 585,541 630,603 710,733 779,604 825,911 PLANT OPERATIONS 687,636 773,057 806,901 911,511 951,896 988,974 FOOD SERVICE 1,282,032 2,102,341 2,347,841 2,436,476 2,490,650 2,550,837 HEALTH CARE 103,474 133,165 137,825 164,343 170,095 305,619 UTILITIES & PROP TAX 1,966,921 2,035,763 2,107,015 2,180,761 2,257,087 2,336,085 LAND LEASE 0 216,000 223,560 231,385 239,483 247,865 MANAGEMENT FEE 264,780 346,817 383,011 415,244 451,064 494,912 ASSISTED LIVING 10,702 51,204 147,741 318,138 537,589 770,812 SKILLED NURSING 226,304 591,348 885,840 1,199,632 1,544,081 1,959,867 OTHER INCOME -186,669 -462,386 -568,608 -609,824 -624,654 -641,098 Total 6,939,497 8,554,859 9,389,682 10,186,529 11,103,010 12,226,613 Percent increase N.A. 23.3 9.8 8.5 9.0 10.1
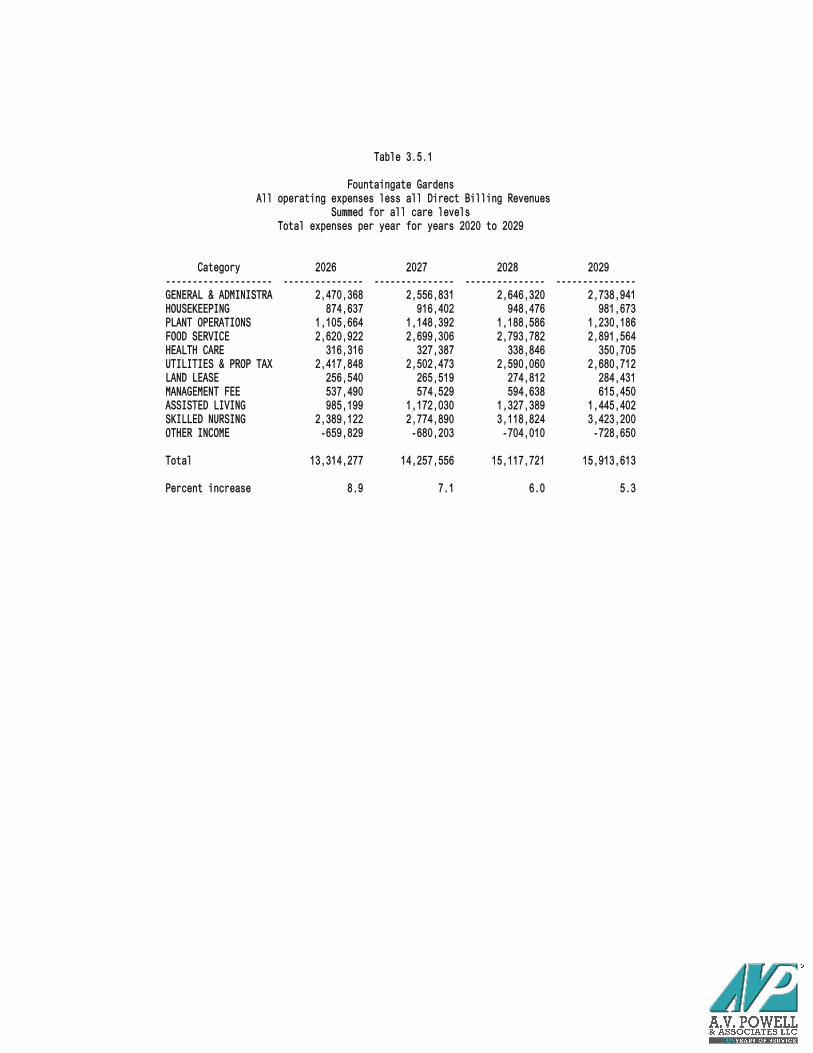
Table 3.5.1 Fountaingate Gardens All operating expenses less all Direct Billing Revenues Summed for all care levels Total expenses per year for years 2020 to 2029 Category 2026 2027 2028 2029 -------------------- --------------- --------------- --------------- --------------- GENERAL & ADMINISTRA 2,470,368 2,556,831 2,646,320 2,738,941 HOUSEKEEPING 874,637 916,402 948,476 981,673 PLANT OPERATIONS 1,105,664 1,148,392 1,188,586 1,230,186 FOOD SERVICE 2,620,922 2,699,306 2,793,782 2,891,564 HEALTH CARE 316,316 327,387 338,846 350,705 UTILITIES & PROP TAX 2,417,848 2,502,473 2,590,060 2,680,712 LAND LEASE 256,540 265,519 274,812 284,431 MANAGEMENT FEE 537,490 574,529 594,638 615,450 ASSISTED LIVING 985,199 1,172,030 1,327,389 1,445,402 SKILLED NURSING 2,389,122 2,774,890 3,118,824 3,423,200 OTHER INCOME -659,829 -680,203 -704,010 -728,650 Total 13,314,277 14,257,556 15,117,721 15,913,613 Percent increase 8.9 7.1 6.0 5.3

Table 3.5.2.1 Fountaingate Gardens CAPITAL EXPENDITURES CASH FLOW METHODOLOGY SUMMED FOR ALL CARE LEVELS TOTAL EXPENSES PER YEAR FOR YEARS 2019 TO 2039 Category 2019 2020 2021 2022 2023 2024 -------------------- ---------------- ---------------- ---------------- ---------------- ---------------- ---------------- LAND 0 0 0 0 0 0 BUILDING 82,004,833 1,080,104 0 0 0 0 DESIGN & OTHER FEES 17,857,522 587,899 0 0 0 0 BLDG IMPROVEMENTS 0 0 0 0 0 0 FURNISHINGS & EQUIPM 1,714,955 676,228 293,333 322,667 354,933 366,025 DEFERRED MARKETING 6,551,059 125,238 0 0 0 0 DEFERRED FINANCING S 714,160 0 0 0 0 0 DEFERRED FINANCING L 2,942,765 0 0 0 0 0 CAPITALIZED AMORT OF 438,001 0 0 0 0 0 CAPITALIZED CONSTR I 923,957 107,794 0 0 0 0 CAPITALIZED INTEREST 6,722,195 0 0 0 0 0 Total 119,869,447 2,577,263 293,333 322,667 354,933 366,025 Percent increase N.A. -97.8 -88.6 10.0 10.0 3.1

Table 3.5.2.1 Fountaingate Gardens CAPITAL EXPENDITURES CASH FLOW METHODOLOGY SUMMED FOR ALL CARE LEVELS TOTAL EXPENSES PER YEAR FOR YEARS 2019 TO 2039 Category 2025 2026 2027 2028 2029 2030 -------------------- ---------------- ---------------- ---------------- ---------------- ---------------- ---------------- LAND 0 0 0 0 0 0 BUILDING 0 0 0 0 0 0 DESIGN & OTHER FEES 0 0 0 0 0 0 BLDG IMPROVEMENTS 0 0 0 400,000 800,000 1,200,000 FURNISHINGS & EQUIPM 390,427 429,469 553,613 572,989 593,044 613,801 DEFERRED MARKETING 0 0 0 0 0 0 DEFERRED FINANCING S 0 0 0 0 0 0 DEFERRED FINANCING L 0 0 0 0 0 0 CAPITALIZED AMORT OF 0 0 0 0 0 0 CAPITALIZED CONSTR I 0 0 0 0 0 0 CAPITALIZED INTEREST 0 0 0 0 0 0 Total 390,427 429,469 553,613 972,989 1,393,044 1,813,801 Percent increase 6.7 10.0 28.9 75.8 43.2 30.2

Table 3.5.2.1 Fountaingate Gardens CAPITAL EXPENDITURES CASH FLOW METHODOLOGY SUMMED FOR ALL CARE LEVELS TOTAL EXPENSES PER YEAR FOR YEARS 2019 TO 2039 Category 2031 2032 2033 2034 2035 2036 -------------------- ---------------- ---------------- ---------------- ---------------- ---------------- ---------------- LAND 0 0 0 0 0 0 BUILDING 0 0 0 0 0 0 DESIGN & OTHER FEES 0 0 0 0 0 0 BLDG IMPROVEMENTS 1,600,000 2,000,000 2,400,000 2,800,000 3,200,000 3,312,000 FURNISHINGS & EQUIPM 635,284 657,519 680,532 704,350 729,003 754,518 DEFERRED MARKETING 0 0 0 0 0 0 DEFERRED FINANCING S 0 0 0 0 0 0 DEFERRED FINANCING L 0 0 0 0 0 0 CAPITALIZED AMORT OF 0 0 0 0 0 0 CAPITALIZED CONSTR I 0 0 0 0 0 0 CAPITALIZED INTEREST 0 0 0 0 0 0 Total 2,235,284 2,657,519 3,080,532 3,504,350 3,929,003 4,066,518 Percent increase 23.2 18.9 15.9 13.8 12.1 3.5

Table 3.5.2.1 Fountaingate Gardens CAPITAL EXPENDITURES CASH FLOW METHODOLOGY SUMMED FOR ALL CARE LEVELS TOTAL EXPENSES PER YEAR FOR YEARS 2019 TO 2039 Category 2037 2038 2039 -------------------- ---------------- ---------------- ---------------- LAND 0 0 0 BUILDING 0 0 0 DESIGN & OTHER FEES 0 0 0 BLDG IMPROVEMENTS 3,427,920 3,547,897 3,672,074 FURNISHINGS & EQUIPM 780,926 808,258 836,547 DEFERRED MARKETING 0 0 0 DEFERRED FINANCING S 0 0 0 DEFERRED FINANCING L 0 0 0 CAPITALIZED AMORT OF 0 0 0 CAPITALIZED CONSTR I 0 0 0 CAPITALIZED INTEREST 0 0 0 Total 4,208,846 4,356,155 4,508,621 Percent increase 3.5 3.5 3.5
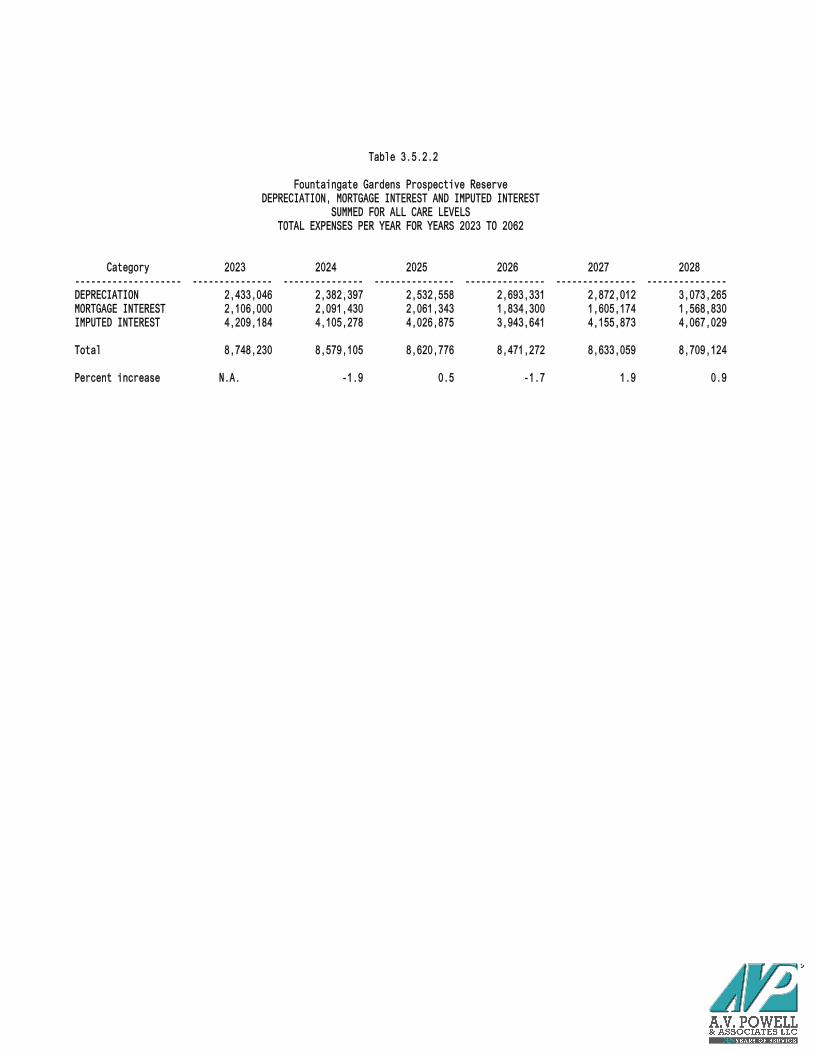
Table 3.5.2.2 Fountaingate Gardens Prospective Reserve DEPRECIATION, MORTGAGE INTEREST AND IMPUTED INTEREST SUMMED FOR ALL CARE LEVELS TOTAL EXPENSES PER YEAR FOR YEARS 2023 TO 2062 Category 2023 2024 2025 2026 2027 2028 -------------------- --------------- --------------- --------------- --------------- --------------- --------------- DEPRECIATION 2,433,046 2,382,397 2,532,558 2,693,331 2,872,012 3,073,265 MORTGAGE INTEREST 2,106,000 2,091,430 2,061,343 1,834,300 1,605,174 1,568,830 IMPUTED INTEREST 4,209,184 4,105,278 4,026,875 3,943,641 4,155,873 4,067,029 Total 8,748,230 8,579,105 8,620,776 8,471,272 8,633,059 8,709,124 Percent increase N.A. -1.9 0.5 -1.7 1.9 0.9

Table 3.5.2.2 Fountaingate Gardens Prospective Reserve DEPRECIATION, MORTGAGE INTEREST AND IMPUTED INTEREST SUMMED FOR ALL CARE LEVELS TOTAL EXPENSES PER YEAR FOR YEARS 2023 TO 2062 Category 2029 2030 2031 2032 2033 2034 -------------------- --------------- --------------- --------------- --------------- --------------- --------------- DEPRECIATION 3,298,272 3,238,607 2,657,694 2,861,553 3,085,352 3,332,896 MORTGAGE INTEREST 1,530,124 1,488,902 1,445,000 1,398,245 1,348,451 1,295,420 IMPUTED INTEREST 3,990,852 3,926,302 3,887,770 3,901,482 3,928,378 3,967,646 Total 8,819,248 8,653,811 7,990,464 8,161,280 8,362,181 8,595,962 Percent increase 1.3 -1.9 -7.7 2.1 2.5 2.8

Table 3.5.2.2 Fountaingate Gardens Prospective Reserve DEPRECIATION, MORTGAGE INTEREST AND IMPUTED INTEREST SUMMED FOR ALL CARE LEVELS TOTAL EXPENSES PER YEAR FOR YEARS 2023 TO 2062 Category 2035 2036 2037 2038 2039 2040 -------------------- --------------- --------------- --------------- --------------- --------------- --------------- DEPRECIATION 3,603,715 3,888,433 4,176,916 4,483,115 4,808,031 5,152,719 MORTGAGE INTEREST 1,238,942 1,178,793 1,114,734 1,046,511 973,854 896,474 IMPUTED INTEREST 4,018,296 4,079,373 4,136,002 4,188,425 4,236,208 4,278,887 Total 8,860,953 9,146,599 9,427,652 9,718,051 10,018,093 10,328,080 Percent increase 3.1 3.2 3.1 3.1 3.1 3.1

Table 3.5.2.2 Fountaingate Gardens Prospective Reserve DEPRECIATION, MORTGAGE INTEREST AND IMPUTED INTEREST SUMMED FOR ALL CARE LEVELS TOTAL EXPENSES PER YEAR FOR YEARS 2023 TO 2062 Category 2041 2042 2043 2044 2045 2046 -------------------- --------------- --------------- --------------- --------------- --------------- --------------- DEPRECIATION 5,518,292 5,905,922 6,316,843 6,752,357 7,213,835 7,702,722 MORTGAGE INTEREST 814,065 726,299 632,828 533,282 427,265 314,357 IMPUTED INTEREST 4,315,969 4,346,929 4,371,209 4,388,218 4,397,326 4,397,865 Total 10,648,326 10,979,150 11,320,880 11,673,857 12,038,426 12,414,944 Percent increase 3.1 3.1 3.1 3.1 3.1 3.1

Table 3.5.2.2 Fountaingate Gardens Prospective Reserve DEPRECIATION, MORTGAGE INTEREST AND IMPUTED INTEREST SUMMED FOR ALL CARE LEVELS TOTAL EXPENSES PER YEAR FOR YEARS 2023 TO 2062 Category 2047 2048 2049 2050 2051 2052 -------------------- --------------- --------------- --------------- --------------- --------------- --------------- DEPRECIATION 8,220,540 8,736,796 9,251,575 9,573,538 10,076,083 10,576,987 MORTGAGE INTEREST 194,110 66,047 0 0 0 0 IMPUTED INTEREST 4,389,127 4,370,359 4,342,369 4,197,783 4,048,229 3,885,066 Total 12,803,777 13,173,202 13,593,944 13,771,321 14,124,312 14,462,053 Percent increase 3.1 2.9 3.2 1.3 2.6 2.4

Table 3.5.2.2 Fountaingate Gardens Prospective Reserve DEPRECIATION, MORTGAGE INTEREST AND IMPUTED INTEREST SUMMED FOR ALL CARE LEVELS TOTAL EXPENSES PER YEAR FOR YEARS 2023 TO 2062 Category 2053 2054 2055 2056 2057 2058 -------------------- --------------- --------------- --------------- --------------- --------------- --------------- DEPRECIATION 11,076,354 11,574,302 10,444,168 5,860,252 6,065,361 6,277,649 MORTGAGE INTEREST 0 0 0 0 0 0 IMPUTED INTEREST 3,708,781 3,519,868 3,318,828 3,187,514 3,299,077 3,414,545 Total 14,785,135 15,094,170 13,762,996 9,047,766 9,364,438 9,692,194 Percent increase 2.2 2.1 -8.8 -34.3 3.5 3.5

Table 3.5.2.2 Fountaingate Gardens Prospective Reserve DEPRECIATION, MORTGAGE INTEREST AND IMPUTED INTEREST SUMMED FOR ALL CARE LEVELS TOTAL EXPENSES PER YEAR FOR YEARS 2023 TO 2062 Category 2059 2060 2061 2062 -------------------- --------------- --------------- --------------- --------------- DEPRECIATION 6,497,366 6,724,774 6,960,141 7,203,746 MORTGAGE INTEREST 0 0 0 0 IMPUTED INTEREST 3,534,054 3,657,746 3,785,767 3,918,269 Total 10,031,420 10,382,520 10,745,908 11,122,015 Percent increase 3.5 3.5 3.5 3.5

TABLE 3.5.3 Interest Expense for Fountaingate Gardens Fiscal Year CONSTRUCTION L LONG TERM SHORT TERM SUBORDINATED D Total ----------- -------------- --------- ---------- -------------- ------- 2020 655,023 2,106,000 3,125,000 108,406 5,994,429 2021 0 2,106,000 1,375,000 111,148 3,592,148 2022 0 2,106,000 0 56,623 2,162,623 2023 0 2,106,000 0 0 2,106,000 2024 0 2,091,430 0 0 2,091,430 2025 0 2,061,343 0 0 2,061,343 2026 0 1,834,300 0 0 1,834,300 2027 0 1,605,174 0 0 1,605,174 2028 0 1,568,830 0 0 1,568,830 2029 0 1,530,124 0 0 1,530,124 2030 0 1,488,902 0 0 1,488,902 2031 0 1,445,000 0 0 1,445,000 2032 0 1,398,245 0 0 1,398,245 2033 0 1,348,451 0 0 1,348,451 2034 0 1,295,420 0 0 1,295,420 2035 0 1,238,942 0 0 1,238,942 2036 0 1,178,793 0 0 1,178,793 2037 0 1,114,734 0 0 1,114,734 2038 0 1,046,511 0 0 1,046,511 2039 0 973,854 0 0 973,854 2040 0 896,474 0 0 896,474 2041 0 814,065 0 0 814,065 2042 0 726,299 0 0 726,299 2043 0 632,828 0 0 632,828 2044 0 533,282 0 0 533,282 2045 0 427,265 0 0 427,265 2046 0 314,357 0 0 314,357 2047 0 194,110 0 0 194,110 2048 0 66,047 0 0 66,047 -------- ---------- --------- -------- ---------- Totals 655,023 36,248,780 4,500,000 276,177 41,679,980

TABLE 3.5.3 Principal Payment Expense for Fountaingate Gardens Fiscal Year CONSTRUCTION L LONG TERM SHORT TERM SUBORDINATED D Total ----------- -------------- --------- ---------- -------------- ------- 2020 29,408,091 0 20,000,000 0 49,408,091 2021 0 0 42,500,000 0 42,500,000 2022 0 0 0 4,562,956 4,562,956 2023 0 0 0 0 0 2024 0 448,311 0 0 448,311 2025 0 477,451 0 0 477,451 2026 0 6,508,486 0 0 6,508,486 2027 0 541,537 0 0 541,537 2028 0 576,737 0 0 576,737 2029 0 614,225 0 0 614,225 2030 0 654,150 0 0 654,150 2031 0 696,669 0 0 696,669 2032 0 741,953 0 0 741,953 2033 0 790,180 0 0 790,180 2034 0 841,542 0 0 841,542 2035 0 896,242 0 0 896,242 2036 0 954,497 0 0 954,497 2037 0 1,016,540 0 0 1,016,540 2038 0 1,082,615 0 0 1,082,615 2039 0 1,152,985 0 0 1,152,985 2040 0 1,227,929 0 0 1,227,929 2041 0 1,307,744 0 0 1,307,744 2042 0 1,392,748 0 0 1,392,748 2043 0 1,483,276 0 0 1,483,276 2044 0 1,579,689 0 0 1,579,689 2045 0 1,682,369 0 0 1,682,369 2046 0 1,791,723 0 0 1,791,723 2047 0 1,908,185 0 0 1,908,185 2048 0 2,032,217 0 0 2,032,217 ---------- ---------- ---------- --------- ------------ Totals 29,408,091 32,400,000 62,500,000 4,562,956 128,871,047

Table 3.6.1 Fountaingate Gardens All operating expenses less all Direct Billing Revenues for INDEPENDENT LIVING Total expenses per year for years 2020 to 2029 Category 2020 2021 2022 2023 2024 2025 -------------------- --------------- --------------- --------------- --------------- --------------- --------------- GENERAL & ADMINISTRA 2,198,575 2,182,009 2,287,953 2,228,130 2,306,115 2,386,829 HOUSEKEEPING 385,742 585,541 630,603 710,733 779,604 825,911 PLANT OPERATIONS 687,636 773,057 806,901 911,511 951,896 988,974 FOOD SERVICE 1,282,032 2,102,341 2,347,841 2,436,476 2,490,650 2,550,837 HEALTH CARE 103,474 133,165 137,825 164,343 170,095 305,619 UTILITIES & PROP TAX 1,966,921 2,035,763 2,107,015 2,180,761 2,257,087 2,336,085 LAND LEASE 0 216,000 223,560 231,385 239,483 247,865 MANAGEMENT FEE 264,780 346,817 383,011 415,244 451,064 494,912 ASSISTED LIVING 0 0 0 0 0 0 SKILLED NURSING 0 0 0 0 0 0 OTHER INCOME -186,669 -462,386 -568,608 -609,824 -624,654 -641,098 Total 6,702,491 7,912,307 8,356,101 8,668,759 9,021,340 9,495,934 Percent increase N.A. 18.1 5.6 3.7 4.1 5.3

Table 3.6.1 Fountaingate Gardens All operating expenses less all Direct Billing Revenues for INDEPENDENT LIVING Total expenses per year for years 2020 to 2029 Category 2026 2027 2028 2029 -------------------- --------------- --------------- --------------- --------------- GENERAL & ADMINISTRA 2,470,368 2,556,831 2,646,320 2,738,941 HOUSEKEEPING 874,637 916,402 948,476 981,673 PLANT OPERATIONS 1,105,664 1,148,392 1,188,586 1,230,186 FOOD SERVICE 2,620,922 2,699,306 2,793,782 2,891,564 HEALTH CARE 316,316 327,387 338,846 350,705 UTILITIES & PROP TAX 2,417,848 2,502,473 2,590,060 2,680,712 LAND LEASE 256,540 265,519 274,812 284,431 MANAGEMENT FEE 537,490 574,529 594,638 615,450 ASSISTED LIVING 0 0 0 0 SKILLED NURSING 0 0 0 0 OTHER INCOME -659,829 -680,203 -704,010 -728,650 Total 9,939,956 10,310,636 10,671,508 11,045,011 Percent increase 4.7 3.7 3.5 3.5
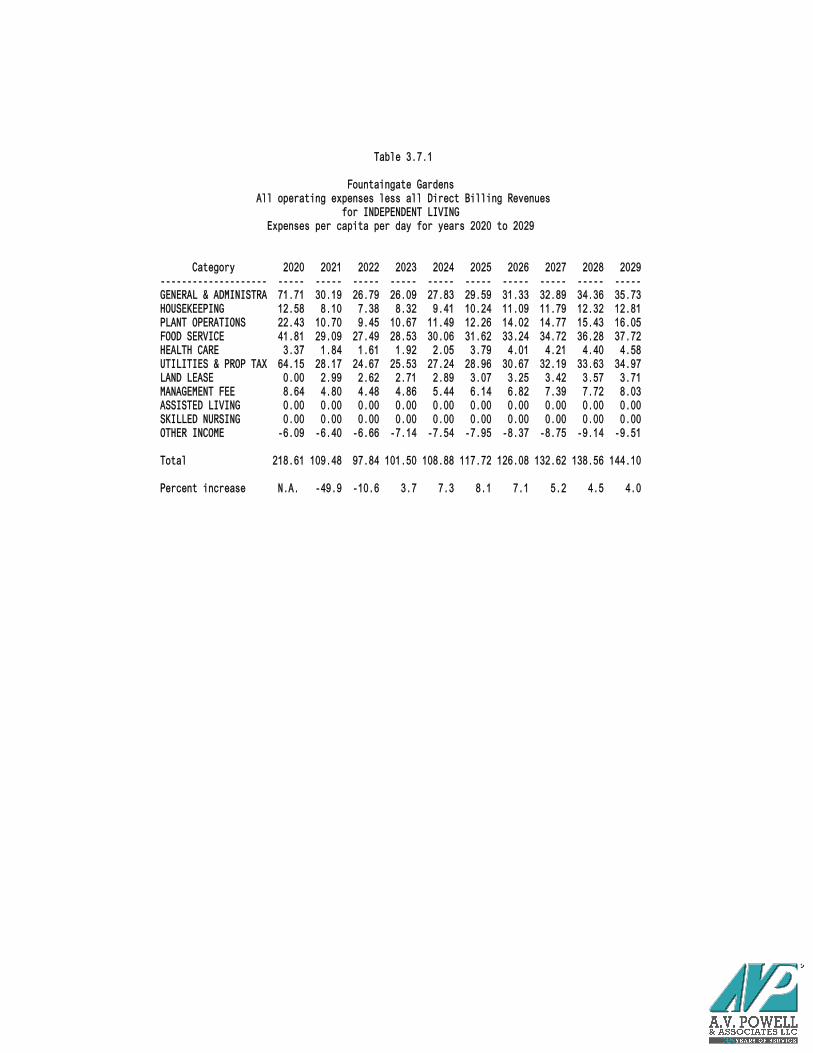
Table 3.7.1 Fountaingate Gardens All operating expenses less all Direct Billing Revenues for INDEPENDENT LIVING Expenses per capita per day for years 2020 to 2029 Category 2020 2021 2022 2023 2024 2025 2026 2027 2028 2029 -------------------- ----- ----- ----- ----- ----- ----- ----- ----- ----- ----- GENERAL & ADMINISTRA 71.71 30.19 26.79 26.09 27.83 29.59 31.33 32.89 34.36 35.73 HOUSEKEEPING 12.58 8.10 7.38 8.32 9.41 10.24 11.09 11.79 12.32 12.81 PLANT OPERATIONS 22.43 10.70 9.45 10.67 11.49 12.26 14.02 14.77 15.43 16.05 FOOD SERVICE 41.81 29.09 27.49 28.53 30.06 31.62 33.24 34.72 36.28 37.72 HEALTH CARE 3.37 1.84 1.61 1.92 2.05 3.79 4.01 4.21 4.40 4.58 UTILITIES & PROP TAX 64.15 28.17 24.67 25.53 27.24 28.96 30.67 32.19 33.63 34.97 LAND LEASE 0.00 2.99 2.62 2.71 2.89 3.07 3.25 3.42 3.57 3.71 MANAGEMENT FEE 8.64 4.80 4.48 4.86 5.44 6.14 6.82 7.39 7.72 8.03 ASSISTED LIVING 0.00 0.00 0.00 0.00 0.00 0.00 0.00 0.00 0.00 0.00 SKILLED NURSING 0.00 0.00 0.00 0.00 0.00 0.00 0.00 0.00 0.00 0.00 OTHER INCOME -6.09 -6.40 -6.66 -7.14 -7.54 -7.95 -8.37 -8.75 -9.14 -9.51 Total 218.61 109.48 97.84 101.50 108.88 117.72 126.08 132.62 138.56 144.10 Percent increase N.A. -49.9 -10.6 3.7 7.3 8.1 7.1 5.2 4.5 4.0

Table 3.7.2 Fountaingate Gardens Pricing All operating expenses less all Direct Billing Revenues for ASSISTED LIVING Expenses per capita per day for years 2020 to 2029 Category 2020 2021 2022 2023 2024 2025 2026 2027 2028 2029 -------------------- ----- ----- ----- ----- ----- ----- ----- ----- ----- ----- GENERAL & ADMINISTRA 0.00 0.00 0.00 0.00 0.00 0.00 0.00 0.00 0.00 0.00 HOUSEKEEPING 0.00 0.00 0.00 0.00 0.00 0.00 0.00 0.00 0.00 0.00 PLANT OPERATIONS 0.00 0.00 0.00 0.00 0.00 0.00 0.00 0.00 0.00 0.00 FOOD SERVICE 0.00 0.00 0.00 0.00 0.00 0.00 0.00 0.00 0.00 0.00 HEALTH CARE 0.00 0.00 0.00 0.00 0.00 0.00 0.00 0.00 0.00 0.00 UTILITIES & PROP TAX 0.00 0.00 0.00 0.00 0.00 0.00 0.00 0.00 0.00 0.00 LAND LEASE 0.00 0.00 0.00 0.00 0.00 0.00 0.00 0.00 0.00 0.00 MANAGEMENT FEE 0.00 0.00 0.00 0.00 0.00 0.00 0.00 0.00 0.00 0.00 ASSISTED LIVING 201.93 209.00 216.31 223.88 231.72 239.83 248.22 256.91 265.90 275.21 SKILLED NURSING 0.00 0.00 0.00 0.00 0.00 0.00 0.00 0.00 0.00 0.00 OTHER INCOME 0.00 0.00 0.00 0.00 0.00 0.00 0.00 0.00 0.00 0.00 Total 201.93 209.00 216.31 223.88 231.72 239.83 248.22 256.91 265.90 275.21 Percent increase N.A. 3.5 3.5 3.5 3.5 3.5 3.5 3.5 3.5 3.5

Table 3.7.3 Fountaingate Gardens Pricing All operating expenses less all Direct Billing Revenues for NURSING CARE Expenses per capita per day for years 2020 to 2029 Category 2020 2021 2022 2023 2024 2025 2026 2027 2028 2029 -------------------- ----- ----- ----- ----- ----- ----- ----- ----- ----- ----- GENERAL & ADMINISTRA 0.00 0.00 0.00 0.00 0.00 0.00 0.00 0.00 0.00 0.00 HOUSEKEEPING 0.00 0.00 0.00 0.00 0.00 0.00 0.00 0.00 0.00 0.00 PLANT OPERATIONS 0.00 0.00 0.00 0.00 0.00 0.00 0.00 0.00 0.00 0.00 FOOD SERVICE 0.00 0.00 0.00 0.00 0.00 0.00 0.00 0.00 0.00 0.00 HEALTH CARE 0.00 0.00 0.00 0.00 0.00 0.00 0.00 0.00 0.00 0.00 UTILITIES & PROP TAX 0.00 0.00 0.00 0.00 0.00 0.00 0.00 0.00 0.00 0.00 LAND LEASE 0.00 0.00 0.00 0.00 0.00 0.00 0.00 0.00 0.00 0.00 MANAGEMENT FEE 0.00 0.00 0.00 0.00 0.00 0.00 0.00 0.00 0.00 0.00 ASSISTED LIVING 0.00 0.00 0.00 0.00 0.00 0.00 0.00 0.00 0.00 0.00 SKILLED NURSING 532.47 551.11 570.40 590.36 611.02 632.41 654.54 677.45 701.16 725.70 OTHER INCOME 0.00 0.00 0.00 0.00 0.00 0.00 0.00 0.00 0.00 0.00 Total 532.47 551.11 570.40 590.36 611.02 632.41 654.54 677.45 701.16 725.70 Percent increase N.A. 3.5 3.5 3.5 3.5 3.5 3.5 3.5 3.5 3.5

Table 4.1
Fountaingate Gardens Valuation Actuarial Valuation StatementAs of June 30, 2022
Survivorship Probabilities Projection Methodology
CurrentValuation
(1) NET ASSETS:Current Assets ............................... $ 17,122,783Other Assets ................................. 5,139,432Actuarial Present Value of Net Fixed Assets .. 120,636,159Current Liabilities .......................... (726,873)Other Liabilities ............................ 0Actuarial Present Value of Long-Term Debt .... (37,350,518)
--------------Subtotal ................................ $ 104,820,982
(2) ACTUARIAL LIABILITIES:PV INDEPENDENT LIVING Operating Expenses ..... $ 72,124,230PV ASSISTED LIVING Operating Expenses ........ 11,745,372PV NURSING CARE Operating Expenses ........... 29,287,294PV INDEPENDENT LIVING Capital Expenses ....... 56,442,644PV ASSISTED LIVING Capital Expenses .......... 0PV NURSING CARE Capital Expenses ............. 0
--------------Subtotal ................................ $ 169,599,540
(3) ACTUARIAL ASSETS:PV of Monthly Revenues ....................... $ 115,374,581PV of Monthly Revenue Deductions ............. 0
--------------Subtotal................................. $ 115,374,581
(4) EXCESS OF ACTUARIAL LIABILITIESOVER ACTUARIAL ASSETS {(2) - (3)}:............ $ 54,224,959
(5) ACTUARIAL REFUND LIABILITY: ................... $ 44,167,592
(6) ACTUARIAL SURPLUS (DEFICIT) {(1) - (4) - (5)}: $ 6,428,431
(7) FUNDED STATUS {1.0 + [(6) ÷ [(2) + (5)]]}: .... 103.0%(8) ACTUARIAL RATIO {(3) ÷ (2)}: .................. 68.0%(9) LIQUID RESERVE RATIO {Liquid assets ÷ (4)+(5)}: 22.3%
CURRENT YEAR VARYING OCCUPANCY CONSTANT OCCUPANCYKEY ASSUMPTIONS: 2023 No Years 2024 to 2083
Monthly fee inflation . . . . . . . . . 0% N.A. 3.5%Perdiem inflation . . . . . . . . . . . 0% N.A. 3.5%Other revenue inflation . . . . . . . . 7.3% N.A. 2.4 to 3.5%Operating expense inflation . . . . . . 4% N.A. 3.5 to 5%Capital expenditure inflation . . . . . 10% N.A. 3.1 to 75.8%Cost of capital interest rate . . . . . 5% N.A. 5%Interest discount rate . . . . . . . . . 5% N.A. 5%Independent Living Occupancy . . . . . 93.8% N.A. 93.8%Assisted Living Occupancy . . . . . . . 0% N.A. 0%Nursing Care Occupancy . . . . . . . . . 0% N.A. 0%

Table 4.4 Fountaingate Gardens Valuation Documentation of Net Asset Calculation for Actuarial Valuation as of 06/30/2022 Current assets (a) Cash and cash equivalents . . . . . . . . . . . . . . . . . . . . . . . . . . . . . . . . . . . . . 16,831,568 Accounts receivable . . . . . . . . . . . . . . . . . . . . . . . . . . . . . . . . . . . . . . . . 149,008 Prepaid expenses . . . . . . . . . . . . . . . . . . . . . . . . . . . . . . . . . . . . . . . . . . 142,207 -------------- Subtotal current assets . . . . . . . . . . . . . . . . . . . . . . . . . . . . . . . . . . . 17,122,783 Other assets (a) Debt service reserve fund . . . . . . . . . . . . . . . . . . . . . . . . . . . . . . . . . . . . . 2,656,200 Construction fund and interest . . . . . . . . . . . . . . . . . . . . . . . . . . . . . . . . . . . 0 Capitalized interest fund . . . . . . . . . . . . . . . . . . . . . . . . . . . . . . . . . . . . . 0 Operating reserve fund . . . . . . . . . . . . . . . . . . . . . . . . . . . . . . . . . . . . . . . 2,483,232 -------------- Subtotal other assets . . . . . . . . . . . . . . . . . . . . . . . . . . . . . . . . . . . . 5,139,432 Actuarial PV of net fixed assets . . . . . . . . . . . . . . . . . . . . . . . . . . . . . . . . . . 120,636,159 -------------- ACTUARIAL VALUATION ASSETS . . . . . . . . . . . . . . . . . . . . . . . . . . . . . . . . . . . . . . . 142,898,374 ============== Current liabilities (a) Accounts payable . . . . . . . . . . . . . . . . . . . . . . . . . . . . . . . . . . . . . . . . . . 633,551 Accrued expenses . . . . . . . . . . . . . . . . . . . . . . . . . . . . . . . . . . . . . . . . . . 93,322 -------------- Subtotal current liabilities . . . . . . . . . . . . . . . . . . . . . . . . . . . . . . . . . 726,873 Other liabilities (a) Deposits . . . . . . . . . . . . . . . . . . . . . . . . . . . . . . . . . . . . . . . . . . . . . . 0 -------------- Subtotal other liabilities . . . . . . . . . . . . . . . . . . . . . . . . . . . . . . . . . . 0 Actuarial PV of long term debt . . . . . . . . . . . . . . . . . . . . . . . . . . . . . . . . . . . 37,350,518 -------------- ACTUARIAL VALUATION LIABILITIES . . . . . . . . . . . . . . . . . . . . . . . . . . . . . . . . . . . . 38,077,391 ============== ACTUARIAL NET ASSETS . . . . . . . . . . . . . . . . . . . . . . . . . . . . . . . . . . . . . . . . . . 104,820,982 ============== SOURCES: (a) 06/30/2022, Projected Balance Sheet (b) AVP LLC Actuarial Valuation (Table 4.1)

Table 4.5 Fountaingate Gardens Documentation of Initial Cash Balance as of 06/30/2019 for Interest Income in Financial Projections Cash and cash equivalents . . . . . . . . . . . . . . . . . . . . . . . . . . . . . . . . . . . . . 0 Debt service reserve fund . . . . . . . . . . . . . . . . . . . . . . . . . . . . . . . . . . . . . 5,781,200 Construction fund and interest . . . . . . . . . . . . . . . . . . . . . . . . . . . . . . . . . . . 2,802,520 Capitalized interest fund . . . . . . . . . . . . . . . . . . . . . . . . . . . . . . . . . . . . . 2,179,583 -------------- Total initial cash balance . . . . . . . . . . . . . . . . . . . . . . . . . . . . . . . . . . 10,763,303 ============== SOURCE: (a) 06/30/2019, Projected Balance Sheet

Table 5.1 Analysis of New Entrant Fees for Contract Type 10 (80% REFUNDABLE MODIFIED) Entrants to Fountaingate Gardens Pricing Single Single PV of Actuarial Actuarial Percent Entry Monthly Monthly Assets Liability Surplus SINGLE ENTRANTS * Fee Fee Fees NEF+PVMF PVFE (Deficit) ------------------------ ------- ------- ------- --------- --------- --------- 101 ONE BEDROOM SMALL 648,646 3,825 355,464 647,946 579,563 11.8 % 102 ONE BEDROOM LARGE 654,386 3,825 355,464 650,534 581,063 12.0 103 ONE BR DEN SMALL 743,934 4,302 399,792 735,241 628,321 17.0 104 ONE BR DEN MEDIUM 824,297 4,690 435,849 807,535 660,576 22.2 105 ONE BR DEN LARGE 914,993 5,034 467,818 880,400 709,334 24.1 106 TWO BEDROOM SMALL 811,669 4,690 435,849 801,841 666,952 20.2 107 TWO BEDROOM LARGE 854,146 4,989 463,636 848,781 692,831 22.5 108 TWO BEDROOM DEN SMAL 945,990 5,411 502,853 929,412 750,591 23.8 109 TWO BEDROOM DEN LARG 978,135 5,632 523,391 964,444 776,845 24.1 110 VILLA ONE BR 830,037 4,590 426,556 800,830 639,573 25.2 111 VILLA ONE BR DEN 885,144 4,801 446,165 845,287 669,577 26.2 112 VILLA TWO BR SMALL 965,507 5,455 506,942 942,301 729,962 29.1 113 VILLA TWO BR MEDIUM 1,065,387 5,909 549,133 1,029,529 776,470 32.6 114 VILLA TWO BR LARGE 1,103,272 5,954 553,315 1,050,794 796,723 31.9 115 VILLA TWO BR DEN 1,117,049 6,242 580,079 1,083,771 853,732 26.9 WEIGHTED SINGLE: 800,760 4,564 424,115 785,188 652,653 20.3 % Both Both PV of Actuarial Actuarial Percent Entry Monthly Monthly Assets Liability Surplus COUPLED ENTRANTS * Fees Fees Fees NEF+PVMF PVFE (Deficit) ------------------------ ------- ------- ------- --------- --------- --------- 103 ONE BR DEN SMALL 773,783 5,244 556,458 943,038 905,776 4.1 % 104 ONE BR DEN MEDIUM 854,146 5,632 601,824 1,028,553 946,063 8.7 105 ONE BR DEN LARGE 944,842 5,976 642,045 1,114,086 1,006,963 10.6 106 TWO BEDROOM SMALL 841,518 5,632 601,824 1,022,244 954,027 7.2 107 TWO BEDROOM LARGE 883,995 5,931 636,783 1,078,426 986,350 9.3 108 TWO BEDROOM DEN SMAL 975,839 6,353 686,125 1,173,652 1,058,493 10.9 109 TWO BEDROOM DEN LARG 1,007,984 6,574 711,965 1,215,551 1,091,285 11.4 110 VILLA ONE BR 859,886 5,532 590,131 1,019,729 919,830 10.9 111 VILLA ONE BR DEN 914,993 5,743 614,802 1,071,931 957,306 12.0 112 VILLA TWO BR SMALL 995,356 6,397 691,269 1,188,547 1,032,728 15.1 113 VILLA TWO BR MEDIUM 1,095,236 6,851 744,352 1,291,530 1,090,816 18.4 114 VILLA TWO BR LARGE 1,133,121 6,896 749,614 1,315,719 1,116,113 17.9 115 VILLA TWO BR DEN 1,146,538 7,184 783,287 1,356,095 1,187,318 14.2 WEIGHTED COUPLE: 1,012,687 6,454 697,980 1,203,917 1,058,702 13.7 % TYPICAL ENTRANT: 910,770 5,545 566,276 1,002,546 863,429 16.1 % CURRENT YEAR VARYING OCCUPANCY CONSTANT OCCUPANCY KEY ASSUMPTIONS: 2023 No Years 2024 to 2083 Monthly fee inflation . . . . . . . . . 0% N.A. 3.5% Perdiem inflation . . . . . . . . . . . 0% N.A. 3.5% Other revenue inflation . . . . . . . . 7.3% N.A. 2.4 to 3.5% Operating expense inflation . . . . . . 4% N.A. 3.5 to 5% Capital expenditure inflation . . . . . 10% N.A. 3.1 to 75.8% Cost of capital interest rate . . . . . 5% N.A. 5% Interest discount rate . . . . . . . . . 5% N.A. 5%

Table 5.2 Analysis of New Entrant Fees for Contract Type 11 (50% REFUNDABLE MODIFIED) Entrants to Fountaingate Gardens Pricing Single Single PV of Actuarial Actuarial Percent Entry Monthly Monthly Assets Liability Surplus SINGLE ENTRANTS * Fee Fee Fees NEF+PVMF PVFE (Deficit) ------------------------ ------- ------- ------- --------- --------- --------- 101 ONE BEDROOM SMALL 486,485 3,825 355,464 667,281 579,563 15.1 % 102 ONE BEDROOM LARGE 490,790 3,825 355,464 670,040 581,063 15.3 103 ONE BR DEN SMALL 557,951 4,302 399,792 757,416 628,321 20.5 104 ONE BR DEN MEDIUM 618,223 4,690 435,849 832,106 660,576 26.0 105 ONE BR DEN LARGE 686,245 5,034 467,818 907,673 709,334 28.0 106 TWO BEDROOM SMALL 608,752 4,690 435,849 826,035 666,952 23.9 107 TWO BEDROOM LARGE 640,610 4,989 463,636 874,241 692,831 26.2 108 TWO BEDROOM DEN SMAL 709,493 5,411 502,853 957,610 750,591 27.6 109 TWO BEDROOM DEN LARG 733,602 5,632 523,391 993,601 776,845 27.9 110 VILLA ONE BR 622,528 4,590 426,556 825,572 639,573 29.1 111 VILLA ONE BR DEN 663,858 4,801 446,165 871,671 669,577 30.2 112 VILLA TWO BR SMALL 724,130 5,455 506,942 971,080 729,962 33.0 113 VILLA TWO BR MEDIUM 799,040 5,909 549,133 1,061,286 776,470 36.7 114 VILLA TWO BR LARGE 827,454 5,954 553,315 1,083,680 796,723 36.0 115 VILLA TWO BR DEN 837,787 6,242 580,079 1,117,067 853,732 30.8 WEIGHTED SINGLE: 600,571 4,564 424,115 809,057 652,653 24.0 % Both Both PV of Actuarial Actuarial Percent Entry Monthly Monthly Assets Liability Surplus COUPLED ENTRANTS * Fees Fees Fees NEF+PVMF PVFE (Deficit) ------------------------ ------- ------- ------- --------- --------- --------- 103 ONE BR DEN SMALL 580,912 5,244 556,458 953,573 905,776 5.3 % 104 ONE BR DEN MEDIUM 641,184 5,632 601,824 1,040,141 946,063 9.9 105 ONE BR DEN LARGE 709,206 5,976 642,045 1,126,863 1,006,963 11.9 106 TWO BEDROOM SMALL 631,713 5,632 601,824 1,033,667 954,027 8.3 107 TWO BEDROOM LARGE 663,571 5,931 636,783 1,090,405 986,350 10.5 108 TWO BEDROOM DEN SMAL 732,454 6,353 686,125 1,186,835 1,058,493 12.1 109 TWO BEDROOM DEN LARG 756,563 6,574 711,965 1,229,156 1,091,285 12.6 110 VILLA ONE BR 645,489 5,532 590,131 1,031,392 919,830 12.1 111 VILLA ONE BR DEN 686,819 5,743 614,802 1,084,316 957,306 13.3 112 VILLA TWO BR SMALL 747,091 6,397 691,269 1,201,986 1,032,728 16.4 113 VILLA TWO BR MEDIUM 822,001 6,851 744,352 1,306,277 1,090,816 19.8 114 VILLA TWO BR LARGE 850,415 6,896 749,614 1,330,963 1,116,113 19.2 115 VILLA TWO BR DEN 860,748 7,184 783,287 1,371,700 1,187,318 15.5 WEIGHTED COUPLE: 760,118 6,454 697,980 1,217,602 1,058,702 15.0 % TYPICAL ENTRANT: 683,390 5,545 566,276 1,021,129 863,429 18.3 % CURRENT YEAR VARYING OCCUPANCY CONSTANT OCCUPANCY KEY ASSUMPTIONS: 2023 No Years 2024 to 2083 Monthly fee inflation . . . . . . . . . 0% N.A. 3.5% Perdiem inflation . . . . . . . . . . . 0% N.A. 3.5% Other revenue inflation . . . . . . . . 7.3% N.A. 2.4 to 3.5% Operating expense inflation . . . . . . 4% N.A. 3.5 to 5% Capital expenditure inflation . . . . . 10% N.A. 3.1 to 75.8% Cost of capital interest rate . . . . . 5% N.A. 5% Interest discount rate . . . . . . . . . 5% N.A. 5%

Table 5.3 Analysis of New Entrant Fees for Contract Type 20 (80% REFUNDABLE LIFECARE) Entrants to Fountaingate Gardens Pricing Single Single PV of Actuarial Actuarial Percent Entry Monthly Monthly Assets Liability Surplus SINGLE ENTRANTS * Fee Fee Fees NEF+PVMF PVFE (Deficit) ------------------------ ------- ------- ------- --------- --------- --------- 101 ONE BEDROOM SMALL 723,269 4,856 588,953 991,450 925,411 7.1 % 102 ONE BEDROOM LARGE 729,009 4,856 588,953 994,402 926,912 7.3 103 ONE BR DEN SMALL 818,557 5,333 646,805 1,098,314 974,169 12.7 104 ONE BR DEN MEDIUM 898,920 5,721 693,863 1,186,708 1,006,425 17.9 105 ONE BR DEN LARGE 989,616 6,065 735,585 1,275,080 1,055,182 20.8 106 TWO BEDROOM SMALL 886,292 5,721 693,863 1,180,213 1,012,801 16.5 107 TWO BEDROOM LARGE 928,769 6,020 730,127 1,238,325 1,038,680 19.2 108 TWO BEDROOM DEN SMAL 1,020,613 6,442 781,308 1,336,748 1,096,439 21.9 109 TWO BEDROOM DEN LARG 1,052,758 6,663 808,112 1,380,086 1,122,693 22.9 110 VILLA ONE BR 904,660 5,621 681,735 1,177,532 985,421 19.5 111 VILLA ONE BR DEN 959,767 5,832 707,325 1,231,468 1,015,426 21.3 112 VILLA TWO BR SMALL 1,040,130 6,486 786,645 1,352,123 1,075,811 25.7 113 VILLA TWO BR MEDIUM 1,140,010 6,941 841,829 1,458,682 1,122,318 30.0 114 VILLA TWO BR LARGE 1,177,896 6,985 847,165 1,483,505 1,142,572 29.8 115 VILLA TWO BR DEN 1,191,672 7,273 882,095 1,525,521 1,199,581 27.2 WEIGHTED SINGLE: 875,383 5,595 678,552 1,159,291 998,501 16.1 % Both Both PV of Actuarial Actuarial Percent Entry Monthly Monthly Assets Liability Surplus COUPLED ENTRANTS * Fees Fees Fees NEF+PVMF PVFE (Deficit) ------------------------ ------- ------- ------- --------- --------- --------- 103 ONE BR DEN SMALL 893,180 7,307 925,757 1,492,444 1,449,744 2.9 % 104 ONE BR DEN MEDIUM 973,543 7,695 982,691 1,594,797 1,490,031 7.0 105 ONE BR DEN LARGE 1,064,239 8,039 1,033,169 1,696,534 1,550,930 9.4 106 TWO BEDROOM SMALL 960,915 7,695 982,691 1,587,660 1,497,995 6.0 107 TWO BEDROOM LARGE 1,003,392 7,994 1,026,565 1,655,541 1,530,318 8.2 108 TWO BEDROOM DEN SMAL 1,095,236 8,416 1,088,489 1,769,372 1,602,461 10.4 109 TWO BEDROOM DEN LARG 1,127,381 8,637 1,120,918 1,819,969 1,635,253 11.3 110 VILLA ONE BR 979,283 7,595 968,017 1,583,367 1,463,797 8.2 111 VILLA ONE BR DEN 1,034,390 7,806 998,979 1,645,474 1,501,274 9.6 112 VILLA TWO BR SMALL 1,114,753 8,460 1,094,945 1,786,859 1,576,695 13.3 113 VILLA TWO BR MEDIUM 1,214,633 8,915 1,161,711 1,910,075 1,634,784 16.8 114 VILLA TWO BR LARGE 1,252,519 8,959 1,168,167 1,937,943 1,660,081 16.7 115 VILLA TWO BR DEN 1,266,295 9,247 1,210,428 1,987,989 1,731,286 14.8 WEIGHTED COUPLE: 1,132,122 8,518 1,103,400 1,805,131 1,602,670 12.6 % TYPICAL ENTRANT: 1,008,654 7,112 899,087 1,494,398 1,312,120 13.9 % CURRENT YEAR VARYING OCCUPANCY CONSTANT OCCUPANCY KEY ASSUMPTIONS: 2023 No Years 2024 to 2083 Monthly fee inflation . . . . . . . . . 0% N.A. 3.5% Perdiem inflation . . . . . . . . . . . 0% N.A. 3.5% Other revenue inflation . . . . . . . . 7.3% N.A. 2.4 to 3.5% Operating expense inflation . . . . . . 4% N.A. 3.5 to 5% Capital expenditure inflation . . . . . 10% N.A. 3.1 to 75.8% Cost of capital interest rate . . . . . 5% N.A. 5% Interest discount rate . . . . . . . . . 5% N.A. 5%

Table 5.4 Analysis of New Entrant Fees for Contract Type 21 (50% REFUNDABLE LIFECARE) Entrants to Fountaingate Gardens Pricing Single Single PV of Actuarial Actuarial Percent Entry Monthly Monthly Assets Liability Surplus SINGLE ENTRANTS * Fee Fee Fees NEF+PVMF PVFE (Deficit) ------------------------ ------- ------- ------- --------- --------- --------- 101 ONE BEDROOM SMALL 561,108 4,856 588,953 991,499 925,411 7.1 % 102 ONE BEDROOM LARGE 565,413 4,856 588,953 994,449 926,912 7.3 103 ONE BR DEN SMALL 632,574 5,333 646,805 1,098,320 974,169 12.7 104 ONE BR DEN MEDIUM 692,846 5,721 693,863 1,186,677 1,006,425 17.9 105 ONE BR DEN LARGE 760,868 6,065 735,585 1,275,007 1,055,182 20.8 106 TWO BEDROOM SMALL 683,375 5,721 693,863 1,180,187 1,012,801 16.5 107 TWO BEDROOM LARGE 715,233 6,020 730,127 1,238,280 1,038,680 19.2 108 TWO BEDROOM DEN SMAL 784,116 6,442 781,308 1,336,661 1,096,439 21.9 109 TWO BEDROOM DEN LARG 808,225 6,663 808,112 1,379,984 1,122,693 22.9 110 VILLA ONE BR 697,151 5,621 681,735 1,177,498 985,421 19.5 111 VILLA ONE BR DEN 738,481 5,832 707,325 1,231,409 1,015,426 21.3 112 VILLA TWO BR SMALL 798,753 6,486 786,645 1,352,027 1,075,811 25.7 113 VILLA TWO BR MEDIUM 873,663 6,941 841,829 1,458,540 1,122,318 30.0 114 VILLA TWO BR LARGE 902,077 6,985 847,165 1,483,346 1,142,572 29.8 115 VILLA TWO BR DEN 912,410 7,273 882,095 1,525,355 1,199,581 27.2 WEIGHTED SINGLE: 675,194 5,595 678,552 1,159,270 998,501 16.1 % Both Both PV of Actuarial Actuarial Percent Entry Monthly Monthly Assets Liability Surplus COUPLED ENTRANTS * Fees Fees Fees NEF+PVMF PVFE (Deficit) ------------------------ ------- ------- ------- --------- --------- --------- 103 ONE BR DEN SMALL 707,197 7,307 925,757 1,477,495 1,449,744 1.9 % 104 ONE BR DEN MEDIUM 767,469 7,695 982,691 1,578,216 1,490,031 5.9 105 ONE BR DEN LARGE 835,491 8,039 1,033,169 1,678,112 1,550,930 8.2 106 TWO BEDROOM SMALL 757,998 7,695 982,691 1,571,336 1,497,995 4.9 107 TWO BEDROOM LARGE 789,856 7,994 1,026,565 1,638,355 1,530,318 7.1 108 TWO BEDROOM DEN SMAL 858,739 8,416 1,088,489 1,750,321 1,602,461 9.2 109 TWO BEDROOM DEN LARG 882,848 8,637 1,120,918 1,800,265 1,635,253 10.1 110 VILLA ONE BR 771,774 7,595 968,017 1,566,670 1,463,797 7.0 111 VILLA ONE BR DEN 813,104 7,806 998,979 1,627,658 1,501,274 8.4 112 VILLA TWO BR SMALL 873,376 8,460 1,094,945 1,767,411 1,576,695 12.1 113 VILLA TWO BR MEDIUM 948,286 8,915 1,161,711 1,888,598 1,634,784 15.5 114 VILLA TWO BR LARGE 976,700 8,959 1,168,167 1,915,697 1,660,081 15.4 115 VILLA TWO BR DEN 987,033 9,247 1,210,428 1,965,464 1,731,286 13.5 WEIGHTED COUPLE: 886,403 8,518 1,103,400 1,785,330 1,602,670 11.4 % TYPICAL ENTRANT: 784,831 7,112 899,087 1,484,161 1,312,120 13.1 % CURRENT YEAR VARYING OCCUPANCY CONSTANT OCCUPANCY KEY ASSUMPTIONS: 2023 No Years 2024 to 2083 Monthly fee inflation . . . . . . . . . 0% N.A. 3.5% Perdiem inflation . . . . . . . . . . . 0% N.A. 3.5% Other revenue inflation . . . . . . . . 7.3% N.A. 2.4 to 3.5% Operating expense inflation . . . . . . 4% N.A. 3.5 to 5% Capital expenditure inflation . . . . . 10% N.A. 3.1 to 75.8% Cost of capital interest rate . . . . . 5% N.A. 5% Interest discount rate . . . . . . . . . 5% N.A. 5%

Table 6.1
Sources and Uses of Funds Projection for Fountaingate Gardens15% on 80% Ref No LC; 35% on 50% Ref No LC; 10% on 80% Ref LC; 40% on 50% Ref LC
(Dollars in Thousands)
2020 2021 2022 2023 2024 2025 2026 2027 2028 2029 ---- ---- ---- ---- ---- ---- ---- ---- ---- ----
CASH SOURCES: Independent living monthly fees ........ 3,727 9,226 11,413 12,223 12,519 12,841 13,210 13,619 14,052 14,511 Assisted living monthly fees ........... 6 27 76 171 304 453 610 748 866 993 Nursing care monthly fees .............. 3 14 40 85 149 229 322 416 526 635 Other revenue .......................... 187 462 569 610 625 641 660 680 704 729 Bond proceeds .......................... 663 0 0 0 0 0 0 0 0 0
-------- -------- -------- -------- -------- -------- -------- -------- -------- -------- Subtotal ............................. 4,585 9,729 12,098 13,089 13,597 14,164 14,801 15,463 16,148 16,868 Entry fees from unit turnover .......... 849 2,635 4,828 6,793 8,452 9,829 11,327 11,775 12,394 13,209 Entry fees from vacant units ........... 66,966 36,644 12,709 0 0 0 0 0 0 0 Entry fee refunds ...................... (576) (1,582) (2,379) (2,923) (3,360) (3,737) (4,257) (4,628) (4,673) (5,060) Interest income ........................ 706 710 802 1,191 1,445 1,730 1,906 2,103 2,456 2,823
-------- -------- -------- -------- -------- -------- -------- -------- -------- --------TOTAL CASH SOURCES: ...................... 72,530 48,136 28,058 18,150 20,133 21,985 23,776 24,714 26,326 27,841
CASH USES: General & Administrative ............... 2,199 2,182 2,288 2,228 2,306 2,387 2,470 2,557 2,646 2,739 Housekeeping ........................... 386 586 631 711 780 826 875 916 948 982 Plant Operations ....................... 688 773 807 912 952 989 1,106 1,148 1,189 1,230 Food Service ........................... 1,282 2,102 2,348 2,436 2,491 2,551 2,621 2,699 2,794 2,892 Health Care ............................ 103 133 138 164 170 306 316 327 339 351 Utilities & Prop Tax ................... 1,967 2,036 2,107 2,181 2,257 2,336 2,418 2,502 2,590 2,681 Land Lease ............................. 0 216 224 231 239 248 257 266 275 284 Management Fee ......................... 265 347 383 415 451 495 537 575 595 615 Assisted Living ........................ 11 51 148 318 538 771 985 1,172 1,327 1,445 Skilled Nursing ........................ 226 591 886 1,200 1,544 1,960 2,389 2,775 3,119 3,423
-------- -------- -------- -------- -------- -------- -------- -------- -------- -------- Subtotal ............................. 7,126 9,017 9,958 10,796 11,728 12,868 13,974 14,938 15,822 16,642 Capital expenditures ................... 2,577 293 323 355 366 390 429 554 973 1,393 Interest payments ...................... 5,994 3,592 2,163 2,106 2,091 2,061 1,834 1,605 1,569 1,530 Scheduled principal payments ........... 49,408 42,500 4,563 0 448 477 6,508 542 577 614
-------- -------- -------- -------- -------- -------- -------- -------- -------- --------TOTAL CASH USES: ......................... 65,106 55,403 17,007 13,257 14,633 15,797 22,746 17,638 18,940 20,180
CHANGE IN CASH BALANCE: .................. 7,424 (7,267) 11,051 4,893 5,500 6,188 1,030 7,076 7,385 7,662 BEGIN OF YEAR CASH BALANCE: .............. 10,763 18,187 10,920 21,971 26,865 32,364 38,552 39,582 46,658 54,043
-------- -------- -------- -------- -------- -------- -------- -------- -------- --------END OF YEAR CASH BALANCE: ................ 18,187 10,920 21,971 26,865 32,364 38,552 39,582 46,658 54,043 61,705
======== ======== ======== ======== ======== ======== ======== ======== ======== ========END OF YEAR DEBT PRINCIPAL: .............. 79,463 36,963 32,400 32,400 31,952 31,474 24,966 24,424 23,847 23,233 DEBT SERVICE RATIO: ...................... 1.18 0.84 2.69 3.49 3.30 3.59 1.17 4.55 4.89 5.22 CASH TO DEBT RATIO: ...................... 0.22 0.29 0.67 0.82 1.01 1.22 1.58 1.91 2.26 2.65
CURRENT YEAR VARYING OCCUPANCY CONSTANT OCCUPANCY KEY ASSUMPTIONS: 2020 2021 to 2023 2024 to 2080Monthly fee inflation . . . . . . . . . 0% 3.5% 3.5%Advance fee inflation . . . . . . . . . 2.7% 3% 3%Perdiem inflation . . . . . . . . . . . 0% 3.5% 3.5%Other revenue inflation . . . . . . . . 0% 7.3 to 100+% 2.4 to 3.5%Operating expense inflation . . . . . . 0% 8.4 to 26.5% 3.5 to 9.7%Capital expenditure inflation . . . . -97.9% -88.6 to 10% 3.1 to 75.8%Interest discount rate . . . . . . . . . 5% 5% 5%Independent Living Occupancy . . . . . 31.3% 74.4 to 93.8% 93.8%Assisted Living Occupancy . . . . . . . 0% 0% 0%Nursing Care Occupancy . . . . . . . . . 0% 0% 0%

Table 6.1
Sources and Uses of Funds Projection for Fountaingate Gardens15% on 80% Ref No LC; 35% on 50% Ref No LC; 10% on 80% Ref LC; 40% on 50% Ref LC
(Dollars in Thousands)
2030 2031 2032 2033 2034 2035 2036 2037 2038 2039 ---- ---- ---- ---- ---- ---- ---- ---- ---- ----
CASH SOURCES: Independent living monthly fees ........ 15,014 15,546 16,083 16,637 17,221 17,835 18,464 19,116 19,798 20,492 Assisted living monthly fees ........... 1,096 1,184 1,299 1,402 1,499 1,603 1,697 1,767 1,819 1,897 Nursing care monthly fees .............. 749 862 926 994 1,092 1,181 1,264 1,360 1,482 1,553 Other revenue .......................... 754 781 808 836 865 896 927 959 993 1,028 Bond proceeds .......................... 0 0 0 0 0 0 0 0 0 0
-------- -------- -------- -------- -------- -------- -------- -------- -------- -------- Subtotal ............................. 17,613 18,373 19,116 19,869 20,677 21,515 22,352 23,203 24,092 24,969 Entry fees from unit turnover .......... 14,355 14,303 15,008 15,259 17,369 17,567 17,272 19,481 18,343 19,228 Entry fees from vacant units ........... 0 0 0 0 0 0 0 0 0 0 Entry fee refunds ...................... (5,692) (5,662) (6,011) (5,907) (6,668) (7,073) (6,750) (7,657) (7,005) (7,726) Interest income ........................ 3,207 3,596 3,988 4,392 4,831 5,291 5,750 6,252 6,786 7,327
-------- -------- -------- -------- -------- -------- -------- -------- -------- --------TOTAL CASH SOURCES: ...................... 29,483 30,610 32,100 33,613 36,209 37,301 38,623 41,279 42,216 43,799
CASH USES: General & Administrative ............... 2,835 2,934 3,037 3,143 3,253 3,367 3,485 3,607 3,733 3,864 Housekeeping ........................... 1,016 1,052 1,088 1,126 1,166 1,207 1,249 1,293 1,338 1,385 Plant Operations ....................... 1,273 1,318 1,364 1,412 1,461 1,512 1,565 1,620 1,677 1,735 Food Service ........................... 2,993 3,098 3,206 3,318 3,434 3,554 3,679 3,808 3,941 4,079 Health Care ............................ 363 376 389 402 417 431 446 462 478 495 Utilities & Prop Tax ................... 2,775 2,872 2,972 3,076 3,184 3,295 3,411 3,530 3,654 3,781 Land Lease ............................. 294 305 315 326 338 350 362 375 388 401 Management Fee ......................... 637 659 682 706 731 757 783 810 839 868 Assisted Living ........................ 1,546 1,661 1,794 1,916 2,022 2,116 2,209 2,273 2,295 2,392 Skilled Nursing ........................ 3,729 4,049 4,308 4,558 4,955 5,385 5,715 6,093 6,557 6,796
-------- -------- -------- -------- -------- -------- -------- -------- -------- -------- Subtotal ............................. 17,460 18,322 19,155 19,985 20,961 21,974 22,904 23,870 24,898 25,796 Capital expenditures ................... 1,814 2,235 2,658 3,081 3,504 3,929 4,067 4,209 4,356 4,509 Interest payments ...................... 1,489 1,445 1,398 1,348 1,295 1,239 1,179 1,115 1,047 974 Scheduled principal payments ........... 654 697 742 790 842 896 954 1,017 1,083 1,153
-------- -------- -------- -------- -------- -------- -------- -------- -------- --------TOTAL CASH USES: ......................... 21,417 22,699 23,953 25,204 26,602 28,038 29,104 30,210 31,383 32,432
CHANGE IN CASH BALANCE: .................. 8,066 7,911 8,147 8,409 9,607 9,262 9,519 11,069 10,833 11,367 BEGIN OF YEAR CASH BALANCE: .............. 61,705 69,771 77,681 85,828 94,237 103,844 113,107 122,626 133,695 144,528
-------- -------- -------- -------- -------- -------- -------- -------- -------- --------END OF YEAR CASH BALANCE: ................ 69,771 77,681 85,828 94,237 103,844 113,107 122,626 133,695 144,528 155,895
======== ======== ======== ======== ======== ======== ======== ======== ======== ========END OF YEAR DEBT PRINCIPAL: .............. 22,579 21,882 21,140 20,350 19,509 18,613 17,658 16,641 15,559 14,406 DEBT SERVICE RATIO: ...................... 5.61 5.73 6.04 6.37 7.13 7.17 7.36 8.16 8.13 8.46 CASH TO DEBT RATIO: ...................... 3.09 3.54 4.05 4.63 5.32 6.07 6.94 8.03 9.28 10.82
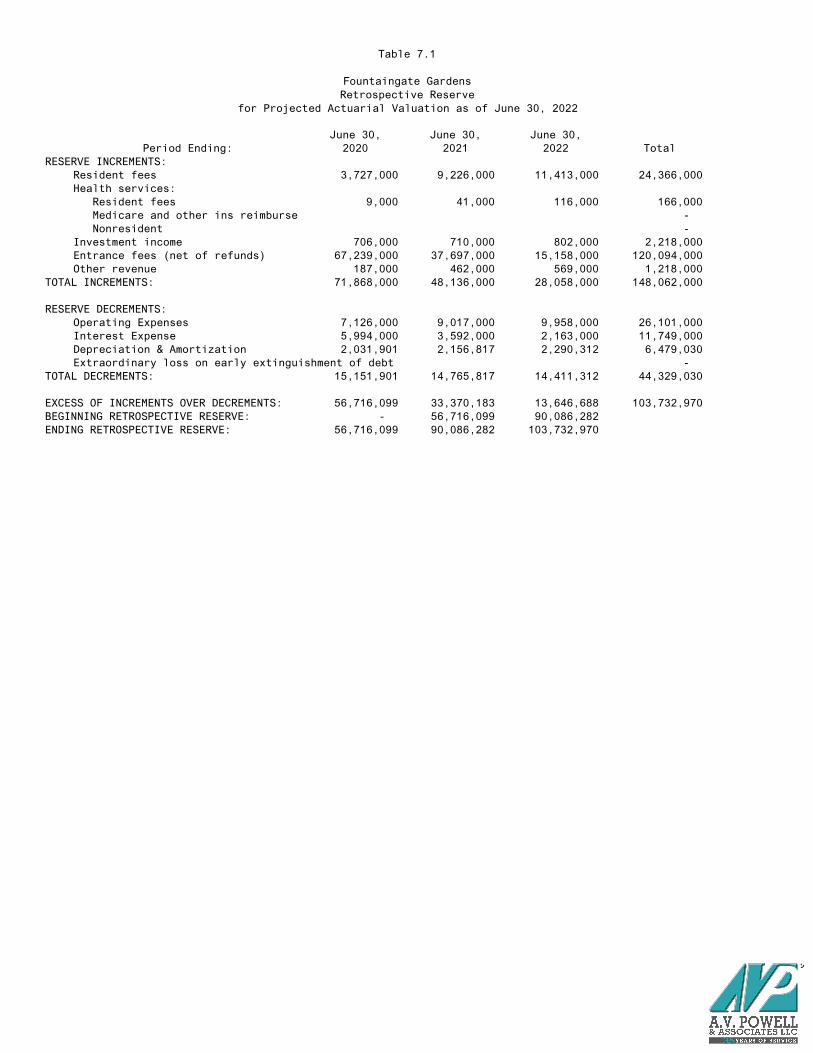
Table 7.1
Fountaingate GardensRetrospective Reserve
for Projected Actuarial Valuation as of June 30, 2022
June 30, June 30, June 30,Period Ending: 2020 2021 2022 Total
RESERVE INCREMENTS:Resident fees 3,727,000 9,226,000 11,413,000 24,366,000 Health services: Resident fees 9,000 41,000 116,000 166,000 Medicare and other ins reimburse - Nonresident - Investment income 706,000 710,000 802,000 2,218,000 Entrance fees (net of refunds) 67,239,000 37,697,000 15,158,000 120,094,000 Other revenue 187,000 462,000 569,000 1,218,000
TOTAL INCREMENTS: 71,868,000 48,136,000 28,058,000 148,062,000
RESERVE DECREMENTS:Operating Expenses 7,126,000 9,017,000 9,958,000 26,101,000 Interest Expense 5,994,000 3,592,000 2,163,000 11,749,000 Depreciation & Amortization 2,031,901 2,156,817 2,290,312 6,479,030 Extraordinary loss on early extinguishment of debt -
TOTAL DECREMENTS: 15,151,901 14,765,817 14,411,312 44,329,030
EXCESS OF INCREMENTS OVER DECREMENTS: 56,716,099 33,370,183 13,646,688 103,732,970 BEGINNING RETROSPECTIVE RESERVE: - 56,716,099 90,086,282 ENDING RETROSPECTIVE RESERVE: 56,716,099 90,086,282 103,732,970
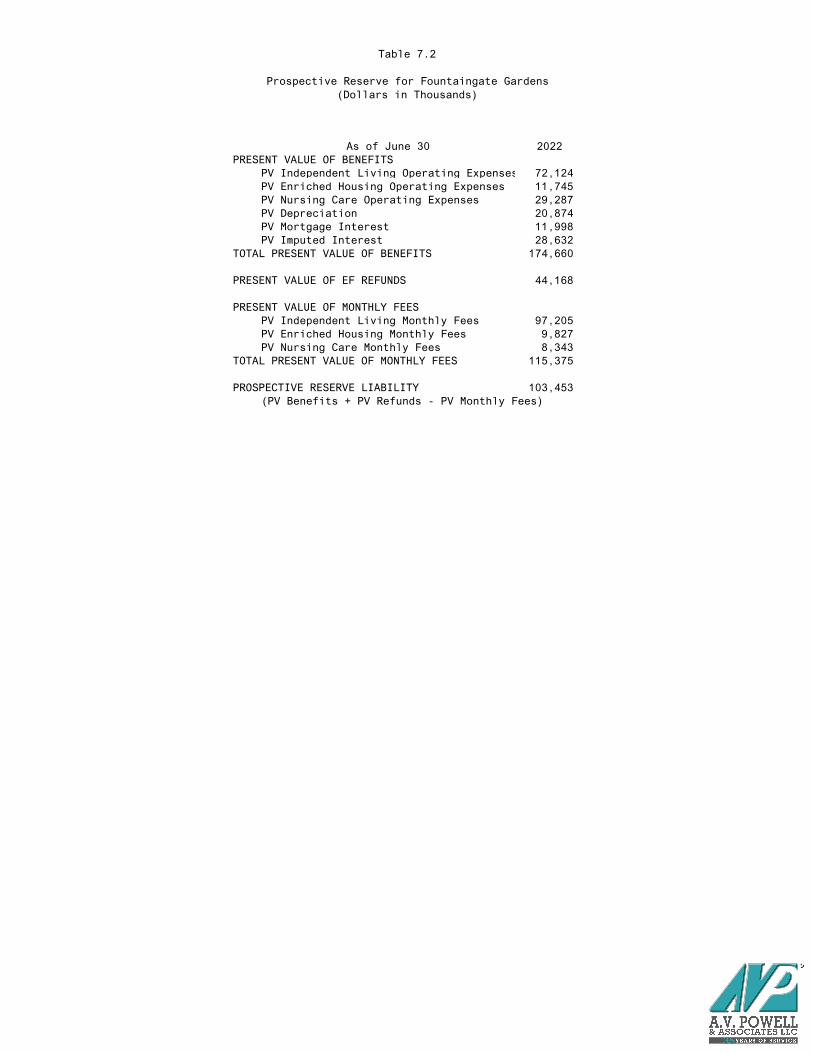
Table 7.2
Prospective Reserve for Fountaingate Gardens(Dollars in Thousands)
As of June 30 2022PRESENT VALUE OF BENEFITS
PV Independent Living Operating Expenses 72,124 PV Enriched Housing Operating Expenses 11,745 PV Nursing Care Operating Expenses 29,287 PV Depreciation 20,874
PV Mortgage Interest 11,998PV Imputed Interest 28,632
TOTAL PRESENT VALUE OF BENEFITS 174,660
PRESENT VALUE OF EF REFUNDS 44,168
PRESENT VALUE OF MONTHLY FEESPV Independent Living Monthly Fees 97,205PV Enriched Housing Monthly Fees 9,827PV Nursing Care Monthly Fees 8,343
TOTAL PRESENT VALUE OF MONTHLY FEES 115,375
PROSPECTIVE RESERVE LIABILITY 103,453(PV Benefits + PV Refunds - PV Monthly Fees)

Table 7.2 Expanded
Closed Group Projection for Fountaingate Gardens(Dollars in Thousands)
Fiscal Year Ending in: 2023 2024 2025 2026 2027 2028CONTRACTHOLDER STATISTICS:Independent Living Resident Days 81,899 74,328 66,736 59,478 52,808 46,701Independent Living Units Occupied 161 152 141 130 119 108Assisted Living Resident Days 1,429 2,110 2,800 3,422 3,830 4,058Assisted Living Beds Occupied 4 6 8 9 10 11Nursing Care Resident Days 2,096 2,336 2,605 2,883 3,099 3,252Nursing Care Beds Occupied 6 6 7 8 8 9
OPERATING EXPENSES:Independent Living 8,415 8,254 8,080 7,785 7,363 6,897Assisted Living 320 489 672 849 984 1,079Nursing Care 1,237 1,427 1,648 1,887 2,100 2,280Total Operating Expenses 9,972 10,170 10,399 10,521 10,447 10,256PRESENT VALUE OF OPERATING EXPENSES 113,157 103,425 93,973 84,768 75,899 67,511
DEPRECIATION EXPENSES:Independent Living 2,480 2,289 2,265 2,217 2,156 2,088Assisted Living 0 0 0 0 0 0Nursing Care 0 0 0 0 0 0Total Capital Expenses 2,480 2,289 2,265 2,217 2,156 2,088PRESENT VALUE OF DEPRECIATION EXPENSES 20,874 18,454 16,326 14,321 12,452 10,721
MORTGAGE INTEREST:Independent Living 2,146 2,010 1,843 1,510 1,205 1,066Assisted Living 0 0 0 0 0 0Nursing Care 0 0 0 0 0 0Total Capital Expenses 2,146 2,010 1,843 1,510 1,205 1,066PRESENT VALUE OF MORTGAGE INTEREST EXPENSES 11,998 9,903 8,035 6,403 5,131 4,163
IMPUTED INTEREST:Independent Living 4,290 3,945 3,601 3,246 3,120 2,763Assisted Living 0 0 0 0 0 0Nursing Care 0 0 0 0 0 0Total Capital Expenses 4,290 3,945 3,601 3,246 3,120 2,763PRESENT VALUE OF IMPUTED INTEREST EXPENSES 28,632 24,445 20,779 17,592 14,855 12,350
MONTHLY FEES:Independent Living 11,861 11,470 10,965 10,384 9,771 9,138Assisted Living 189 332 490 648 771 864Nursing Care 117 197 292 397 496 585Total Monthly Fees 12,167 12,000 11,747 11,429 11,038 10,587PRESENT VALUE OF MONTHLY FEES 115,375 103,501 92,348 81,950 72,315 63,452
DISCOUNT FACTORS: 0.976 0.929 0.885 0.843 0.803 0.765
EXPECTED REFUNDS:Projected death refunds 2,081 2,477 2,792 2,909 2,973 3,002Projected move-out refunds 518 622 373 446 502 541Projected other refunds 658 703 865 800 732 666Total Refunds 3,258 3,802 4,031 4,155 4,207 4,209PRESENT VALUE OF REFUNDS 46,823 43,643 40,110 36,542 33,039 29,661
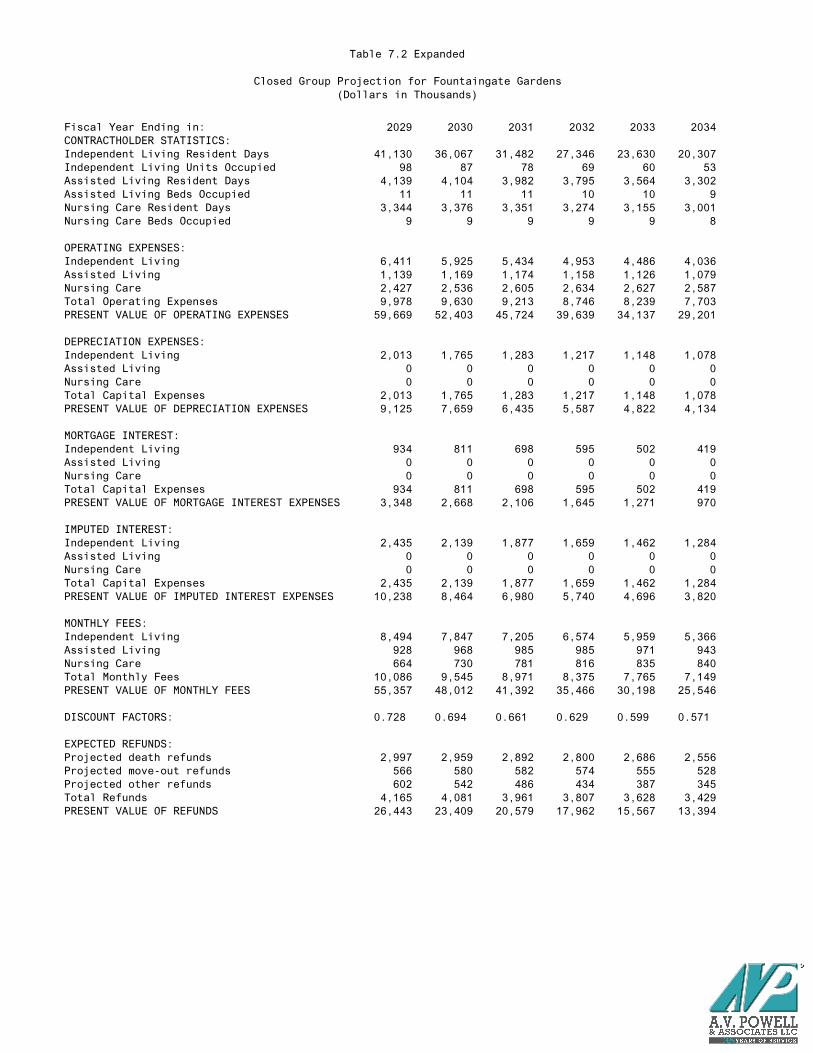
Table 7.2 Expanded
Closed Group Projection for Fountaingate Gardens(Dollars in Thousands)
Fiscal Year Ending in:CONTRACTHOLDER STATISTICS:Independent Living Resident DaysIndependent Living Units OccupiedAssisted Living Resident Days Assisted Living Beds Occupied Nursing Care Resident DaysNursing Care Beds Occupied
OPERATING EXPENSES:Independent LivingAssisted Living Nursing Care Total Operating Expenses PRESENT VALUE OF OPERATING EXPENSES
DEPRECIATION EXPENSES:Independent Living Assisted Living Nursing Care Total Capital ExpensesPRESENT VALUE OF DEPRECIATION EXPENSES
MORTGAGE INTEREST:Independent Living Assisted Living Nursing Care Total Capital ExpensesPRESENT VALUE OF MORTGAGE INTEREST EXPENSES
IMPUTED INTEREST:Independent Living Assisted Living Nursing Care Total Capital ExpensesPRESENT VALUE OF IMPUTED INTEREST EXPENSES
MONTHLY FEES:Independent Living Assisted LivingNursing CareTotal Monthly Fees PRESENT VALUE OF MONTHLY FEES
DISCOUNT FACTORS:
EXPECTED REFUNDS:Projected death refunds Projected move-out refundsProjected other refundsTotal RefundsPRESENT VALUE OF REFUNDS
2029 2030 2031 2032 2033 2034
41,130 36,067 31,482 27,346 23,630 20,30798 87 78 69 60 53
4,139 4,104 3,982 3,795 3,564 3,30211 11 11 10 10 9
3,344 3,376 3,351 3,274 3,155 3,0019 9 9 9 9 8
6,411 5,925 5,434 4,953 4,486 4,0361,139 1,169 1,174 1,158 1,126 1,0792,427 2,536 2,605 2,634 2,627 2,5879,978 9,630 9,213 8,746 8,239 7,70359,669 52,403 45,724 39,639 34,137 29,201
2,013 1,765 1,283 1,217 1,148 1,0780 0 0 0 0 00 0 0 0 0 0
2,013 1,765 1,283 1,217 1,148 1,0789,125 7,659 6,435 5,587 4,822 4,134
934 811 698 595 502 4190 0 0 0 0 00 0 0 0 0 0
934 811 698 595 502 4193,348 2,668 2,106 1,645 1,271 970
2,435 2,139 1,877 1,659 1,462 1,2840 0 0 0 0 00 0 0 0 0 0
2,435 2,139 1,877 1,659 1,462 1,28410,238 8,464 6,980 5,740 4,696 3,820
8,494 7,847 7,205 6,574 5,959 5,366928 968 985 985 971 943664 730 781 816 835 840
10,086 9,545 8,971 8,375 7,765 7,14955,357 48,012 41,392 35,466 30,198 25,546
0.728 0.694 0.661 0.629 0.599 0.571
2,997 2,959 2,892 2,800 2,686 2,556566 580 582 574 555 528602 542 486 434 387 345
4,165 4,081 3,961 3,807 3,628 3,42926,443 23,409 20,579 17,962 15,567 13,394

Table 7.2 Expanded
Closed Group Projection for Fountaingate Gardens(Dollars in Thousands)
Fiscal Year Ending in:CONTRACTHOLDER STATISTICS:Independent Living Resident DaysIndependent Living Units OccupiedAssisted Living Resident Days Assisted Living Beds Occupied Nursing Care Resident DaysNursing Care Beds Occupied
OPERATING EXPENSES:Independent LivingAssisted Living Nursing Care Total Operating Expenses PRESENT VALUE OF OPERATING EXPENSES
DEPRECIATION EXPENSES:Independent Living Assisted Living Nursing Care Total Capital ExpensesPRESENT VALUE OF DEPRECIATION EXPENSES
MORTGAGE INTEREST:Independent Living Assisted Living Nursing Care Total Capital ExpensesPRESENT VALUE OF MORTGAGE INTEREST EXPENSES
IMPUTED INTEREST:Independent Living Assisted Living Nursing Care Total Capital ExpensesPRESENT VALUE OF IMPUTED INTEREST EXPENSES
MONTHLY FEES:Independent Living Assisted LivingNursing CareTotal Monthly Fees PRESENT VALUE OF MONTHLY FEES
DISCOUNT FACTORS:
EXPECTED REFUNDS:Projected death refunds Projected move-out refundsProjected other refundsTotal RefundsPRESENT VALUE OF REFUNDS
2035 2036 2037 2038 2039 2040
17,352 14,737 12,438 10,428 8,684 7,18146 39 33 28 24 20
3,021 2,730 2,436 2,148 1,872 1,6148 7 7 6 5 4
2,823 2,626 2,417 2,201 1,982 1,7648 7 7 6 5 5
3,607 3,196 2,816 2,459 2,134 1,8371,022 956 883 806 727 6482,518 2,425 2,310 2,177 2,029 1,8697,147 6,577 6,009 5,441 4,889 4,35524,806 20,922 17,518 14,557 12,002 9,817
1,007 930 851 770 693 6180 0 0 0 0 00 0 0 0 0 0
1,007 930 851 770 693 6183,518 2,971 2,490 2,071 1,709 1,399
346 282 227 180 140 1070 0 0 0 0 00 0 0 0 0 0
346 282 227 180 140 107731 543 397 285 200 138
1,123 976 842 720 610 5130 0 0 0 0 00 0 0 0 0 0
1,123 976 842 720 610 5133,088 2,478 1,973 1,557 1,220 947
4,798 4,260 3,755 3,286 2,853 2,458904 856 799 737 672 605834 817 790 754 711 662
6,536 5,932 5,345 4,778 4,236 3,72521,467 17,915 14,845 12,210 9,968 8,074
0.543 0.518 0.493 0.469 0.447 0.426
2,413 2,261 2,099 1,933 1,762 1,591494 456 416 376 335 295307 273 241 211 184 159
3,214 2,989 2,756 2,520 2,282 2,04511,437 9,690 8,143 6,785 5,602 4,582

Table 7.2 Expanded
Closed Group Projection for Fountaingate Gardens(Dollars in Thousands)
Fiscal Year Ending in:CONTRACTHOLDER STATISTICS:Independent Living Resident DaysIndependent Living Units OccupiedAssisted Living Resident Days Assisted Living Beds Occupied Nursing Care Resident DaysNursing Care Beds Occupied
OPERATING EXPENSES:Independent LivingAssisted Living Nursing Care Total Operating Expenses PRESENT VALUE OF OPERATING EXPENSES
DEPRECIATION EXPENSES:Independent Living Assisted Living Nursing Care Total Capital ExpensesPRESENT VALUE OF DEPRECIATION EXPENSES
MORTGAGE INTEREST:Independent Living Assisted Living Nursing Care Total Capital ExpensesPRESENT VALUE OF MORTGAGE INTEREST EXPENSES
IMPUTED INTEREST:Independent Living Assisted Living Nursing Care Total Capital ExpensesPRESENT VALUE OF IMPUTED INTEREST EXPENSES
MONTHLY FEES:Independent Living Assisted LivingNursing CareTotal Monthly Fees PRESENT VALUE OF MONTHLY FEES
DISCOUNT FACTORS:
EXPECTED REFUNDS:Projected death refunds Projected move-out refundsProjected other refundsTotal RefundsPRESENT VALUE OF REFUNDS
2041 2042 2043 2044 2045 2046
5,893 4,799 3,878 3,109 2,474 1,95516 13 11 9 7 5
1,377 1,164 973 805 658 5304 3 3 2 2 1
1,553 1,352 1,164 989 830 6874 4 3 3 2 2
1,569 1,328 1,115 928 767 628573 501 434 371 314 262
1,703 1,535 1,367 1,202 1,044 8953,845 3,364 2,916 2,502 2,124 1,7857,962 6,403 5,104 4,031 3,155 2,446
546 478 415 357 304 2570 0 0 0 0 00 0 0 0 0 0
546 478 415 357 304 2571,136 915 730 578 453 351
81 59 42 28 18 100 0 0 0 0 00 0 0 0 0 081 59 42 28 18 1092 59 36 21 11 5
427 352 287 232 185 1470 0 0 0 0 00 0 0 0 0 0
427 352 287 232 185 147728 555 419 314 232 171
2,101 1,780 1,496 1,246 1,030 845539 475 414 356 302 253608 552 495 439 383 330
3,248 2,807 2,405 2,041 1,716 1,4286,488 5,171 4,087 3,203 2,488 1,915
0.406 0.386 0.368 0.350 0.334 0.318
1,422 1,258 1,102 955 818 693256 219 185 153 123 96134 113 93 75 60 47
1,813 1,590 1,380 1,183 1,001 8353,711 2,976 2,362 1,854 1,440 1,106

Table 7.2 Expanded
Closed Group Projection for Fountaingate Gardens(Dollars in Thousands)
Fiscal Year Ending in:CONTRACTHOLDER STATISTICS:Independent Living Resident DaysIndependent Living Units OccupiedAssisted Living Resident Days Assisted Living Beds Occupied Nursing Care Resident DaysNursing Care Beds Occupied
OPERATING EXPENSES:Independent LivingAssisted Living Nursing Care Total Operating Expenses PRESENT VALUE OF OPERATING EXPENSES
DEPRECIATION EXPENSES:Independent Living Assisted Living Nursing Care Total Capital ExpensesPRESENT VALUE OF DEPRECIATION EXPENSES
MORTGAGE INTEREST:Independent Living Assisted Living Nursing Care Total Capital ExpensesPRESENT VALUE OF MORTGAGE INTEREST EXPENSES
IMPUTED INTEREST:Independent Living Assisted Living Nursing Care Total Capital ExpensesPRESENT VALUE OF IMPUTED INTEREST EXPENSES
MONTHLY FEES:Independent Living Assisted LivingNursing CareTotal Monthly Fees PRESENT VALUE OF MONTHLY FEES
DISCOUNT FACTORS:
EXPECTED REFUNDS:Projected death refunds Projected move-out refundsProjected other refundsTotal RefundsPRESENT VALUE OF REFUNDS
2047 2048 2049 2050 2051 2052
1,535 1,198 931 720 553 4234 3 3 2 2 1
421 329 254 192 143 1061 1 1 1 0 0
562 455 364 288 225 1732 1 1 1 1 0
511 414 333 267 213 168215 174 139 109 84 64758 635 525 430 348 278
1,485 1,223 997 806 644 5101,879 1,430 1,078 804 593 433
216 179 148 118 96 770 0 0 0 0 00 0 0 0 0 0
216 179 148 118 96 77270 204 153 112 81 57
5 1 0 0 0 00 0 0 0 0 00 0 0 0 0 05 1 0 0 0 02 0 0 0 0 0
115 90 69 52 38 280 0 0 0 0 00 0 0 0 0 0
115 90 69 52 38 28124 89 63 44 31 21
689 558 450 360 287 228209 169 135 106 82 62280 234 193 157 126 100
1,177 961 777 623 495 3901,461 1,105 828 615 452 328
0.303 0.288 0.274 0.261 0.249 0.237
579 478 390 315 251 19973 54 39 27 19 1335 26 19 14 10 7687 558 448 356 280 218841 633 472 349 256 186

Table 7.2 Expanded
Closed Group Projection for Fountaingate Gardens(Dollars in Thousands)
Fiscal Year Ending in:CONTRACTHOLDER STATISTICS:Independent Living Resident DaysIndependent Living Units OccupiedAssisted Living Resident Days Assisted Living Beds Occupied Nursing Care Resident DaysNursing Care Beds Occupied
OPERATING EXPENSES:Independent LivingAssisted Living Nursing Care Total Operating Expenses PRESENT VALUE OF OPERATING EXPENSES
DEPRECIATION EXPENSES:Independent Living Assisted Living Nursing Care Total Capital ExpensesPRESENT VALUE OF DEPRECIATION EXPENSES
MORTGAGE INTEREST:Independent Living Assisted Living Nursing Care Total Capital ExpensesPRESENT VALUE OF MORTGAGE INTEREST EXPENSES
IMPUTED INTEREST:Independent Living Assisted Living Nursing Care Total Capital ExpensesPRESENT VALUE OF IMPUTED INTEREST EXPENSES
MONTHLY FEES:Independent Living Assisted LivingNursing CareTotal Monthly Fees PRESENT VALUE OF MONTHLY FEES
DISCOUNT FACTORS:
EXPECTED REFUNDS:Projected death refunds Projected move-out refundsProjected other refundsTotal RefundsPRESENT VALUE OF REFUNDS
2053 2054 2055 2056 2057 2058
321 241 180 132 95 681 1 1 0 0 077 55 39 27 18 110 0 0 0 0 0
132 100 74 54 39 270 0 0 0 0 0
132 103 80 61 46 3448 36 26 19 13 9219 171 131 99 74 53400 310 237 179 132 95312 222 155 106 72 47
61 48 32 13 10 70 0 0 0 0 00 0 0 0 0 061 48 32 13 10 739 25 15 8 6 4
0 0 0 0 0 00 0 0 0 0 00 0 0 0 0 00 0 0 0 0 00 0 0 0 0 0
20 15 10 7 5 40 0 0 0 0 00 0 0 0 0 020 15 10 7 5 414 10 7 5 3 2
179 140 108 82 62 4647 35 25 18 13 878 60 46 34 25 17304 235 179 134 99 71236 167 117 80 54 36
0.226 0.215 0.205 0.195 0.186 0.177
156 122 94 72 55 419 6 4 3 2 15 3 2 1 1 1
169 131 100 76 58 43135 96 68 48 33 22

Table 7.2 Expanded
Closed Group Projection for Fountaingate Gardens(Dollars in Thousands)
Fiscal Year Ending in:CONTRACTHOLDER STATISTICS:Independent Living Resident DaysIndependent Living Units OccupiedAssisted Living Resident Days Assisted Living Beds Occupied Nursing Care Resident DaysNursing Care Beds Occupied
OPERATING EXPENSES:Independent LivingAssisted Living Nursing Care Total Operating Expenses PRESENT VALUE OF OPERATING EXPENSES
DEPRECIATION EXPENSES:Independent Living Assisted Living Nursing Care Total Capital ExpensesPRESENT VALUE OF DEPRECIATION EXPENSES
MORTGAGE INTEREST:Independent Living Assisted Living Nursing Care Total Capital ExpensesPRESENT VALUE OF MORTGAGE INTEREST EXPENSES
IMPUTED INTEREST:Independent Living Assisted Living Nursing Care Total Capital ExpensesPRESENT VALUE OF IMPUTED INTEREST EXPENSES
MONTHLY FEES:Independent Living Assisted LivingNursing CareTotal Monthly Fees PRESENT VALUE OF MONTHLY FEES
DISCOUNT FACTORS:
EXPECTED REFUNDS:Projected death refunds Projected move-out refundsProjected other refundsTotal RefundsPRESENT VALUE OF REFUNDS
2059 2060 2061 2062
47 32 22 140 0 0 07 4 2 10 0 0 018 12 8 50 0 0 0
24 17 12 85 3 2 137 25 17 1167 46 31 2030 19 12 7
5 4 3 20 0 0 00 0 0 05 4 3 23 2 1 1
0 0 0 00 0 0 00 0 0 00 0 0 00 0 0 0
3 2 1 10 0 0 00 0 0 03 2 1 11 1 1 0
33 23 16 115 3 2 112 8 5 350 35 23 1523 15 9 5
0.169 0.160 0.153 0.146
30 21 14 101 1 0 00 0 0 031 22 15 1015 9 6 4

Table 7.3
Minimum Liquid Reserve for Fountaingate Gardens(Dollars in Thousands)
As of June 30 2022
Debt Reserve FundPrincipal and interest payments 2,106due within next 12 months
Operating Reserve FundTaxes and insurance premiums 1,012due within next 12 months
Operating expenses for next 12 months 9,784
Projected refunds due within next 12 month 2,923
Subtotal Operating Reserve Fund: 35% 4,802
TOTAL MINIMUM LIQUID RESERVE 6,908

Table 8.1
Balance Sheet Projection for Fountaingate Gardens(Dollars in Thousands)
Fiscal Year Ending in: 2022ASSETS:
Short term investments 6,908 Long term investments 15,063 Accounts receivable 149 Prepaid expenses and other 142 Total current assets 22,262
Land 0Building 109,722Long term debt (32,400)Furniture and equipment 3,007Less: accumulated depreciation (4,336) Total fixed assets-lt debt 75,994
Deferred marketing 5,195Deferred financing costs ST 192Deferred financing costs LT 2,803 Total other assets 8,190
TOTAL ASSETS: 106,446
RESERVE LIABILITIES:
Retrospective ReserveEnd of Year Retrospective Reserve 103,733Prepayment of expenses 142 Total Retrospective Reserve 103,875
Prospective ReserveEnd of Year Prospective Reserve 103,453Accounts payable and accrued expense 727Due to affiliated entity 0Refundable entry fees 0 Total Prospective Reserve 104,180
Minimum Liquid Reserve 6,908
TOTAL RESERVE LIABILITIES: 104,180(greater of Prospective and Retrospective)
NET SURPLUS (Assets minus Liabilities) 2,266