activity and removal
TRANSCRIPT

Activity and removal

Tuesday 26/6
Preparing buffers in different pH Protocols used: Buffer preparation Procedure:
· Buffers were made for pH 3, 4, 5, 6, 7, 8 and 4.5 using the protocol ‘Buffer preparation’ Friday 29/6
1. ABTS and laccase-stock preparation Protocols used: Not applicable Procedure:
· ABTS stock (10mM): 2,745 mg ABTS + 500 uL pH 5 buffer · Laccase stock (10 mg protein/mL): 5,8 mg protein + 580 uL pH 5 buffer
2. Determination of the enzyme’s concentration Protocols used: Not applicable Procedure:
· Enzyme abs assay: 10 uL protein stock (10mg/ml) + 990 uL pH 5 buffer ε280=60850M-1cm-1 (calculated w enzyme sequence https://www.uniprot.org/uniprot/Q12718.fasta using https://web.expasy.org/cgi-bin/protparam/protparam)
· Abs measurement mean value: (0,0143 + 0,0512)/2=0,01475 Beer Lambert law:
/(ε ) , 1475/(60850 M ) 0, 42 μM enzymec = A 280 · l = 0 0 −1 * 1 = 2 (enzyme) 5810, 3 , 42 0 0 3, 1·10 g/ml 0, 135 mg/mL m = Mw · c · V = 5 9 g
mol * 0 2 * 1 −6Lmol * 1 −3 L
mL = 1 5 −6 = 0
(conc. in cuvette) 0, 135 g/L 0, 135 mg/ml c2 = 0 = 0 (conc. in stock) c / V 0, 135 (mg/mL)·1(mL) /10 0 (mL) , 5 mg/mL enzyme c1 = 2 * V 2 1 = 0 * 1 −3 = 1 3
10 mg/mL added → 1,35/10=13,5% purity (?)
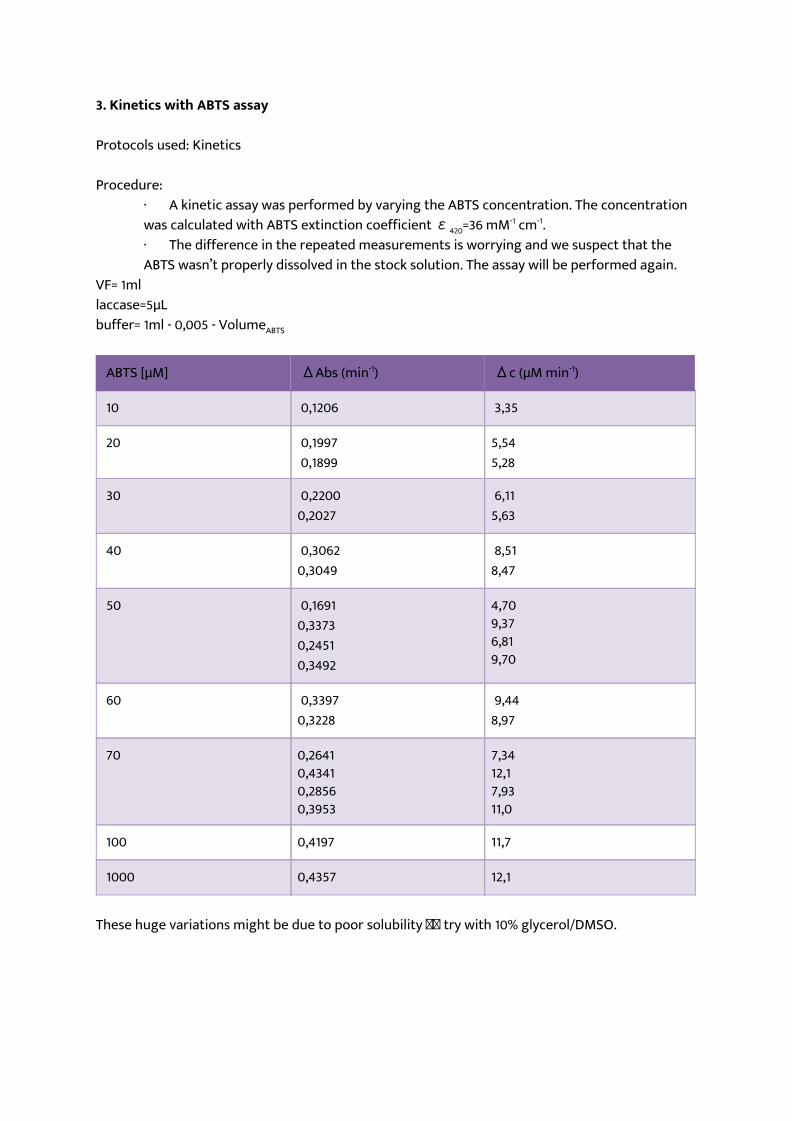
3. Kinetics with ABTS assay Protocols used: Kinetics Procedure:
· A kinetic assay was performed by varying the ABTS concentration. The concentration was calculated with ABTS extinction coefficient ε420=36 mM-1 cm-1. · The difference in the repeated measurements is worrying and we suspect that the ABTS wasn’t properly dissolved in the stock solution. The assay will be performed again.
VF= 1ml laccase=5µL buffer= 1ml - 0,005 - VolumeABTS
ABTS [µM] ΔAbs (min-1) Δc (µM min-1)
10 0,1206 3,35
20 0,1997 0,1899
5,54 5,28
30 0,2200 0,2027
6,11 5,63
40 0,3062 0,3049
8,51 8,47
50 0,1691 0,3373 0,2451 0,3492
4,70 9,37 6,81 9,70
60 0,3397 0,3228
9,44 8,97
70 0,2641 0,4341 0,2856 0,3953
7,34 12,1 7,93 11,0
100 0,4197 11,7
1000 0,4357 12,1
These huge variations might be due to poor solubility try with 10% glycerol/DMSO.

Monday 2/7
1. GENERAL NOTES
ABTS reacted during the weekend! New stock solution was made at ph 5. Store at the fridge and dark to avoid reaction to happen spontaneously. Also, the pipettes were calibrated.
2. ABTS TEST Protocols used: Kinetics, pH optimization The plan was to start the optimization of pH with the ABTS assay. However, when I started the measurements at pH 5 (same conditions as the ones tested on Friday) we found out that the activity of the enzyme decreased by roughly 2x. After talking to our advisor, Lauren, we agreed on storing the stock of laccase in the fridge, at 4oC. Pretty preliminary data showed that the reaction went better at pH 4 than at pH 5. Anyhow they’re just rough estimates without triplicates so we still need proper verification.
3. HOW TO STORE THE LACCASE? Today our lovely enzyme did not worked as good as when freshly prepared, so we are wondering which is the best way to store it (freezer/fridge). Two aliquots of the stock laccase were prepared: one of them was stored in the fridge and another one in the freezer. We’ll see what happens tomorrow. Tuesday 3/7
1. HOW TO STORE THE LACCASE? ABTS assay was done and the initial velocity (slope) was determined and compared (pH 5, 0,10 mM ABTS, VF 1 ml, 5 µL of laccase) . These are the results:
Sample
Fresh laccase (Friday)
Thawed for the 1st time (Monday)
Thawed for 2nd time (today)
Refrigerated after Monday (today)
Thawed from original stock (for the second time)
Slope ΔΔy/ΔΔx 0.419 0.216 0.12368 0.267 0.1965
Conclusion: store the stock of laccase at 4°C, not in the freezer.

Wednesday 4/7
1. SMX STANDARD CURVE
Protocols used: not applicable Stock solution SMX:10 mM SMX with 10% glycerol (m=2.53mg in 1 ml of stock solution). We want to do a standard curve with absorbance measurements (no ε could be found in the literature, so we are gonna find it ourselves for being able to measure the concentrations of antibiotic we are working with in the future). For that, we are going to do a dilution series ranging from 1mM to 0.03125 mM SMX. [0] Stock solution (10mM) [1] 1000 µL [0] + 9000 µL buffer at pH 5 (1mM) [2] 1000 µL [1] + 9000 µL buffer at pH 5 (0.5mM) [3] 1000 µL [2] + 9000 µL buffer at pH 5 (0.25 mM) [4] 1000 µL [3] + 9000 µL buffer at pH 5 (0.125mM) [5] 1000 µL [4] + 9000 µL buffer at pH 5 (0.0625 mM) [6] 1000 µL [5] + 9000 µL buffer at pH 5 (0.03125mM) We came up with a problem: SMX is not soluble even with the addition of glycerol. We got DMSO from Lauren and add 0,5 ml DMSO (9,09%) to the sample [1] but we can still see particles floating around. There’s a great amount of solvent, so we are not sure whether the antibiotic is not being solubilized or if there’s some dust. We have talked as well about filtering, but then we cannot be sure of the initial concentration from which the dilution series is done.
2. ABOUT SMX SOLUBILITY Protocols used: not applicable
- Research gate Dissolve it in 1:1 water: ethanol and final concentration should be 20-25 mg/L in the media for screening.
Solubility: Soluble in DMSO (51 mg/ml at 25° C), water (<1 mg/ml at 25° C), and ethanol (23 mg/ml at 25° C). “Sulfamethoxazole is very slightly soluble in water, but is soluble 1 in 50 of alcohol and 1 in 3 of acetone. It is also soluble in alkali hydroxides. A 10% suspension in water has a pH of 4 to 6.4”. (From product sheet information).

- Determination of pKa values of some sulfonamides by LC and LC-PDA methods in acetonitrile-water binary mixtures http://www.scielo.br/scielo.php?script=sci_arttext&pid=S0103-50532010001000022
Antibiotics were purchased from Sigma and used without further purification. Water, with conductivity lower than 0.05 mS cm-1 was obtained with a Milli Q water purification system (Milli Pore Corp.). MeCN was of HPLC grade and used as the organic component of the mobile phase.
Stock standard solutions of SAs were freshly prepared in water at concentrations of approximately 200 mg L-1 and stored in amber bottles in refrigerator (4 ºC). Working solutions were diluted with corresponding mobile phase to 10 mg L-1. These solutions were passed through a 0.45 mm nylon filter membrane (MSI) before injections.
Conclusion: let’s try tomorrow again with DMSO, ethanol and lower concentrations of SMX.
Thursday 5/7
1. SOLUBILIZATION OF SMX Protocols used: not applicable Stock solution: 10mg/ml in 50:50 buffer pH 5:DMSO (Vf=1ml) After looking at absorbances values, we found out that still these concentrations are super high. We need to start from concentrations in the top limit of 0.5 µg/ml. Therefore, we did a more diluted stock solution: Vf= 10ml. We took 1ml from the 10mg/ml stock and diluted it in 9ml of buffer at pH 5. Final stock of SMX: 0.1 mg/ml SMX in 95:5 buffer pH 5:DMSO.
2. SMX STANDARD CURVE
Protocols used: not applicable [0] Stock: 0.1mg/ml [1] 30µl [0]+ 5.97ml buffer at pH 5 (0.5µg/ml) [2] 5ml [1]+ 5ml buffer at pH 5 (0.25µg/ml) [3] 5ml [2]+ 5ml buffer at pH 5 (0.125µg/ml) [4] 5ml [3]+ 5ml buffer at pH 5 (0.0625µg/ml) [5] 5ml [4]+ 5ml buffer at pH 5 (0.03125µg/ml)

n=3 (+ triplicated measurements in the device per sample) Found extinction coefficient: 0,63 ml µg-1 cm-1 (round off to 2 significant numbers: Abs=0,63*c → c = Abs/0,63)
3. PH REFOLDING ASSAY (QUENCHING WITH PH1) Protocols used: Quenching with pH Laccase stock (prepared last week): 1.3 mg/ml
● ABTS assay at 0.1 mM ○ 5µl laccase from stock / 1ml
■ 10 µl ABTS ■ 5 µl laccase from stock ■ 985 µl buffer pH 5
○ 0.5µl laccase from stock / 1ml ■ 10 µl ABTS ■ 0.5 µl laccase from stock ■ 989,5 µl buffer pH 5
ABTS will be done in triplicates and at three different timepoints: pH5 before experiment, pH1 after 1h incubation in ice, pH5 after refolding experiment ➔ mix for 9 samples needed, but we have made for 10 instead. Thus, prepare mixed solutions:
★ SOLUTION 1. For the 5µl laccase from stock / 1ml ○ 50 µl laccase from stock ○ 9,85 ml buffer pH 5
★ SOLUTION 2. For the 0.5µl laccase from stock / 1ml ○ 5 µl laccase from stock ○ 9,895 ml buffer pH 5

For the experiments:
★ For the 5µl laccase from stock / 1ml ○ BLANK: 990 µl of buffer at pH 5 + 10 µl ABTS ○ Take 990 µl of SOLUTION 1 ○ Add 10 µl of ABTS + measure absorbance at 417 nm
★ For the 0.5µl laccase from stock / 1ml ○ BLANK: 990 µl of buffer at pH 5 + 10 µl ABTS ○ Take 990 µl of SOLUTION 2 ○ Add 10 µl of ABTS + measure absorbance at 417 nm
- 950 µl of 3 M HCl added to both SOLUTION 1 and 2 for reaching pH 1. Left on ice for 1 h. - Add same amount (950 µl ) of 3M NaOH - Measure absorbance at 417 nm - Wait 1,5 hours more to see if it refolds after some time - Measure again absorbance at 417 nm
No refolding after restoring pH! We can use it as a quenching method.
CONDITION Slope 5 µl laccase Slope 0.5 µl laccase
pH 5 before experiment
0.0125 0.01297 0.0135
0.00037 0.00043 0.00032
pH 5 right after 1h incubation at pH1
-1·10 -5 7·10 -5 -9·10 -5
8.5·10 -5 -7·10 -5 -9·10 -5
pH 5 after incubation for 90 mins after restoring pH 5
-0.0000102125
-0.00001749918
-0.0000147553
0.0000124117
-0.0000156699
0.0000155786

Friday 6/7
1. HPLC TRIAL RUN WITH SMX
Protocols used: not applicable 63 µg/ml sample of SMX in phosphate/citric acid buffer pH 5 was diluted 1:10 with mobile phase 1 (MilliQ + 0,1% TFA) and filtered with a syringe filter with cutoff 0,45 µm. Mobile phase A: MilliQ + 0,1% TFA Mobile phase B: Acetonitrile + 0,1% TFA Stationary phase: Analytical column (C18) Injection volume: 50 µl Elution program:
Time (min) Buffer
0.00 100% A
5.00 100% A
15.00 80% A 20% B
30.00 30% A 70% B
37.00 100% B
40.00 100% B
We got 2 peaks. Why? -> Contact MALDI person.
2. ABTS STANDARD CURVE Protocols used: not applicable Preliminar standard curve. ABTS stock has reacted a little bit an not enough samples to make a wide range of concentrations. I don’t want to make new ABTS stock as it is pretty late and the weekend is here. Better to wait and make new fresh stock and start from there.

Monday 9/7
1. NEW STOCKS PREPARED
Protocols used: not applicable ABTS 10mM (1mL buffer at pH 5 + 5.15mg ABTS) Laccase 10mg/ml
➔ 10 µl laccase + 990µl buffer pH5 + measure absorbance at 280nm: 0.0131 0.0150 ⇛ 0.0129 0.0121 0.0114
ε280=60850M-1cm-1 (calculated w enzyme sequence https://www.uniprot.org/uniprot/Q12718.fasta using https://web.expasy.org/cgi-bin/protparam/protparam) c=A/ε280 l = 0,01475/(60850M-1cm-1 *1cm) = 0,212 µM enzyme Mw=55810,93 g/mol m(enz)=Mw * c * V = 55810,93 (g/mol)*0,212·10-6(mol/L)*10-3 (L/mL) = 0,0118 mg/mL → c2 (concentration in cuvette) = 0,0118 g/L = 0,0118mg/ml c1 (concentration in stock) = c2*v2/v1 = 0,0118(mg/mL)·1(mL) /10*10-3 (mL)=1,18 mg/mL enzyme 10 mg/mL added → 1,35/10=13,5% purity (?) Are we sure of this? Just stick to 10 mg/ml!!!!!
2. ABTS STANDARD CURVE Protocols used: not applicable First: scan with 1µl ABTS + 999µl buffer ⇉ BEST ABSORPTION AT 340 NM!!! Prepare samples as follows:
- 10 µM: 1µl ABTS + 999 µl buffer pH 5 - 20 µM: 2µl ABTS + 998 µl buffer pH 5 - 30 µM: 3µl ABTS + 997 µl buffer pH 5 - 40 µM: 4µl ABTS + 996 µl buffer pH 5 - 50 µM: 5µl ABTS + 995 µl buffer pH 5 - 60 µM: 6µl ABTS + 994 µl buffer pH 5

Then after lunch we decided to measure intermediate concentrations (15, 25, 35 and 45 uM) but we got weird results:
We redid some of the previous concentrations and found out that the absorbances increased! The ABTS stock looked now bluer, meaning that reacts over time and we cannot compare data obtained at different timepoints :(
3. pH ASSAY
Protocols used: Enzyme activity and kinetics Triplicates of 10uM and 50uM ABTS samples were prepared at different pHs (3-8) as follows:
- 10uM: 1µL ABTS (stock 10mM) + 5µl laccase (stock 10mg/ml) + 994 µl of buffer at different pHs
- 50uM: 5µL ABTS (stock 10mM) + 5µl laccase (stock 10mg/ml) + 990 µl of buffer at different pHs

Slopes (Vinitial) were obtained from the triplicates:
Conclusion: Enzymatic activity is best at pH 4!!
4. MALDI (MS)
Protocols used: not applicable We analyzed the two peaks that we obtained on Friday. We could not see anything in the sample, just the matrix. After coming back at the HPLC plot, the guy told us that the concentration of the sample is super low and we have to concentrate it at least 10X.
5. HPLC - Sample preparation
Protocols used: HPLC We are running the HPLC on Wednesday, so we just started preparing the 48h samples for that. The general set up is the following:
SMX + buffer (different time points) SMX + laccase + buffer (different time points
SMX + laccase + ABTS 0.1mM + buffer (different time points)
laccase + buffer (fresh?) buffer (blank fresh?) ABTS + buffer (to differentiate if it has a peak fresh?) We did not know the best pH when we did this, if you do it now, use pH 5! The same thing for the ABTS stock, now we do it with the ABTS buffer and it is 1mg/ml. Redo calculations (or check lab book on 13th of July) to adjust it.

SMX + buffer: - 500 µL of SMX (stock 1 mg/ml) - 500 µL buffer pH 5
SMX + laccase + buffer - 500 µL of SMX (stock 1 mg/ml) - 10 µL laccase (stock 10 mg/ml) - 490 µL buffer pH 5
SMX + laccase + ABTS + buffer - 500 µL of SMX (stock 1 mg/ml) - 10 µL laccase (stock 10 mg/ml) - 10 µL ABTS (stock 10mM) - 480 µL buffer pH 5
Laccase + buffer - 10 µL laccase (stock 10 mg/ml) - 990 µL buffer pH 5
Blank - 1 mL buffer pH 5
Tuesday 10/7
1. HPLC - Sample preparation Protocols used: HPLC 24-hours samples were prepared (SMX + laccase + ABTS + buffer, SMX + laccase + buffer and SMX + buffer) Wednesday 11/7
1. HPLC Protocols used: not applicable Several HPLC tests were run, starting with the standard curve for SMX. A gradient was made for 25 minutes, where the product peak showed at approximately 17 minutes for the first three tests. After this an overnight HPLC was prepared, in total 22 runs. The runs were analysed the next morning, but they were unfortunately inconclusive. This is partly due to that the HPLC-apparatus was broken. Partly also due to the incorrect methodology, the column should have been run with 0% of the second eluent a while before injection for calibration, which wasn’t done. This resulted in very different retention times, and peaks on places where they shouldn’t be.

Friday 13/7
1. ABTS NEW STOCK USING ABTS BUFFER
Protocols used: HPLC Dissolved 5 mg of ABTS in 5 ml of ABTS buffer (following recommendations). Thus we have 1 mg/ml stock of ABTS. m=V·C= 1 mg ABTS/ml · 5 ml = 5 mg ABTS n= m/Mw=9.716·10-6 mol / 5·10-3L=0.00194mol/L=1.94mM in stock Remember that our previous stock was 10mM, so calculations need to be done to repeat all experiments in the same concentrations as before.
2. ABTS STANDARD CURVE (with the ABTS-buffer)
With GraphPad (below): R square 0.9804, slope 69.28 ± 4.892 and x intercept 7.68·10-5
Conclusion: The ABTS buffer stabilises the ABTS.

3. pH ASSAY Protocols used: Enzyme activity and kinetics Only pH 4, 4.5 and 5 will be tested this time at 50µM of ABTS and 100µM of ABTS.
● 50µM of ABTS C1·V1=C2·V2 1.94mM·V1=0.05mM·1mL ----> V1=0.02577ml = 25.8µL of stock ABTS 1.94mM Thus:
- 25,8µL of ABTS stock (1.94mM) - 5µL laccase (10mg/ml stock) - 969,2µL buffer at the different pHs
● 100µM of ABTS - 51.6µL of ABTS stock (1.94mM) - 5µL laccase (10mg/ml stock) - 943.4µL buffer at the different pHs
p<0.001 SIGNIFICANT! Conclusion: pH 4.5 is the best!

Tuesday 17/7
1. ABTS NEW STOCK WITH ABTS BUFFER & NEW LACCASE STOCK ABTS (1mg/mL, 1.94mM) Laccase (10mg/ml)
2. PH REFOLDING ASSAY (QUENCHING WITH PH7) Protocols used:Quenching with pH Laccase stock (prepared last week): 10 mg/ml
● ABTS assay at 0.1 mM ■ 51.6 µl ABTS ■ 5 µl laccase from stock ■ 943.4 µl buffer pH 4.5
● ABTS assay at 0.05 mM ■ 25.8 µl ABTS ■ 5 µl laccase from stock ■ 969,2 µl buffer pH 4.5
ABTS will be done in triplicates and at three different timepoints: pH4.5 before experiment, pH7 after 1h incubation in ice, pH4.5 after refolding experiment ➔ mix for 9 samples needed, but we have made for 10 instead. Thus, prepare mixed solutions:
★ SOLUTION 1. For the 0.1 mM ABTS ○ 50 µl laccase from stock ○ 9,434 ml buffer pH 4.5
★ SOLUTION 2. For the 0.05 mM ABTS ○ 50 µl laccase from stock ○ 9,692 ml buffer pH 4.5
For the experiments:
★ For the ABTS assay at 0.1 mM ○ BLANK: 948.4 µl of buffer at pH 4.5 + 51.6 µl ABTS ○ Take 948.4 µl of SOLUTION 1 ○ Add 51.6 µl of ABTS + measure absorbance at 417 nm
★ For the ABTS assay at 0.05 mM ○ BLANK: 974.2 µl of buffer at pH 4.5 + 25.8 µl ABTS ○ Take 974.2 µl of SOLUTION 2 ○ Add 25.8 µl of ABTS + measure absorbance at 417 nm
- 270 µl of 3 M NaOH added to both SOLUTION 1 and 2 for reaching around pH 7 (SOLUTION
1 was specifically pH 7.18 and SOLUTION 2 was specifically pH 7,08). Left on ice for 1 h. - Add same amount (270 µl ) of 3M HCl

- Measure absorbance at 417 nm - Wait 1,5 hours more to see if it refolds after some time - Measure again absorbance at 417 nm
CONDITION Slope 0,1mM ABTS Slope 50 µM ABTS
pH 4.5 before experiment
0.0116063 0.0121768 0.0125922
0.0110961 0.0112007 0.0117596
pH 4.5 right after 1h incubation at pH7 and restoration
0.000502514
0.000513673
0.000624809
0.0002195 0.000352779
0.00024621
pH 4.5 after incubation for 90 mins after restoring pH 4.5
0.0000369881
0.000238386
0.000014583
0.0000331427
0.000111228
0.000147816
There is some activity after changing & restoring pH but it is negligible as there is a significant (p<0.0001) difference between samples (before with after/after 1.5h). (2nd way ANOVA test + Sidak’s multiple comparisons test) Conclusion: it can be used as a quenching method for the toxicity group.

Thursday 26/7
Protocols used: Enzyme activity and kinetics A temperature assay was conducted. The temperature was controlled by heating or cooling the buffer (pH 4,5) in a water bath or ice bath. In all experiments, 5 uL enzyme (10 mg/ml) and 50 uL ABTS (1mg/ml) was added to 940 uL buffer. The concentration of ABTS in the reaction was 0,05 mg/ml. The measurements were conducted for one minute. The results can be seen below.
The standard deviation is bigger when the temperature deviates a lot from room temperature. The temperature was not controlled after buffer was taken from the bottle, which may have lead to inconsistencies in the temperatures in the reactions. Monday 30/7
Protocols used: Enzyme activity and kinetics In an attempt to decrease the standard deviation in the temperature assay, another assay was conducted using a heat block during measurements. In all experiments, 5 uL enzyme (10 mg/ml) and 50 uL ABTS (1mg/ml) was added to 940 uL buffer. The concentration of ABTS in the reaction was 0,05 mg/ml. The measurements were conducted for two minutes to ensure temperature stability. The buffer was heated to the desired temperature in a water bath before the reaction. The reactions in 70 degrees stopped after 2 min, maybe due to temperature inactivation.

Wednesday 8/8
Protocols used: Enzyme activity and kinetics A pH assay was performed with the same concentrations as the temperature assay. New stock solutions were prepared: 3 mg ABTS was dissolved in 3 mL ABTS buffer. (conc: 1mg/ml) 5,5 mg enzyme + 550 uL buffer pH 4,5 (conc: 10mg/ml) The reaction was measured at 420 nm and the reaction consisted of: 50 uL ABTS in ABTS buffer (1 mg/ml), 5 uL laccase (10 mg/ml), and 945 uL buffer with the desired pH. pH 3, 4, 4,5, 5, 6 and 7 were investigated in triplicates.

The result can be seen below.
Below the same plot can be seen, but the values are converted from ΔAbs/min to U/mg (µmol product/min,mg enzyme). The mass of the added enzyme solution in the reaction is 0,05 mg. However the enzyme powder bought from sigma is not pure enzyme, therefore the true enzyme weight in the reaction is not known.

Monday 13/8
Protocols used: Enzyme activity and kinetics A kinetic assay was performed with ABTS concentrations between 0,005 mg/ml and 0,25 mg/ml. A buffer with pH 4 was used. 0,05 mg protein (commercial laccase) was used for all experiments. The result can be seen below.
The enzymatic activity dropped dramatically in the middle of the experiment, without any obvious reason. The experiment will be repeated. Sunday 19/8
Protocols used: not applicable Clone screening, day 4 Clone screening was done with 100 uL ABTS (1mg/ml) + 100 uL culture supernatant + 800 uL buffer. The absorbance at 420 nm was measured at different time points to evaluate the produced amount of enzyme.

Clone number
Abs420 at time t=0 min Abs420 at time t=30 min Difference in Abs420
1 0,3387 0,5411 0,2024
2 0,2675 0,9976 0,7301
3 0,2865 0,5426 0,2561
4 0,3028 0,5336 0,2308
5 0,2709 0,4516 0,1807
6 0,4286 0,7048 0,2762
7 0,2942 0,4159 0,1217
8 0,2995 0,2929 -0,0066
9 0,3188 0,4597 0,1409
10 0,2746 0,4856 0,2110
11 0,2963 0,5602 0,2639
12 0,2409 0,4430 0,2021
13 0,2954 0,4180 0,1226
14 0,3031 0,5001 0,1970
C 0,3514 0,3460 -0,0053
Clone screening day 5 Clone screening was done with 100 uL ABTS (1mg/ml) + 100 uL culture supernatant + 800 uL buffer. The absorbance at 420 nm was measured at different time points to evaluate the produced amount of enzyme.

Clone Abs420 time t=0 Abs420 time t=30
Abs420 time t=60
ΔAbs420 at 30 min
ΔAbs420 at 60 min
1 0,2499 1,023 1,6077 0,7731 1,3578
2 0,2593 1,3435 2,38 1,0842 2,1207
3 0,2623 0,9236 1,4419 0,6613 1,1796
4 0,2558 1,0466 1,5703 0,7908 1,3145
5 0,2591 1,1905 1,768 0,9314 1,5089
6 0,2659 1,0636 1,4806 0,7977 1,2147
7 0,245 0,6659 1,1516 0,4209 0,9066
8 0,2758 0,273 0,2714 -0,0028 -0,0044
9 0,2705 0,8345 1,3687 0,564 1,0982
10 0,2646 1,1043 1,7675 0,8397 1,5029
11 0,272 1,0575 1,5912 0,7855 1,3192
12 0,2722 1,0846 1,6978 0,8124 1,4256
13 0,2686 0,9503 1,5475 0,6817 1,2789
14 0,2751 1,0528 1,6281 0,7777 1,353
C 0,2634 0,2627 0,263 -0,0007 -0,0004
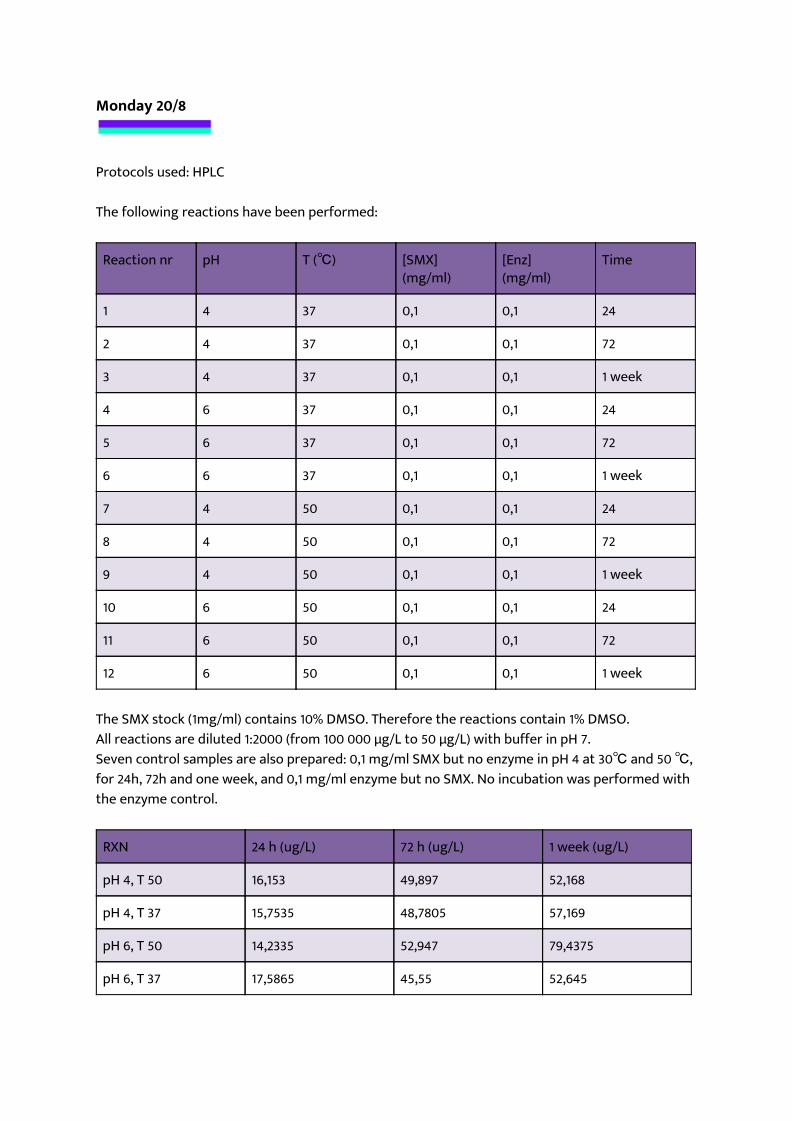
Monday 20/8
Protocols used: HPLC The following reactions have been performed:
Reaction nr pH T (℃) [SMX] (mg/ml)
[Enz] (mg/ml)
Time
1 4 37 0,1 0,1 24
2 4 37 0,1 0,1 72
3 4 37 0,1 0,1 1 week
4 6 37 0,1 0,1 24
5 6 37 0,1 0,1 72
6 6 37 0,1 0,1 1 week
7 4 50 0,1 0,1 24
8 4 50 0,1 0,1 72
9 4 50 0,1 0,1 1 week
10 6 50 0,1 0,1 24
11 6 50 0,1 0,1 72
12 6 50 0,1 0,1 1 week
The SMX stock (1mg/ml) contains 10% DMSO. Therefore the reactions contain 1% DMSO. All reactions are diluted 1:2000 (from 100 000 µg/L to 50 µg/L) with buffer in pH 7. Seven control samples are also prepared: 0,1 mg/ml SMX but no enzyme in pH 4 at 30℃ and 50 ℃, for 24h, 72h and one week, and 0,1 mg/ml enzyme but no SMX. No incubation was performed with the enzyme control.
RXN 24 h (ug/L) 72 h (ug/L) 1 week (ug/L)
pH 4, T 50 16,153 49,897 52,168
pH 4, T 37 15,7535 48,7805 57,169
pH 6, T 50 14,2335 52,947 79,4375
pH 6, T 37 17,5865 45,55 52,645

Control pH 4, T 50 14,561 44,902 116,052
Control pH 4, T 37 15,147 47,242 55,453
Tuesday 1/9
Protocols used: Enzyme activity and kinetics An enzymatic assay was performed with 0,05 mg/ml commercial laccase. ABTS concentration was 0,05 mg/ml. The aim of the assay was to evaluate the enzyme stability after incubation at pH 3, 4 and 5. The buffers used were mixed from citric acid and phosphate stocks as described before. The initial enzymatic activity was determined, and then the enzymatic activity was determined again after a 30-minute incubation. The results can be seen in the graph below.
We did not find a significant difference in activity before and after incubations (One-way ANOVA multiple comparisons test, n=3, p>0,05) Another enzymatic assay was performed with 0,05 mg/ml commercial laccase. ABTS concentration was 0,05 mg/ml. The aim of the assay was to evaluate the enzyme stability after

incubation at 40, 50 and 60 degrees. The buffers used were mixed from citric acid and phosphate stocks as described before. The initial enzymatic activity was determined, and then the enzymatic activity was determined again after a 30-minute incubation. The results can be seen in the graph below.
Error bars represent standard deviation. A statistically significant difference in activity is denoted as **** (One-way ANOVA and multiple comparisons test, p<0.0001, n=3). Sunday 8/9
Protocols used: Enzyme activity and kinetics An enzymatic assay with the commercial laccase was performed to compare the effect of temperature on enzymatic activity. The temperatures investigated were 5, 10, 20, 30, 40 and 50 degrees. All assays were performed in a citric acid-phosphate buffer at pH 4, with 0,05/ml mg ABTS and 0,05 mg/ml commercial laccase. The buffer was heated or cooled to the desired temperature in water baths, using a thermometer to control the buffer temperature, and the spectrophotometer temperature was controlled during the assay. The results can be seen below.

Error bars represent standard deviation. When increasing the temperature of the reaction, we observed a statistically significant increase in activity (linear regression, p<0.0001). Sunday 23/9
HPLC, calculating removal of SMX Protocols used: HPLC Procedure:
· pH 4 buffer for reactions since it’s optimal for the laccase, then dilution with pH 7 (quenching and preparing for HPLC)
· The concentrations in the reactions were 0.1 mg/ml SMX and 0.1 mg/ml laccase, with a total volume of 2 mL
· The reaction times were 3, 6 and 9 days · The HPLC were run with help of an advisor, Zhe Li, at Stockholms University
Tuesday 25/9
Protocols used: not applicable A size exclusion chromatography (SEC) was run with a 200 mL column. The aim was to purify the elution fraction from IMAC, by separating the two proteins by their size. The buffer used for SEC was PBS. The fractions were filtered (0,2 µm cut-off) before injection. 2 column volumes were run through the column at a 1 ml/ml flow (400 mL in total) to equilibrate before injection of the sample (1,8 mL). 1,5 column volumes (300 mL in total) were run through the column to elute the proteins. The detector saved signals at 220 nm and 280 nm. We expected a retention time of our proteins around 30 min - 1 hour. Unfortunately we didn’t see any distinct peaks at all during elution.

Friday 28/9
Protocols used: not applicable After IMAC purification, the protein concentration in the elution fractions were measured with NanoDrop. F3: 0,21 mg/ml F4: 0,65 mg/ml F5: 0,59 mg/ml F6: 0,36 mg/ml F7: 0,30 mg/ml A standard curve was made from a stock solution of BSA and Milli-Q, for determination of protein concentration on SDS-PAGE. Fractions 4-6 were also added on the same gel, in duplicates. The protein concentrations were: 2 mg/ml 1,5 mg/ml 1,0 mg/ml 0,75 mg/ml 0,5 mg/ml 0,25 mg/ml 0,125 mg/ml 0,025 mg/ml 0 mg/ml (Control) The gel can be seen below. The upper image shows concentrations 1 mg/ml to 0 mg/ml in lanes 1-7 seen from left. To the far right the protein ladder is visible. The lower image shows the protein ladder to the far left, followed by fractions 4-6 in duplicates (4 in lanes 2 and 3 etc). One distinct band can be seen on the image showing the standard curve at 70 kDa, which corresponds to BSA. Three bands are visible on the elution fractions, at approximately 55 kDa, 70 kDa and 90 kDa. We suspect that the 70 kDa band is leakage from BSA since it shows the same intensity in all three fractions, while the other proteins in the different fractions have different intensities depending on the total protein concentration. The band at 55 kDa is laccase.

The band intensities were determined for the elution fractions, and together with the determined total protein concentration (NanoDrop) the laccase concentration could be estimated.

Sunday 30/9
Protocols used: Enzyme activity and kinetics Fraction 4 (see lab book from friday) was used to determine the kinetic constants of our wild type laccase using ABTS as substrate. The ABTS concentration was varied while the enzyme concentration was kept constant. The citric acid-phosphate buffer was kept at 30 degrees in a water bath, and the spectrophotometer was also temperature controlled to 30 degrees. The concentrations measures ranged from 0,05 mg/ml to 0,3 mg/ml ABTS. The result can be seen below.
The kinetic parameters found with non-linear regression were: KM = 0.15 ± 0.0091 mg/ml ABTS vmax = 29 ± 0.84 µM/min
Using Nanodrop, the total protein concentration in the elution fraction from IMAC was determined to 0,65 mg/ml. The fraction of laccase on the gel was 35 % based on the band intensities. In this way, the laccase concentration in the fraction was estimated to be 0.23 mg/ml. The molar mass of laccase is estimated to be 55 kDa, without glycosylations. From the Michaelis-Menten model fitted to our experimental data, and the estimated laccase concentration, kcat was determined to be 4.2 s-1.