active management since 2001 · dow jones historical trends ... calculated by guggenheim...
TRANSCRIPT

Providing Investment Management of:
• Fee Based Brokerage Accounts
• Variable Annuities
• Retirement Platforms and
Participant Accounts
Active Management Since 2001
If the industry professional presenting this material is associated with a broker dealer please know that Hanlon is unaffiliated with that broker dealer
and it is that broker dealer’s responsibility to make sure their associated person presents proper identification of that broker dealer.
PRESENTED BY
John L. Smallwood, CFP® Senior Wealth Advisor
Smallwood Capital Management Commonwealth Financial Network

There are problems in the world of
managing investments...
Have your investments, managed by a buy & hold
strategy, suffered because of market conditions?
How do you protect your capital and maximize your
potential returns with all the conflicting information
in the marketplace?

Average
Fixed
Income
Investor
Barclay’s
Aggregate
Bond
Index Difference
20 Years 0.98% 6.34% -5.36%
10 Years 1.17% 5.18% -4.01%
5 Years 1.64% 5.95% -4.31%
3 Years 2.85% 6.19% -3.34%
2012 4.68% 4.21% 0.47%
The average fixed
income investor
underperformed the
Barclay’s Aggregate
Bond Index for the
last 3, 5, 10 and 20
years.
-5.36 Percent 20 Year Annual
Underperformance
Average Fixed Income Investor Returns
Source: Dalbar Quantitative Analysis of Investor Behavior, April 2013.
Past performance is no guarantee of future results.
The Barclay’s Aggregate Bond Index is an unmanaged index that tracks the broader US Investment-
grade, fixed-rate, and taxable areas of the bond market. It cannot be invested in directly.

Average
Equity
Investor
S&P
500
Index Difference
20 Years 4.25% 8.21% -3.96%
10 Years 6.05% 7.10% -1.05%
5 Years -0.84% 1.66% -2.50%
3 Years 7.63% 10.87% -3.24%
2012 15.56% 15.98% -0.42%
The average
equity investor
underperformed the
S&P 500 Index for
the last 1, 3, 5, 10
and 20 years.
-3.96 Percent 20 Year Annual
Underperformance
Average Equity Investor Returns
Source: Dalbar Quantitative Analysis of Investor Behavior, April 2013.
Past performance is no guarantee of future results.

Dow Jones Historical Trends 1897-2012 (Without Dividends)
as of 12/31/2012
Performance displayed represents past performance, which is no guarantee of future results. This information is for illustrative purposes only and should not be construed as a recommendation of any
particular security or strategy. Index performance is for illustration purposes only and is not meant to represent any particular fund. Returns do not reflect any management fees, transaction costs or
expenses. The index is unmanaged and not available for direct investment. The Dow Jones Industrial Average is a price-weighted average of 30 significant stocks traded on the New York Stock
Exchange and the NASDAQ. Returns do not reflect dividends, management fees, transaction costs or expenses. There is no guarantee that prior markets will be duplicated. *Diversification neither
assures a profit nor eliminates the risk of experiencing investment losses. No investment strategy can guarantee returns in a declining market.
Source: Calculated by Guggenheim Investments using data from dowjones.com
-4.29%
Cumulative
Return
18 yrs.
1.69%
Cumulative
Return
25 yrs.
0.83%
Cumulative
Return
17 yrs.
13.98%
Cumulative
Return
13 yrs.
148.92%
Cumulative
Return
9 yrs.
294.66%
Cumulative
Return
5 yrs.
154.29%
Cumulative
Return
11 yrs.
1059.31%
Cumulative
Return
17 yrs.
40.45
10
100
1,000
10,000
13,104.14
1.1897-
1.1906
2.1906-6.1924 9.1929-11.1954 12.1954-
1.1966
2.1966-
10.1982
11.1982-12.1999 1.2000-
12.2012
7.1924-
8.1929

-
200
400
600
800
1,000
1,200
1,400
1,600
1,800
2000 2001 2002 2003 2004 2005 2006 2007 2008 2009 2010 2011 2012 2013
What would have happened if... you were able to be defensive and offensive at the right times?
S&P 500 Index 2000-2013 (Without Dividends)
as of 12/31/2013
Please review disclosures (a) and (c) on the Important Disclosure Information slides.
Past performance is not indicative of future results.

Impact of Losses
Portfolio A Portfolio B
Starting Value $100,000 $100,000
Year 1 Return -35% -2%
Year 2 Return +25% +25%
Year 3 Return +15% +9%
Ending Value $93,438 $133,525
Potential Portfolio
Investment Loss
Gain Required to Get Back to Even
-10% +11%
-20% +25%
-30% +43%
-40% +67%
-50% +100%
How One Large
Negative Year Can
Impact Your Portfolio
Past performance is not indicative of future results.

Active Management Strategy Goal
Hanlon provides Tactical Asset Allocation
Past performance is not indicative of future results.

7/26
10/24
1/3 3/7
8/2210/21
2/26
8/22
2/18 7/1
5/25
11/28
7/12
8/3012/12 2/8
6/7
9/24
1/29
7/25
1/30 4/21
3/21
9/23
5/23
250
300
350
400
450
500
550
600
2002 2003 20042001
Buy
Sell
2005 2006
Major High Yield Bond
Tactical Research Signals
IMPORTANT DISCLOSURE –This chart represents the dates that our
research department identified changes in the market trend using our
proprietary combination of technical, quantitative, and volume analyses.
Hanlon Investment Management then identifies the asset class with the
best risk-adjusted return potential in the current market and selects funds
from the universe of mutual funds for our client accounts. Buys and Sells
may or may not have occurred on the exact dates shown. These dates do
not necessarily reflect transactions applied to every individual account.
An indication of a green or red arrow on the chart indicates a decision by
Hanlon to increase or decrease, by at least 20% of portfolio assets the
holdings in high yield bonds in those accounts comprising the Hanlon
Brokerage Managed Income Composite. The Merrill Lynch U.S. High
Yield Master II Index cannot be invested in directly. The Merrill Lynch U.S.
High Yield Master II Index is composed of many high yield bonds. High
yield bonds typically have credit ratings of less than BBB, or below
investment grade. Actual trading started in July of 2001.
2001-2006
Merrill Lynch U.S. High Yield Master II Index
Hanlon’s Strategy:
• Green arrows represent OFFENSIVE
• Red arrows represent DEFENSIVE
Past performance is not indicative of future results.

8/2412/7 4/18
5/16
12/24
1/283/27
5/5
3/25
9/15
10/20
7/3
7/18
6/8 11/8
12/17
5/8
5/23
6/11
3/2
2/10
5/20
6/178/8
6/4
6/56/21
350
400
450
500
550
600
650
700
750
800
850
900
950
1000
1050
Buy
Sell
2007 2008 2009 2010 2011 2012 2013
IMPORTANT DISCLOSURE –This chart represents the dates that our
research department identified changes in the market trend using our
proprietary combination of technical, quantitative, and volume analyses.
Hanlon Investment Management then identifies the asset class with the
best risk-adjusted return potential in the current market and selects funds
from the universe of mutual funds for our client accounts. Buys and Sells
may or may not have occurred on the exact dates shown. These dates do
not necessarily reflect transactions applied to every individual account.
An indication of a green or red arrow on the chart indicates a decision by
Hanlon to increase or decrease, by at least 20% of portfolio assets the
holdings in high yield bonds in those accounts comprising the Hanlon
Brokerage Managed Income Composite. The Merrill Lynch U.S. High
Yield Master II Index cannot be invested in directly. The Merrill Lynch U.S.
High Yield Master II Index is composed of many high yield bonds. High
yield bonds typically have credit ratings of less than BBB, or below
investment grade. Actual trading started in July of 2001.
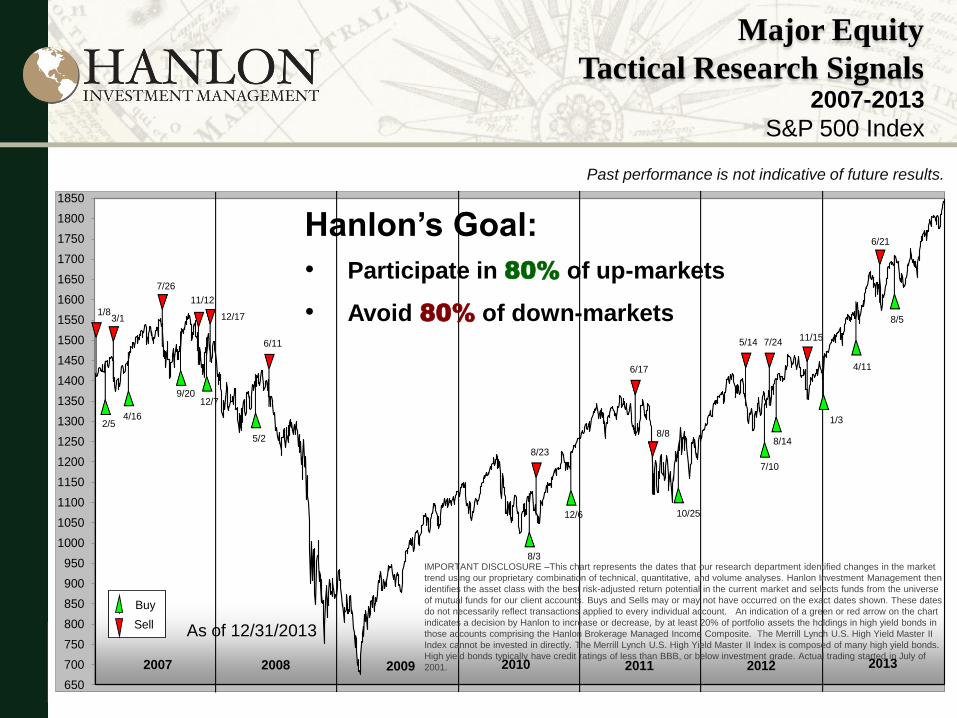
Hanlon’s Goal:
• Participate in 80% of up-markets
• Avoid 80% of down-markets
As of 12/31/2013
2007-2013
Merrill Lynch U.S. High Yield Master II Index
Major High Yield Bond
Tactical Research Signals
Past performance is not indicative of future results.

12/29
5/18
10/26
3/7
5/3
8/2010/21
1/10
3/18
8/21
10/10
6/8
9/3
3/86/1
11/4
8/4
9/13
1/26
7/9
1/23 4/4
5/10
9/18
12/18
1/24
7/25 9/29
3/16
8/6
1/7 4/12 10/11
5/15
8/10
700
750
800
850
900
950
1000
1050
1100
1150
1200
1250
1300
1350
1400
1450
2001 2002 2003 2004
Buy
Sell
2005 2006
Major Equity
Tactical Research Signals
IMPORTANT DISCLOSURE –This chart represents the dates that our
research department identified changes in the market trend using our
proprietary combination of technical, quantitative, and volume analyses.
Hanlon Investment Management then identifies the asset class with the
best risk-adjusted return potential in the current market and selects funds
from the universe of mutual funds for our client accounts. Buys and Sells
may or may not have occurred on the exact dates shown. These dates do
not necessarily reflect transactions applied to every individual account.
An indication of a green or red arrow on the chart indicates a decision by
Hanlon to increase or decrease, by at least 20% of portfolio assets the
holdings in high yield bonds in those accounts comprising the Hanlon
Brokerage Managed Income Composite. The Merrill Lynch U.S. High
Yield Master II Index cannot be invested in directly. The Merrill Lynch U.S.
High Yield Master II Index is composed of many high yield bonds. High
yield bonds typically have credit ratings of less than BBB, or below
investment grade. Actual trading started in July of 2001.
2001-2006
S&P 500 Index
Hanlon’s Strategy:
• Green arrows represent OFFENSIVE
• Red arrows represent DEFENSIVE
Past performance is not indicative of future results.
2/54/16
9/2012/7
5/2
8/3
12/6 10/25
7/10
8/14
1/3
4/11
8/51/8
3/1
7/26
11/12
12/17
6/11
8/23
6/17
8/8
5/14 7/2411/15
6/21
650
700
750
800
850
900
950
1000
1050
1100
1150
1200
1250
1300
1350
1400
1450
1500
1550
1600
1650
1700
1750
1800
1850
Buy
Sell
2007 2008 2009 2010 2011 2012 2013
IMPORTANT DISCLOSURE –This chart represents the dates that our research department identified changes in the market
trend using our proprietary combination of technical, quantitative, and volume analyses. Hanlon Investment Management then
identifies the asset class with the best risk-adjusted return potential in the current market and selects funds from the universe
of mutual funds for our client accounts. Buys and Sells may or may not have occurred on the exact dates shown. These dates
do not necessarily reflect transactions applied to every individual account. An indication of a green or red arrow on the chart
indicates a decision by Hanlon to increase or decrease, by at least 20% of portfolio assets the holdings in high yield bonds in
those accounts comprising the Hanlon Brokerage Managed Income Composite. The Merrill Lynch U.S. High Yield Master II
Index cannot be invested in directly. The Merrill Lynch U.S. High Yield Master II Index is composed of many high yield bonds.
High yield bonds typically have credit ratings of less than BBB, or below investment grade. Actual trading started in July of
2001.
Hanlon’s Goal:
• Participate in 80% of up-markets
• Avoid 80% of down-markets
As of 12/31/2013
2007-2013
S&P 500 Index
Major Equity
Tactical Research Signals
Past performance is not indicative of future results.

Sources: Bureau of Labor Statistics,
Consumer Price Index (CPI-U) As of 12/31/2013
2001 Through
2013 Performance &
Risk Management
2.36% Inflation
5.51% Hanlon Growth
4.59% S&P 500
(Performance Net of Fees)
9.34% Hanlon
Managed Income
6.71% Hanlon
Balanced 5.51% Hanlon
Growth & Income
Brokerage Composite Average Annual Returns
Investors should understand that the performance data presented comparing the four managed composites to the S&P 500
varies greatly and that depending upon the holdings within each composite, the volatility of the composites may be higher or
lower than that of the S&P 500. Past performance is no guarantee of future results. All returns are net after fees.
. Please review disclosures (a) and (c) on the Important Disclosure Information slides.

2001 Through
2013 Risk & Volatility
As Measured By Beta
Past performance is not indicative of future results. All returns are net after fees.
S&P 500 Index 1.00
Hanlon Growth 62% Less .38
Hanlon Growth & Income
69% Less .31
Hanlon Balanced 72% Less .28
Hanlon Managed Income 82% Less .18
Please review disclosures (a) and (c) on the Important Disclosure Information slides.
The beta coefficient, is a number that
describes the relationship between an
investment's return and the overall
market's return. A beta greater than 1
implies a portfolio would be above the
S&P 500 Index when the market is up,
and would be lower than the S&P 500
Index when the market goes down.
Small values of beta mean the portfolio's
return is relatively unaffected by the
swings in the overall market's return.
Beta depends on two factors, multiplied
together: the relative volatility of a
portfolio's returns compared to the
market's returns, and the correlation of
the portfolio's returns to the market's
returns.
As of 12/31/2013

Performance vs.
S&P 500 Index 2001 Through
2013
Performance stated is Hanlon Composite Brokerage.
Past performance is not indicative of future results. All returns are net after fees.
As of 12/31/2013

Performance vs.
S&P 500 Index
As of 12/31/2013
2001 Through
2013 Past performance is not indicative of of future results. All returns are net after fees.

With Income Distribution
Table includes 6% annual distributions.
2001 Through
2013 Past performance is not indicative of future results. All returns are net after fees.

With Income Distribution
2001 Through
2013
Table includes 6% annual distributions.
Past performance is not indicative of future results. All returns are net after fees.

Past performance is not indicative of future results.
Dispersion: A measure of the average difference in annual performance between the composite return and the returns of the individual accounts making up the composite.
3 year Standard Deviation: The mathematical calculation that measures the variance over time of a set of data around its average.
Brokerage Composites Annual Performance
Important Disclosure Information
Total Firm Growth Composite Assets Annual Performance Results
Year Assets U.S. Dollars % of Firm Number of Net Blended 3 Year Standard Deviation Composite
End (millions) (millions) Assets Accounts Composite Benchmark Composite Benchmark Dispersion
2012 3738 41 1% 382 8.91% 12.17% 7.70% 11.63% 0.66%
2011 3010 39 1% 398 -3.43% 1.69% 8.42% 14.34% 0.55%
2010 2577 32 1% 338 0.11% 11.61% 7.94% 16.63% 0.55%
2009 1400 24 2% 279 28.92% 20.28% 10.64% 14.87% 4.4%
2008 607 17 3% 266 (3.63%) (28.65%) 11.57% 11.44% 0.6%
2007 642 26 4% 386 (11.96%) 5.39% 13.42% 5.94% 0.7%
2006 637 38 6% 360 16.09% 13.21% 13.58% 5.26% 1.8%
2005 513 29 6% 271 (7.10%) 4.50% 13.82% 6.94% 1.4%
2004 369 19 5% 155 11.32% 8.69% 12.79% 11.30% 2.8%
2003 163 11 7% 83 22.99% 22.03% 14.49% 13.71% 3.3%
Total Firm Growth & Income Composite Assets Annual Performance Results
Year Assets U.S. Dollars % of Firm Number of Net Blended 3 Year Standard Deviation Composite
End (millions) (millions) Assets Accounts Composite Benchmark Composite Benchmark Dispersion
2012 3738 242 6% 1820 9.11% 12.29% 7.08% 9.48% 0.67%
2011 3010 209 7% 1696 -3.10% 2.08% 8.05% 11.90% 0.56%
2010 2577 169 7% 1356 1.21% 11.49% 7.44% 14.71% 0.58%
2009 1400 91 7% 720 30.10% 24.31% 9.18% 13.60% 4.0%
2008 607 43 7% 538 (2.96%) (26.32%) 8.76% 10.71% 0.7%
2007 642 71 11% 780 (8.16%) 4.11% 9.92% 5.01% 1.4%
2006 637 74 12% 749 13.18% 12.21% 9.39% 4.25% 1.1%
2005 513 58 12% 559 (3.54%) 3.88% 9.76% 5.60% 0.9%
2004 369 29 8% 238 9.10% 8.61% 9.44% 9.18% 0.9%
2003 163 10 6% 74 22.80% 21.73% 10.42% 11.19% 0.7%

Past performance is not indicative of future results.
Dispersion: A measure of the average difference in annual performance between the composite return and the returns of the individual accounts making up the composite.
3 year Standard Deviation: The mathematical calculation that measures the variance over time of a set of data around its average.
Brokerage Composites Annual Performance
Important Disclosure Information
Total Firm Balanced Composite Assets Annual Performance Results
Year Assets U.S. Dollars % of Firm Number of Net Blended 3 Year Standard Deviation Composite
End (millions) (millions) Assets Accounts Composite Benchmark Composite Benchmark Dispersion
2012 3738 539 14% 3827 9.58% 12.56% 6.45% 8.23% 0.96%
2011 3010 406 13% 3071 -2.83% 2.44% 7.75% 10.68% 0.66%
2010 2577 337 13% 2409 2.31% 11.45% 7.10% 13.95% 0.87%
2009 1400 145 10% 858 30.94% 27.65% 7.90% 13.22% 3.5%
2008 607 42 7% 308 (2.27%) (25.06%) 6.27% 10.48% 1.2%
2007 642 51 8% 398 (3.88%) 3.17% 7.13% 4.50% 1.3%
2006 637 50 8% 349 12.21% 11.60% 6.77% 3.72% 0.9%
2005 513 40 8% 295 (0.60%) 3.44% 7.33% 4.93% 1.4%
2004 369 29 8% 143 8.89% 8.68% 7.74% 8.11% 1.4%
2003 163 11 7% 75 26.73% 21.87% N.A. N.A. 3.8%
Total Firm Managed Income Composite Assets Annual Performance Results
Year Assets U.S. Dollars % of Firm Number of Net Blended 3 Year Standard Deviation Composite
End (millions) (millions) Assets Accounts Composite Benchmark Composite Benchmark Dispersion
2012 3738 1688 45% 11455 10.12% 11.62% 4.92% 5.11% 0.67%
2011 3010 1106 37% 8188 0.59% 3.00% 7.24% 8.20% 0.78%
2010 2577 787 31% 5651 6.21% 9.74% 6.94% 11.90% 0.73%
2009 1400 378 27% 2542 30.28% 31.70% 6.26% 11.83% 3.9%
2008 607 105 17% 819 (0.95%) (18.87%) 2.50% 9.13% 0.8%
2007 642 71 11% 550 5.52% 1.21% 2.49% 3.28% 1.5%
2006 637 56 9% 444 9.21% 9.37% 2.76% 2.83% 1.1%
2005 513 59 12% 481 3.78% 2.35% 4.72% 4.04% 2.6%
2004 369 47 12% 387 8.84% 7.90% 6.15% 6.27% 3.9%
2003 163 20 12% 164 29.30% 19.45% N.A. N.A. 6.9%
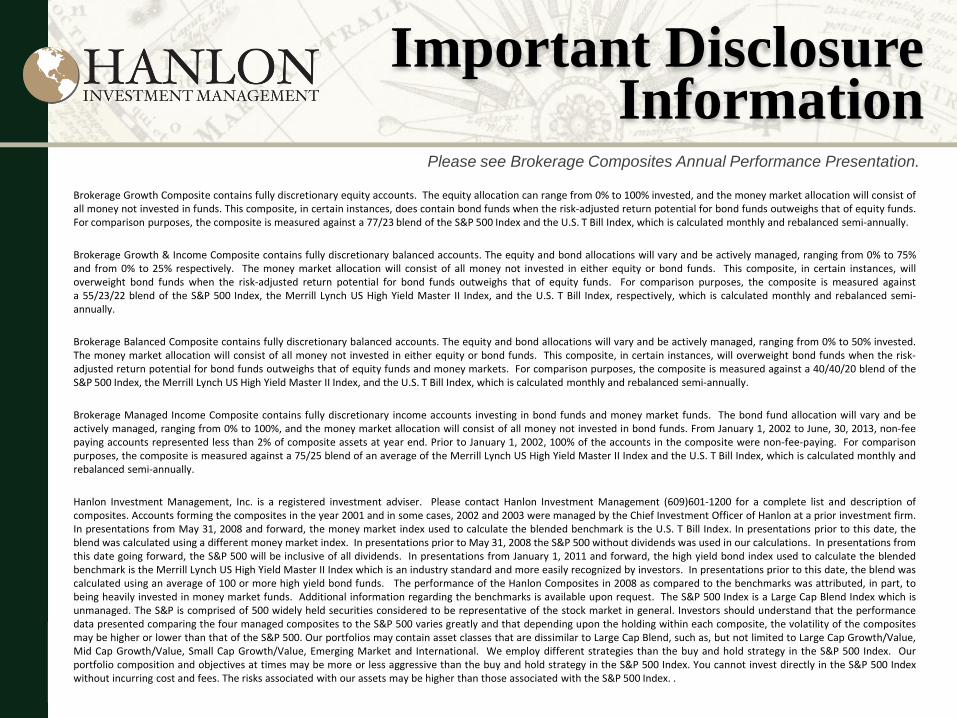
Brokerage Growth Composite contains fully discretionary equity accounts. The equity allocation can range from 0% to 100% invested, and the money market allocation will consist of all money not invested in funds. This composite, in certain instances, does contain bond funds when the risk-adjusted return potential for bond funds outweighs that of equity funds. For comparison purposes, the composite is measured against a 77/23 blend of the S&P 500 Index and the U.S. T Bill Index, which is calculated monthly and rebalanced semi-annually.
Brokerage Growth & Income Composite contains fully discretionary balanced accounts. The equity and bond allocations will vary and be actively managed, ranging from 0% to 75% and from 0% to 25% respectively. The money market allocation will consist of all money not invested in either equity or bond funds. This composite, in certain instances, will overweight bond funds when the risk-adjusted return potential for bond funds outweighs that of equity funds. For comparison purposes, the composite is measured against a 55/23/22 blend of the S&P 500 Index, the Merrill Lynch US High Yield Master II Index, and the U.S. T Bill Index, respectively, which is calculated monthly and rebalanced semi-annually.
Brokerage Balanced Composite contains fully discretionary balanced accounts. The equity and bond allocations will vary and be actively managed, ranging from 0% to 50% invested. The money market allocation will consist of all money not invested in either equity or bond funds. This composite, in certain instances, will overweight bond funds when the risk-adjusted return potential for bond funds outweighs that of equity funds and money markets. For comparison purposes, the composite is measured against a 40/40/20 blend of the S&P 500 Index, the Merrill Lynch US High Yield Master II Index, and the U.S. T Bill Index, which is calculated monthly and rebalanced semi-annually.
Brokerage Managed Income Composite contains fully discretionary income accounts investing in bond funds and money market funds. The bond fund allocation will vary and be actively managed, ranging from 0% to 100%, and the money market allocation will consist of all money not invested in bond funds. From January 1, 2002 to June, 30, 2013, non-fee paying accounts represented less than 2% of composite assets at year end. Prior to January 1, 2002, 100% of the accounts in the composite were non-fee-paying. For comparison purposes, the composite is measured against a 75/25 blend of an average of the Merrill Lynch US High Yield Master II Index and the U.S. T Bill Index, which is calculated monthly and rebalanced semi-annually.
Hanlon Investment Management, Inc. is a registered investment adviser. Please contact Hanlon Investment Management (609)601-1200 for a complete list and description of composites. Accounts forming the composites in the year 2001 and in some cases, 2002 and 2003 were managed by the Chief Investment Officer of Hanlon at a prior investment firm. In presentations from May 31, 2008 and forward, the money market index used to calculate the blended benchmark is the U.S. T Bill Index. In presentations prior to this date, the blend was calculated using a different money market index. In presentations prior to May 31, 2008 the S&P 500 without dividends was used in our calculations. In presentations from this date going forward, the S&P 500 will be inclusive of all dividends. In presentations from January 1, 2011 and forward, the high yield bond index used to calculate the blended benchmark is the Merrill Lynch US High Yield Master II Index which is an industry standard and more easily recognized by investors. In presentations prior to this date, the blend was calculated using an average of 100 or more high yield bond funds. The performance of the Hanlon Composites in 2008 as compared to the benchmarks was attributed, in part, to being heavily invested in money market funds. Additional information regarding the benchmarks is available upon request. The S&P 500 Index is a Large Cap Blend Index which is unmanaged. The S&P is comprised of 500 widely held securities considered to be representative of the stock market in general. Investors should understand that the performance data presented comparing the four managed composites to the S&P 500 varies greatly and that depending upon the holding within each composite, the volatility of the composites may be higher or lower than that of the S&P 500. Our portfolios may contain asset classes that are dissimilar to Large Cap Blend, such as, but not limited to Large Cap Growth/Value, Mid Cap Growth/Value, Small Cap Growth/Value, Emerging Market and International. We employ different strategies than the buy and hold strategy in the S&P 500 Index. Our portfolio composition and objectives at times may be more or less aggressive than the buy and hold strategy in the S&P 500 Index. You cannot invest directly in the S&P 500 Index without incurring cost and fees. The risks associated with our assets may be higher than those associated with the S&P 500 Index. .
Please see Brokerage Composites Annual Performance Presentation.
Important Disclosure Information

The minimum account size for our composites is $15 thousand. Results are based on fully discretionary fee paying accounts under management, including those accounts no longer with the firm. Although individual leveraged investments may be used in a composite portfolio, leverage is not part of the overall strategy of these composites. Accounts in the composite may use margin. Very rarely at the request of the client to accommodate a withdrawal of funds without having to liquidate the current positions we will allow margin (leverage) to be employed in the account, only to have it eliminated upon any sales or the re-depositing to the account of the withdrawn funds. Past performance is not indicative of future results. The U.S. Dollar is the currency used to express performance. Returns are presented net of actual management fees and include the reinvestment of all income. The annual composite dispersions presented are an asset-weighted standard deviation calculated for the accounts in the composites for the entire year. Policies for valuing portfolios, calculating performance, and preparing compliant presentations are available upon request.
FEE SCHEDULE
Portfolio Value Fee
On the first $499,999 2.20% annually, then
On the next $500,000 to $999,999 1.70% annually, then
On the next $1,000,000 and above 1.20% annually
Hanlon Investment Management, Inc. claims compliance with the Global Investment Performance Standards (GIPS®) and has prepared and presented this report in compliance with the GIPS standards. Hanlon Investment Management, Inc. has been independently verified for the periods January 1, 2001 through June 30, 2013. Verification assesses whether (1) the firm has complied with all the composite construction requirements of the GIPS standards on a firm-wide basis and (2) the firm’s policies and procedures are designed to calculate and present performance in compliance with the GIPS standards. The Brokerage Growth Composite has been examined for the periods January 1, 2001 through March 31, 2013. The Brokerage Managed Income Composite has been examined for the periods October 1, 2001 through June 30, 2013. The verification and performance examination reports are available upon request. Verification does not ensure the accuracy of any specific composite presentation. The Brokerage Growth, Growth & Income, Balanced, and Managed Income Composites were created April 1, 2004.
Important Disclosure Information
Is Active Management
Right For You?
• What are you currently doing to protect against significant drops in the market?
• How important is preservation of capital to you?
• Is it possible to manage risk and grow your account at the same time?
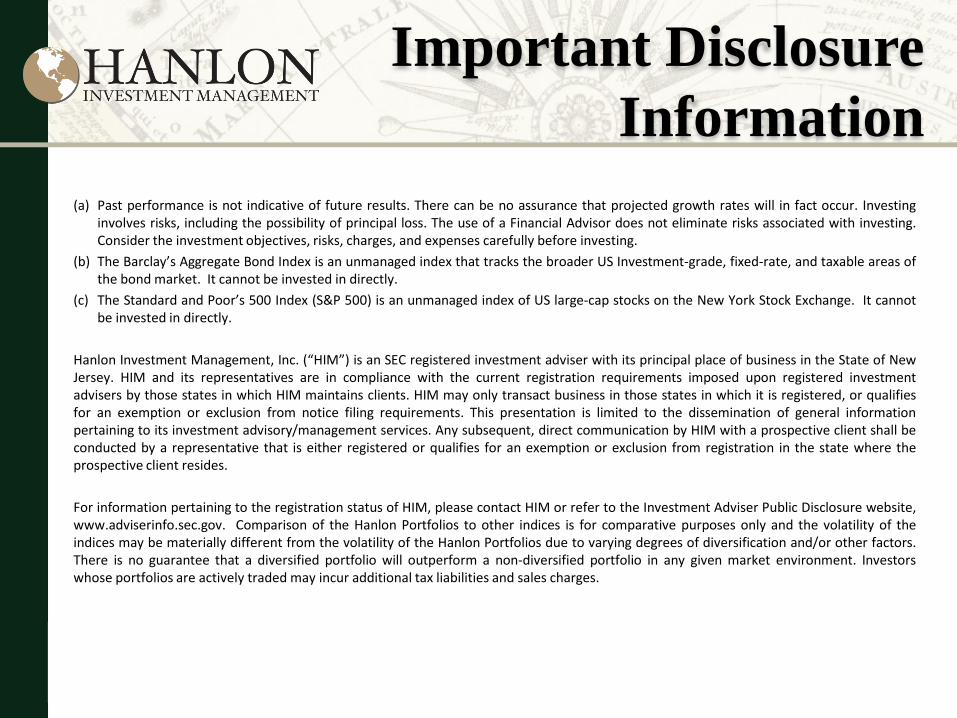
(a) Past performance is not indicative of future results. There can be no assurance that projected growth rates will in fact occur. Investing involves risks, including the possibility of principal loss. The use of a Financial Advisor does not eliminate risks associated with investing. Consider the investment objectives, risks, charges, and expenses carefully before investing.
(b) The Barclay’s Aggregate Bond Index is an unmanaged index that tracks the broader US Investment-grade, fixed-rate, and taxable areas of the bond market. It cannot be invested in directly.
(c) The Standard and Poor’s 500 Index (S&P 500) is an unmanaged index of US large-cap stocks on the New York Stock Exchange. It cannot be invested in directly.
Hanlon Investment Management, Inc. (“HIM”) is an SEC registered investment adviser with its principal place of business in the State of New Jersey. HIM and its representatives are in compliance with the current registration requirements imposed upon registered investment advisers by those states in which HIM maintains clients. HIM may only transact business in those states in which it is registered, or qualifies for an exemption or exclusion from notice filing requirements. This presentation is limited to the dissemination of general information pertaining to its investment advisory/management services. Any subsequent, direct communication by HIM with a prospective client shall be conducted by a representative that is either registered or qualifies for an exemption or exclusion from registration in the state where the prospective client resides.
For information pertaining to the registration status of HIM, please contact HIM or refer to the Investment Adviser Public Disclosure website, www.adviserinfo.sec.gov. Comparison of the Hanlon Portfolios to other indices is for comparative purposes only and the volatility of the indices may be materially different from the volatility of the Hanlon Portfolios due to varying degrees of diversification and/or other factors. There is no guarantee that a diversified portfolio will outperform a non-diversified portfolio in any given market environment. Investors whose portfolios are actively traded may incur additional tax liabilities and sales charges.
Important Disclosure
Information
Investors should understand that the composites presented are not registered under the Investment Company Act of 1940 (the Act) and are not subject to the provisions of the Act. While some of the underlying investments used to manage the composites such as mutual funds are registered, the composites themselves are unregistered. Unregistered offerings are not held to the same level of regulatory oversight as investment companies that must register under the Act. All investments involve risk, including the potential loss of principal invested. Foreign investments involve special risks including greater economic, political, and currency fluctuation risks, which may be even greater in emerging markets. Equity investments such as Large Cap funds are volatile and fluctuate in response to company-specific factors, general market, political, regulatory, and economic conditions. Mid Cap equities typically carry additional risk, since smaller companies generally have higher risk of failure and, historically, their stocks have experienced a greater degree of volatility. Small Cap equities involve greater risk than securities of larger, more-established companies, as they often have limited product lines, markets or financial resources and may be exposed to more erratic and more-abrupt market movements. They may focus its investments on certain economic sectors, thereby increasing its vulnerability to any single economic, political or regulatory development. Please see the prospectus for further information on these and other risk considerations. Lower-rated debt securities (commonly referred to as junk bonds) involve additional risks because of the lower credit quality of the securities in the portfolio. The investor should be aware of the possible higher level of volatility, and increased risk of default. Debt securities are sensitive to interest rate changes. When interest rates increase, the value of a debt security tends to decrease.
There are fees associated with accounts managed by HIM. Actual client accounts may incur other transaction costs such as brokerage commissions, custodial costs, and other expenses. Short term redemption fees may be assessed against client accounts as a result of varying entry dates due to management inception, allocation changes, or addition of new dollars. Client account performance may be impacted by varying execution dates due to custodian limitations on trade volume, and also by fund availability in each individual account. The net compounded impact of the deductions of such fees over time will be affected by the amount of the fees, the time period, and the investment performance. Different types of investment involve varying degrees of risk, including the possibility of principal loss and there can be no assurance that any specific investment will be profitable. Past performance is no guarantee of future results. For additional information about HIM, including fees and services, send for our disclosure statement as set forth on Form ADV from us using the contact information herein. Please read the disclosure statement carefully before you invest or send money. The investment return and principal value of an investment will fluctuate; and that an investor’s equity when liquidated may be worth less than the original cost.
Important Disclosure
Information

Providing Investment Management of:
• Fee Based Brokerage Accounts
• Variable Annuities
• Retirement Platforms and
Participant Accounts
Active Management Since 2001
If the industry professional presenting this material is associated with a broker dealer please know that Hanlon is unaffiliated with that broker dealer
and it is that broker dealer’s responsibility to make sure their associated person presents proper identification of that broker dealer.
PRESENTED BY
John L. Smallwood, CFP® Senior Wealth Advisor
Smallwood Capital Management Commonwealth Financial Network