active energy harvesting
TRANSCRIPT

The Pennsylvania State University
The Graduate School
Department of Electrical Engineering
ACTIVE ENERGY HARVESTING
A Thesis in
Electrical Engineering
by
Yiming Liu
2006 Yiming Liu
Submitted in Partial Fulfillment
of the Requirements
for the Degree of
Doctor of Philosophy
December 2006

The thesis of Yiming Liu was reviewed and approved* by the following:
Heath F. Hofmann
Associate Professor of Electrical Engineering
Thesis Advisor
Chair of Committee
Qiming Zhang
Professor of Electrical Engineering
George A. Lesieutre
Professor and Head of Aerospace Engineering
Jeffrey Mayer
Associate Professor of Electrical Engineering
W. Kenneth Jenkins
Professor and Head of Electrical Engineering
*Signatures are on file in the Graduate School
iii
ABSTRACT
Harvesting energy from the ambient environment is an enabling technology for
wide deployment of wireless sensor networks. Converting mechanical energy to electrical
energy using piezoelectric and electrostrictive materials has been the choice for many
energy harvesting applications. The energy harvesting circuit is the interface between a
piezoelectric/electrostrictive device and electrical load. A conventional view of energy
harvesting circuitry is based on power conditioning concepts, which often involve AC to
DC conversion and voltage regulation. In fact, an energy harvesting circuit also applies
electrical boundary conditions to the device during energy conversion which are crucial
for optimizing the harvested energy. This thesis presents a study of a relatively new type
of energy harvesting approach: active energy harvesting.
In this thesis, energy harvesting using both piezoelectric and electrostrictive
materials is investigated. For each type of material, a theoretical model of energy
conversion process is established, based on the electro-mechanical boundary conditions
applied to the device by different energy harvesting circuits. This modeling technique has
certain advantages over a harmonic analysis approach. First, it gives a more intuitive
picture in terms of understanding the energy harvesting process than the harmonic
analysis approach. Second, it is more general in its conclusions, that is the input
mechanical excitation and electrical boundary conditions are not constrained to sinusoidal
form but instead represented by several critical states of the electro-mechanical boundary
conditions. Finally, for nonlinear materials, such as electrostrictive polymer, a linear
iv
harmonic analysis is no longer applicable, while the presented technique does not have
this limitation.
As a result of better understanding the importance of electromechanical boundary
conditions in the energy conversion process, questions were raised: what is the best
electrical boundary condition for a given mechanical excitation? And how to achieve the
maximum power conversion? This thesis answers these questions by presenting the
relatively new concept of active energy harvesting, which uses switch-mode power
electronics to control the voltage and/or current of the piezoelectric/electrostrictive
devices. Two control strategies, voltage control and charge control mode of operation are
presented.
Practically, power electronic circuits are not 100 percent power efficient, which
greatly influences the performance of active energy harvesting system. We also address
this issue by taking into account the loss due to reactive power flow between the
piezoelectric/electrostrictive device and the energy storage unit.
Experimental results of active energy harvesting are also presented for both
piezoelectric and electrostrictive polymers. The model is validated by comparing
theoretical prediction with experimental data. The experimental results also demonstrated
superior energy harvesting performance over conventional diode rectifier circuits.
v
TABLE OF CONTENTS
LIST OF FIGURES .....................................................................................................viii
LIST OF TABLES.......................................................................................................xi
ACKNOWLEDGEMENTS.........................................................................................xii
Chapter 1 Introduction ................................................................................................1
1.1 Motivation.......................................................................................................1
1.2 Contribution of the Thesis ..............................................................................3
1.3 Thesis Overview .............................................................................................4
Chapter 2 Energy Harvesting Background .................................................................6
2.1 Resources ........................................................................................................6
2.1.1 Electromagnetic (EM) radiation ...........................................................6
2.1.2 Thermal energy.....................................................................................8
2.1.3 Kinetic energy ......................................................................................8
2.1.4 Comparison...........................................................................................9
2.2 Mechanical energy harvesting methods..........................................................11
2.2.1 Electromagnetic generator....................................................................11
2.2.2 Electrostatic system..............................................................................13
2.2.3 Piezoelectric materials and devices ......................................................14
2.2.4 Electrostrictive polymers......................................................................16
2.2.5 Comparison...........................................................................................17
2.3 Mechanical energy harvesting applications....................................................18
2.3.1 Quasi-static excitation applications ......................................................19
2.3.2 Harmonic excitation .............................................................................21
2.3.3 Impulsive mechanical excitation ..........................................................22
2.4 Energy harvesting system...............................................................................23
2.4.1 The power flow of the system ..............................................................23
2.4.2 Control of the energy harvesting circuit ...............................................28
Chapter 3 Quasi-static Linear Energy Harvesting Theory..........................................31
3.1 Piezoelectric material and device ...................................................................31
3.2 Passive and Semi-passive Energy harvesting circuits ....................................37
3.2.1 Passive circuits .....................................................................................39
3.2.1.1 Diode rectifier ............................................................................39
3.2.1.2 Synchronous Charge Extraction.................................................45
3.2.2 Semi-passive energy harvesting circuit ................................................48
3.2.2.1 Serial SSHI circuit......................................................................49
vi
3.2.2.2 Parallel SSHI circuit...................................................................55
3.3 Active energy harvesting ................................................................................59
3.3.1 Fundamental limitation.........................................................................60
3.3.2 Voltage controlled mode ......................................................................62
3.3.3 Charge control ......................................................................................66
3.3.4 Inefficiency of power electronics .........................................................68
3.4 Theoretical Comparison of energy harvesting circuits ...................................71
Chapter 4 Active Energy Harvesting Experiment Using Piezoelectric ......................75
4.1 Mechanical excitation.....................................................................................75
4.2 Determination of Device Parameters..............................................................76
4.3 The power electronic circuit ...........................................................................80
4.4 Controller........................................................................................................83
4.5 Results.............................................................................................................84
4.6 Comparison and conclusion............................................................................88
Chapter 5 Quasi-static Electrostrictive Energy Harvesting Theory............................89
5.1 Electrostrictive materials and devices ............................................................90
5.2 Energy Harvesting Cycle and Boundary Conditions......................................91
5.2.1 Coupling Factor Determined from Linearized Model of
Electrostriction .......................................................................................94
5.2.2 Energy Harvesting Cycle #1: Constant Field and Open-Circuit
Electrical Boundary Conditions .............................................................95
5.2.3 Energy Harvesting Cycle #2: Constant-Field Boundary Conditions
During stressing and Unstressing of Material ........................................98
5.2.4 Energy Harvesting Cycle #3: Open-Circuit Boundary Conditions
During Stressing and Unstressing of Material .......................................100
5.2.5 Energy Harvesting Cycle #4: Passive Diode Circuit for Energy
Harvesting ..............................................................................................101
5.2.6 Sinusoidal excitation ............................................................................103
5.3 Comparison of Different Boundary Conditions .............................................105
Chapter 6 Quasi-static Electrostrictive Energy Harvesting Experiment.....................109
6.1 Experimental...................................................................................................109
6.1.1 MECHANICAL SYSTEM AND EXPERIMENTAL SETUP ............109
6.1.2 Experiment and results .........................................................................111
6.1.2.1 Determined the loss ....................................................................112
6.1.2.2 Energy harvesting.......................................................................114
Chapter 7 Conclusions and Future Work....................................................................121
7.1 Summary.........................................................................................................121

vii
7.2 Future Work....................................................................................................122
Bibliography ................................................................................................................123

viii
LIST OF FIGURES
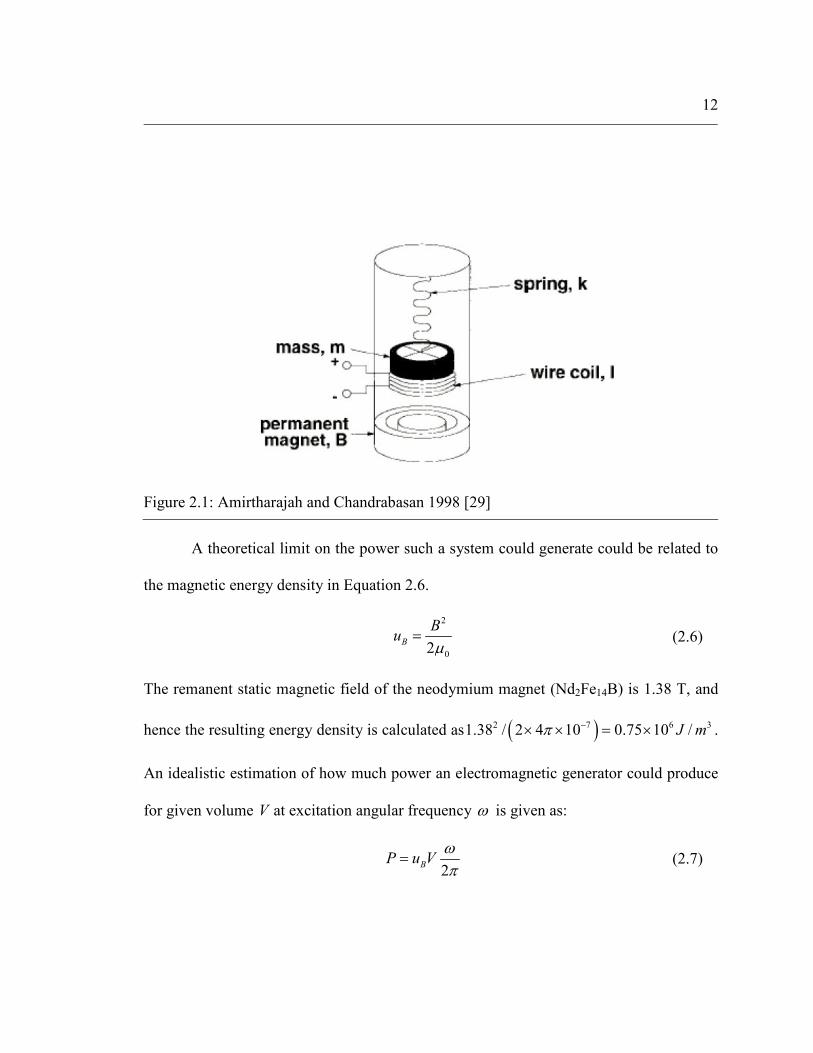
Figure 2.1: Amirtharajah and Chandrabasan 1998 [29]...............................................12
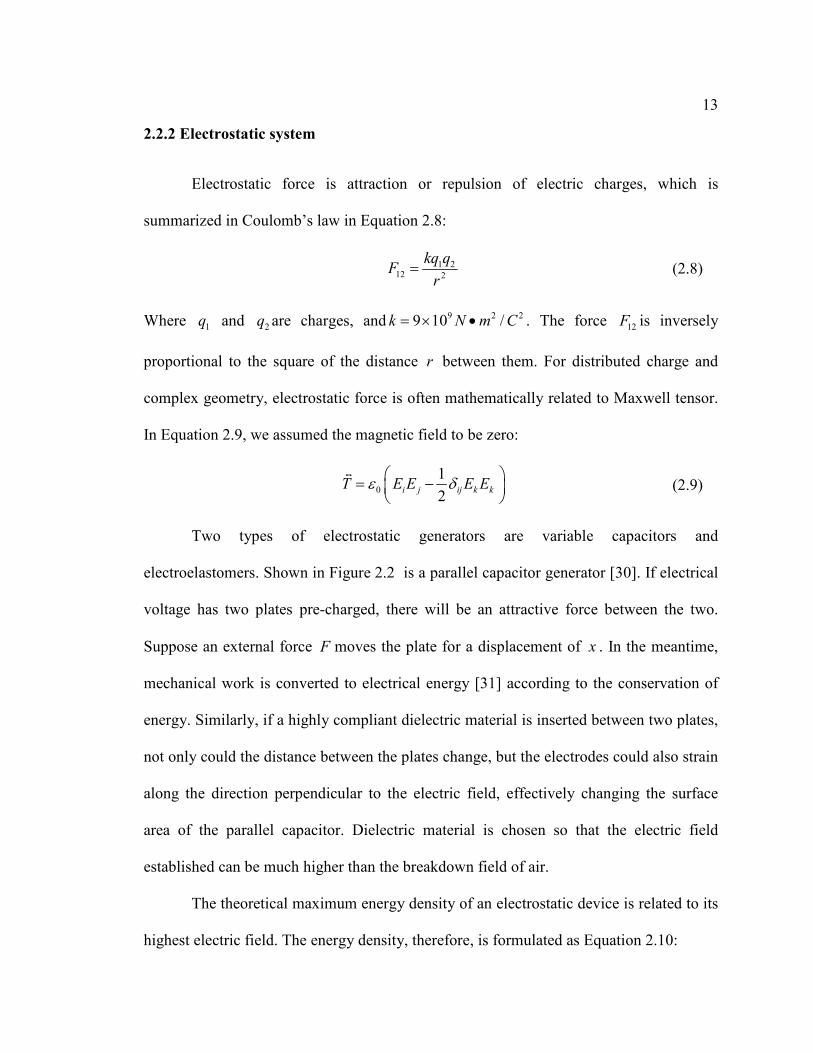
Figure 2.2: Capacitive energy harvesting device.........................................................14
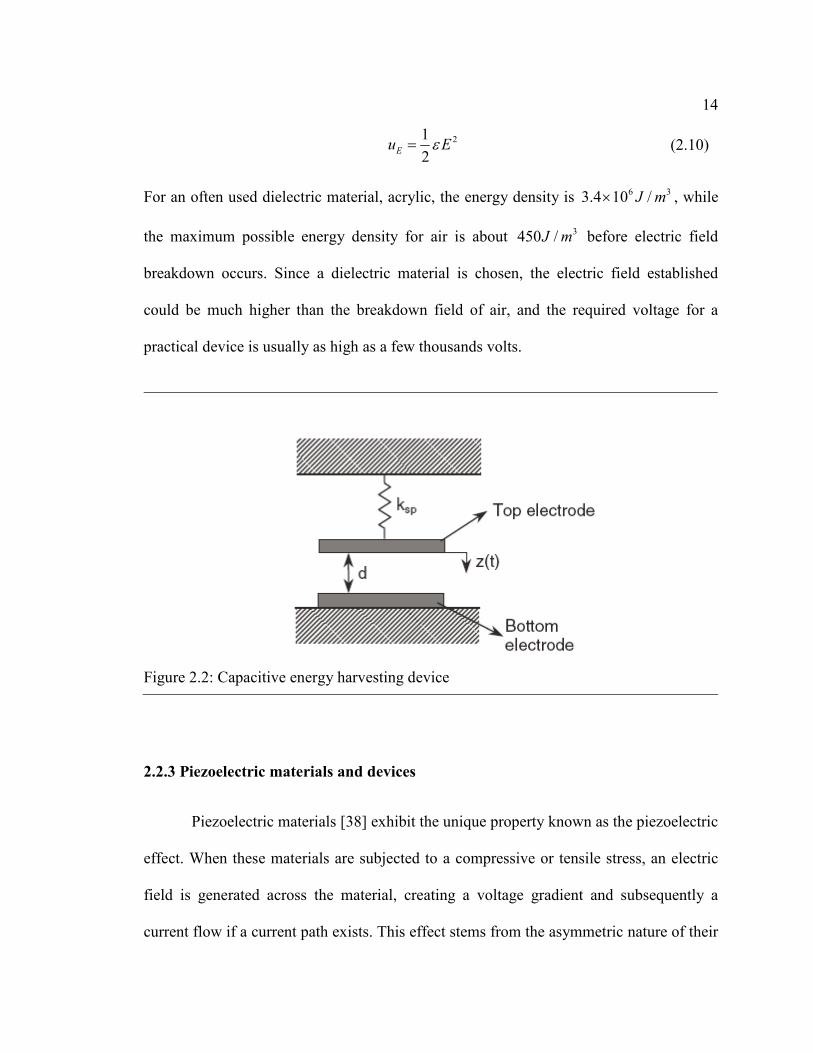
Figure 2.3: Lead Zirconate Titanate (PZT) unit cell...................................................15
Figure 2-4: Vibration energy harvesting using an attached piezoelectric device
(Left) and using proof-mass (Right) .....................................................................22
Figure 2.5: Energy harvesting system..........................................................................25
Figure 2.6: Control flow of energy harvesting system ................................................30
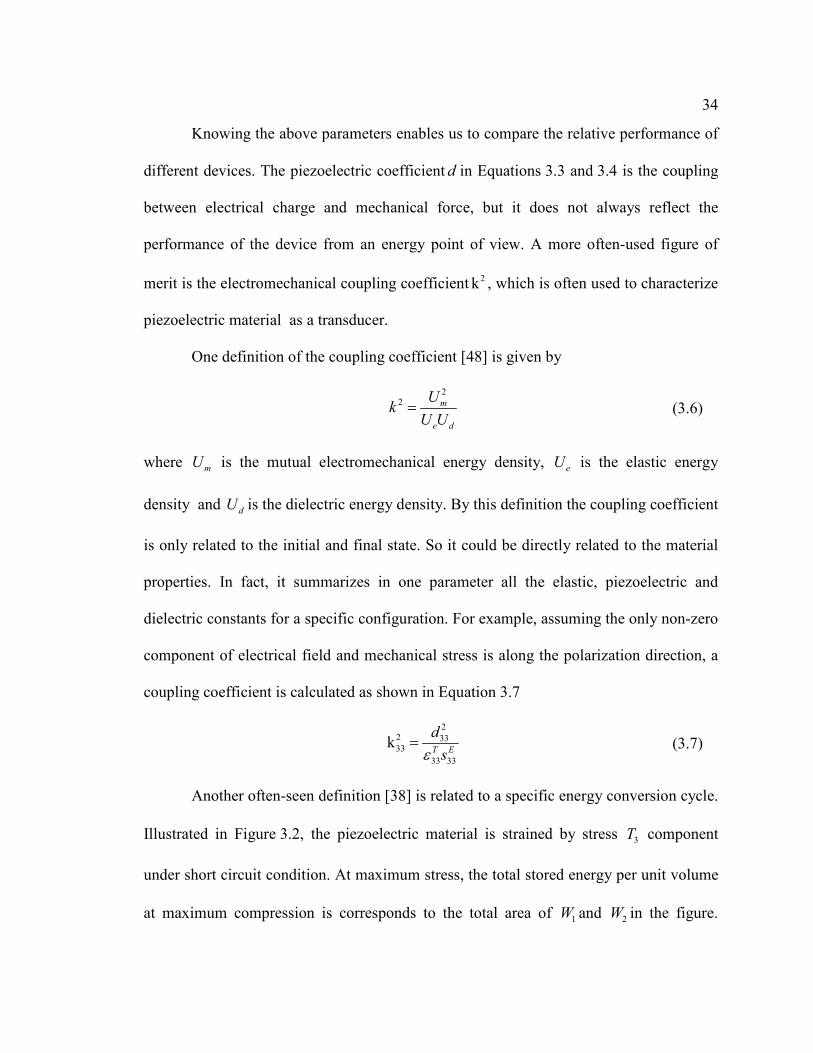
Figure 3.1: Energy harvesting cycle for coupling coefficient defination ....................35
Figure 3.2: Energy conversion loop.............................................................................38
Figure 3.3: Full bridge diode rectifier (a) and half bridge diode rectifier circuit (b)...39
Figure 3.4: Voltage wave of full bridge (left) and half bridge (right) rectifier............40
Figure 3.5: Experimental comparison of full bridge and half bridge rectifier. Half
bridge rectifier has more optimized power and doubled optimized voltage. .......41
Figure 3.6: Energy conversion cycle for full bridge rectifier circuit (a) electrical
domain, (b) mechanical domain ...........................................................................42
Figure 3.7: Synchronous charge extraction circuit .....................................................46
Figure 3.8: The energy conversion cycle of the synchronous charge extraction
circuit. (a) electrical domain, (b) mechanical domain. The dash line is the
full-bridge rectifier circuit under same force excitation, their enclosed area
are one forth that of synchronous charge extraction............................................47
Figure 3.9: (a) serial synchronized switch harvesting on inductor circuit (b)
implementation of serial synchronized switch harvesting on inductor circuit
using bidirectional switch made of two back to back PMOS transistors .............49
Figure 3.10: A simplifier synchronized switch harvesting on inductor circuit (a)
and its single PMOS transistor implementation ...................................................50
Figure 3.11: Conversion cycle of serial synchronized switch harvesting on
inductor circuit (a) electric domain, (b) mechanical domain................................51
ix
Figure 3.12: Equivalent circuit of serial synchronized switch harvesting on
inductor circuit during transition ..........................................................................52
Figure 3.13: Parallel SSHI circuit and its implementation ..........................................56
Figure 3.14: Energy conversion cycle of Parallel SSHI circuit (a) electrical
domain (b) mechanical domain ............................................................................57
Figure 3.15: Equivalent Parallel SSHI discharging circuit, where diode blocks
the reversion of the current ...................................................................................57
Figure 3.16: Mechanical limits bound the optimized energy conversion....................61
Figure 3.17: Voltage and displacement bounded energy harvesting cycle..................63
Figure 3.18: Voltage control of voltage controlled active energy harvesting..............64
Figure 3.19: Charge controlled energy conversion cycle bounded by both
electrical charge and the mechanical displacement ..............................................66
Figure 3.20: Charge controlled energy conversion cycle bounded only by both
electrical charge ....................................................................................................67
Figure 3.21: The voltage and charge controlled energy harvesting loops that have
a equal amount of harvested energy. The shaded area represents the input
electrical energy in one cycle ...............................................................................69
Figure 3.22: The performance of active energy harvesting as function of its
efficiency ..............................................................................................................71
Figure 4.1: The mechanical setup for quasi-static energy harvesting..........................76
Figure 4.2: The open-circuit voltage at different levels of mechanical force..............78
Figure 4.3: The piezoelectric coefficient changes under different mechanical load ...79
Figure 4.4: Half bridge converter used for active energy harvesting ..........................81
Figure 4.5: Active energy harvesting control using Simulink for Dspace system
implimentation......................................................................................................84
Figure 4.6: The voltage controlled mode operation. Channel 3 is the sinusoidal
force (at 600lbf/V), while AC coupling of oscilloscope is used. Channel 1 is
voltage across piezoelectric device,......................................................................85
x
Figure 4.7: Sinusoidal wave is measured force (at 600lbf/V), triangular like wave
is voltage across piezoelectric device. The charge controlled mode operation....86
Figure 4.8: Active energy harvesting compared to diode rectifier circuit.
Sinusoidal wave is measured force (at 600lbf/V), trapezoid wave is voltage
across piezoelectric device. ..................................................................................87
Figure 5.1: Type Caption Here ....................................................................................92
Figure 5.2: Energy harvesting cycle under constant field 1-2 and open circuit 2-3
electrical boundary conditions. .............................................................................96
Figure 5.4: Energy harvesting cycle under open-circuit conditions as stress is
applied and removed.............................................................................................100
Figure 5.5: Passive diode circuit for energy harvesting...............................................101
Figure 5.6: Energy harvesting cycle for passive diode circuit.....................................102
Figure 5.7: Theoretical prediction of Electrostrictive energy harvesting under
different harvesting circuits ..................................................................................106
Figure 6.1: Experiment setup for electrostrictive materials.........................................110
Figure 6.2: The power loss under different electrical excitation when the fixed
strain mechanical boundary condition is applied..................................................112
Figure 6.3: Cure fitting of loss measurement data to Equation 6.2 .............................114
Figure 6.4: The energy harvesting cycle of electrical field and flux density...............115
Figure 6.5: Strain stress plot of electrostrictive energy harvsting ...............................116
Figure 6.6: Theoretical and experimental results, in which the solid lines are
theoretical prediction ............................................................................................117
Figure 6.7: Mechanical force and voltage wave on the sample during active
energy harvesting experiment...............................................................................118
Figure 6.8: Frequency domain of current and voltage wave during active energy
harvesting..............................................................................................................119
xi
LIST OF TABLES
Table 2.1: Energy harvesting performance comparison ..............................................10
Table 3.1: Comparison of energy harvesting circuit....................................................73
Table 4.1: material properties and geometric information of the single crystal ........77
Table 5.1: Electrostrictive Material Parameters and Their Operation Limitations......106
Table 5.2: Maximum Energy Harvesting Density and Associated Coupling Factor
for Various Electrical Boundary Conditions, Terpolymer Material. ....................107
Table 5.3: Maximum Energy Harvesting Density and Associated Coupling Factor
for Various Electrical Boundary Conditions, Polyurethane Material...................107
Table 6.1: Electrostrictive energy harvesting experimental results comparsion .........120

xii
ACKNOWLEDGEMENTS
I would like to express my appreciation for those who have guided and supported
me through my educational experience. In particular, I would like to thank my adviser
Heath Hofmann for imparting his ingenious and optimistic research approach upon me. I
also cherished this exciting research opportunity on energy harvesting that Professor
Qiming Zhang was instrumental in creating. I am extremely thankful for Professor
George Lesieutre for his support and the direction that he has provided to the project
from the beginning. Thanks also to Professor Jeffrey Mayer for the inspirational
discussion that kept me focused.
I greatly appreciate the help of Dr Jeremy Frank, who has been helped me to
understand the mechanical side of energy harvesting systems, as well as help me in other
innumerous ways.
My interaction with the many lab mates and colleagues (Jae Do Park, Danhong
Zhong, Richard Geiger, Jacob Loverich) with whom I have worked has made my time in
graduate school a very enjoyable one.
I am ever grateful to my parents for their constant love and confidence in me.
My most heart felt gratitude goes to my wife Qian. She has been always loving,
supportive, and understanding. For her support and partnership I will be always in debt.
Finally, thanks go to my daughter, Emily, who lift my spirits by being such a
smart and understanding baby, and serves as a continual reminder to me that my research
work is not all that important.
Chapter 1
Introduction
This dissertation is on the use of piezoelectric and electrostrictive materials to
generate electrical energy from mechanical excitations. “Energy harvesting” is a process
that converts otherwise wasted energy into usable energy, often in the form of electric
power. This thesis focus primarily on the study of active energy harvesting, an approach
that utilizes a bidirectional switching inverter to actively control the voltage or charge of
a piezoelectric or electrostrictive device in certain relation to mechanical input to
maximize power conversion. This relatively novel concept for piezoelectric and
electrostrictive energy harvesting has not been systematically studied before. Through
theoretical analysis and experimental investigation, the active energy harvesting is
presented as an effective way to increase output power without modification of the
mechanical system relative to other energy harvesting circuits.
1.1 Motivation
Recent years have seen a proliferation of portable electronics and wireless sensor
networks [1][2]. Such electronics traditionally are powered by electrochemical batteries.
Although the energy density of these batteries has been increasing gradually, it is unlikely
they will experience dramatic improvement in the near future [3]. Batteries need to be
replaced or replenished regularly, which significantly undermines the convenience and

2
economical benefits wireless sensor networks and portable devices are supposed to bring.
Billions of batteries used every year also pose a huge negative impact on the environment
because many of them are not appropriately recycled.
Fortunately, the exponential reduction of power requirements of electronic
components in recent years[4], particularly the integrated circuits and MEMS sensors,
have enabled what was once negligible sub-milliwatt power to become useful for many
applications. For example, a wireless sensor node developed by GE uses only 200
microwatts of average power, and a similar crossbow sensor node consumes about 400
microwatts on average, based on our measurements. Thus, energy harvesting that
generates small amounts of power from ambient environment sources creates
opportunities for more and more applications. It has been established as an economically
viable, environmentally amiable, and technically feasible alternative to batteries as a
power source for many applications [5][6]
Researchers and engineers have made enormous progress in energy harvesting
technologies in the last decade, including new active materials [7], better device design
[8][9][10], and new circuits and controls [11]; however, current technologies still do not
meet the requirements of many demanding applications, such as harvesting power from
low mechanical vibrations. First, the current technologies do not generate enough power,
especially under size and weight restrictions. Second, for a vibration power harvester, the
power harvesting bandwidth is usually narrowed down to a few Hz around its resonance
frequency, and a slight frequency shift results in a steep power output reduction [12].
In both academia and industry, prevailing energy harvesting circuits under
investigation are passive and semi-passive [13][14][15]. However, research on active
3
vibration control has not only been long established as one of the major research topics,
but also has already been adopted for many applications [16][17]. Among these studies,
the power regeneration effect has been observed in some active structural damping
systems, and researchers have gained a fairly deep understanding of this process [18]. An
active energy harvesting which might have been a counterpart of active vibration control,
on the other hand, has not drawn deserved attention from either academia or industry. As
this dissertation means to be an advocate of active energy harvesting not just for
academic reasons, I believe it will be a widely adopted technology in the near future,
enabled by technologies such as efficient power electronics, ultra-low power digital
signal processors (DSP), and application specific integrated circuits (ASIC).
1.2 Contribution of the Thesis
This thesis research study is the first systematic study of active energy harvesting
approaches from mechanical excitations using piezoelectric and electrostrictive materials.
First, a model-based analysis of existing energy harvesting circuits and active energy
harvesting for linear (Piezoelectricity) and non-linear (Electrostrictive) harvester under
quasi-static assumptions is presented. Unlike the conventional equivalent circuit
modeling technique, our model emphasizes the importance of electro-mechanical
boundary conditions in energy conversion cycle, revealing a fundamental role that the
electric circuit plays in energy conversion.
Second, experiments are performed for quasi-static piezoelectric and
electrostriction energy harvesting, showing significant improvement of power harvesting.

4
These results match well with theoretical predictions. Control algorithms and power
electronic designs used in these experiments could be further developed into practical
standalone energy harvesting circuits.
Finally, some practical limitations of active energy harvesting are discussed for
all systems, including maximum voltage or charge on the device or electrical circuit. The
optimum operating condition is presented considering the efficiency of the power
electronic circuit. These results also serve as a general design guideline for active energy
harvesting design.
1.3 Thesis Overview
Chapter 2 is a background review of energy harvesting. First, we discuss energy
harvesting resources in general. Then, as our focus, mechanical energy harvesting is
covered for both quasi-static and dynamic applications. Secondly, different mechanical-
electric conversion mechanisms are presented based on their advantages and
disadvantages. Finally, we look at the energy harvesting system from both energy flow
and control system points of view, addressing how to optimize the interaction between
mechanical input and a system to maximize the harvested power.
Piezoelectric ceramic, polymer and single crystal are usually considered to have a
linear electrical-mechanical coupling. In Chapter 3, we first introduce the properties that
are closely related to energy harvesting. Then a quasi-static energy conversion cycle is
shown for three types of energy harvesting; namely passive, semi-passive, and active
5
approaches. In this chapter, we also investigate the effect of the efficiency of power
electronics on the active energy harvesting.
Chapter 4 discusses an experimental demonstration of quasi-static active energy
harvesting using piezoelectric single crystal (PMN-PT). The experiment results are
compared to the theoretical model that is developed in Chapter 3.
Non-linear systems, including electrostrictive material, electroelastomer and
electrostatic generators, are highly interesting for their superior performance over
conventional ceramic piezoelectric materials in certain applications. A common
characteristic of these non-linear systems is that they all need sustained electric bias
fields to be functional. Chapter 5 models the energy conversion of electrostrictive
polymers.
In Chapter 6, a very high energy conversion density has been achieved
experimentally in electrostrictive polymers using the active approach. The experiment is
explained by the modeling of the previous chapter. The theoretical calculation matches
well with the experimental results.
Chapter 7 concludes the thesis with general conclusions, and proposes future
work that could be done with active energy harvesting.

Chapter 2
Energy Harvesting Background
Energy harvesting is not a new idea. It dates back to 1770, when Abraham-Louis
Perrelet, a French scientist, invented a completely autonomous, self-winding pedometer
watch that gathers power from an individual’s arm movements. However, the
development of energy harvesting had been somewhat slow until recent research began
seeking alternative power sources for wireless sensor networks and portable electronics.
The dramatic reduction in power consumption of these circuits makes various forms of
energy meaningful to be harvested.
2.1 Resources
Energy in ambient surroundings exists in three forms. These include
electromagnetic (EM), thermal, chemical and mechanical energies.
2.1.1 Electromagnetic (EM) radiation
Electromagnetic (EM) radiation of light and radio waves are of particular interest
for harvesting. The energy of electromagnetic waves propagates at the speed of light, and
its power density is related to the Poynting vector given by:
*1Re ,
2P E H = × (2.1)
7
where E and H are electric and magnetic fields components of the wave.
Photovoltaic systems [19], often known as solar cells, are an older technology that
could generate electrical power directly from sunlight, making it useful for a wide range
of applications. A state-of-the-art solar cell could convert 20 percent of solar power
directly into electricity. Further improvement of the efficiency of solar cells is, however,
unlikely to be dramatic in the near future [20].
Invisible to the naked eye, radio frequency (RF) waves are ubiquitous. In cities
and very populated areas there are a large number of potential RF sources: broadcast
radio and TV, mobile telephones, wireless networks, etc. The challenge of harvesting
energy from these sources lies in collecting energy from these disparate sources with
moderatly sized antennas. An often-used technology is based on a rectifying antenna
[21], constructed with a Schottky diode located between the antenna dipoles. Usually the
harvestable power is small unless there is an operating cell phone in the vicinity.
Researchers have successfully scavenged power from radio waves that radiated from
nearby cell phone towers [22].
A recent application of radio-frequency energy harvesting is the so-called passive
radio frequency tag. It uses printed circuit antennas to collect power from a nearby
transmission antenna. An integrated circuit with built-in flash memory and controls logic
can send back the important information about the product, which the Radio Frequency
IDentification (RFID) [23] is attached to. This technology is also known as ‘smarter bar
code’.

8
2.1.2 Thermal energy
If close to thermal sources, thermoelectric devices can generate electrical power
from temperature differences. A solid-state thermoelectric generator is usually comprised
of a p-type and n-type semiconductor connected electrically in series and thermally in
parallel. It produces an electrical current proportional to the temperature difference
between the hot and cold junctions. The ideal power conversion efficiency can be driven
through the Carnot cycle. If the heat flow from high HT to low LT temperatures source
isQ , then the maximum useable power is calculated as
In practice, the conversion efficiency of current technologies is much poorer than this
theoretical limit. On a larger scale, geothermal and oceanic temperature gradients are
abundant and mostly renewable resources that can generate megawatts of power.
Researchers of energy harvesting, however, are more interested in the other end of these
extremes: generating power from relative low temperature differences, such as a human’s
body temperature and the ambient environment. It has been demonstrated that human
body temperature is able to generate enough power for a wristwatch at room temperature
[24].
2.1.3 Kinetic energy
Motions of all kinds contain kinetic energy. The power is generally related to the
force F and its displacement x . Its average power is given by:
H L
H
T TP Q
T
−= (2.2)

9
And the instantaneous power is given as:
Mechanical power that is applicable for energy harvesting includes sound,
structural vibration, wind, water waves and fluid flow. Human activities, such as walking,
are also highly interesting because the energy source becomes portable in nature.
Mechanical energy harvesting is the primary topic of this thesis research.
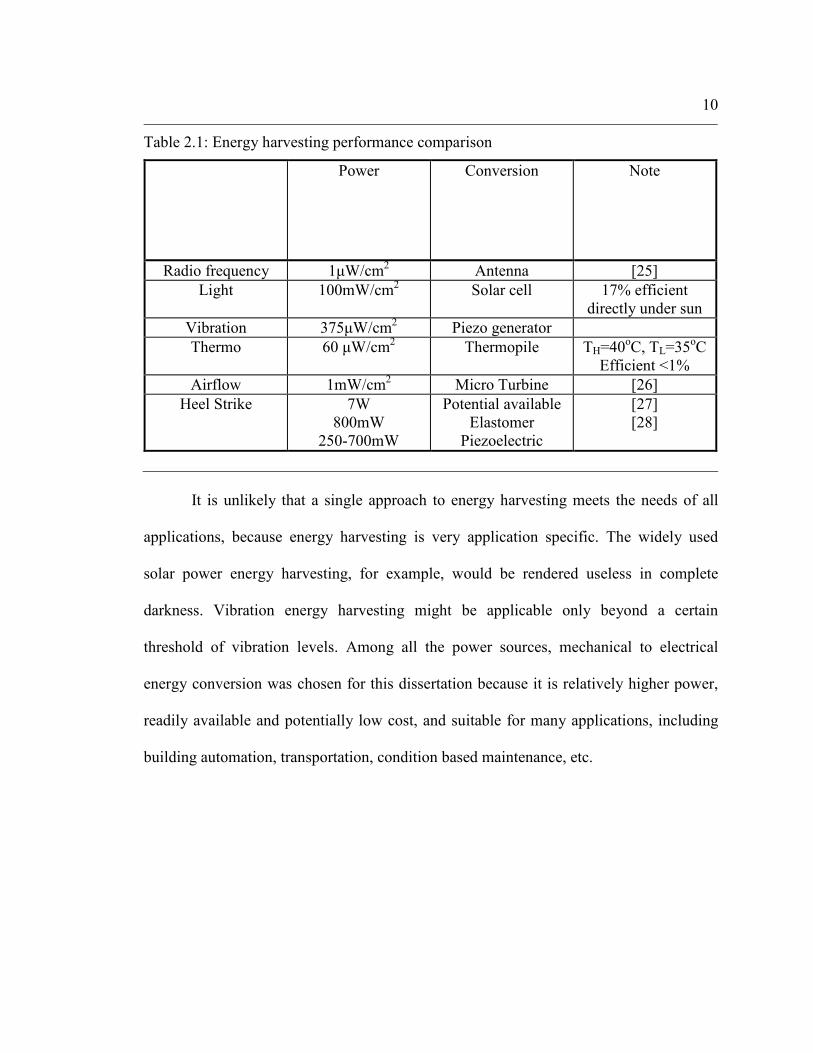
2.1.4 Comparison
Some often used energy harvesting resources is summarized in Table 2.1 as a
general comparison.
0
1T
P FxdtT
= ∫ (2.3)
P Fx= (2.4)
10
It is unlikely that a single approach to energy harvesting meets the needs of all
applications, because energy harvesting is very application specific. The widely used
solar power energy harvesting, for example, would be rendered useless in complete
darkness. Vibration energy harvesting might be applicable only beyond a certain
threshold of vibration levels. Among all the power sources, mechanical to electrical
energy conversion was chosen for this dissertation because it is relatively higher power,
readily available and potentially low cost, and suitable for many applications, including
building automation, transportation, condition based maintenance, etc.
Table 2.1: Energy harvesting performance comparison
Power Conversion Note
Radio frequency 1µW/cm2 Antenna [25]
Light 100mW/cm2 Solar cell 17% efficient
directly under sun
Vibration 375µW/cm2 Piezo generator
Thermo 60 µW/cm2 Thermopile TH=40
oC, TL=35
oC
Efficient <1%
Airflow 1mW/cm2
Micro Turbine [26]
Heel Strike 7W
800mW
250-700mW
Potential available
Elastomer
Piezoelectric
[27]
[28]

11
2.2 Mechanical energy harvesting methods
The end product of energy harvesting is usually electrical power. Methods that
convert kinetic power to electrical power include electromagnetic induction, electrostatic
force, piezoelectric and electrostrictive effects.
2.2.1 Electromagnetic generator
When a closed-loop circuit is immersed in a changing magnetic field, a current
will be induced. If the circuit, on the other hand, is open-circuited, a voltage will be
generated across the terminals of the circuit. This is mathematically described by the
famous Faraday’s law in Equation 2.5:
Based on Faraday’s law, a typical inertial vibration-based generator consists of an
oscillating spring and mass system, as shown in the electromagnetic generator for
vibration energy harvesting in Figure 2.1. The vibration of the base induces the wire coil
to move relative to the permanent magnet. As the magnetic flux moves through the coils
an AC current/voltage is generated.
dE dl B dA
dt• = − •∫ ∫ (2.5)
12
A theoretical limit on the power such a system could generate could be related to
the magnetic energy density in Equation 2.6.
The remanent static magnetic field of the neodymium magnet (Nd2Fe14B) is 1.38 T, and
hence the resulting energy density is calculated as ( )2 7 6 31.38 / 2 4 10 0.75 10 /J mπ −× × = × .
An idealistic estimation of how much power an electromagnetic generator could produce
for given volume V at excitation angular frequency ω is given as:
Figure 2.1: Amirtharajah and Chandrabasan 1998 [29]
2
02B
Bu
µ= (2.6)
2BP u V
ωπ
= (2.7)
13
2.2.2 Electrostatic system
Electrostatic force is attraction or repulsion of electric charges, which is
summarized in Coulomb’s law in Equation 2.8:
Where 1q and 2q are charges, and 9 2 29 10 /k N m C= × • . The force 12F is inversely
proportional to the square of the distance r between them. For distributed charge and
complex geometry, electrostatic force is often mathematically related to Maxwell tensor.
In Equation 2.9, we assumed the magnetic field to be zero:
Two types of electrostatic generators are variable capacitors and
electroelastomers. Shown in Figure 2.2 is a parallel capacitor generator [30]. If electrical
voltage has two plates pre-charged, there will be an attractive force between the two.
Suppose an external force F moves the plate for a displacement of x . In the meantime,
mechanical work is converted to electrical energy [31] according to the conservation of
energy. Similarly, if a highly compliant dielectric material is inserted between two plates,
not only could the distance between the plates change, but the electrodes could also strain
along the direction perpendicular to the electric field, effectively changing the surface
area of the parallel capacitor. Dielectric material is chosen so that the electric field
established can be much higher than the breakdown field of air.
The theoretical maximum energy density of an electrostatic device is related to its
highest electric field. The energy density, therefore, is formulated as Equation 2.10:
1 212 2
kq qF
r= (2.8)
0
1
2i j ij k kT E E E Eε δ = −
(2.9)
14
For an often used dielectric material, acrylic, the energy density is 6 33.4 10 /J m× , while
the maximum possible energy density for air is about 3450 /J m before electric field
breakdown occurs. Since a dielectric material is chosen, the electric field established
could be much higher than the breakdown field of air, and the required voltage for a
practical device is usually as high as a few thousands volts.
2.2.3 Piezoelectric materials and devices
Piezoelectric materials [38] exhibit the unique property known as the piezoelectric
effect. When these materials are subjected to a compressive or tensile stress, an electric
field is generated across the material, creating a voltage gradient and subsequently a
current flow if a current path exists. This effect stems from the asymmetric nature of their
21
2Eu Eε= (2.10)
Figure 2.2: Capacitive energy harvesting device
15
unit cells when a stress is applied. As seen in Figure 2.3, the unpolarized Lead Zirconate
Titanate (PZT) unit cell contains a small positively charged particle in the center, shown
as black dot. When the material is poled under an electrical field, the positive charge will
stabilize at an offset center position. Only poled PZT has piezoelectricity. Under strain,
the positive charge will move away from its equilibrium position, creating an internal
field across the crystal. If the surface of the piezoelectric material has electrodes, the free
charge in the metal will tend to compensate the internal electrical field. Further more, if
an electrical return path is established through an external circuit, then a current is usually
generated.
Utilizing piezoelectric material, mechanical energy can be converted to electric
energy. Since the input mechanical energy could be stored as elastic energy, the elastic
energy density is expressed as Equation 2.11:
Figure 2.3: Lead Zirconate Titanate (PZT) unit cell
21
2mu sT= (2.11)

16
However not all of the elastic energy can be converted to electric energy; it generally
depends on the coupling coefficient of the material, and electromechanical boundary
conditions. Further discussion will be given in chapter 3.
2.2.4 Electrostrictive polymers
Electrostrictive polymer differ from the piezoelectric material in that it is central
symmetric without a bias field. A recently discovered copolymer P(VDF-TrFE) [32] is
not only a superior actuator material, it is also well-suited for energy harvesting
applications. Its work mechanism is complex, and its details have not been fully
understood. A simplified explanation is that it is a strain-induced phase transition that
results from electric dipole movement on the molecular level; the dipole motion, in turn,
generates an internal electric field. Therefore, it differs fundamentally from electrostatic
force in an electroelastomer. Furthermore their intrinsic properties and electrostatic
effects both contribute positively to energy harvesting effects. An electrostrictive
polymer is a potentially better candidate than an electroelastomer for energy harvesting
applications.
17
2.2.5 Comparison
Each type of energy conversion method has its own characteristics.
Electromagnetic systems often require certain mechanisms, such as gearing or resonance
with high quality factor, to enhance the relative speed between rotor and stator because
the efficiency is directly related to the rate of change of the magnetic field. It also usually
produces low voltage output. On the other hand, piezoelectric systems often borrow
cantilevers and other mechanisms to amplify the force because the voltage is proportional
to the strain and the piezoelectric material is relatively stiff. The electrical output of
piezoelectric devices often tends to consist of higher voltage and lower current than that
of electromagnetic system.
The sizing effect also determines which system is suitable for specific
applications. Electromagnetic motors of ten kilowatts could probably easily beat any
other electrical-mechanical energy conversion system of that power level in efficiency
and power density. It is difficult to use electromagnetic systems in MEMS devices
because the strength of the magnetic field is closely related to the size of the electro-
magnet. Electrostatic and piezoelectric systems, however, work better in smaller size.
Loosely, an electric field is inversely proportional to the device’s dimension given the
same voltage, while a piezoelectric device scales down very well until the material’s
piezoelectric domain size is reached. Though it is hard to evaluate all the energy
harvesting approaches with a single figure of merit, the energy density of those
approaches are compared to each other when their applications are constrained by the
size.

18
Piezoelectric and electrostrictive polymer energy harvesting have stood out as
preferred choices due to some of their unique properties, such as higher energy density,
simple structure, and low cost. Piezoelectric materials are also readily available
commercially. So we chose piezoelectric energy harvesting as a main focus of this thesis.
In the meantime, newly-developed electrostrictive materials have attracted a lot of
attention in field of mechanical actuation and ultrasonic transducers. This thesis also
studies their potential superiority in energy harvesting applications.
Without energy harvesting circuits, no matter how good a power conversion
device is, it still cannot provide the appropriate form of power to be used for electronic
devices and hardly achieves the best performance as a system. Energy harvesting
devices, circuits, and sometimes energy storage work together as a system to provide the
maximum possible power to meet certain requirements.
2.3 Mechanical energy harvesting applications
The typical mechanical sources used for energy harvesting include natural
phenomena (wind, water flow and ocean wave), a human’s daily activities (walking,
keyboard strokes) and structural vibrations from machinery. Those mechanical sources
can be further categorized into three types: quasi-static, harmonic and impulsive. Quasi-
static mechanical excitation happens when the dominant frequency of excitation is much
lower than the fundamental resonance frequency of the energy conversion device. Under
such conditions, the mechanical dynamics of devices can usually be neglected in favor of
the quasi-static assumption. On the other hand, if the mechanical excitation is in
19
sinusoidal, or harmonic, form and its dominant frequency falls into the vicinity of the
resonant frequency of energy conversion devices, the mechanical dynamics of the device
usually play an important role and should be considered. One major application of
harmonic excitation is vibration energy harvesting.
Another type of mechanical excitation is impulsive. It happens when a repetitive
force is exerted upon the device for a shorter period of time than its relaxation time. A
typical application is rolling automobile tires. The sidewall of tire of an automobile
traveling at high-way speeds often experiences an acceleration level of a few hundred g’s
(g being the acceleration due to gravity), while the duration of the acceleration is less
than 10 percent of the period of the rotation.
2.3.1 Quasi-static excitation applications
Human motion is usually much slower than the resonance frequency of energy
harvesting devices. For example, the frequency of walking or running is usually between
1 to 10 Hertz, while piezoelectric bimorphs have resonance frequencies of a few
hundreds of Hertz. Numerous attempts have also been made to utilize the energy
associated with human activities. Systematic work [33] done by MIT in early 1990’s
experimentally compared the power generation abilities of different devices inserted into
the soles of jogging shoes. The three types of devices that were experimentally studied
are piezoelectric bimorph, PVDF insertion, and electromagnetic generator (motor). They
concluded that an electromagnetic generator was the best in terms of power generation
(20mW), but it was too cumbersome to be practical. PVDF insertion was the easiest to
20
implant in the shoes because it was flexible and light weight. But its low piezoelectric
coefficient resulted in a much lower power output (10uw) compared to the piezoelectric
bimorph (2 mW). Using different types of devices, SRI based their ‘power boots’ [34] on
an electrostatic generator, employing silicon rubber or soft acrylic. Their power boots
yield 1.6W of total power for two steps a second. Unfortunately, the material needs a
high bias voltage (5k volts) and is also limited in lifetime, which still needs to be
improved before it can become a practical product. Besides walking, energy extracted
from pushbutton or key strokes is enough for wireless remote controls. Reported by
Paradiso, Jansen and Harmon [35], the feasibility of such applications has been
demonstrated when short distance ON and OFF signals are transmitted wirelessly.
Low frequency or quasi-static energy harvesting is not unusual in natural
phenomena. For example, Taylor and Burn studied an ‘energy harvesting eel’ [36] for
harnessing energy from the flow of river water. They used a long strip of PVDF
piezoelectric polymer that undulates under the pressure differences created by the force
of vortices. Depending on the speed of current and the size of the eel, achieved power
output was from tens of milliwatts to a few watts.
Quasi-static types of energy harvesting are also common in industry. Theurer
[37] reported that energy can be extracted from an injection-mold pressure differential to
power wireless pressure sensors.
Quasi-static energy harvesting usually has a low frequency and a high force input,
which generally needs a mechanical impedance-matching structure for its optimal
performance. These structures include cantilever, bimorph/unimorph, etc. Even hydraulic
systems have been proposed for some applications. The quasi-static type excitation is the
21
simplest form of energy harvesting. For some applications it could be assumed that the
input peak force or pressure is independent of the electrical boundary conditions of an
energy conversion device, while it is often assumed that the mechanical strain or
displacement is unaffected by the electrical boundary conditions to simplify the analysis.
2.3.2 Harmonic excitation
The majority of harmonic energy harvesting applications is in vibration energy
harvesting. There are two methods that piezoelectric devices are coupled with vibrating
structures. One is attaching, or bonding, the piezoelectric patches directly to the vibrating
structure where strain concentrates. The vibration of the structure results in a deformation
or strain of the piezoelectric devices. Because the structure is usually much larger and
heavier than those of the piezoelectric device, the change of frequency and amplitude of
the structural vibration due to the energy harvesting is often negligible, and vibration
frequency is often much lower than the piezoelectric devices’ resonant frequency. Thus
this method is still a quasi-static energy harvesting. The helicopter blade energy
harvesting is one such example.
The second method utilizes a proof mass to trap the kinetic energy or acceleration
of the vibration body. This method is particularly suitable for harvesting energy from a
rigid body vibration. Proof-mass and piezoelectric devices constitute a spring-mass-
damper system, the resonance frequency of which is often designed to be close to the
dominant frequency of vibration to be harvested. The dynamics of such a system are the
determining factor of the energy harvesting performance. Illustrated in Figure 2-4 is the
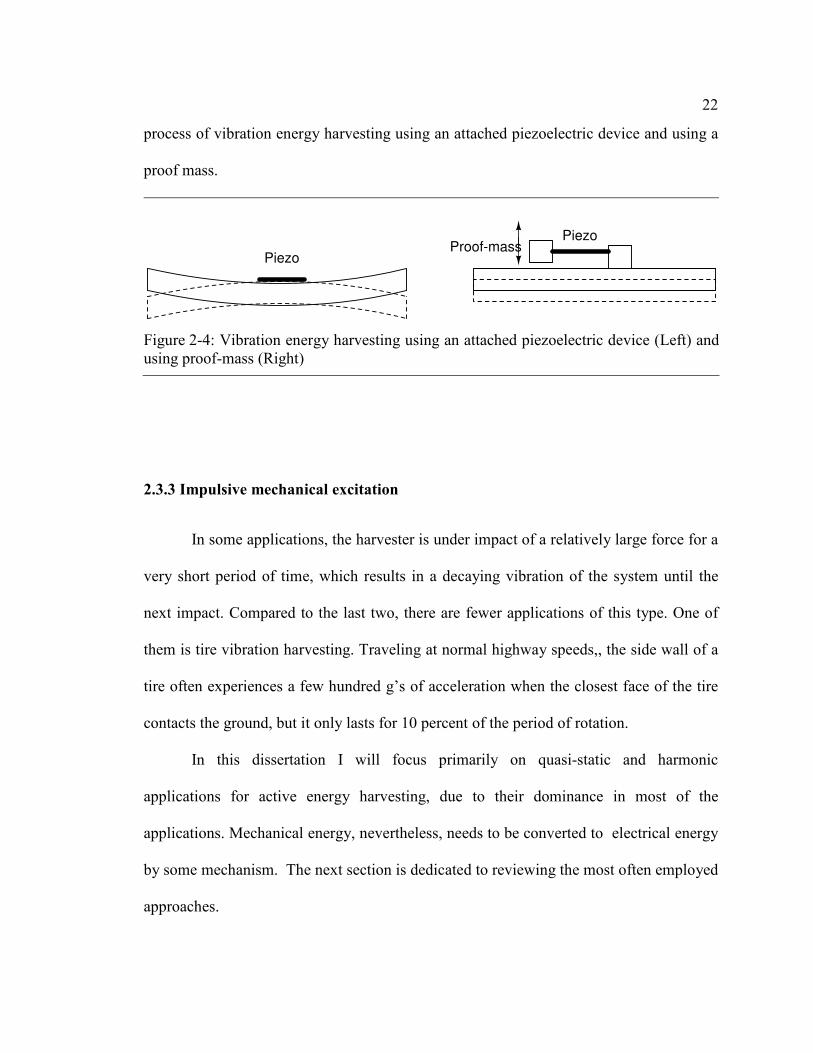
22
process of vibration energy harvesting using an attached piezoelectric device and using a
proof mass.
2.3.3 Impulsive mechanical excitation
In some applications, the harvester is under impact of a relatively large force for a
very short period of time, which results in a decaying vibration of the system until the
next impact. Compared to the last two, there are fewer applications of this type. One of
them is tire vibration harvesting. Traveling at normal highway speeds,, the side wall of a
tire often experiences a few hundred g’s of acceleration when the closest face of the tire
contacts the ground, but it only lasts for 10 percent of the period of rotation.
In this dissertation I will focus primarily on quasi-static and harmonic
applications for active energy harvesting, due to their dominance in most of the
applications. Mechanical energy, nevertheless, needs to be converted to electrical energy
by some mechanism. The next section is dedicated to reviewing the most often employed
approaches.
Piezo
PiezoProof-mass
Figure 2-4: Vibration energy harvesting using an attached piezoelectric device (Left) and
using proof-mass (Right)
23
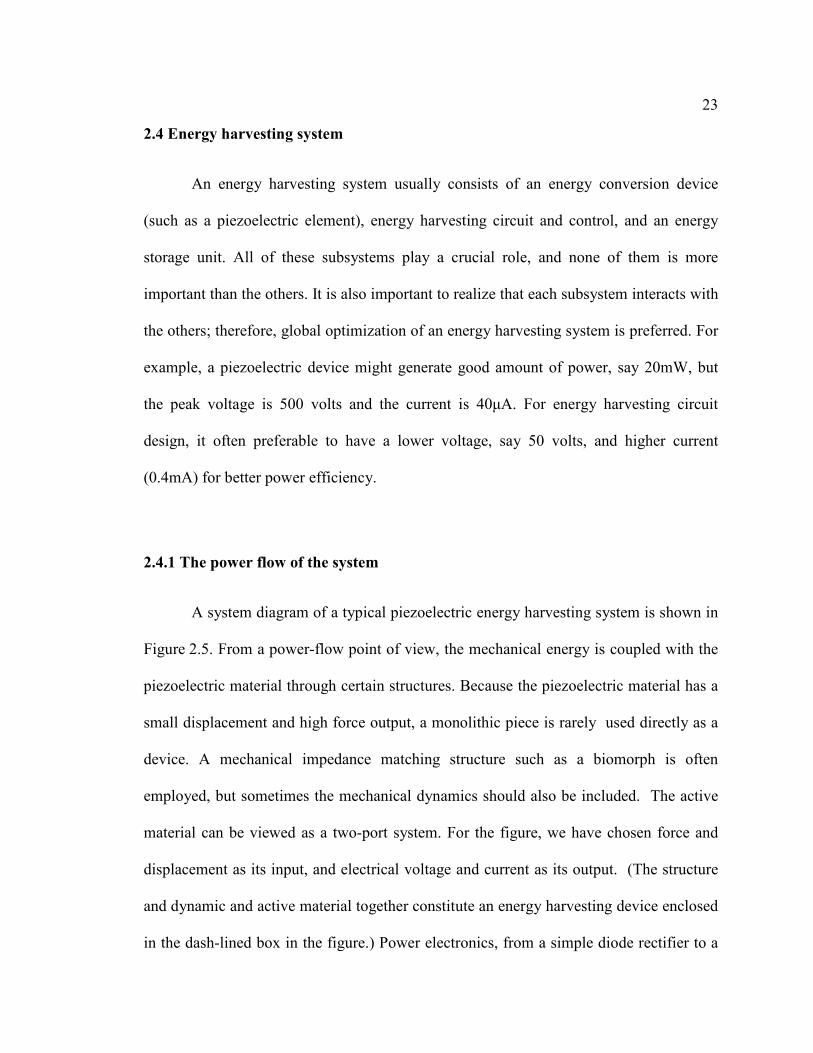
2.4 Energy harvesting system
An energy harvesting system usually consists of an energy conversion device
(such as a piezoelectric element), energy harvesting circuit and control, and an energy
storage unit. All of these subsystems play a crucial role, and none of them is more
important than the others. It is also important to realize that each subsystem interacts with
the others; therefore, global optimization of an energy harvesting system is preferred. For
example, a piezoelectric device might generate good amount of power, say 20mW, but
the peak voltage is 500 volts and the current is 40µA. For energy harvesting circuit
design, it often preferable to have a lower voltage, say 50 volts, and higher current
(0.4mA) for better power efficiency.
2.4.1 The power flow of the system
A system diagram of a typical piezoelectric energy harvesting system is shown in
Figure 2.5. From a power-flow point of view, the mechanical energy is coupled with the
piezoelectric material through certain structures. Because the piezoelectric material has a
small displacement and high force output, a monolithic piece is rarely used directly as a
device. A mechanical impedance matching structure such as a biomorph is often
employed, but sometimes the mechanical dynamics should also be included. The active
material can be viewed as a two-port system. For the figure, we have chosen force and
displacement as its input, and electrical voltage and current as its output. (The structure
and dynamic and active material together constitute an energy harvesting device enclosed
in the dash-lined box in the figure.) Power electronics, from a simple diode rectifier to a
24
more complex switch-mode power converter, and transfers the power from the harvester
output into a usable DC voltage to an electrical load and sometimes also distributes the
power between the storage unit and load. The energy harvesting circuit also enforces
electrical boundary conditions to the device described by a certain control algorithm.
Even for a simple diode rectifier, the control law is implemented implicitly through the
voltage-current characteristic of diodes. For active energy harvesting, the control could
be built in analog or digital circuits.
A storage unit, rechargeable battery or super capacitor, reserves energy in case the
mechanical excitation is temporally absent or diminished. For a wireless sensor network,
it is always necessary to be able to provide short bursts of power during radio
transmission, because for most of the time the sensor nodes are in a ‘sleep mode’ and
their power consumption could be as low as a few hundred microwatts, while during
radio transmission the power requirement could reach a few hundred milliwatts for a
duration of a few milliseconds.

25
We emphasize the instantaneous power flow in the system could be bi-directional
between subsystems during energy conversion cycles. The net power or the average
power flows from mechanical excitation to the storage unit and the electric load. Energy
harvesting circuits could be categorized as three types based on their energy flow patterns
during mechanical stimuli cycles: passive, semi-passive and active. A passive circuit,
such as a diode rectifier, always transfers power (instantaneous power) from the
piezoelectric devices to the energy storage cell (rechargeable batteries or super-
capacitor). The semi-passive circuit uses a passive component, such as an inductor, to
temporarily store and return part of the energy back to the piezoelectric devices during
each cycle. For the semi-passive energy harvesting circuit, even though switches
(MOSFET) are generally used, the current flow, therefore the power flow through the
switch is always unidirectional. The active energy harvesting circuit, on the other hand,
Figure 2.5: Energy harvesting system
Structure
&Dynamic
Active
material
Controller Electric
load
Mechanical power
Force,
displacement
Stress,
Strain
Voltage,
Current
Average power
Instantaneous power
Control signal
Power
electronics
Storage
unit
26
utilizes bi-directional inverters and circulates part of energy back and forth between the
piezoelectric device and the energy storage unit (rechargeable battery or super-capacitor)
for each energy conversion cycle, resulting in a net flow of energy into the energy storage
cell with a longer time average. Because bidirectional switch-mode power electronics are
used, in most cases at least two switches have to be used in the circuit.
Typical passive harvesting circuits are diode rectifiers in half-bridge or full-bridge
configurations with filter/reservoir capacitors. For this circuit, the power transfer is
maximized if the reservoir capacitor voltage is kept at half of the open-circuit voltage
under the same mechanical condition. A few different DC/DC converters that achieve
such optimization were presented including adaptive control [13] and input impedance
matching the DC/DC converter [49]. The limitation of passive circuits is that the voltage
amplitude across piezoelectric device is limited by the open circuit voltage; hence, it
constrains the amount of energy harvested.
Semi-passive energy harvesting circuits and their controls have been proposed to
increase the voltage swing on the piezoelectric device by using an inductor to temporarily
store and return part of the stored electrical energy back into the piezoelectric device.
Semi-passive circuits include parallel synchronous harvesting on an inductor and series
synchronous harvesting on inductor topologies. Both utilize an inductor with a
combination of switches (such as MOSFET) and diode networks to realize sudden
discharging and partial voltage reversion of the piezoelectric device. The switches’
opening is synchronized with the peak voltage of the device. Since voltage amplitude on
the piezoelectric device can be larger than that of passive circuits, the power conversion
is also improved significantly. However, a semi-passive circuit relies on the inductor to
27
transfer the peak energy on the piezoelectric device. Since all the peak electrical energy
in the piezoelectric device has to be stored in the inductor, the peak current is relatively
high for the power level those energy harvesting system deal with; thus, the 2I R loss in
the inductor becomes the major limitation of energy conversion efficiency. Increasing
the value of the inductance could reduce the loss; however, in practice the value of
inductor is constrained by its weight and size.
Furthermore, a sudden voltage transition across the piezoelectric device generates
a rapid deformation of the device through unilateral electro-mechanical coupling of
piezoelectricity. This deformation is equivalent to a step impact on the mechanical
structure. Because the step impact comprises high frequency components that could
easily cause mechanical systems to vibrate, its associated energy eventually dissipates as
heat, further decreasing the efficiency of the system. Moreover, its simple control
algorithm that synchronizes the opening of the switch with the peak voltage of the
piezoelectric device is not optimized for the dynamic energy harvesting system that
works at off-resonance.
In the field of active vibration control, researchers [18] have studied the power
flow between piezoelectric device and power amplifiers. In some cases the power flow is
actually from the piezoelectric device to a power amplifier. Were a linear amplifier used,
this power would generally be dissipated through power transistors in the form of heat,
but if a bi-directional switching amplifier is used to drive the piezoelectric device, this
power could well be reclaimed and utilized, which already constitutes an active energy
harvesting system. The only difference is the goal regarding their control laws. In energy
28
harvesting the controller is designed to maximize the power generation, while the goal of
active vibration control is to suppress vibration. They are not always coincident.
In 2003, Hagood and Ghand [55] patented the general concept of actively
controlling the voltage and/or charge across the terminals of a piezoelectric device to
generate electrical power. Unfortunately, the systematic study of active energy
harvesting using piezoelectric device is not known in academic literature. In this paper,
we establish the modeling of active energy harvesting. Based on the model, the control
algorithms are presented. For quasi-static cases, the control is much more straightforward
than that in the case of dynamic applications, where searching for an optimized controller
is more involved. Experiments were conducted demonstrating the superior performance
of active energy harvesting systems.
2.4.2 Control of the energy harvesting circuit
We redraw the energy harvesting system in Figure 2.6 from a control system point
of view. The controller is optimized for maximum power generation. In the figure, we
arbitrarily choose force and current as inputs and voltage and speed as outputs. If the
controller does not need the mechanical state and only voltage and current are used for
control purposes, we call this a sensor-less control. Once the control loop is established,
the system response to the mechanical excitation is, therefore, jointly determined by both
the energy harvesting device and the circuit. Thus, we could alter the system response for
the best harvesting effect with the power electronic circuit and its control.
29
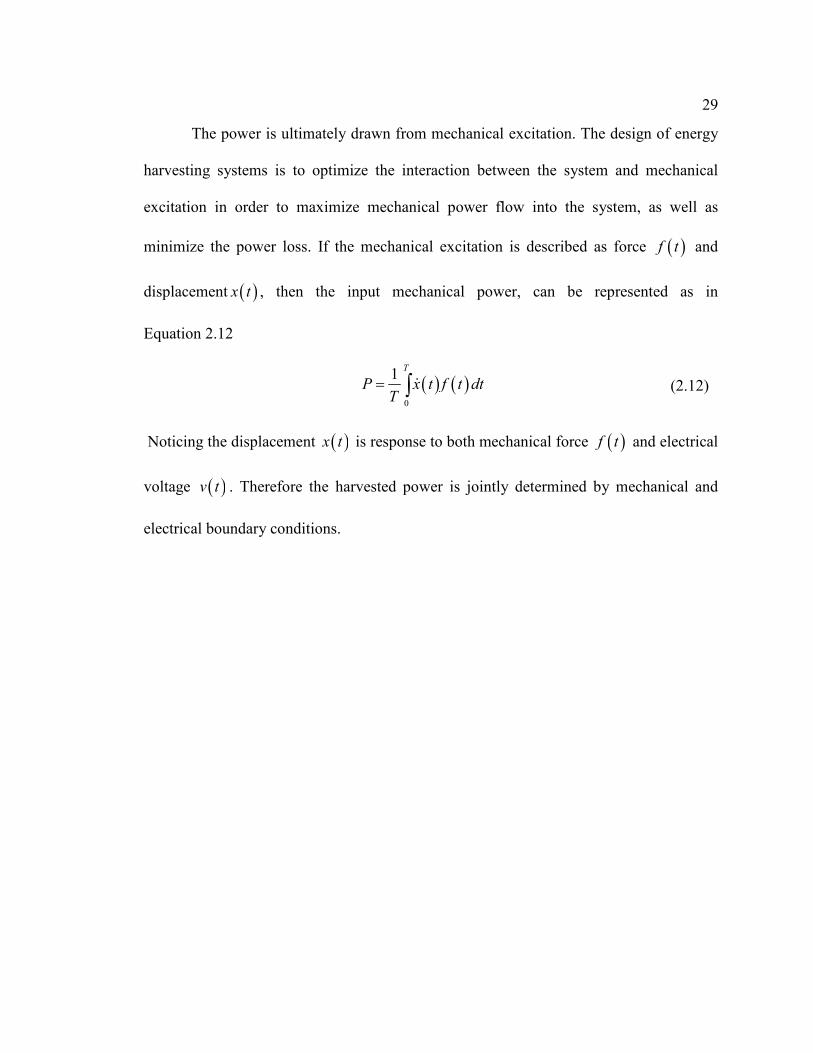
The power is ultimately drawn from mechanical excitation. The design of energy
harvesting systems is to optimize the interaction between the system and mechanical
excitation in order to maximize mechanical power flow into the system, as well as
minimize the power loss. If the mechanical excitation is described as force ( )f t and
displacement ( )x t , then the input mechanical power, can be represented as in
Equation 2.12
Noticing the displacement ( )x t is response to both mechanical force ( )f t and electrical
voltage ( )v t . Therefore the harvested power is jointly determined by mechanical and
electrical boundary conditions.
( ) ( )0
1T
P x t f t dtT
= ∫ (2.12)

30
In the following chapters, energy harvesting systems are studied from both power flow
and control points of view.
Figure 2.6: Control flow of energy harvesting system
Device &
Structure
Inverter &
Controller Integration Integration
Sensor
Sensor
Force
Speed
Current
Voltage
Input
mechanical
energy
Output
electrical
energy

Chapter 3
Quasi-static Linear Energy Harvesting Theory
Piezoelectric materials, including ceramics, single crystal, and polymer varieties,
have been widely adopted for energy harvesting applications due to their high energy
density, simple structure, and high frequency response. Many applications fall into the
quasi-static excitation category. In this chapter, a theoretical model based on the analysis
of electrical and mechanical boundary conditions is established. The model is used to
examine passive, semi-passive and active energy harvesting circuits. Theoretically, it will
be shown that active energy harvesting is well suited for quasi-static applications, for its
higher energy output and better electromechanical coupling. The study also builds the
foundation for investigating more complex systems, such as dynamic vibration energy
harvesting.
3.1 Piezoelectric material and device
Piezoelectricity is a material constitutive property consisting of mutual coupling
between mechanical strain/stress and electrical field/charge. Piezoelectricity could be
described by the following linear constitutive equations [38]:
,E
ij ijkl kl ijm mS s T d E= + (3.1)
,T
n nkl kl mn mD d T Eε= + (3.2)

32
Where klT , ijS are the mechanical stress and strain tensors, and nD , mE are the electric
displacement and field vectors, respectively. In Equations 3.1 and 3.2 the Einstein
summation convention is used.
Monolithic piezoelectric materials are rarely used as standalone devices. The
generated strain of a piezoelectric material is small (usually < 0.1% for ceramics), even
under high field. Furthermore, piezoelectric material, especially ceramics such as PZT, is
relatively stiff and requires a large stress to be effectively strained. They are therefore
often embedded into certain mechanical structures, constituting devices. Those structures
include unimorph/bimorph cantilever beams [40], matrix composite structures [41], and
cymbal structures [43] . Piezoelectric materials themselves are also often laminated into
multilayer structures [42] or made into fibers to further reduce the required driving
voltage or to enhance their robustness [44]. Although the constitutive equations of
piezoelectricity are in tensor form, a piezoelectric device can often be described by scalar
equations. Under the quasi-static assumption, linear, frequency-independent equations
that represent the device behavior are written as follows:
where δ is the deflection or displacement of the device, Q is the electrical charge
on the electrodes of the device, F is the force exerted on the device, and V is the
voltage across the electrodes. The Vs is the compliance under constant electrical filed,
d is the general piezoelectric coefficient and FC capacitance under constant force. For
many regularly-shaped devices, a closed-form expression of those parameters can be
Vs F dVδ = + (3.3)
FQ dF C V= + (3.4)
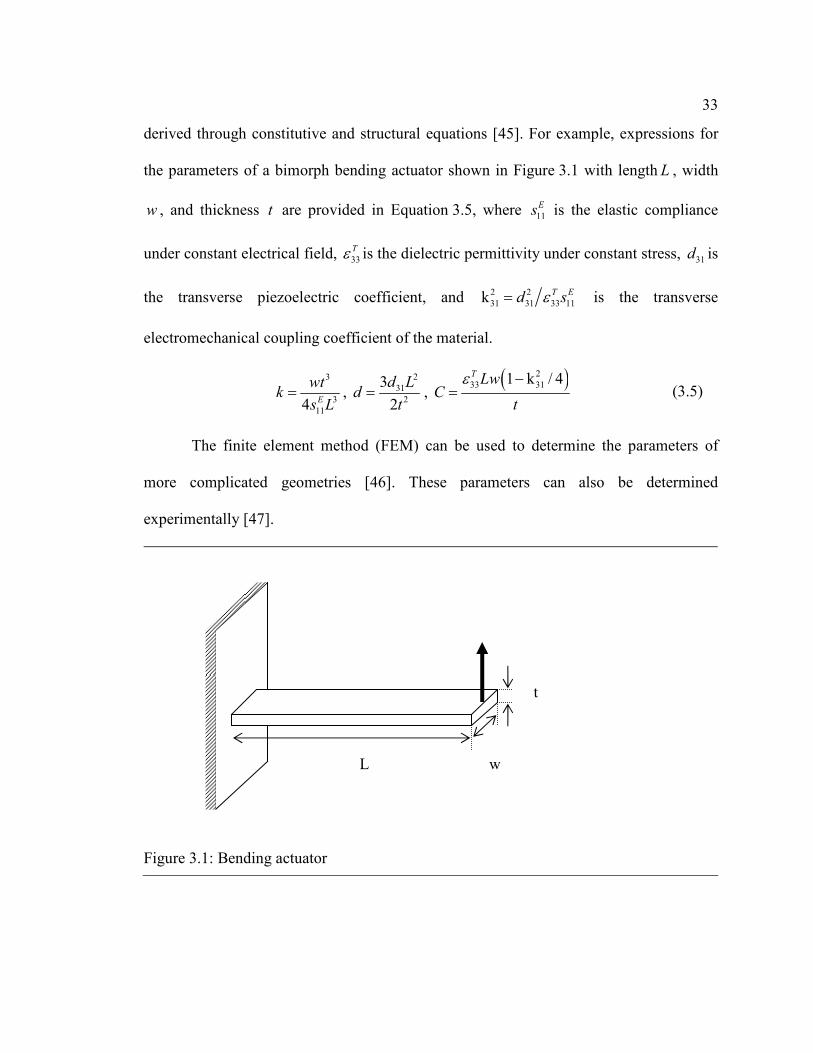
33
derived through constitutive and structural equations [45]. For example, expressions for
the parameters of a bimorph bending actuator shown in Figure 3.1 with length L , width
w , and thickness t are provided in Equation 3.5, where 11
Es is the elastic compliance
under constant electrical field, 33
Tε is the dielectric permittivity under constant stress, 31d is
the transverse piezoelectric coefficient, and 2 2
31 31 33 11k T Ed sε= is the transverse
electromechanical coupling coefficient of the material.
The finite element method (FEM) can be used to determine the parameters of
more complicated geometries [46]. These parameters can also be determined
experimentally [47].
3
3
114 E
wtk
s L= ,
2
31
2
3
2
d Ld
t= ,
( )2
33 311 k / 4T LwC
t
ε −= (3.5)
Figure 3.1: Bending actuator
L w
t
34
Knowing the above parameters enables us to compare the relative performance of
different devices. The piezoelectric coefficient d in Equations 3.3 and 3.4 is the coupling
between electrical charge and mechanical force, but it does not always reflect the
performance of the device from an energy point of view. A more often-used figure of
merit is the electromechanical coupling coefficient 2k , which is often used to characterize
piezoelectric material as a transducer.
One definition of the coupling coefficient [48] is given by
where mU is the mutual electromechanical energy density, eU is the elastic energy
density and dU is the dielectric energy density. By this definition the coupling coefficient
is only related to the initial and final state. So it could be directly related to the material
properties. In fact, it summarizes in one parameter all the elastic, piezoelectric and
dielectric constants for a specific configuration. For example, assuming the only non-zero
component of electrical field and mechanical stress is along the polarization direction, a
coupling coefficient is calculated as shown in Equation 3.7
Another often-seen definition [38] is related to a specific energy conversion cycle.
Illustrated in Figure 3.2, the piezoelectric material is strained by stress 3T component
under short circuit condition. At maximum stress, the total stored energy per unit volume
at maximum compression is corresponds to the total area of 1W and 2W in the figure.
22 m
e d
Uk
U U= (3.6)
22 3333
33 33
kT E
d
sε= (3.7)
35
Then stress is released under an open-circuit condition, during which a voltage is
generated across the electrodes of the material. Finally at zero stress, the material is
connected to an electric load to discharge the piezoelectric capacitance. As work is done
on the electric load, the strain returns to its initial state. The energy dissipated on the
resistor corresponds to the area W1, and the part of the energy unavailable to the electric
load is therefore W2.
Based on above energy conversion cycle the coupling factor is defined as follows:
Figure 3.2: Energy harvesting cycle through open circuit and short circuit boundary
conditions
2 1
1 2
Wk
W W=
+ (3.8)
36
It can be shown that based on the energy conversion cycle described above, the two
definitions are mathematically the same.
The coupling coefficient of a device is similarly defined by 3.8, where the total
energy is used instead of energy density. For a device described by Equations 3.3 and 3.4,
the coupling coefficient is calculated to be:
The concept of efficiency of the piezoelectric material, on the other hand, is
always associated with irreversible energy loss during the conversion process, and is
usually defined using Equation 3.10
Energy conversion happens only when the device is under asymmetric electric
boundary conditions. For example, if the device is open-circuited throughout the
mechanical strain cycle, no net electrical energy is converted. Energy harvesting circuits
have distinct electrical cycles, which greatly affect the energy harvesting process.
In the following section we will discuss in detail how different energy harvesting
circuits interact with a piezoelectric device to achieve energy conversion. In this
discussion we assume the mechanical excitation is given by a force with the same peak-
to-peak variation for each circuit, but not necessarily in sinusoidal fashion. This is an
advantage of this approach in comparison to the harmonic analysis modeling approach
presented in [39].
22k
V F
d
s C= (3.9)
Converted energy Input energy-loss
Input energy Input energyη = = (3.10)
37
3.2 Passive and Semi-passive Energy harvesting circuits
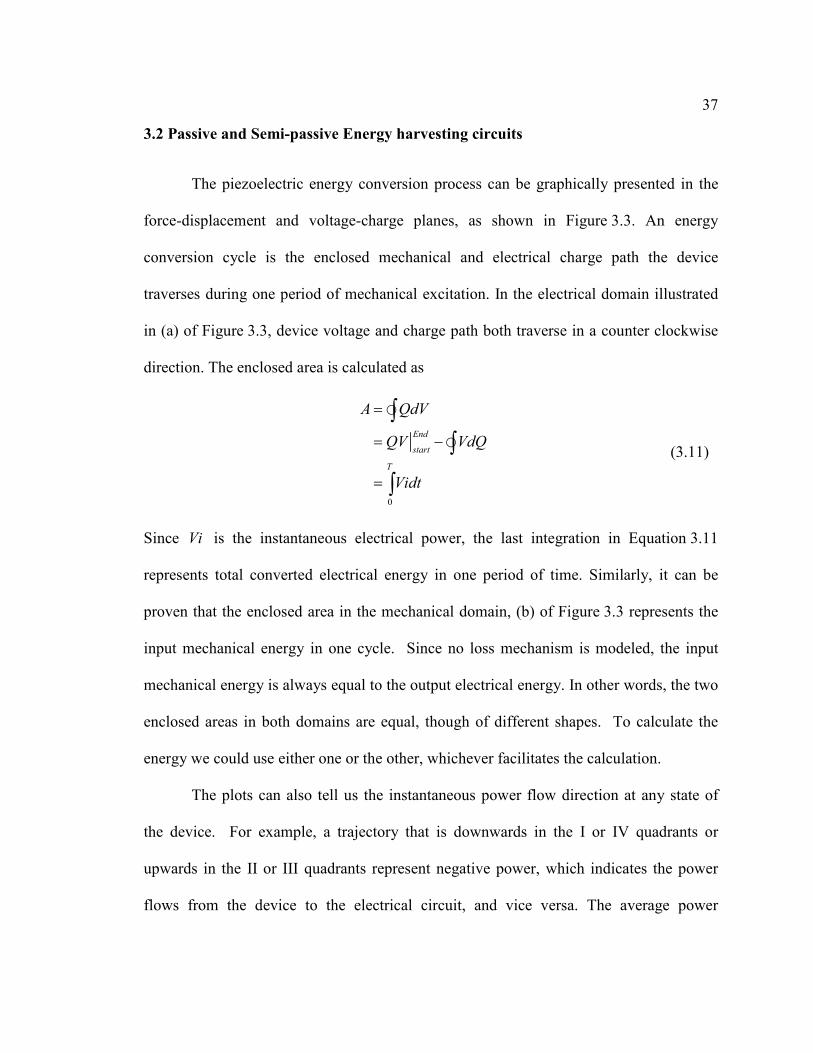
The piezoelectric energy conversion process can be graphically presented in the
force-displacement and voltage-charge planes, as shown in Figure 3.3. An energy
conversion cycle is the enclosed mechanical and electrical charge path the device
traverses during one period of mechanical excitation. In the electrical domain illustrated
in (a) of Figure 3.3, device voltage and charge path both traverse in a counter clockwise
direction. The enclosed area is calculated as
Since Vi is the instantaneous electrical power, the last integration in Equation 3.11
represents total converted electrical energy in one period of time. Similarly, it can be
proven that the enclosed area in the mechanical domain, (b) of Figure 3.3 represents the
input mechanical energy in one cycle. Since no loss mechanism is modeled, the input
mechanical energy is always equal to the output electrical energy. In other words, the two
enclosed areas in both domains are equal, though of different shapes. To calculate the
energy we could use either one or the other, whichever facilitates the calculation.
The plots can also tell us the instantaneous power flow direction at any state of
the device. For example, a trajectory that is downwards in the I or IV quadrants or
upwards in the II or III quadrants represent negative power, which indicates the power
flows from the device to the electrical circuit, and vice versa. The average power
0
End
start
T
A QdV
QV VdQ
Vidt
=
= −
=
∫∫
∫
(3.11)
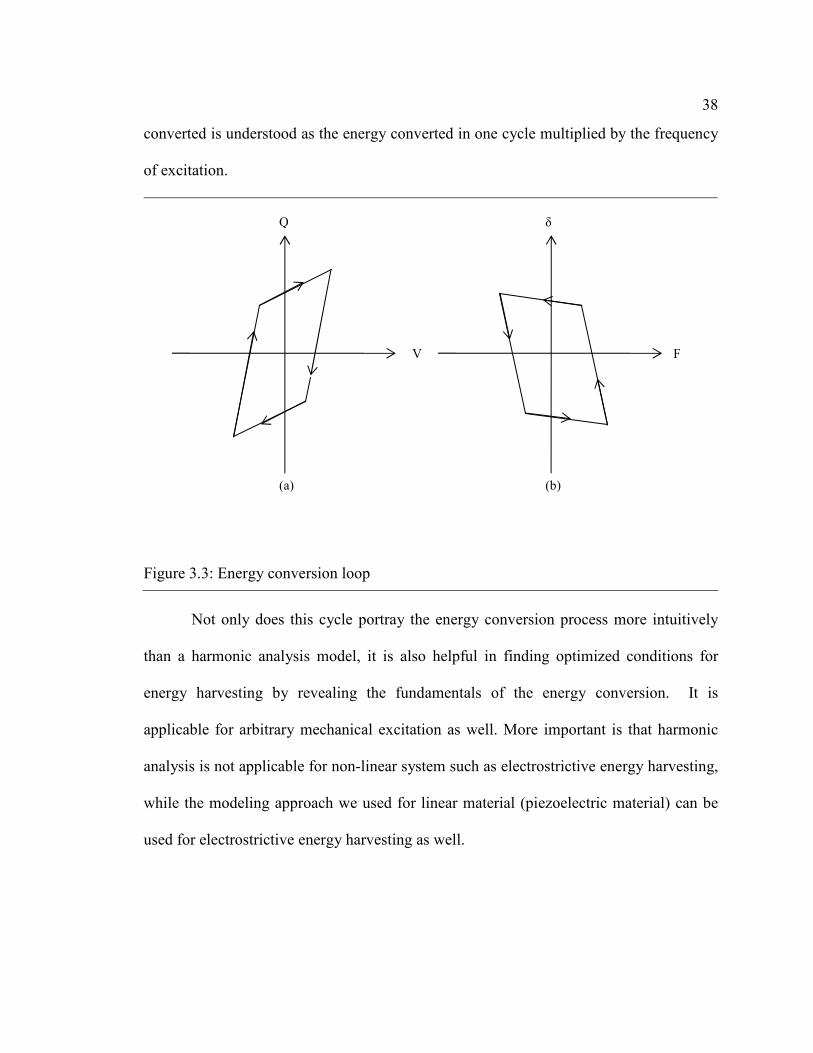
38
converted is understood as the energy converted in one cycle multiplied by the frequency
of excitation.
Not only does this cycle portray the energy conversion process more intuitively
than a harmonic analysis model, it is also helpful in finding optimized conditions for
energy harvesting by revealing the fundamentals of the energy conversion. It is
applicable for arbitrary mechanical excitation as well. More important is that harmonic
analysis is not applicable for non-linear system such as electrostrictive energy harvesting,
while the modeling approach we used for linear material (piezoelectric material) can be
used for electrostrictive energy harvesting as well.
Figure 3.3: Energy conversion loop
V F
Q δ
(a) (b)

39
3.2.1 Passive circuits
One type of energy harvesting circuit is the so-called passive circuit, where the
instantaneous powers flow is always from the device to the electrical circuit. The
traditional diode rectifiers and charge extraction circuits are typical passive circuit types.
3.2.1.1 Diode rectifier
A common energy harvesting circuit consists of a diode rectifier in full bridge (a)
or half bridge (b) configurations, as shown in Figure 3.4. It is the most well known for
piezoelectric energy harvesting.
Diodes have unique unidirectional conduction. When configured as a rectifier,
they are able to convert AC to DC voltage. Considering the half rectifier, in Figure 3.4
(b) as an example. When the piezoelectric device voltage is positive but lower than Vc,
the voltage across capacitor C2, both D5 and D6 are reverse biased. A small leakage
Piezo-device
Vc
Piezo-device
Vc
(a) (b)
D1 D2
D3 D4
D5
D6
C1 C2
Figure 3.4: Full bridge diode rectifier (a) and half bridge diode rectifier circuit (b)
40
current in the diode can typically be neglected. The piezoelectric device is therefore in an
open-circuit condition. Under an applied mechanical force, the voltage on the device
keeps increasing until slightly higher than Vc. Diode D6 is then forward biased and it
starts to conduct, and therefore, except for a the forward voltage drop across diode, the
piezoelectric device is connected to the capacitor voltage Vc. The diode D5’s purpose is
to prevent the device voltage from becoming negative when the opposite force is applied,
and provides a necessary path for reverse current to flow.
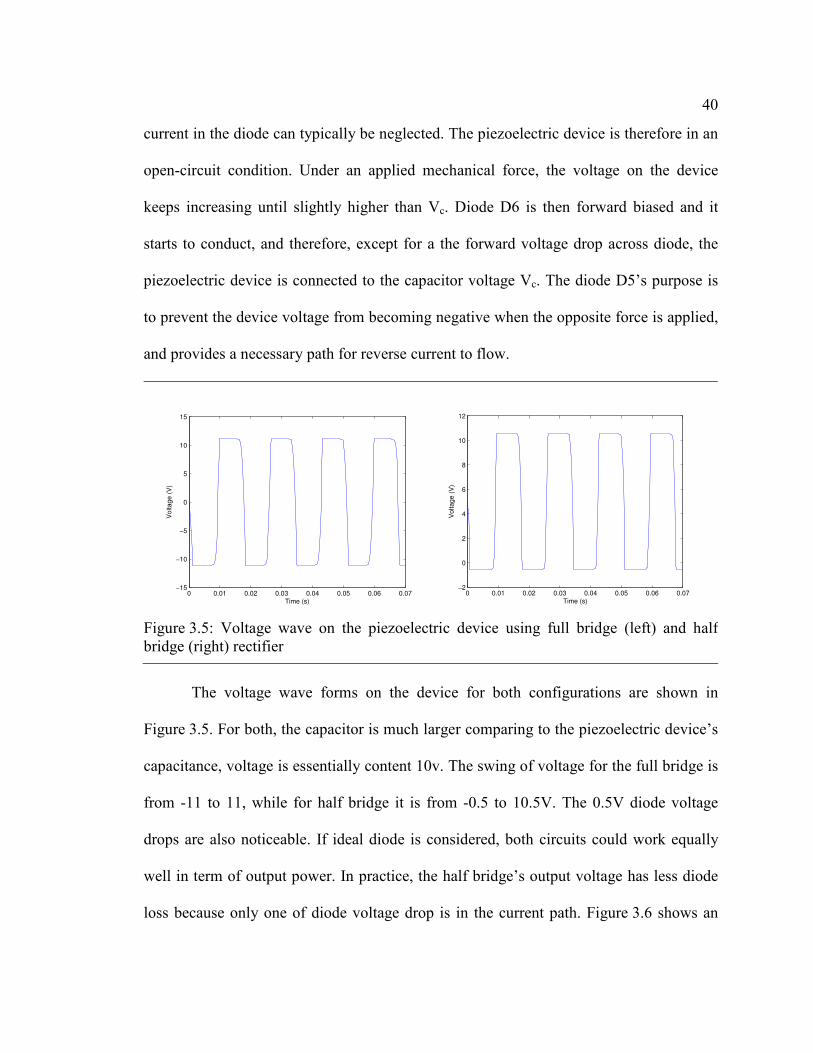
The voltage wave forms on the device for both configurations are shown in
Figure 3.5. For both, the capacitor is much larger comparing to the piezoelectric device’s
capacitance, voltage is essentially content 10v. The swing of voltage for the full bridge is
from -11 to 11, while for half bridge it is from -0.5 to 10.5V. The 0.5V diode voltage
drops are also noticeable. If ideal diode is considered, both circuits could work equally
well in term of output power. In practice, the half bridge’s output voltage has less diode
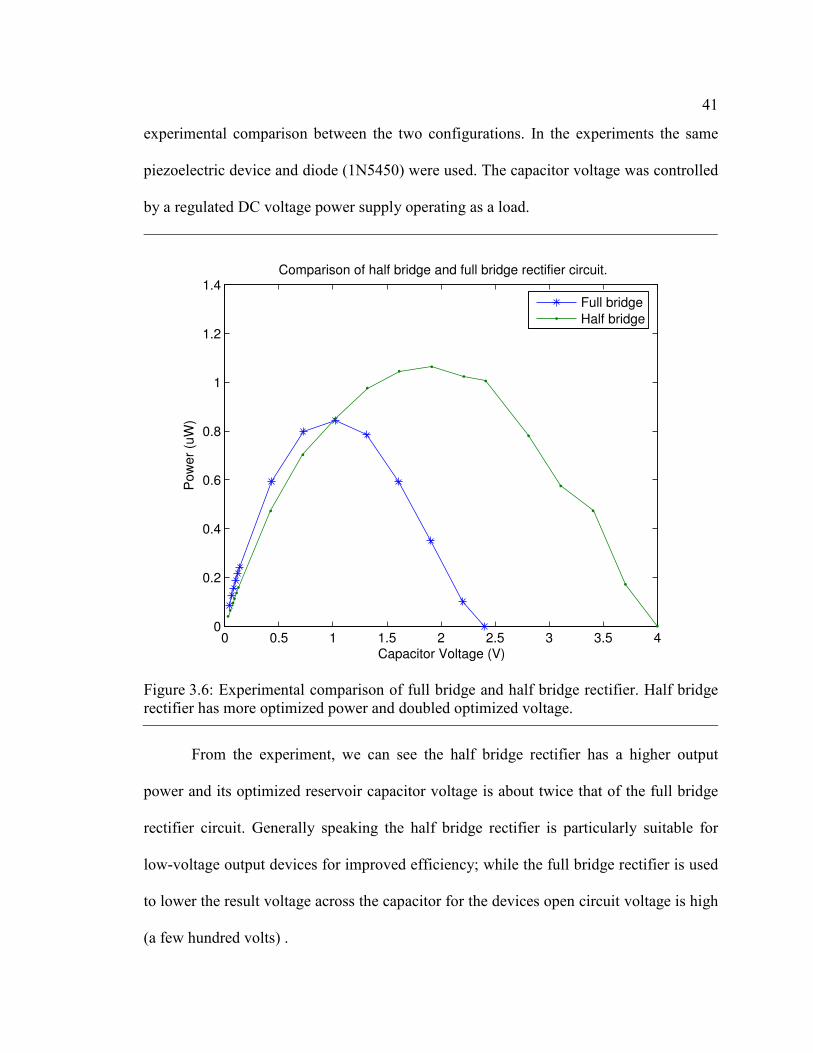
loss because only one of diode voltage drop is in the current path. Figure 3.6 shows an
0 0.01 0.02 0.03 0.04 0.05 0.06 0.07−15
−10
−5
0
5
10
15
Time (s)
Vo
lta
ge
(V
)
0 0.01 0.02 0.03 0.04 0.05 0.06 0.07−2
0
2
4
6
8
10
12
Time (s)
Voltage (
V)
Figure 3.5: Voltage wave on the piezoelectric device using full bridge (left) and half
bridge (right) rectifier
41
experimental comparison between the two configurations. In the experiments the same
piezoelectric device and diode (1N5450) were used. The capacitor voltage was controlled
by a regulated DC voltage power supply operating as a load.
From the experiment, we can see the half bridge rectifier has a higher output
power and its optimized reservoir capacitor voltage is about twice that of the full bridge
rectifier circuit. Generally speaking the half bridge rectifier is particularly suitable for
low-voltage output devices for improved efficiency; while the full bridge rectifier is used
to lower the result voltage across the capacitor for the devices open circuit voltage is high
(a few hundred volts) .
0 0.5 1 1.5 2 2.5 3 3.5 40
0.2
0.4
0.6
0.8
1
1.2
1.4
Capacitor Voltage (V)
Po
we
r (u
W)
Comparison of half bridge and full bridge rectifier circuit.
Full bridge
Half bridge
Figure 3.6: Experimental comparison of full bridge and half bridge rectifier. Half bridge
rectifier has more optimized power and doubled optimized voltage.
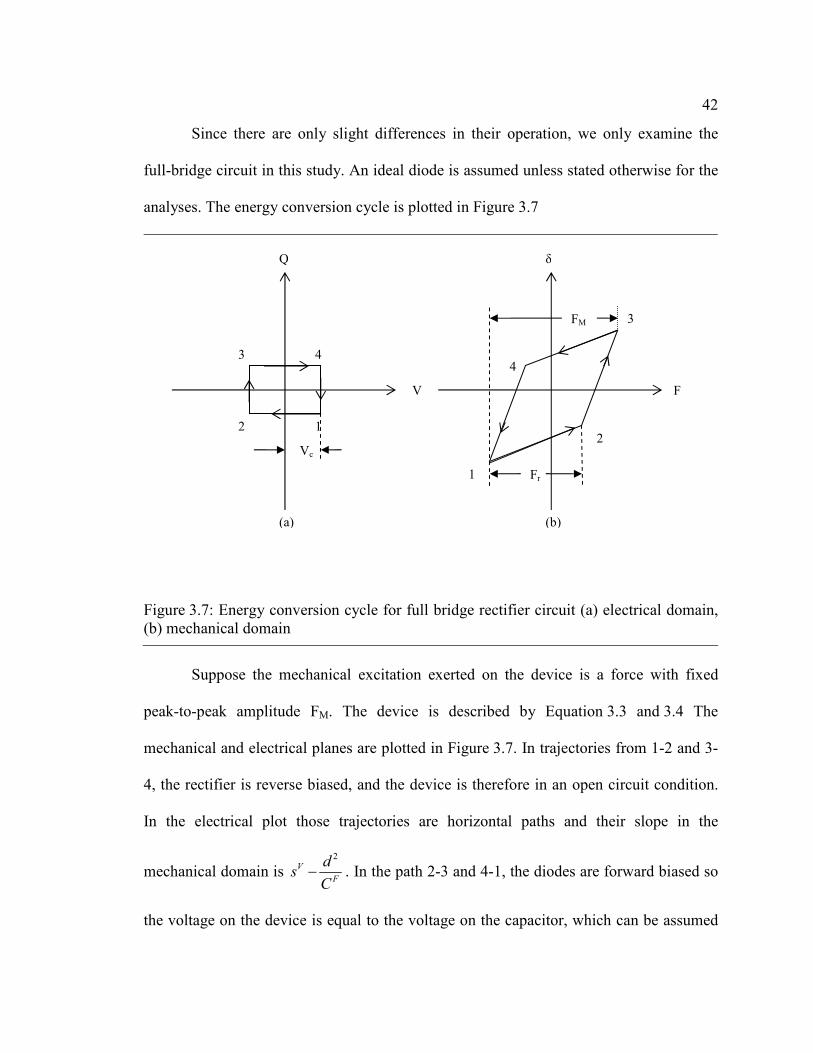
42
Since there are only slight differences in their operation, we only examine the
full-bridge circuit in this study. An ideal diode is assumed unless stated otherwise for the
analyses. The energy conversion cycle is plotted in Figure 3.7
Suppose the mechanical excitation exerted on the device is a force with fixed
peak-to-peak amplitude FM. The device is described by Equation 3.3 and 3.4 The
mechanical and electrical planes are plotted in Figure 3.7. In trajectories from 1-2 and 3-
4, the rectifier is reverse biased, and the device is therefore in an open circuit condition.
In the electrical plot those trajectories are horizontal paths and their slope in the
mechanical domain is 2
V
F
ds
C− . In the path 2-3 and 4-1, the diodes are forward biased so
the voltage on the device is equal to the voltage on the capacitor, which can be assumed
Figure 3.7: Energy conversion cycle for full bridge rectifier circuit (a) electrical domain,
(b) mechanical domain
V F
Q δ
(a) (b)
Vc
FM
3
1
4
2
3
1
4
2
Fr
43
to be constant. These paths are vertical in the electrical domain and have a slope of Vs in
mechanical domain.
The force at which the device generates an open circuit voltage equal to the
capacitor voltage is calculated from Equation 3.4 by letting 0Q∆ = and 2 CV V∆ = as
follows,
From point 2 to 3 the device voltage is equal to VC, and the change of the charge
on the electrodes is calculated as
The energy converted in one cycle is equal to the enclosed rectangular area in the
electrical domain.
The energy is a function of the capacitor voltage and it maximizes when:
This leads to the optimized condition of the rectifier circuit.
In Equation 3.16, OV is the peak-peak open circuit voltage when the device is exposed to
the same force, defined in Equation 3.17.
2F
Cr
V CF
d= (3.12)
( ) 2F
cM r M
C VQ d F F d F
d
∆ = − = −
(3.13)
2 2 2F
cc M c
C VW V Q d F V
d
= ∆ ∆ = −
(3.14)
2 8 0F
m C
c
dWdF C V
dV= − = (3.15)
1
4 4
Mc oF
dFV V
C= = (3.16)
44
At the optimized condition, the energy generated in one cycle is
In the case of the half-bridge rectifier, it can be shown that the optimized condition
become Equation 3.19
Under ideal diode assumption the converted optimized energy of the half-bridge is the
same as Equation 3.18, which could also be rewritten as Equation 3.20:
Where mechW is the peak mechanical energy stored in the device if same amount of force
MF is exerted and the coupling factor 2
2kV F
d
s C= is as defined in Equation 3.9. This
equation implies a good energy harvesting device must be compliant to obtain more
energy when stressed, and should have a high coupling coefficient. The piezoelectric
single crystal often out-performs ceramic material in harvesting power, because it has a
better coupling and is less stiff.
The optimized condition of Equation 3.16 and Equation 3.19 can be implemented
in practice using DC/DC converters [49]. The classical rectifier circuit remains to be the
most adopted energy harvesting circuit due to its simplicity, low cost, and versatility.
MO F
dFV
C= (3.17)
2 22
max
1
4 4
FMOF
d FW C V
C= = (3.18)
1
2 2
Mc oF
dFV V
C= = (3.19)
22 2
max 2k 2k2
Mmech
FW W
k= = (3.20)
45
Using the rectifier circuit, the voltage swing on a piezoelectric device is less than
its open-circuit voltage. Therefore the electrically induced displacement is also limited.
For a given mechanical force, if we could further increase the displacement by increasing
the voltage swing on the device, we could effectively increase the converted energy for
each cycle. One of the approaches is synchronous charge extraction.
3.2.1.2 Synchronous Charge Extraction
Another type of passive energy harvesting circuit, patented by Smalser [51], is a
synchronous charge extraction circuit [50] that utilizes a peak detector to close a switch
when the voltage across the piezoelectric device reaches its peak value. This circuit is
similar to the synchronous switch damping on short (SSDS) [52] circuit used in the
vibration control field. This circuit was later implemented [53] via an application specific
integrated circuit (ASIC). Two implementation circuits are illustrated in Figure 3.8. The
switch in circuit (a) uses a PMOS transistor with simple circuitry. To turn off a PMOS
transistor, the gate voltage needs to be as high as the piezoelectric device voltage, which
is often beyond the operation voltage of the control circuit. This makes design of the gate
driving circuit difficult. The circuit (b) uses a fly-back transformer to simplify the gate
drive circuit, where a NMOS transistor is used, therefore the gate voltage needs only to
be higher than the transistor’s threshold voltage relative to the ground.
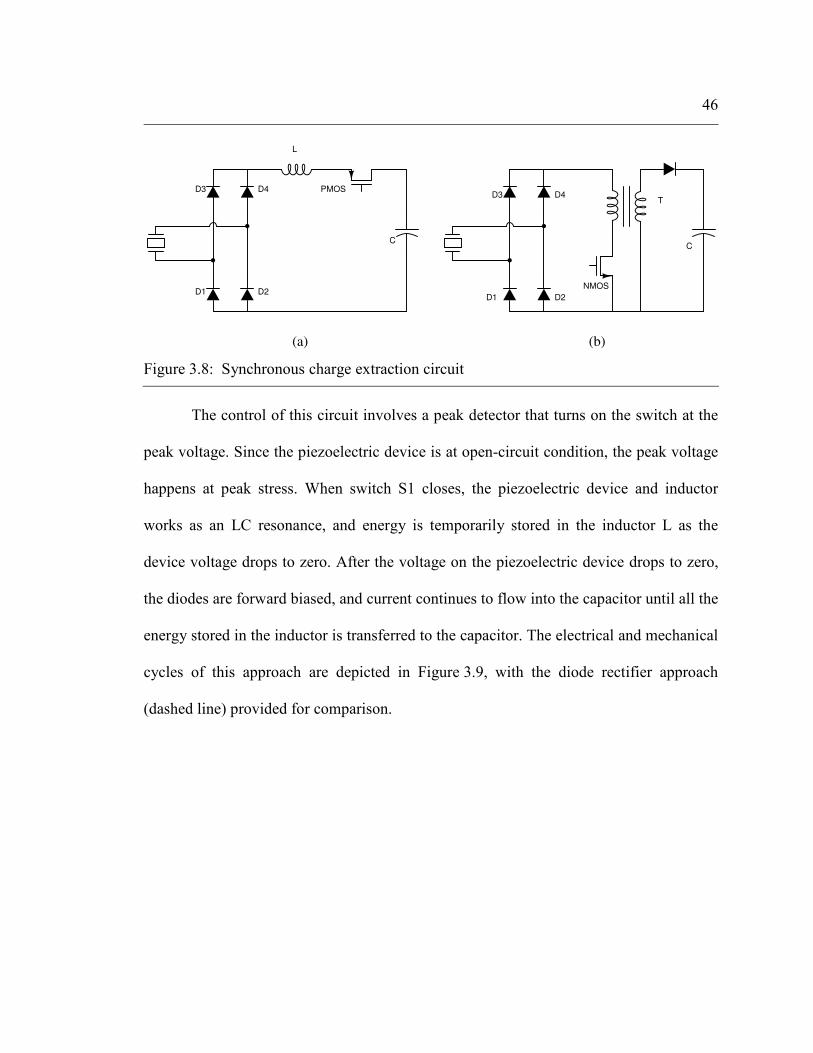
46
The control of this circuit involves a peak detector that turns on the switch at the
peak voltage. Since the piezoelectric device is at open-circuit condition, the peak voltage
happens at peak stress. When switch S1 closes, the piezoelectric device and inductor
works as an LC resonance, and energy is temporarily stored in the inductor L as the
device voltage drops to zero. After the voltage on the piezoelectric device drops to zero,
the diodes are forward biased, and current continues to flow into the capacitor until all the
energy stored in the inductor is transferred to the capacitor. The electrical and mechanical
cycles of this approach are depicted in Figure 3.9, with the diode rectifier approach
(dashed line) provided for comparison.
PMOS
NMOSD2D1
D4D3
L
C
D1 D2
D3 D4T
C
(a) (b)
Figure 3.8: Synchronous charge extraction circuit
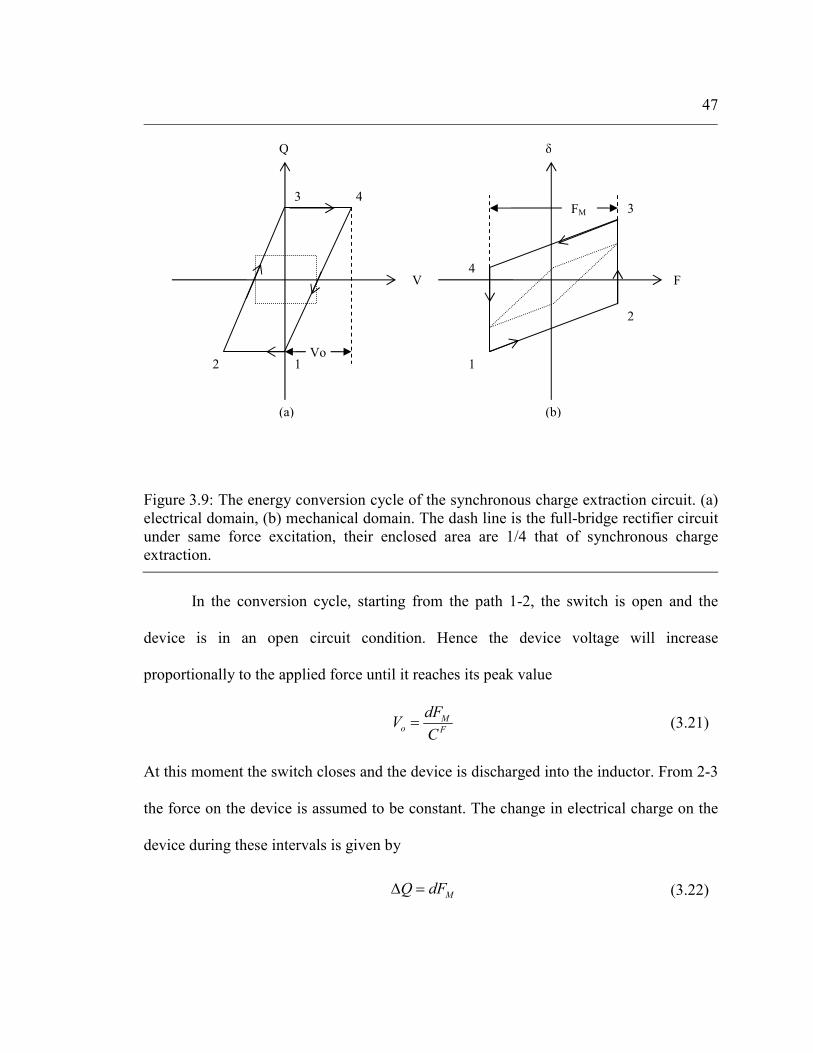
47
In the conversion cycle, starting from the path 1-2, the switch is open and the
device is in an open circuit condition. Hence the device voltage will increase
proportionally to the applied force until it reaches its peak value
At this moment the switch closes and the device is discharged into the inductor. From 2-3
the force on the device is assumed to be constant. The change in electrical charge on the
device during these intervals is given by
Figure 3.9: The energy conversion cycle of the synchronous charge extraction circuit. (a)
electrical domain, (b) mechanical domain. The dash line is the full-bridge rectifier circuit
under same force excitation, their enclosed area are 1/4 that of synchronous charge
extraction.
Mo F
dFV
C= (3.21)
MQ dF∆ = (3.22)
V F
Q δ
(a) (b)
FM
3
1
4
2
3
1
4
2
Vo
48
The amount of the energy converted, therefore, is equal to area of the parallelogram in
the electrical domain (a) of Figure 3.9.
Similarly, this energy could also be related to the device’s coupling coefficient, which is
four times as much as the diode rectifier case.
A close scrutiny of the mechanical domain of the energy conversion cycle reveals that the
mechanical energy input is also quadrupled, obeying the energy conservation of the
system.
One apparent advantage of the synchronous charge extraction circuit is that the
capacitor voltage does not need to be optimized as long as the switching is appropriately
synchronized with the peak voltage for all levels of excitation. However, the voltage
swing of the piezoelectric device is still constrained below or equal to the open circuit
voltage. That in turn limits its energy conversion capability.
3.2.2 Semi-passive energy harvesting circuit
The semi-passive energy harvesting concept originally comes from the concept of
impedance matching [54], which states that the maximum energy transfer from a
piezoelectric device to the energy harvesting circuit is achieved when the input
impedance of the circuit is the complex conjugate of the output impedance of the device.
Because the piezoelectric device is largely capacitive, if the working frequency is low,
2 22FM
o OF
d FW QV C V
C= ∆ = = (3.23)
28 mechW k W= (3.24)
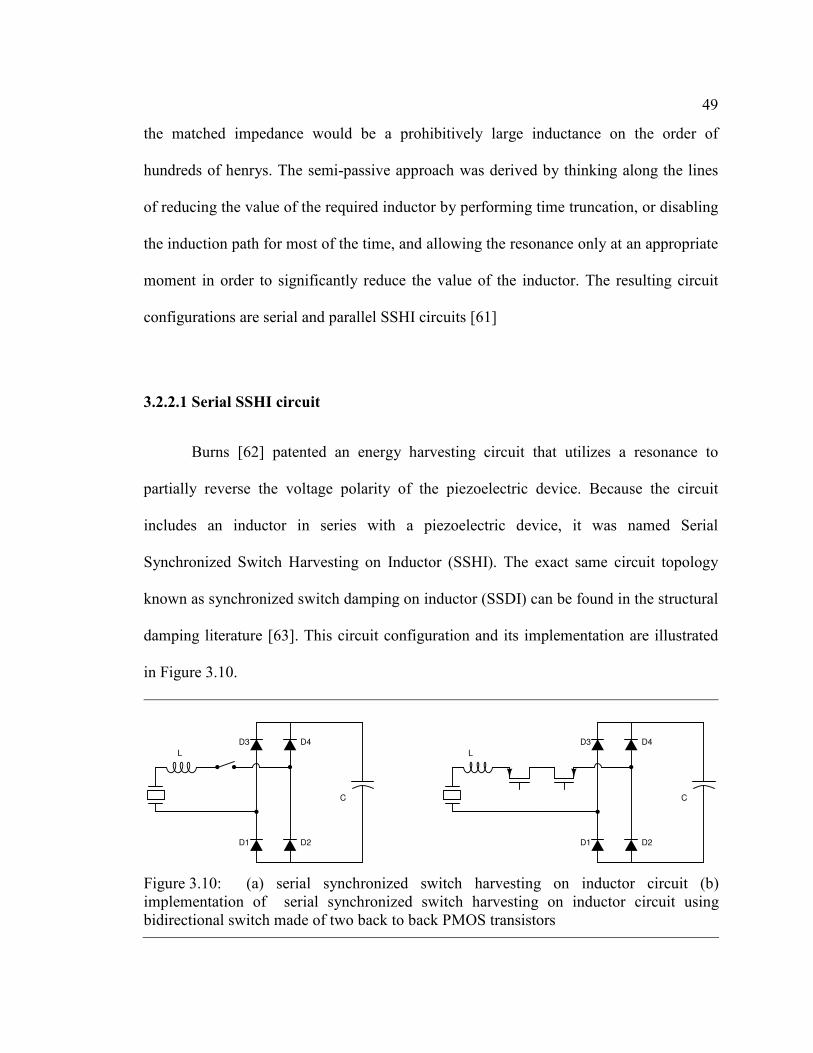
49
the matched impedance would be a prohibitively large inductance on the order of
hundreds of henrys. The semi-passive approach was derived by thinking along the lines
of reducing the value of the required inductor by performing time truncation, or disabling
the induction path for most of the time, and allowing the resonance only at an appropriate
moment in order to significantly reduce the value of the inductor. The resulting circuit
configurations are serial and parallel SSHI circuits [61]
3.2.2.1 Serial SSHI circuit
Burns [62] patented an energy harvesting circuit that utilizes a resonance to
partially reverse the voltage polarity of the piezoelectric device. Because the circuit
includes an inductor in series with a piezoelectric device, it was named Serial
Synchronized Switch Harvesting on Inductor (SSHI). The exact same circuit topology
known as synchronized switch damping on inductor (SSDI) can be found in the structural
damping literature [63]. This circuit configuration and its implementation are illustrated
in Figure 3.10.
D2D1
D4D3
L
C
D2D1
D4D3
L
C
Figure 3.10: (a) serial synchronized switch harvesting on inductor circuit (b)
implementation of serial synchronized switch harvesting on inductor circuit using
bidirectional switch made of two back to back PMOS transistors
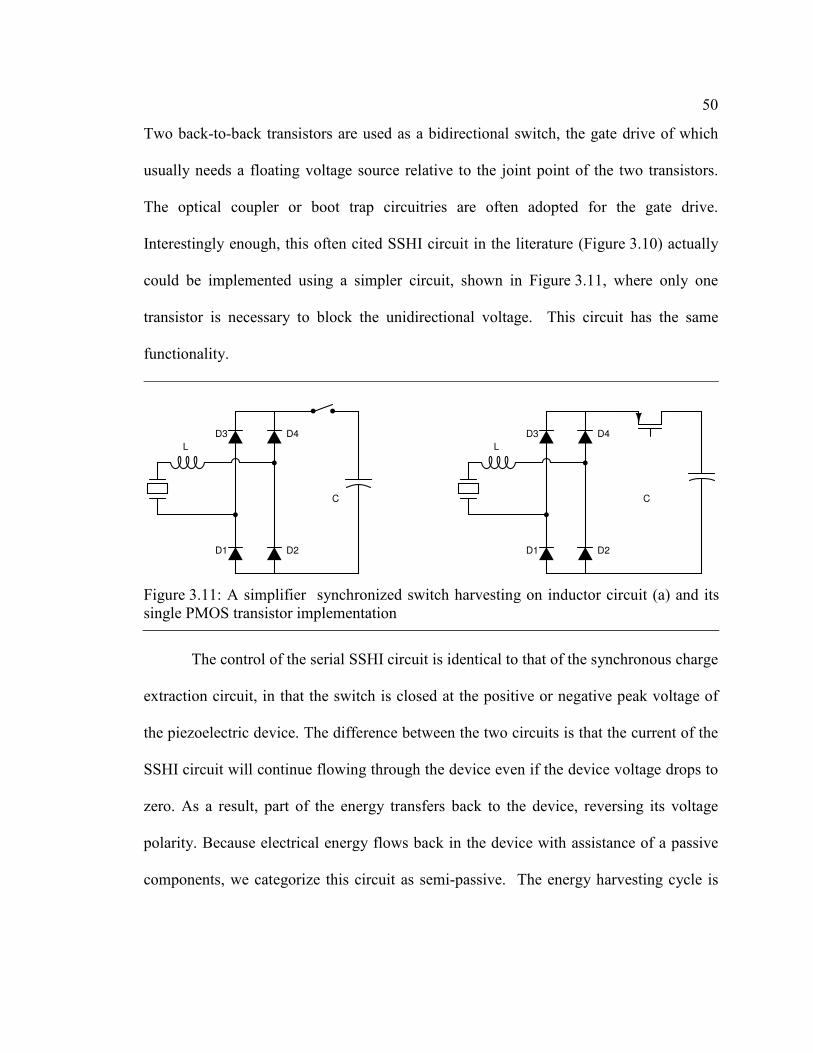
50
Two back-to-back transistors are used as a bidirectional switch, the gate drive of which
usually needs a floating voltage source relative to the joint point of the two transistors.
The optical coupler or boot trap circuitries are often adopted for the gate drive.
Interestingly enough, this often cited SSHI circuit in the literature (Figure 3.10) actually
could be implemented using a simpler circuit, shown in Figure 3.11, where only one
transistor is necessary to block the unidirectional voltage. This circuit has the same
functionality.
The control of the serial SSHI circuit is identical to that of the synchronous charge
extraction circuit, in that the switch is closed at the positive or negative peak voltage of
the piezoelectric device. The difference between the two circuits is that the current of the
SSHI circuit will continue flowing through the device even if the device voltage drops to
zero. As a result, part of the energy transfers back to the device, reversing its voltage
polarity. Because electrical energy flows back in the device with assistance of a passive
components, we categorize this circuit as semi-passive. The energy harvesting cycle is
D2D1
D4D3
L
C
D2D1
D4D3
L
C
Figure 3.11: A simplifier synchronized switch harvesting on inductor circuit (a) and its
single PMOS transistor implementation
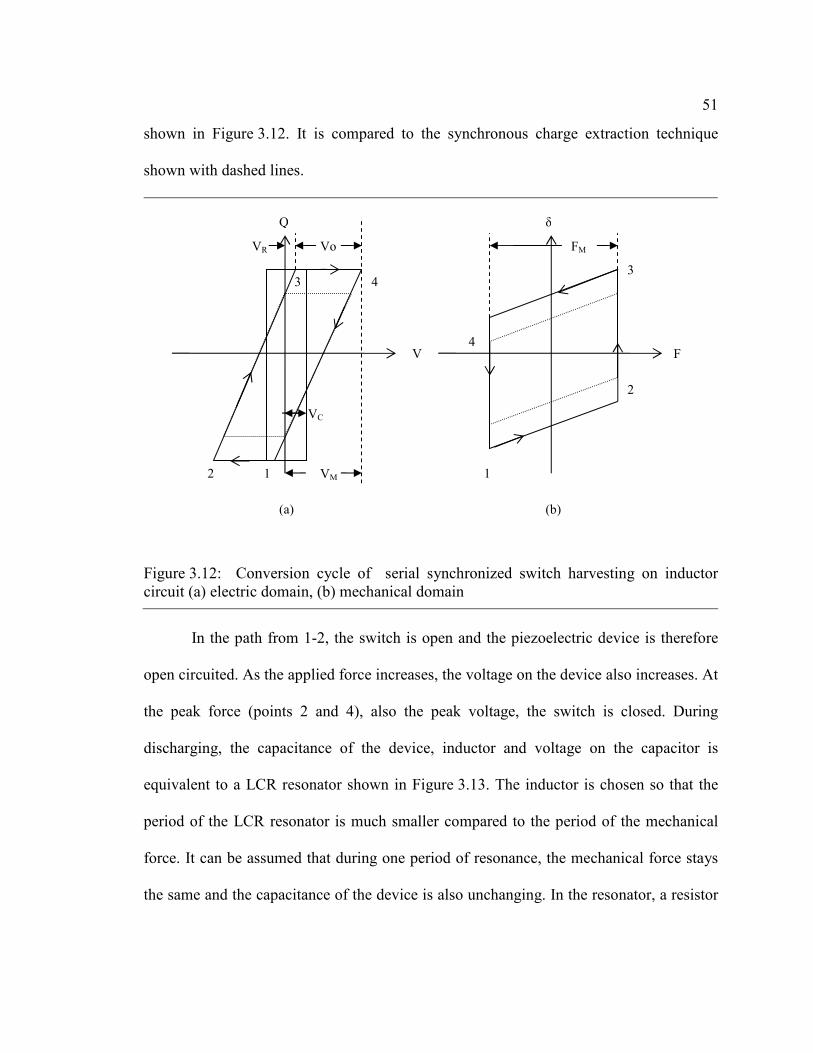
51
shown in Figure 3.12. It is compared to the synchronous charge extraction technique
shown with dashed lines.
In the path from 1-2, the switch is open and the piezoelectric device is therefore
open circuited. As the applied force increases, the voltage on the device also increases. At
the peak force (points 2 and 4), also the peak voltage, the switch is closed. During
discharging, the capacitance of the device, inductor and voltage on the capacitor is
equivalent to a LCR resonator shown in Figure 3.13. The inductor is chosen so that the
period of the LCR resonator is much smaller compared to the period of the mechanical
force. It can be assumed that during one period of resonance, the mechanical force stays
the same and the capacitance of the device is also unchanging. In the resonator, a resistor
Figure 3.12: Conversion cycle of serial synchronized switch harvesting on inductor
circuit (a) electric domain, (b) mechanical domain
V F
Q δ
(a) (b)
FM
3
1
4
2
3
1
4
2
Vo
VM
VC
VR

52
is added as a lumped electrical and mechanical energy dissipation during transition. The
capacitor C is the capacitance of the device and L is the inductor used in the circuit.
This is an initial condition problem with 0t Mv V= = , and its differential equation is
written as
By substitute ν with cVµ ν= − , and defining 2
R
Lα = and 2 1
,nLC
ω = then
Equation 3.25 becomes
where nω is the undamped resonance frequency. The solution to Equation 3.27 for the
under damped case (the over-damped and critically damped cases being too inefficient)
that satisfies the initial condition is
+−
C
L R
Vc
Figure 3.13: Equivalent circuit of serial synchronized switch harvesting on inductor
circuit during transition
2
2 c
d dLC RC V
dt dt
ν νν+ + = (3.25)
22
22 0,n
d d
dt dt
µ µα ω µ+ + = (3.26)
( ) cost
M c dV V e tαµ ω−= − (3.27)
53
where 21d nω ξ ω= − and nξ α ω= . For a slightly damped system, d nω ω≈ .
The circuit is usually designed so that current reverses only once for each
transient, either via a blocking diode or timing the switch to precisely turn off at d
tπω
= .
Substitution yields Equation 3.28.
where Q is know as the quality factor and is defined as 2 2
n dQω ωα α≈ . The reverse
voltage therefore is
Under steady-state, the maximum voltage MV stays the same for all cycles, and the
relationship in Equation 3.30 holds.
In the above equation, the open circuit voltage Mo
dFV
C= is defined the same as in
Equation 3.21. By simultaneously solving Equations 3.29 and 3.30, we obtain MV as a
function of the open circuit voltage OV and capacitor voltage CV . The physical meaning
of this result is that the equilibrium maximum voltage on the device is jointly determined
by the amount of input energy, represented by OV , and how much energy is removed
from the system, which is proportional to CV .
( ) ( ) 2 ,d Q
M c M cV V e V V e
π παωµ
− −
= − − = − − (3.28)
( ) 2Q
R M c cV V e V
π
ν−
= − − (3.29)
M O RV V ν= + (3.30)
54
Care should be taken when calculating the harvested energy, because we have
included dissipation modeled as a resistor in the equivalent circuit. Even though the
electrical energy coming out of the device is still represented by the parallelogram area, it
is not equal to the energy collected by the capacitor. Since we know the charge going into
the capacitor is
And the capacitor is maintained at a constant voltage CV , The energy is then represented
by the shaded area in Figure 3.12.
For a given mechanical excitation this energy is a function of the capacitor voltage CV ,
and it is maximized when
By substituting Equation 3.34 back into Equation 3.33, we find the optimized energy for
a serial SSHI circuit.
2
2
1
1
Q
O C
M
Q
V V e
V
e
π
π
−
−
− +
=
−
(3.31)
( )
( )
2
2
2
12
1
M O
Q
O C
Q
Q C V V
eC V V
e
π
π
−
−
= −
+ = −
−
(3.32)
( )
2
2
2
12 2
1
C
Q
O C C
Q
W QV
eC V V V
e
π
π
−
−
=
+ = −
−
(3.33)
4
OC
VV = (3.34)

55
The optimized condition is given in Equation 3.36. The effectiveness of this circuit, as
show in Equation 3.35, highly depends on the quality factor Q of the resonator. The peak
voltage at this condition is calculated as
For a lightly damped system, this voltage could become dangerously high for the device
and electrical circuit.
3.2.2.2 Parallel SSHI circuit
As shown in Equation 3.31, the maximum voltage on the piezoelectric device in
the serial SSHI could be high, especially for a lightly-damped circuit. This may
sometimes impose a practical problem, such as dielectric break-down of the piezoelectric
material, or a voltage higher that the rating of the power electronic devices. A parallel
SSHI circuit, however, does not have this problem. It employs a parallel inductor to
2 2 2
max
2
22
2
1
41
1 1
41
Q
M
Q
Q
O
Q
d F eW
Ce
eCV
e
π
π
π
π
−
−
−
−
+ =
−
+ =
−
(3.35)
2
2
1 3
41
Q
M O
Q
eV V
e
π
π
−
−
− =
−
(3.36)
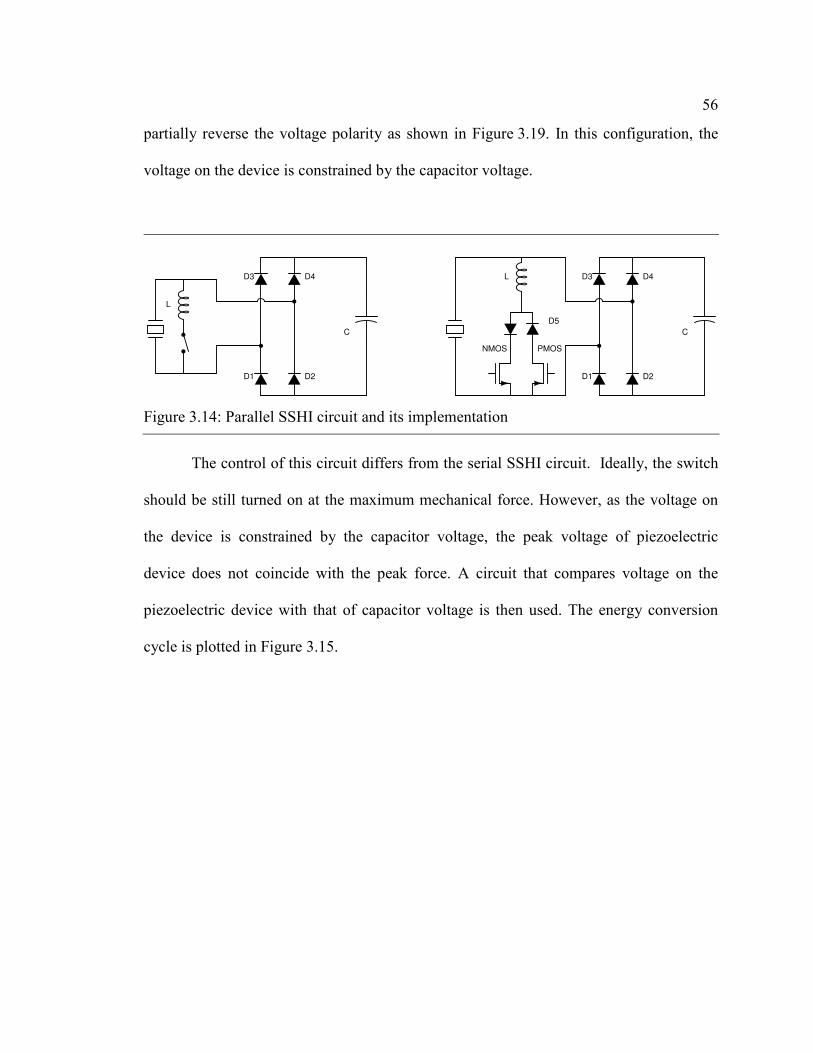
56
partially reverse the voltage polarity as shown in Figure 3.19. In this configuration, the
voltage on the device is constrained by the capacitor voltage.
The control of this circuit differs from the serial SSHI circuit. Ideally, the switch
should be still turned on at the maximum mechanical force. However, as the voltage on
the device is constrained by the capacitor voltage, the peak voltage of piezoelectric
device does not coincide with the peak force. A circuit that compares voltage on the
piezoelectric device with that of capacitor voltage is then used. The energy conversion
cycle is plotted in Figure 3.15.
D2D1
D4D3
L
C
D2D1
D4D3L
C
PMOSNMOS
D5
Figure 3.14: Parallel SSHI circuit and its implementation
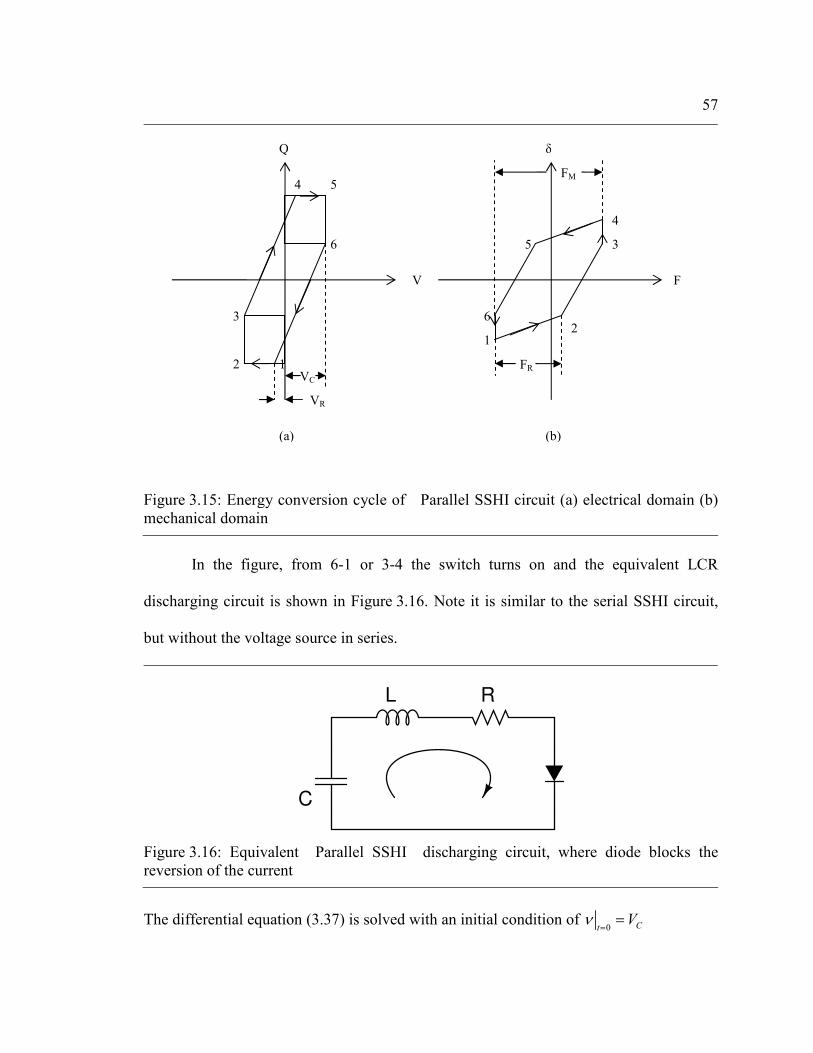
57
In the figure, from 6-1 or 3-4 the switch turns on and the equivalent LCR
discharging circuit is shown in Figure 3.16. Note it is similar to the serial SSHI circuit,
but without the voltage source in series.
The differential equation (3.37) is solved with an initial condition of 0 CtVν
==
Figure 3.15: Energy conversion cycle of Parallel SSHI circuit (a) electrical domain (b)
mechanical domain
C
L R
Figure 3.16: Equivalent Parallel SSHI discharging circuit, where diode blocks the
reversion of the current
VC
6
V F
Q δ
(a) (b)
FM
3
1
4
2
3
4
2
5
6 5
1
VR
FR

58
Solving the above equation for the final state yields
From the electric domain figure, the voltage change from 1-2 then is 21 Q
CV e
π−
−
, so the
force corresponding to this change is
The energy collection only happens from 1-2 and 4-5, during which the charge flow into
the capacitor is
And the associated energy is the shaded rectangular areas in Figure 3.15.
This energy is optimized when
2
20
d dLC RC
dt dt
ν νν+ + = (3.37)
2Q
R cV V e
π−
= − (3.38)
21 Q
C
R
V e
F Cd
π−
− =
(3.39)
( )
21
M R
Q
c
M
Q d F F
V e
d F Cd
π−
= −
− = −
(3.40)
2
2
2 1
C
Q
O C C
W QV
C V V e V
π−
=
= − −
(3.41)
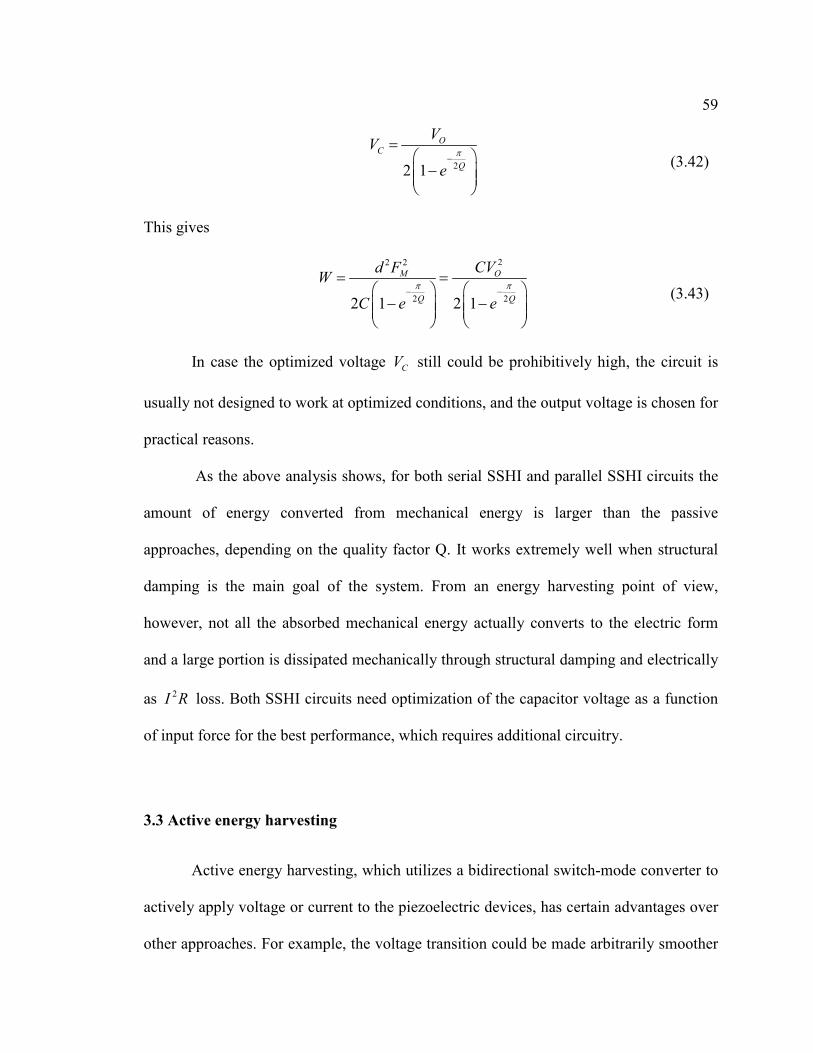
59
This gives
In case the optimized voltage CV still could be prohibitively high, the circuit is
usually not designed to work at optimized conditions, and the output voltage is chosen for
practical reasons.
As the above analysis shows, for both serial SSHI and parallel SSHI circuits the
amount of energy converted from mechanical energy is larger than the passive
approaches, depending on the quality factor Q. It works extremely well when structural
damping is the main goal of the system. From an energy harvesting point of view,
however, not all the absorbed mechanical energy actually converts to the electric form
and a large portion is dissipated mechanically through structural damping and electrically
as 2I R loss. Both SSHI circuits need optimization of the capacitor voltage as a function
of input force for the best performance, which requires additional circuitry.
3.3 Active energy harvesting
Active energy harvesting, which utilizes a bidirectional switch-mode converter to
actively apply voltage or current to the piezoelectric devices, has certain advantages over
other approaches. For example, the voltage transition could be made arbitrarily smoother
22 1
OC
Q
VV
e
π−
= −
(3.42)
22 2
2 22 1 2 1
OM
Q Q
CVd FW
C e e
π π− −
= = − −
(3.43)
60
than that of SSHI approaches, whose resonance frequency is dominated by the inductor
value. A smooth transition has fewer high frequency components, therefore is unlikely to
excite higher mode vibrations in the structure, thus resulting in less structural damping
and energy loss. Secondly, the active energy harvesting uses a pulse-width-modulated
switch amplifier, which moves energy through the inductor in a more continuous fashion,
for the same amount of energy, the peak current in the inductor is orders of magnitude
lower than that of an SSHI inductor, and hence results a much smaller 2I R loss.
The basic configuration of active energy harvesting was first patented by Hagood
in 2003 [55], in which a bidirectional converter directly drives a piezoelectric device.
However, as a patent is not supposed to be a systematic investigation of this topic, its
work mechanism, comparison, and practical limitations were not given. Elsewhere there
is no study on this specific topic. A few papers that investigates energy flow in the active
structure damping could be a good reference in studying active energy harvesting [56],
but their optimization goal is to suppress the vibration, while energy harvesting is a
process to achieve the best electrical energy conversion. Their goals do not always
coincide. In fact, for active vibration energy harvesting, the proof mass might experience
larger vibration than that excited by the base vibration alone.
3.3.1 Fundamental limitations
Active energy harvesting is a technique that can push the energy harvesting limits
of piezoelectric devices. Two major limits are mechanical and electrical, such as break-
down or depoling voltage, or forces and displacements that might crack the device. Those
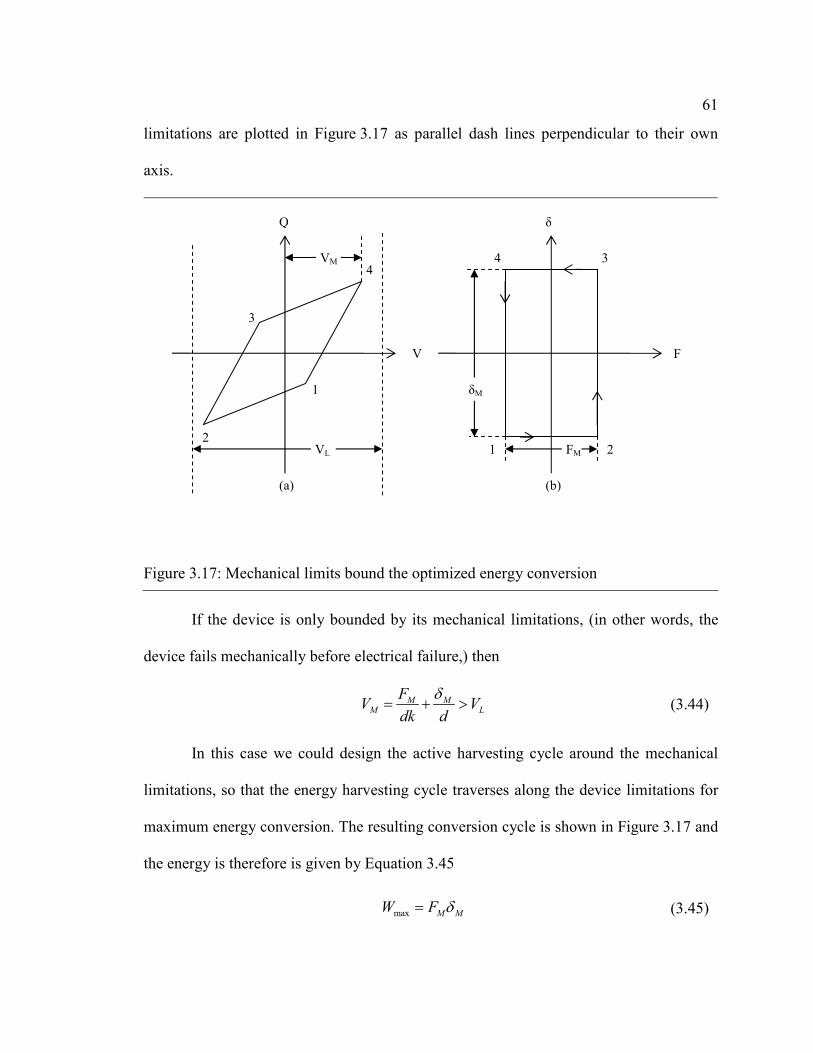
61
limitations are plotted in Figure 3.17 as parallel dash lines perpendicular to their own
axis.
If the device is only bounded by its mechanical limitations, (in other words, the
device fails mechanically before electrical failure,) then
In this case we could design the active harvesting cycle around the mechanical
limitations, so that the energy harvesting cycle traverses along the device limitations for
maximum energy conversion. The resulting conversion cycle is shown in Figure 3.17 and
the energy is therefore is given by Equation 3.45
Figure 3.17: Mechanical limits bound the optimized energy conversion
M MM L
FV V
dk d
δ= + > (3.44)
max M MW F δ= (3.45)
V F
Q δ
(a) (b)
FM
δM
VL
1
2
3
4
2
3
1
4 VM

62
The slope of the path from 1-2 in the electrical domain is neither open circuit nor
constant voltage. The voltage is a direct function of mechanical force and displacement.
This indicates a sensor might be needed for its implementation.
3.3.2 Voltage controlled mode
In some cases, voltage is the limiting factor of the system, due to reasons such as
the rating of the semiconductor switch. Under these conditions we could therefore design
the active energy harvesting around its voltage boundary, which is called voltage-
controlled mode. The first case is when
Its conversion cycle is a truncated loop of Figure 3.17, shown in Figure 3.18.
2M M M ML
F FV
dk d dk d
δ δ + > > −
(3.46)
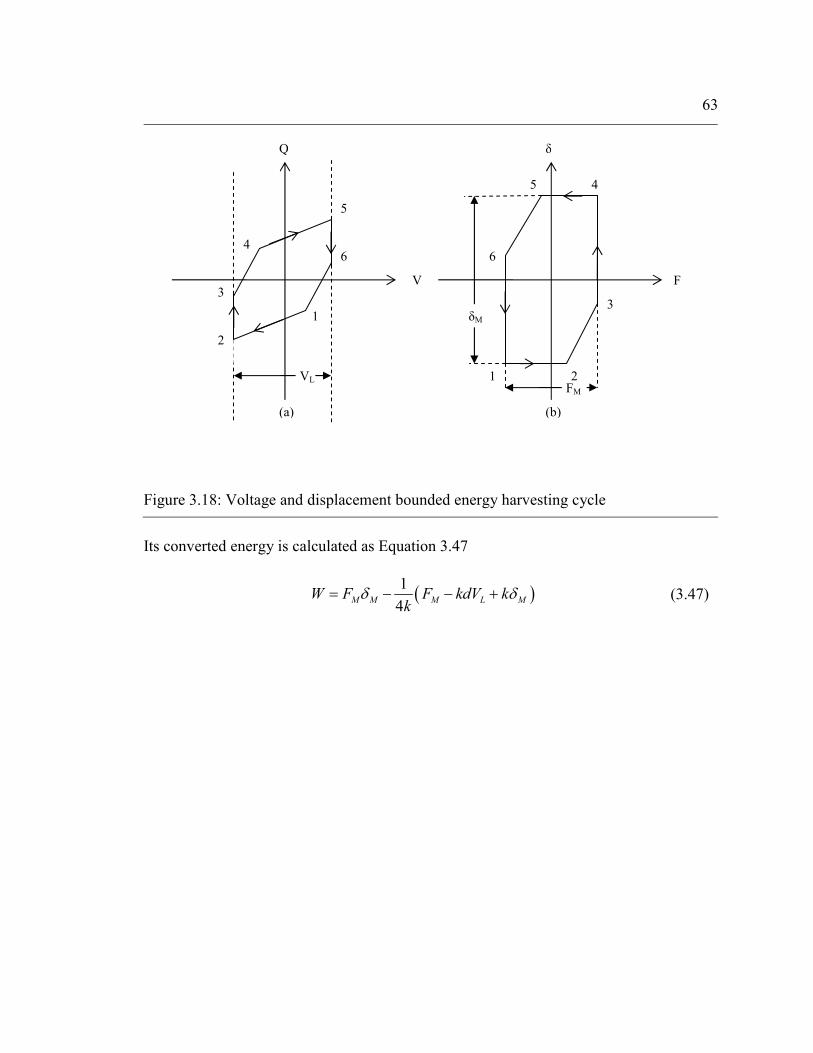
63
Its converted energy is calculated as Equation 3.47
Figure 3.18: Voltage and displacement bounded energy harvesting cycle
( )1
4M M M L MW F F kdV k
kδ δ= − − + (3.47)
V F
Q δ
(a) (b)
FM
δM
VL
1
4
2
3
1
4
2
3
5
6
5
6
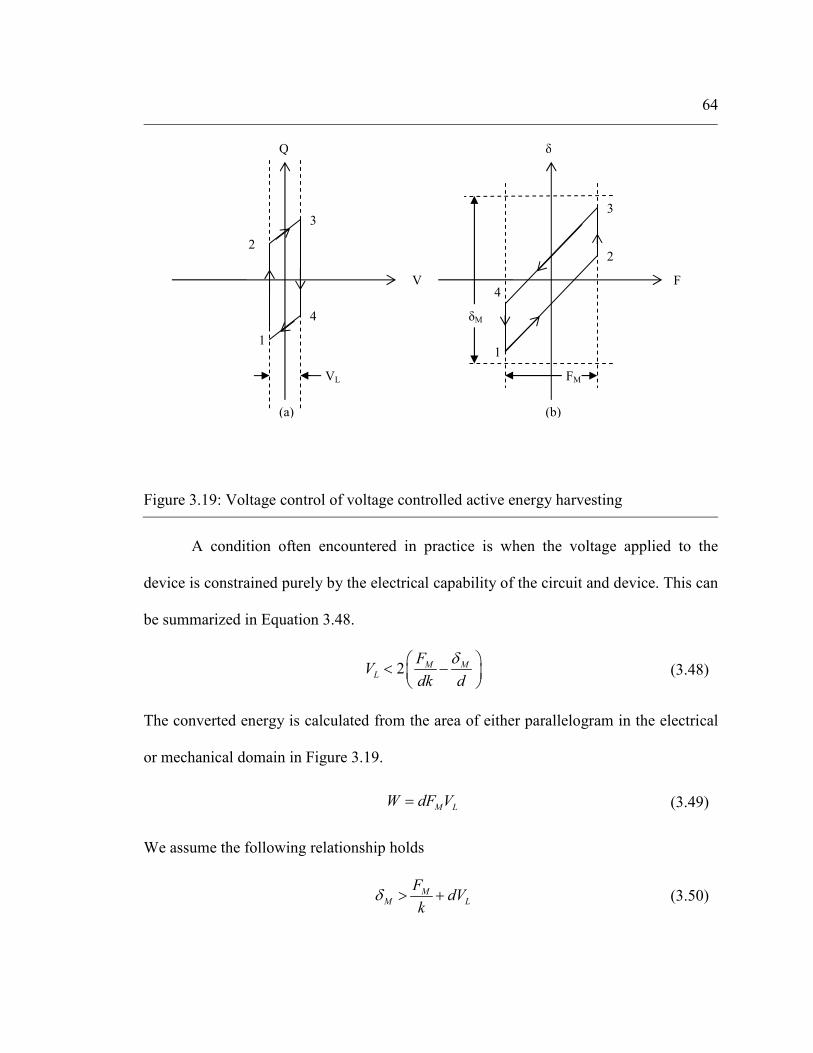
64
A condition often encountered in practice is when the voltage applied to the
device is constrained purely by the electrical capability of the circuit and device. This can
be summarized in Equation 3.48.
The converted energy is calculated from the area of either parallelogram in the electrical
or mechanical domain in Figure 3.19.
We assume the following relationship holds
Figure 3.19: Voltage control of voltage controlled active energy harvesting
2 M ML
FV
dk d
δ < −
(3.48)
M LW dF V= (3.49)
MM L
FdV
kδ > + (3.50)
V F
Q δ
(a) (b)
FM
δM
VL
1
2
3
4
2
3
1
4
65
This means we usually design the device to withstand the applied force and voltage at the
same time.
Active energy harvesting in a voltage-controlled mode could also be
accomplished with sinusoidal mechanical and electrical excitation. Suppose that the
mechanical force takes the sinusoidal form 0Re j tF F e ω = and the voltage applied on the
device is 0Re j tV V e ω = . The electrical current is then found by
The instantaneous power is therefore given by
where ( )0 0,F Vθ = ∠ . This power is optimized when
That gives the optimized power of
The converted energy is therefore less than the ideal voltage controlled mode by a factor
of 0.785. However, the sinusoidal voltage will not generate high frequency harmonics in
the mechanical system. The associated dielectric loss is also the smallest, which might be
preferable if the material has a relatively large loss tangent.
( )0 0I Q j dF CVω= = + (3.51)
( )* 0 0
1 1Re sin
2 2P V i d V Fω θ= × = (3.52)
0 0, , and 2 2
M MV FV F θ π= = = − (3.53)
4M MP f V F d
π= (3.54)
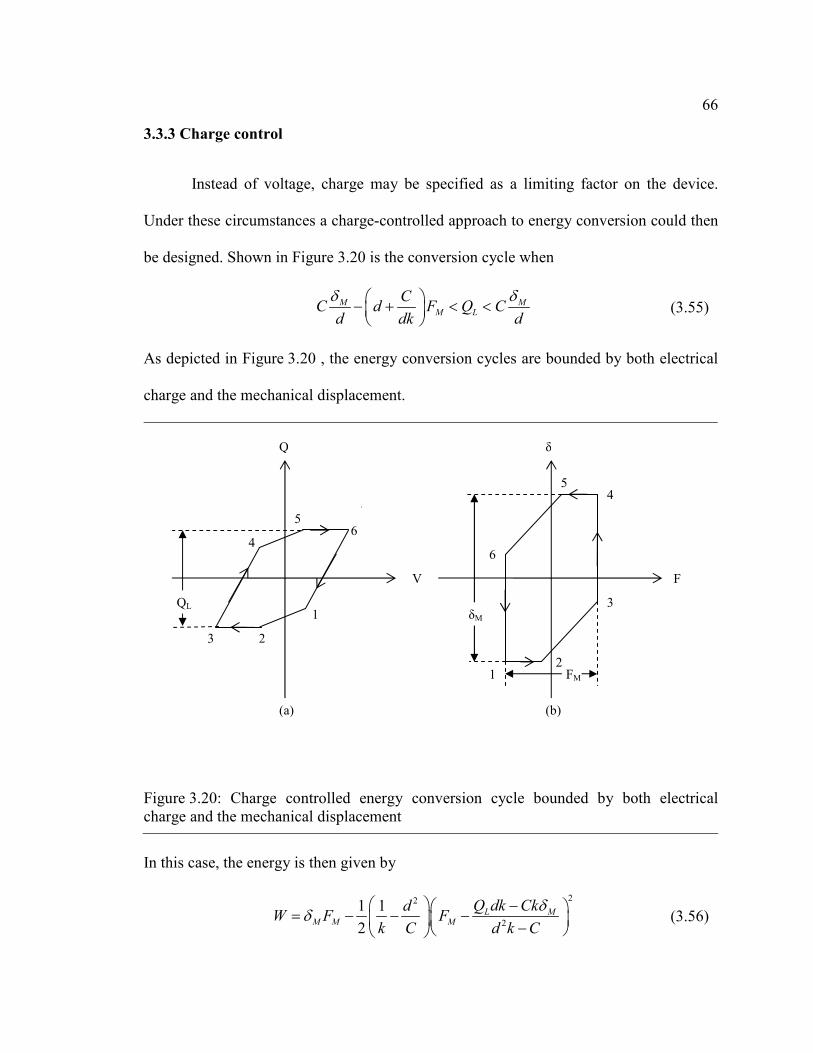
66
3.3.3 Charge control
Instead of voltage, charge may be specified as a limiting factor on the device.
Under these circumstances a charge-controlled approach to energy conversion could then
be designed. Shown in Figure 3.20 is the conversion cycle when
As depicted in Figure 3.20 , the energy conversion cycles are bounded by both electrical
charge and the mechanical displacement.
In this case, the energy is then given by
M MM L
CC d F Q Cd dk d
δ δ − + < <
(3.55)
Figure 3.20: Charge controlled energy conversion cycle bounded by both electrical
charge and the mechanical displacement
22
2
1 1
2
L MM M M
Q dk CkdW F F
k C d k C
δδ
− = − − − − (3.56)
V F
Q δ
(a) (b)
FM
δM
QL
1
2
2
3
1
4
4
3
5
5
6
6
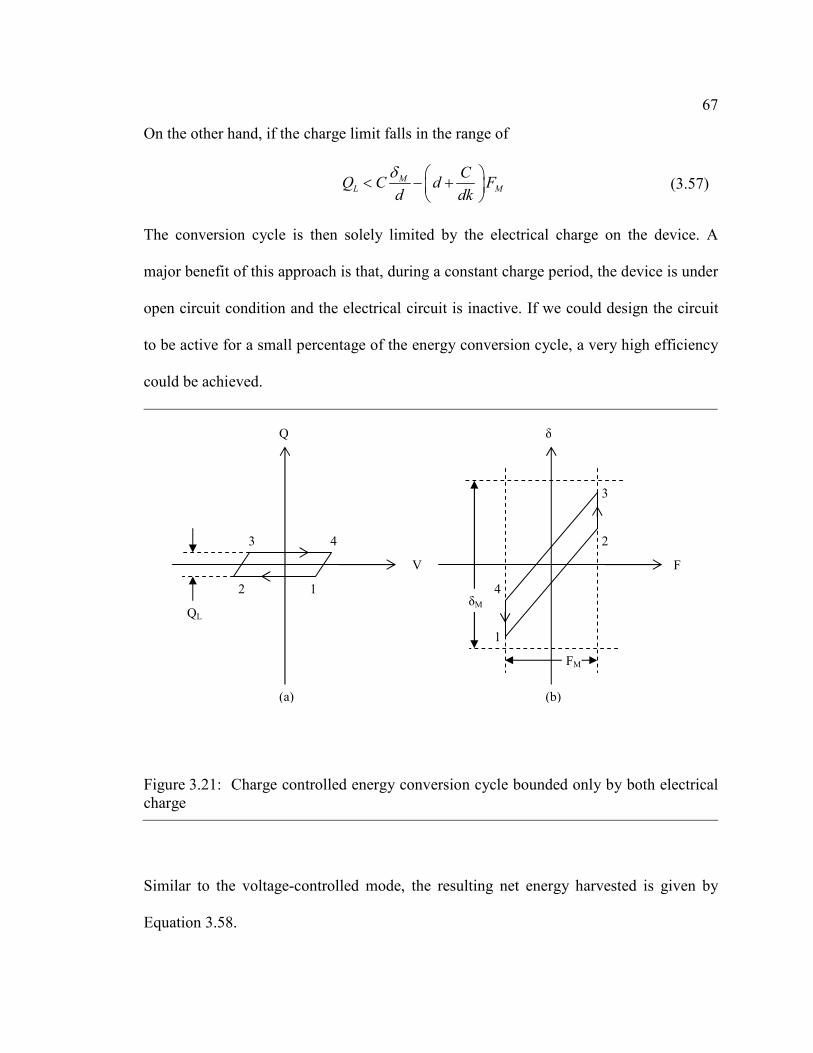
67
On the other hand, if the charge limit falls in the range of
The conversion cycle is then solely limited by the electrical charge on the device. A
major benefit of this approach is that, during a constant charge period, the device is under
open circuit condition and the electrical circuit is inactive. If we could design the circuit
to be active for a small percentage of the energy conversion cycle, a very high efficiency
could be achieved.
Similar to the voltage-controlled mode, the resulting net energy harvested is given by
Equation 3.58.
ML M
CQ C d F
d dk
δ < − +
(3.57)
Figure 3.21: Charge controlled energy conversion cycle bounded only by both electrical
charge
V F
Q δ
(a) (b)
FM
δM
QL
1 2
3 4 2
3
1
4

68
From the Equation 3.49 and 3.58, it seems that if the peak-to-peak mechanical force is
independent of electrical boundary condition, we could boost the energy conversion
arbitrarily high by increasing the voltage or charge swing on the device up to the
piezoelectric device limit by using active energy harvesting. That is true only if the power
electronic circuit has 100% efficiency. From a practical standpoint, however, the amount
of energy that can be harvested, and the optimal voltage/charge waveform for a given
mechanical excitation, depends heavily upon the efficiency of the power electronic
circuitry. This is largely due to the fact that, during a mechanical excitation period,
electrical power is flowing both into and out of the piezoelectric device.
3.3.4 efficiency of power electronics
Unfortunately, the amount of power that can be harvested is constrained by the
fact that all power electronic circuits are lossy: therefore, a certain portion of its
transferred energy dissipates in the form of heat. This characteristic is described by its
efficiency.
In order to facilitate analysis, we choose a voltage and charge boundary with the
following relations, so their energy conversion is the same.
M LdF QW
C= (3.58)
Output Energy Cycle Loss Cycle1
Input Energy Cycle Input Energy Cycleη = = − (3.59)
2L M ML
Q FV
C dk d
δ = < −
(3.60)
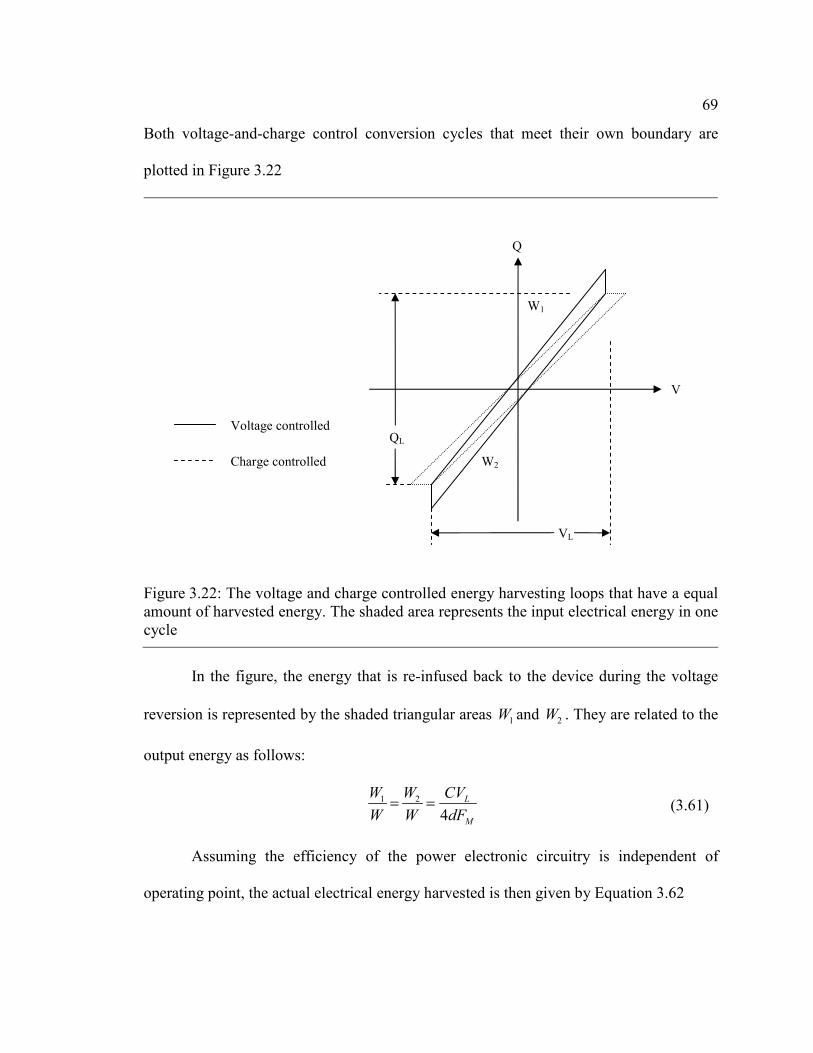
69
Both voltage-and-charge control conversion cycles that meet their own boundary are
plotted in Figure 3.22
In the figure, the energy that is re-infused back to the device during the voltage
reversion is represented by the shaded triangular areas 1W and 2W . They are related to the
output energy as follows:
Assuming the efficiency of the power electronic circuitry is independent of
operating point, the actual electrical energy harvested is then given by Equation 3.62
Figure 3.22: The voltage and charge controlled energy harvesting loops that have a equal
amount of harvested energy. The shaded area represents the input electrical energy in one
cycle
1 2
4
L
M
W W CV
W W dF= = (3.61)
VL
QL
V
Q
W2
Voltage controlled
Charge controlled
W1
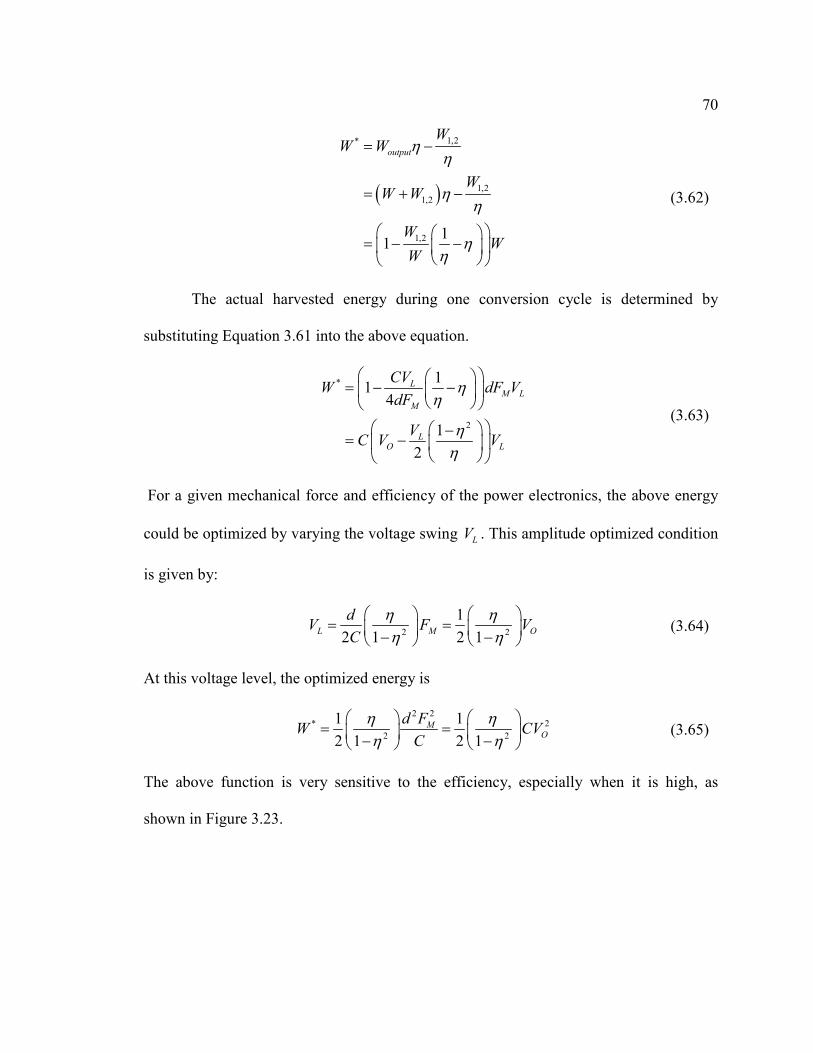
70
The actual harvested energy during one conversion cycle is determined by
substituting Equation 3.61 into the above equation.
For a given mechanical force and efficiency of the power electronics, the above energy
could be optimized by varying the voltage swing LV . This amplitude optimized condition
is given by:
At this voltage level, the optimized energy is
The above function is very sensitive to the efficiency, especially when it is high, as
shown in Figure 3.23.
( )
1,2*
1,2
1,2
1,2 11
output
WW W
WW W
WW
W
ηη
ηη
ηη
= −
= + −
= − −
(3.62)
*
2
11
4
1
2
LM L
M
LO L
CVW dF V
dF
VC V V
ηη
ηη
= − −
−= −
(3.63)
2 2
1
2 1 2 1L M O
dV F V
C
η ηη η
= = − −
(3.64)
2 2* 2
2 2
1 1
2 1 2 1
MO
d FW CV
C
η ηη η
= = − −
(3.65)
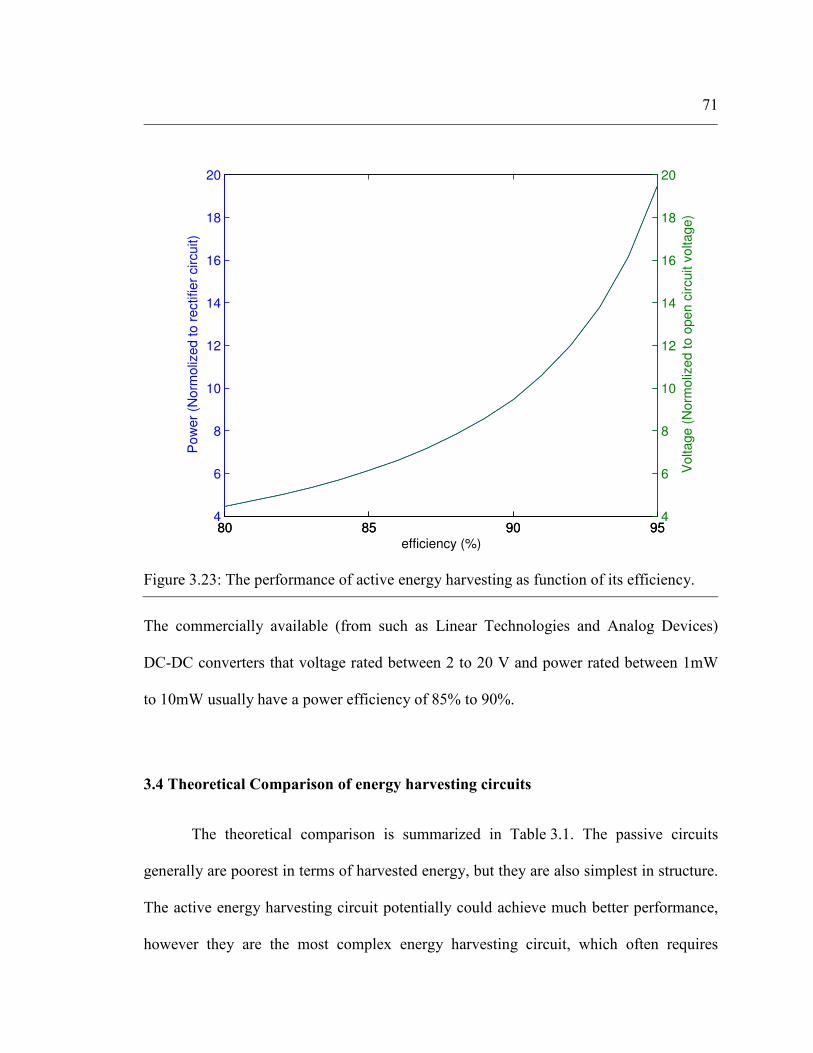
71
The commercially available (from such as Linear Technologies and Analog Devices)
DC-DC converters that voltage rated between 2 to 20 V and power rated between 1mW
to 10mW usually have a power efficiency of 85% to 90%.
3.4 Theoretical Comparison of energy harvesting circuits
The theoretical comparison is summarized in Table 3.1. The passive circuits
generally are poorest in terms of harvested energy, but they are also simplest in structure.
The active energy harvesting circuit potentially could achieve much better performance,
however they are the most complex energy harvesting circuit, which often requires
80 85 90 954
6
8
10
12
14
16
18
20
efficiency (%)
Po
wer
(No
rmoliz
ed t
o r
ectifier
circuit)
80 85 90 954
6
8
10
12
14
16
18
20
Vo
lta
ge
(N
orm
oliz
ed t
o o
pen c
ircuit v
oltage)
Figure 3.23: The performance of active energy harvesting as function of its efficiency.

72
sensors and certain feedback control. In this regard there is no simply best circuit for all
the applications. The significance of active energy harvesting might be for the application
that demands more power when improvement of the piezoelectric device is difficult and
the cost is not a big concern.
The presented analysis also indicates the semi-passive energy harvesting circuits
have superior energy harvesting performance. The limiting fact of semi-passive circuit is
the loss associated with the transient during a switching event.

73
Table 3.1
Passive circuit
Semi-passive Circuit
Active circuit
Rectifier
Charge
extraction
Serial SSHI
Parallel SSHI
Voltage controlled
Charge Controlled
Energy
()
22
OC
cCV
VV
−
1
()
21
22
21
Qe
CV
VV
OC
C
Qe
π π
−
+
−
−
−
2
21
Q
OC
CCV
Ve
V
π−
−−
2
1
2LO
L
VCV
Vη η
−−
2
1
2
LO
L
QV
QC
η η
−−
Optimized
condition
1 4C
OV
V=
N/A
1 4C
OV
V=
22
1
OC
Q
VV
e
π−
=
−
2
1L
OV
Vη η
=
−
2
1L
OQ
CV
η η
=
−
Optimized
energy
1 4
1
2 2
11
41
Q Q
e e
π π
− −
+
−
2
11
21
Qe
π−
−
2
1 21
η η
−
2
1 21
η η
−
Table 3.1: Comparison of energy harvesting circuit

There hardly is a single criterion for all the energy harvesting circuit, because of
the versatility of application. Each circuit has its performance and complexity. Every
energy harvesting application is different in its size, weight and cost constraint on energy
harvesting circuits.
Chapter 4
Active Energy Harvesting Experiment Using Piezoelectric
This chapter presents an experiment comparison between active energy harvesting
and the standard diode rectifier circuit. The experiment results are also compared with the
theoretical modeling developed in the previous chapter.
4.1 Mechanical excitation
A computer-programmable material testing system (MTS Systems Corporation’s
MTS810) was used in the following experiment to apply a compressive sinusoidal force
to the piezoelectric device. The mechanical setup is shown in Figure 3.2. A load cell at
the top measures the applied force and provides the feedback signal to the system
computer so that the applied force is well-regulated. The weight of the structure above
the sample device and below the load cell is added to the measured force. Alumina
ceramic plates were used as a sample holder for their high electrical insulation abilities.
Below the device a universal joint was inserted beneath the sample holder to achieve a
uniform pressure on the device. Polyurethane foam of 20cm in thickness is attached to
the machine’s base and used as a cushion and damper to reduce the high frequency
mechanical noise resulting from operation of the hydraulic system.
A static or minimum force of 15 lb was used throughout the experiment while
energy harvesting was performed for multiple data points under a sinusoidal dynamic
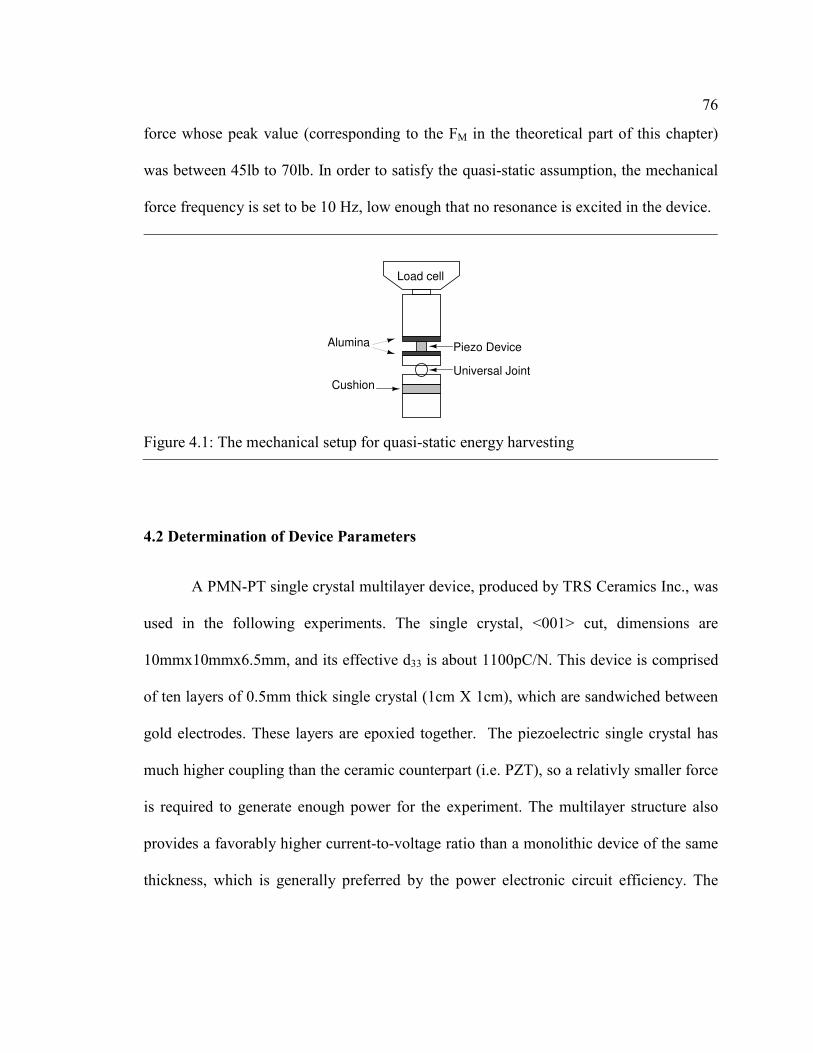
76
force whose peak value (corresponding to the FM in the theoretical part of this chapter)
was between 45lb to 70lb. In order to satisfy the quasi-static assumption, the mechanical
force frequency is set to be 10 Hz, low enough that no resonance is excited in the device.
4.2 Determination of Device Parameters
A PMN-PT single crystal multilayer device, produced by TRS Ceramics Inc., was
used in the following experiments. The single crystal, <001> cut, dimensions are
10mmx10mmx6.5mm, and its effective d33 is about 1100pC/N. This device is comprised
of ten layers of 0.5mm thick single crystal (1cm X 1cm), which are sandwiched between
gold electrodes. These layers are epoxied together. The piezoelectric single crystal has
much higher coupling than the ceramic counterpart (i.e. PZT), so a relativly smaller force
is required to generate enough power for the experiment. The multilayer structure also
provides a favorably higher current-to-voltage ratio than a monolithic device of the same
thickness, which is generally preferred by the power electronic circuit efficiency. The
Load cell
Alumina Piezo Device
Universal Joint
Cushion
Figure 4.1: The mechanical setup for quasi-static energy harvesting

77
material properties and geometric information of the single crystal are provided in
Table 4.1
The device’s parameters of Equation 3.3 and Equation 3.4 therefore can be theoretically
determined to be
Experiments were performed to directly measure these device parameters. The
capacitance of the device was measured under a free mechanical boundary condition
using a multimeter to be 68nF, close enough to the theoretical calculation. In order to
identify the piezoelectric coefficient, the open circuit peak-peak voltage is measured
under a different mechanical load. The open-circuit voltage was measured using a
oscilloscope whose input impedance is a 10MΩ and 12pf, which is 500 times larger than
the internal impedance of device (about 0.2 MΩ at 10 Hz excitation). The results are
shown in Figure 4.2.
Table 4.1: material properties and geometric information of the single crystal
Dielectric
constant
3ε
Piezoelectric
constant
33d
Elastic
compliance
11
Es
Thickness
t
Area
A
# of
layers
04000ε 1100 /pC N 12 280 10 /m N−× 0.5mm 2100mm 10
8 833
33
11
10 70nF, 10 1.1 10 / , 3.3 10 /10
S
E
A AC d d m V k N m
t s t
ε −= = = = × = = × (4.1)
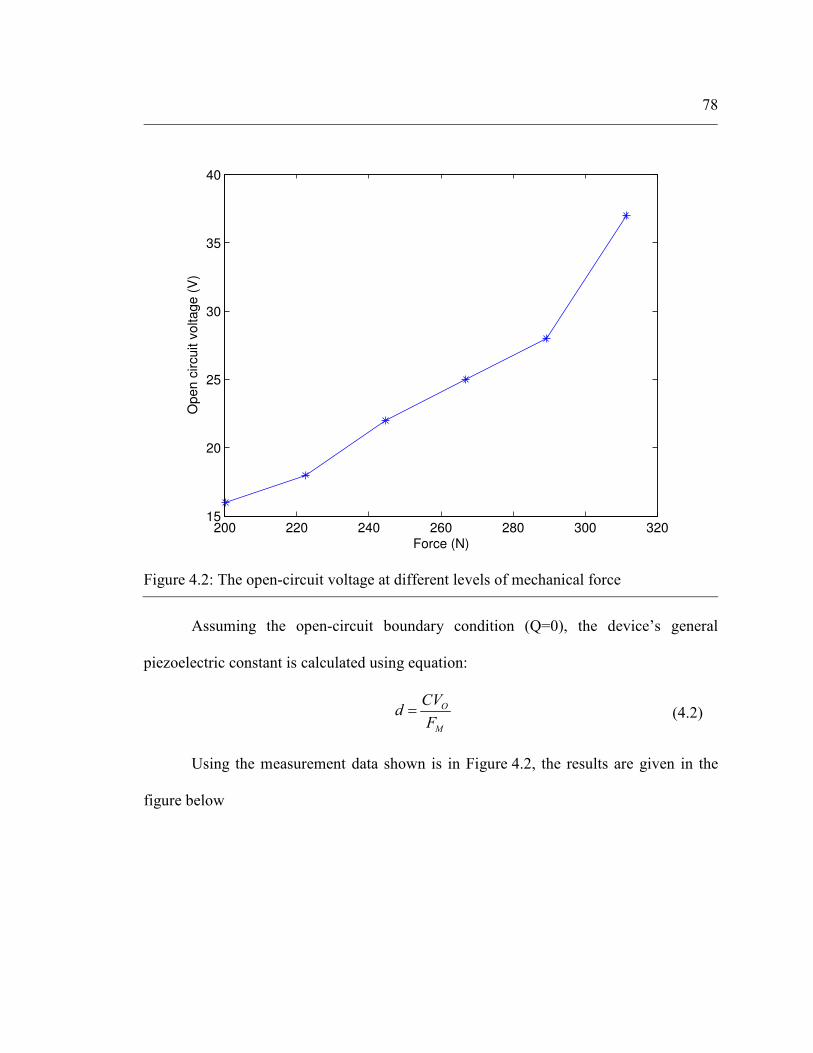
78
Assuming the open-circuit boundary condition (Q=0), the device’s general
piezoelectric constant is calculated using equation:
Using the measurement data shown is in Figure 4.2, the results are given in the
figure below
200 220 240 260 280 300 32015
20
25
30
35
40
Force (N)
Op
en
circuit v
oltage (
V)
Figure 4.2: The open-circuit voltage at different levels of mechanical force
O
M
CVd
F= (4.2)

79
The experiment measured general piezoelectric constant does not agree with the
theoreticaly calculated value of 911 10 C/N−× . The data also shows that the general
piezoelectric constant is a function of applied dynamic force. There are two perceived
reasons for this result, the sample is partially clamped in the lateral direction by the
sample holder during measurement, while in the theoretical calculation free mechanical
boundary conditions are assumed. When partially clamped, the stress distribution in the
sample is not uniform, and hence the piezoelectric contribution of each portion of the
sample therefore is different. Secondly, PMN-PT single crystal is a complex system; once
electrically poled, it has piezoelectric properties. However it also is intrinsically an
200 220 240 260 280 300 3205
5.5
6
6.5
7
7.5
8
8.5x 10
−9
Force (N)
d
Figure 4.3: The piezoelectric coefficient changes under different mechanical load
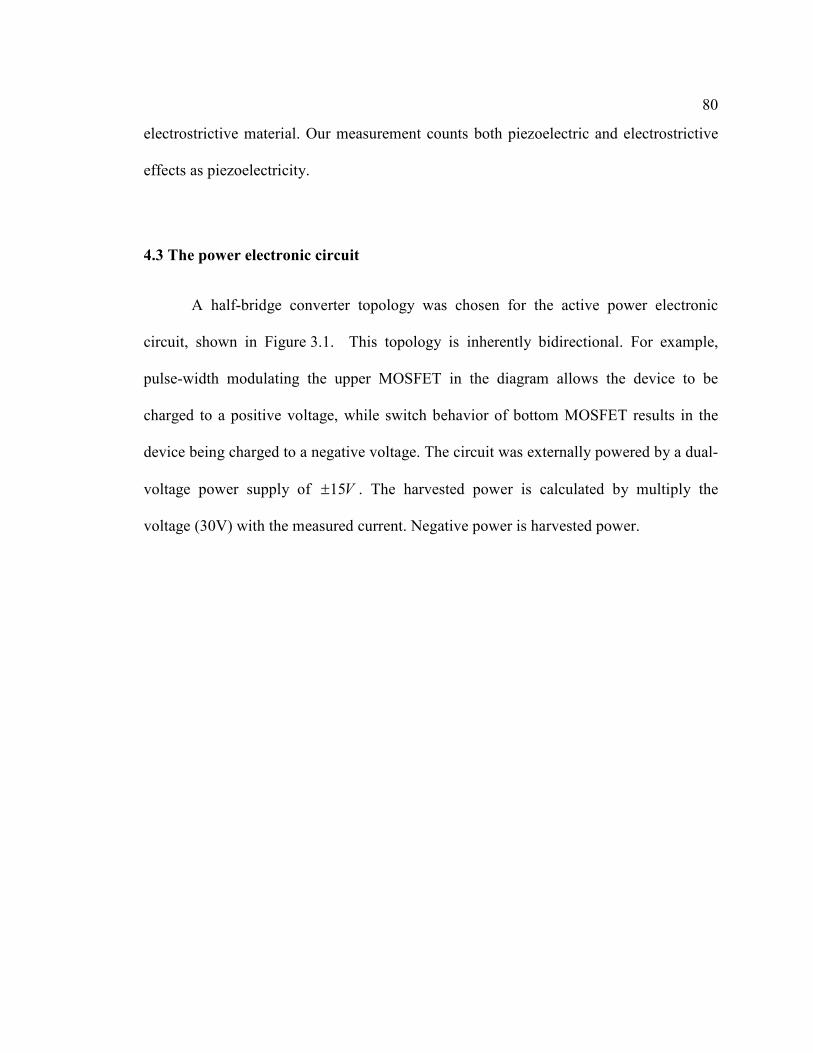
80
electrostrictive material. Our measurement counts both piezoelectric and electrostrictive
effects as piezoelectricity.
4.3 The power electronic circuit
A half-bridge converter topology was chosen for the active power electronic
circuit, shown in Figure 3.1. This topology is inherently bidirectional. For example,
pulse-width modulating the upper MOSFET in the diagram allows the device to be
charged to a positive voltage, while switch behavior of bottom MOSFET results in the
device being charged to a negative voltage. The circuit was externally powered by a dual-
voltage power supply of 15V± . The harvested power is calculated by multiply the
voltage (30V) with the measured current. Negative power is harvested power.
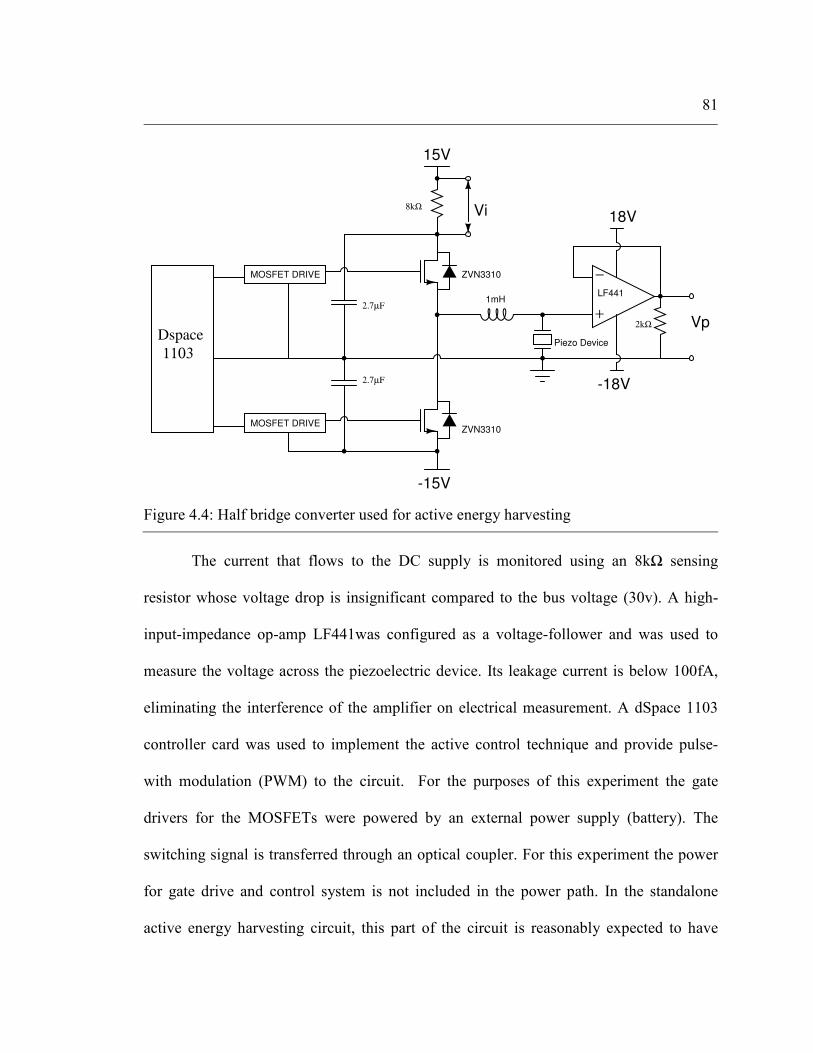
81
The current that flows to the DC supply is monitored using an 8kΩ sensing
resistor whose voltage drop is insignificant compared to the bus voltage (30v). A high-
input-impedance op-amp LF441was configured as a voltage-follower and was used to
measure the voltage across the piezoelectric device. Its leakage current is below 100fA,
eliminating the interference of the amplifier on electrical measurement. A dSpace 1103
controller card was used to implement the active control technique and provide pulse-
with modulation (PWM) to the circuit. For the purposes of this experiment the gate
drivers for the MOSFETs were powered by an external power supply (battery). The
switching signal is transferred through an optical coupler. For this experiment the power
for gate drive and control system is not included in the power path. In the standalone
active energy harvesting circuit, this part of the circuit is reasonably expected to have
−
+
15V
-15V
18V
-18V
MOSFET DRIVE
MOSFET DRIVE
ZVN3310
ZVN3310
1mHLF441
Piezo Device
2.7µF
2.7µF
2kΩ
Dspace
1103
8kΩ Vi
Vp
Figure 4.4: Half bridge converter used for active energy harvesting

82
ultra-low power consumption. If an Application Specific Integrated Circuit (ASIC) is
used to implement the control of the active energy harvesting, the power consumption is
expected to be less than one milliwatt.
In order to further reduce switching losses, the controller modulates the top and
bottom MOSFET independently, depending upon whether the voltage across the device is
being increased or decreased. A switching frequency of 2 kHz and constant duty cycle
of 0.8% was used to shift the voltage across the device at the minimum and maximum
values of the measured force.
The circuit efficiency was measured by charging and discharging a 50nF ceramic
capacitor. The discharging efficiency is measured at 92%, and charging is measured at
95% at 1mW. The quiescent power consumption is measured to be below 10 uW without
gate drive.
As a comparison, a half-bridge rectifier circuit using 1N5450 diodes and a 10uF
film capacitor was built. The output of the circuit was connected to an HP voltage power
supply as a load. A current sensing resistor of 21.5 kΩ is used for measuring the current
flow into the power supply. The voltage across the sensing resistor and capacitor voltage
were monitored by two 124 -digit multimeters. The harvested power is therefore the
product of the current and the supply voltage. By varying the voltage across the capacitor
using the power supply, we determine the optimized voltage for each mechanical load.
This optimized power is used in the comparison of energy harvesting techniques.
83
4.4 Controller
The Simulink control code for the active energy harvesting circuit is shown in
Figure 4.5. Mechanical force was measured by a load cell, and its signal was conditioned
through a testing system and fed into an A/D channel of the DS1103. The load cell was
recently calibrated to the equipment’s specification, and its sensitivity is 600 lb/V. The
force signal, however, was fairly noisy. If the signal is directly used by the controller, the
applied voltage is poorly synchronized with the mechanical force. Adding a digital or
analog filter might alleviate the signal to noise ratio. Unfortunately, filters usually
introduce undesirable phase shift. To solve this problem a Phase-Locked Loop (PLL) is
implanted in the Simulink code, shown in left bottom corner. It generates an ideal
sinusoidal signal in phase with the applied force, and it is then used for the controller.
The phase requirement of active energy harvesting described in previous chapters is to
charge or discharge at the applied peak force. The threshold level of the ‘switch’ block in
the Simulink code controls the duration of charging/discharging. The duty cycle of the
PWM signal controls the rate of charging/discharging the device. These two parameters
were manually chosen until the harvested energy was optimized for a 75 lb mechanical
load, and were kept constant at these values for the rest of the experiments.
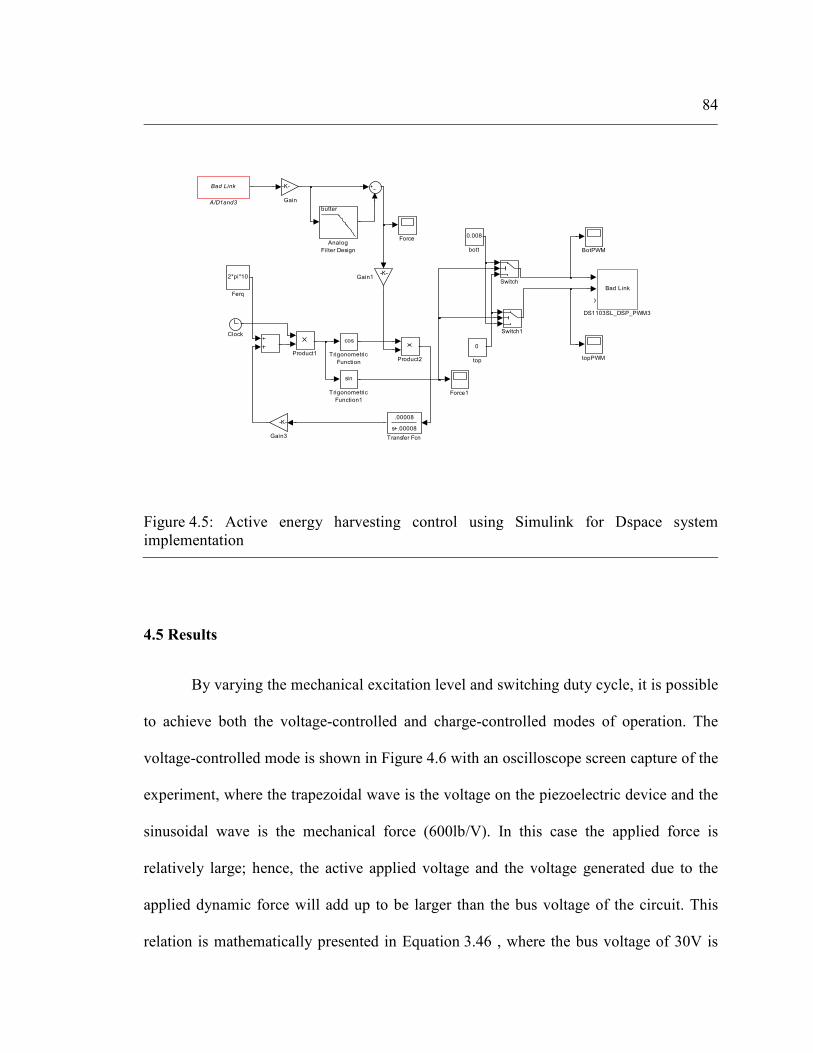
84
4.5 Results
By varying the mechanical excitation level and switching duty cycle, it is possible
to achieve both the voltage-controlled and charge-controlled modes of operation. The
voltage-controlled mode is shown in Figure 4.6 with an oscilloscope screen capture of the
experiment, where the trapezoidal wave is the voltage on the piezoelectric device and the
sinusoidal wave is the mechanical force (600lb/V). In this case the applied force is
relatively large; hence, the active applied voltage and the voltage generated due to the
applied dynamic force will add up to be larger than the bus voltage of the circuit. This
relation is mathematically presented in Equation 3.46 , where the bus voltage of 30V is
topPWM
0
top
0.008
bott
sin
Trigonometric
Function1
cos
Trigonometric
Function
.00008
s+.00008
Transfer Fcn
Switch1
Switch
Product2Product1
-K-
Gain3
-K-Gain1
-K-
Gain
Force1
Force
2*pi*10
FerqBad Link
DS1103SL_DSP_PWM3
Clock
BotPWM
butter
Analog
Filter Design
Bad Link
A/D1and3
Figure 4.5: Active energy harvesting control using Simulink for Dspace system
implementation
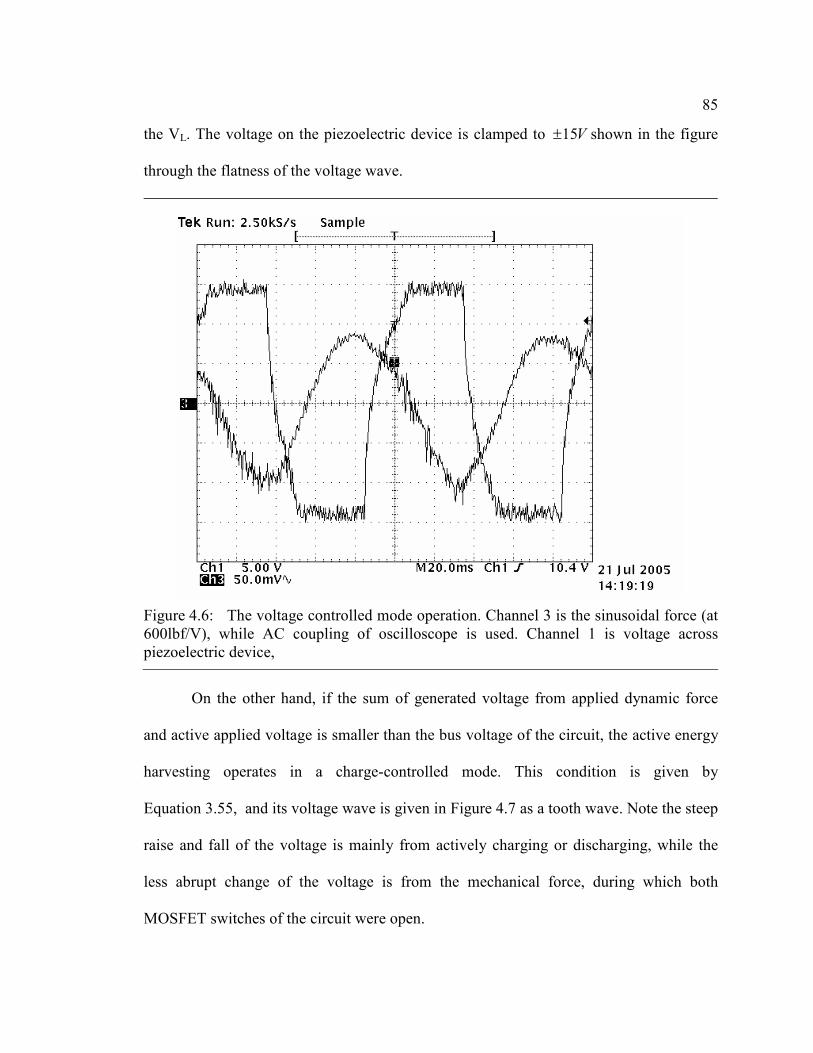
85
the VL. The voltage on the piezoelectric device is clamped to 15V± shown in the figure
through the flatness of the voltage wave.
On the other hand, if the sum of generated voltage from applied dynamic force
and active applied voltage is smaller than the bus voltage of the circuit, the active energy
harvesting operates in a charge-controlled mode. This condition is given by
Equation 3.55, and its voltage wave is given in Figure 4.7 as a tooth wave. Note the steep
raise and fall of the voltage is mainly from actively charging or discharging, while the
less abrupt change of the voltage is from the mechanical force, during which both
MOSFET switches of the circuit were open.
Figure 4.6: The voltage controlled mode operation. Channel 3 is the sinusoidal force (at
600lbf/V), while AC coupling of oscilloscope is used. Channel 1 is voltage across
piezoelectric device,
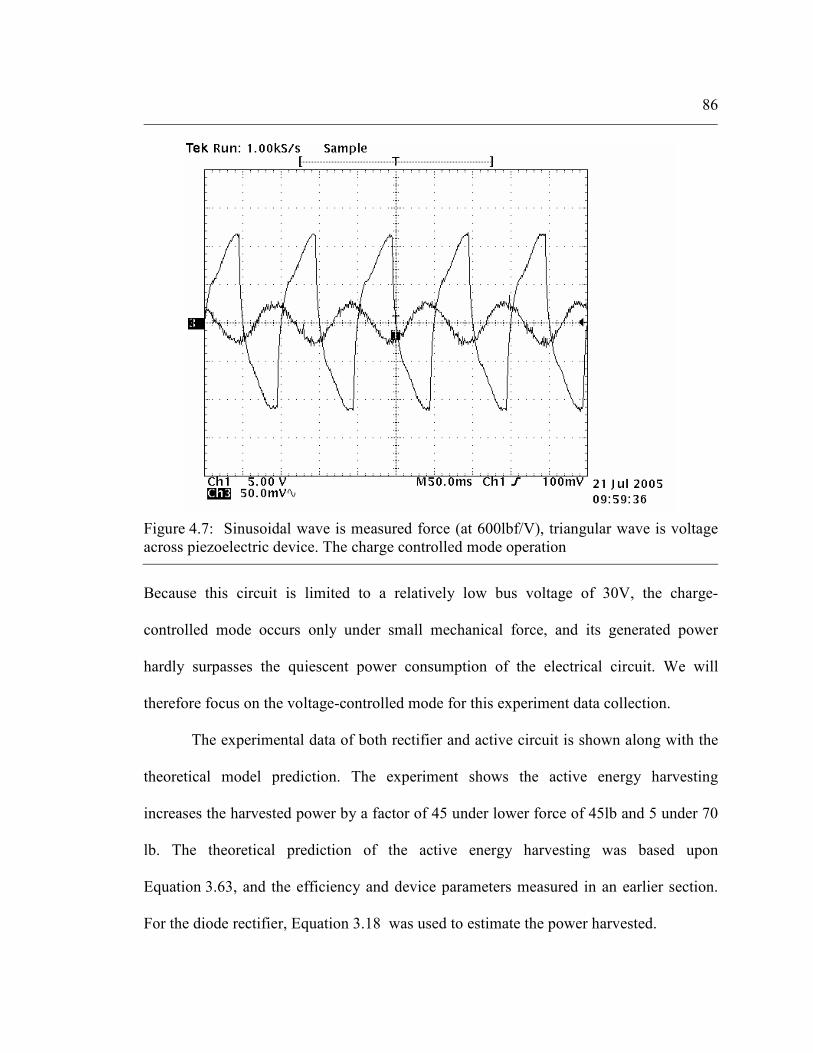
86
Because this circuit is limited to a relatively low bus voltage of 30V, the charge-
controlled mode occurs only under small mechanical force, and its generated power
hardly surpasses the quiescent power consumption of the electrical circuit. We will
therefore focus on the voltage-controlled mode for this experiment data collection.
The experimental data of both rectifier and active circuit is shown along with the
theoretical model prediction. The experiment shows the active energy harvesting
increases the harvested power by a factor of 45 under lower force of 45lb and 5 under 70
lb. The theoretical prediction of the active energy harvesting was based upon
Equation 3.63, and the efficiency and device parameters measured in an earlier section.
For the diode rectifier, Equation 3.18 was used to estimate the power harvested.
Figure 4.7: Sinusoidal wave is measured force (at 600lbf/V), triangular wave is voltage
across piezoelectric device. The charge controlled mode operation
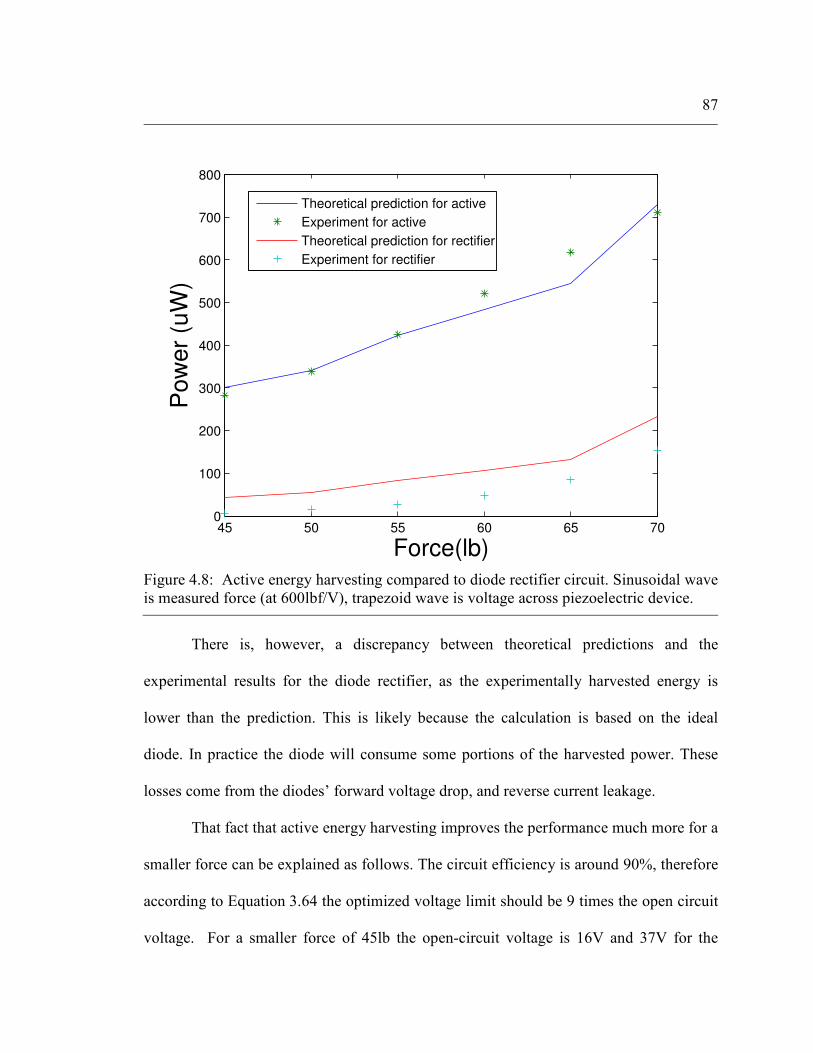
87
There is, however, a discrepancy between theoretical predictions and the
experimental results for the diode rectifier, as the experimentally harvested energy is
lower than the prediction. This is likely because the calculation is based on the ideal
diode. In practice the diode will consume some portions of the harvested power. These
losses come from the diodes’ forward voltage drop, and reverse current leakage.
That fact that active energy harvesting improves the performance much more for a
smaller force can be explained as follows. The circuit efficiency is around 90%, therefore
according to Equation 3.64 the optimized voltage limit should be 9 times the open circuit
voltage. For a smaller force of 45lb the open-circuit voltage is 16V and 37V for the
45 50 55 60 65 700
100
200
300
400
500
600
700
800
Force(lb)
Po
wer
(uW
)Theoretical prediction for active
Experiment for active
Theoretical prediction for rectifier
Experiment for rectifier
Figure 4.8: Active energy harvesting compared to diode rectifier circuit. Sinusoidal wave
is measured force (at 600lbf/V), trapezoid wave is voltage across piezoelectric device.
88
higher force of 75lb. So for smaller force, the limiting voltage is closer to the optimized
condition, therefore the improvement ratio is higher.
4.6 Comparison and conclusion
The diode rectifier circuit is the lower in energy, even under optimized conditions.
However, the diode rectifier is the simplest circuit of all and it does not need a sensor.
For certain applications the optimized working condition is not necessary, or the
piezoelectric device and electrical load is so designed that in the power equilibrium it is
close to the optimized condition. An ultra-low cost energy harvesting circuit only made
of a few diodes and a capacitor could be realized at a cost of under a few dollars.
Active energy harvesting circuit by far is the most complex circuit, but it has
superior performance, potentially better than even the SSHI circuits in harvested power.
Furthermore, because the switching mode circuit is used as power stage, it uses high
switching frequency, which could dramatically reduce the required inductor size and
weight compared to that of SSHI circuits.
Active energy harvesting is also still in development, for fully standalone
operation there are engineering challengers. The operation of those systems still needs to
be thoroughly understood.

Chapter 5
Quasi-static Electrostrictive Energy Harvesting Theory
Electrostriction is generally defined as a quadratic coupling between strain/stress
and electrical field/polarization [57]. The dipoles inside the material line up in the field
direction under a DC bias field. Under an AC electrical field and mechanical strain, the
phase transition occurs, which results in a change of electrical dipole moment. An
electrical charge or current associated with this change is then generated across the
electrodes, converting the mechanical energy to electrical energy. Because of the phase
transition, the energy harvesting mechanism of the electrostrictive material is
fundamentally different from that of the electro-elastomers [58][59], which uses
electrostatic force for its energy conversion. Because of their quadratic nature, these
materials are inert without electrical excitation. For example, an electrostrictive device
does not generate any charge during a process of straining if the voltage across its
terminals is zero, which differs from a piezoelectric device. In this sense, active energy
harvesting is a mandatory approach if these devices are to be used as an electrical
generator. This chapter is a study of active energy harvesting using this non-linear
material. We discuss the mechanical and electrical boundary conditions for maximizing
the harvested energy density and mechanical-to-electrical coupling of electrostrictive
materials. Mathematical models for different energy harvesting approaches were
developed under quasistatic assumptions. Harvested energy densities are then determined
for representative electrostrictive material properties using these models. Experimentally
90
using sinusoidal voltage active energy harvesting, a very high energy harvesting density
for this material was achieved.
5.1 Electrostrictive materials and devices
The recent development of electrostrictive polymers has generated new
opportunities for high-strain actuators. At the current time, the investigation of using
electrostrictive polymer for energy harvesting, or mechanical to electrical energy
conversion, is beginning to show its potential for this application. Electrostriction can be
described as a quadratic coupling between strain and electrical field using Equations 5.1
and 5.2, where the strain ijS and the electric flux density mD are expressed as
independent variables of the electric field intensity ,m nE and the stress ijT ,
where E
ijkls is the elastic compliance under constant field, mnijM is known as the electric-
field-related electrostriction coefficient, and mnε is the linear dielectric permittivity. One
observation of the equations reveals that mechanical energy couples with electrical
charge only when the electric field is non-zero. Otherwise, Equation 5.2 degrades into a
normal dielectric equation.
An isotropic electrostrictive polymer film contracts along the thickness direction
and expands along the film direction when an electric field is applied across the
,E
ij ijkl ij mnij n mS s T M E E= + (5.1)
2 ,m mn n mnij n ijD E M E Tε= + (5.2)
91
thickness. Assuming that the only nonzero stress is that applied along the length of the
film, the constitutive relation then could be simplified as:
where:
Because our analysis is based on these simplified relations, we will no longer
specify the orientation of parameters and field variables in the following. We also will
neglect the effects of dimensional changes of the material on the electrical boundary
conditions. For example, a constant voltage applied to an electrostrictive device will be
assumed to be equivalent to the constant electric field in the material. As the strains in
these materials tend to be less than 5%, deformation contribution therefore is small. This
assumption is reasonable and dramatically simplifies the analysis.
5.2 Energy Harvesting Cycle and Boundary Conditions
The mechanical-to-electrical energy harvesting in electrostrictive materials is
illustrated by example in the mechanical stress/strain and electric field density/flux
density plots shown in Figure 5.1 . Initially, the material shown in part (a) of the figure
has no applied stress, then stress is applied and the state travels along path A. The applied
stress then is reduced. If the electrical boundary conditions have changed at the apex of
2S sT ME= + (5.3)
2D E METε= + (5.4)
3 3 1
1 11 31
33
, , ,
, , ,E
E E D D S S
T T s s M M
ε ε
= = =
= = =
=
(5.5)

92
path A, the contraction path will not follow path A but path B. Both in the mechanical
and electrical planes, the material state traverses a closed loop. In the mechanical plane
(a) the rotation is counterclockwise, and in the electrical plane (b) in the figure the
rotation is clockwise. This rotation designates that the net energy flow is from the
mechanical terminals to the electrical. The areas enclosed in the loops of the mechanical
and electrical planes are both equal to the converted energy density in units of 3J/m .
For quasistatic mechanical-to-electrical energy harvesting, one can apply various
electrical boundary conditions during the stress variation cycle to break the elastic
symmetry of stretching and contraction of the electrostrictive polymer, and thereby
harvest energy. In order to maximize the energy harvesting density, the boundary
conditions have to be designed so that the area enclosed in the loop is as large as possible
Figure 5.1: Type Caption Here
S
T E
D
A
B
B
A
(a) (b)

93
without exceeding the limitations of the polymer material (e.g., maximum stress,
breakdown field). One approach is to adjust the mechanical boundary conditions through
the design of a mechanical transformer—such as a cantilever, bimorph structure, or
hydraulic coupler—to modify the mechanical stresses applied to the material in order to
create a better match with the material’s elastic properties. Another approach is to control
the electrical boundary conditions in certain relations with the mechanical force. Ideally
the energy harvesting cycle consists of the largest possible loop, bounded only by the
limitations of the material. However, actual implementation of the optimal energy
harvesting cycle in an energy harvesting circuit may be difficult to achieve. In the
following, we will analyze electrical boundary conditions that can be applied to the
device fairly easily with power electronic circuitry. The concept of the coupling factor, as
defined in the IEEE standard [38] for piezoelectric materials, is useful as a figure of merit
for energy harvesting, and is given below
where area 1 2W W+ is the input mechanical energy density, and area W1 is the output
electrical energy density. The coupling factor often is associated with a specific set of
electrical boundary conditions, as will be discussed in the following. In this work we
shall use the general definition above and consider several different cases of electrical
boundary conditions. The mechanical excitation in each case will be the same: the
application of stress is from zero to a maximum value maxT , which then returns to zero.
2 1
1 2
k ,W
W W=
+ (5.6)

94
5.2.1 Coupling Factor Determined from Linearized Model of Electrostriction
For many transducer and actuator applications, electrostrictive materials often are
exposed to a large direct current (DC) bias field and a smaller alternating current (AC)
perturbation. Under these conditions, local linearization, based on Taylor expansion, is
often used to simplify the quadratic nature of electrostriction, which then takes the same
form as the piezoelectric equations. Therefore, an equivalent piezoelectric constant as a
function of the bias field can be determined for the electrostrictive material. The
linearization of the constitutive relation defined in Equation 5.3 and Equation 5.4 about
its bias values 0E and 0T can be written as:
Using 0 0 0 0, , and S D T E as the equilibrium points and the deviations from those
points as the (linearized) variables, the equivalent piezoelectric constant is then given by:
and the equivalent dielectric constant is given by:
Equation 5.8 indicates the equivalent piezoelectric constant is nontrivial only
when a certain bias field 0E is applied. The coupling coefficient, or the ratio of electrical
energy output to mechanical energy input, for the linearized system then can be
calculated using the standard quasistatic coupling factor for piezoelectric materials as:
( ) ( )( ) ( ) ( )
0 0 0 0
0 0 0 0 0
2 ,
2 2
S S s T T ME E E
D D MT E E ME T Tε
≈ + − + −
≈ + + − + − (5.7)
02d ME′ = (5.8)
02MTε ε′ = + (5.9)
95
However, in order to maximize the energy conversion, large variations in applied
stress and electric field are required. Hence, the linearized model may provide inaccurate
or misleading conclusions as to how to achieve the highest harvesting energy density and
harvesting efficiency. In energy harvesting applications the quadratic model, therefore,
will provide a more accurate understanding; hence, the following analysis will be based
upon the electrostrictive equations provided in Equations 5.3 and 5.4
5.2.2 Energy Harvesting Cycle #1: Constant Field and Open-Circuit Electrical
Boundary Conditions
The standard coupling factor expressed above for piezoelectric materials is based
upon electrical boundary conditions in which the device is electrically short circuited as
stress is applied, and open circuited as the stress is removed. In the case of electrostrictive
materials, such boundary conditions would not result in energy harvesting. However, a
similar excitation that would generate electrical energy would consist of a constant,
nonzero electric field applied to the device as stress is applied; then open-circuit
conditions as the stress is removed. This electromechanical cycle is shown in Figure 5.2 .
The material is stress free at state 1 of the cycle, and an electric field 0E is applied and
kept constant as the stress is increased to maxT , ending in state2. The electrostrictive
device is then open circuited when the stress is removed, ending in state 3. From state 3
the electric field 0E is re-established in the material, returning to the original state 1. The
( )
2 222 0
0
4k
2
M Ed
s s MTε ε′
= =′ +
(5.10)
96
total mechanical input energy density available for the energy harvesting for such a cycle
can be shown to be 2
1 2 max
1
2W W sT+ = , and the energy 1W can be calculated as follows.
As the material is in open-circuit condition from state 2 to 3, the electric flux
density is constant and is given by
the electric field intensity as the stress is removed, therefore, is given by:
this field intensity reaches its peak value pE when the applied stress becomes zero, or:
Figure 5.2: Energy harvesting cycle under constant field 1-2 and open circuit 2-3 electrical
boundary conditions.
0 0 max2D E ME Tε= + (5.11)
max0
2
2
MTE E
MT
εε+
=+
(5.12)
(a) (b)
S
T E
D
1
2
3 1
2 3
W1
W2
E0 TMAX
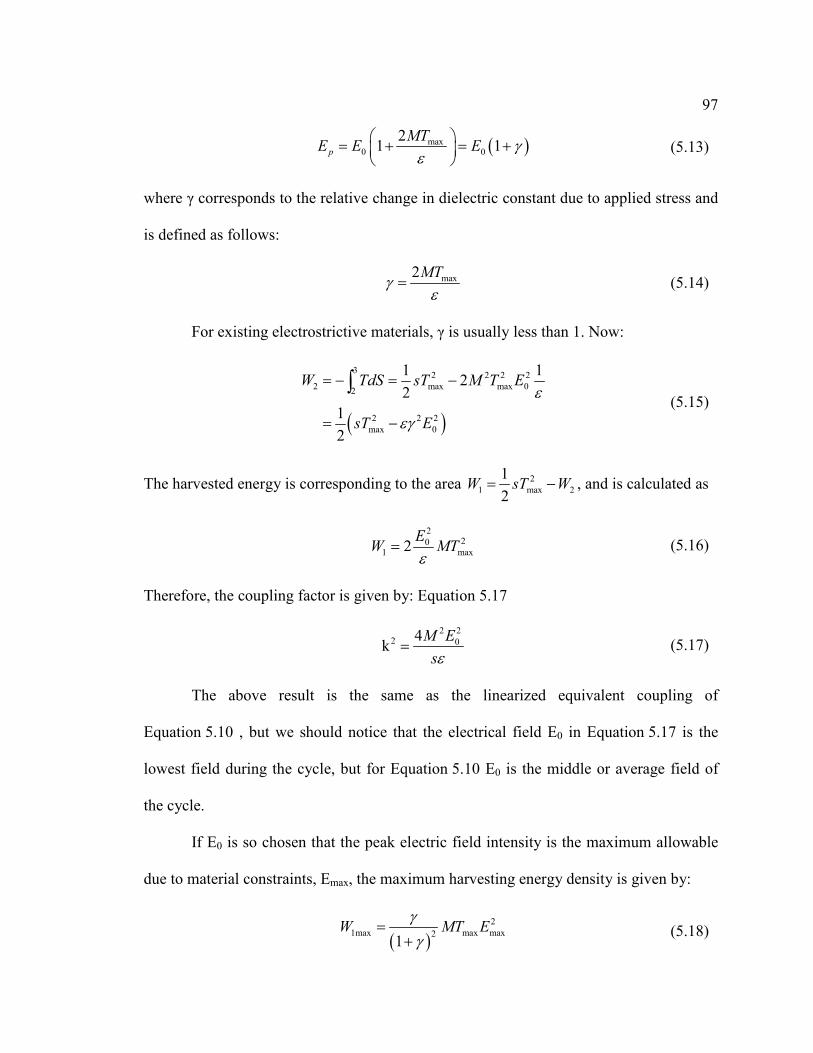
97
where γ corresponds to the relative change in dielectric constant due to applied stress and
is defined as follows:
For existing electrostrictive materials, γ is usually less than 1. Now:
The harvested energy is corresponding to the area 2
1 max 2
1
2W sT W= − , and is calculated as
Therefore, the coupling factor is given by: Equation 5.17
The above result is the same as the linearized equivalent coupling of
Equation 5.10 , but we should notice that the electrical field E0 in Equation 5.17 is the
lowest field during the cycle, but for Equation 5.10 E0 is the middle or average field of
the cycle.
If E0 is so chosen that the peak electric field intensity is the maximum allowable
due to material constraints, Emax, the maximum harvesting energy density is given by:
( )max0 0
21 1p
MTE E E γ
ε
= + = +
(5.13)
max2MTγ
ε= (5.14)
( )
32 2 2 2
2 max max 02
2 2 2
max 0
1 12
2
1
2
W TdS sT M T E
sT E
ε
εγ
= − = −
= −
∫ (5.15)
220
1 max2E
W MTε
= (5.16)
2 22 04
kM E
sε= (5.17)
( )2
1max max max21
W MT Eγ
γ=
+ (5.18)
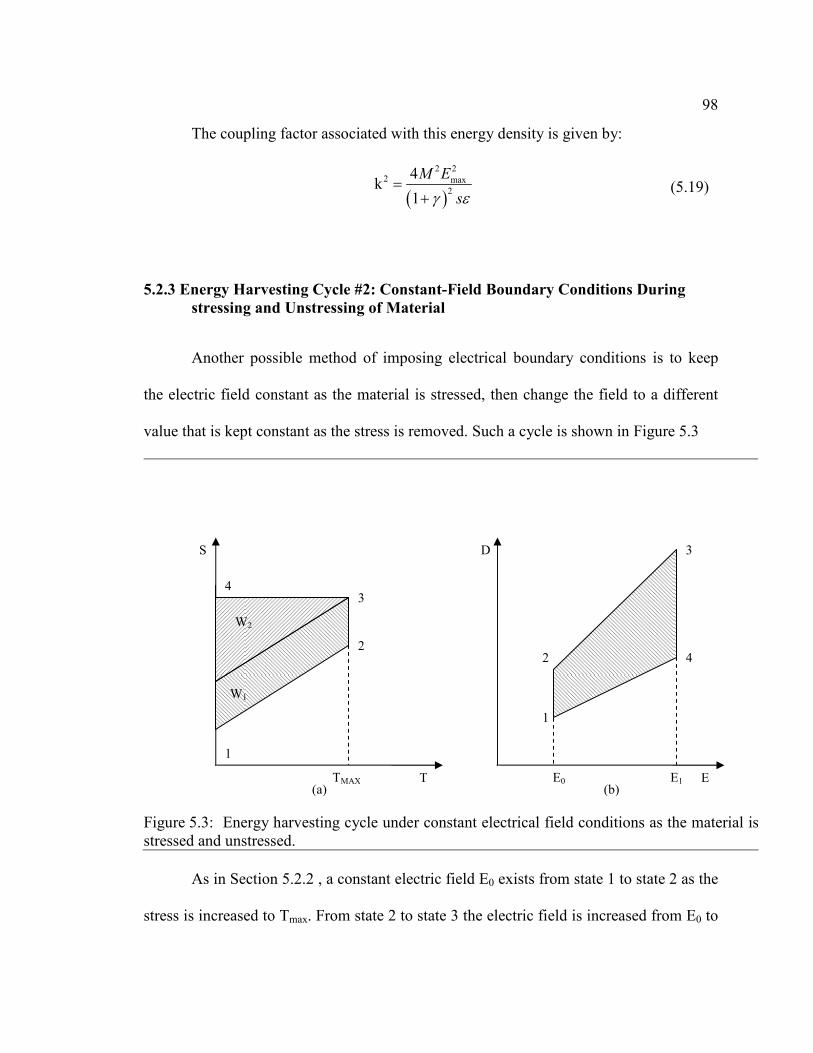
98
The coupling factor associated with this energy density is given by:
5.2.3 Energy Harvesting Cycle #2: Constant-Field Boundary Conditions During
stressing and Unstressing of Material
Another possible method of imposing electrical boundary conditions is to keep
the electric field constant as the material is stressed, then change the field to a different
value that is kept constant as the stress is removed. Such a cycle is shown in Figure 5.3
As in Section 5.2.2 , a constant electric field E0 exists from state 1 to state 2 as the
stress is increased to Tmax. From state 2 to state 3 the electric field is increased from E0 to
( )
2 22 max
2
4k
1
M E
sγ ε=
+ (5.19)
Figure 5.3: Energy harvesting cycle under constant electrical field conditions as the material is
stressed and unstressed.
(a) (b)
S
T E
D
1
2
3
1
2
3
E0 TMAX
W2
W1
4
4
E1

99
E1, then kept constant until the stress is reduced from Tmax to 0 from state 3 to state 4. At
zero stress the electric field is reduced to E0, returning to state 1. In the dielectric-field
plot, paths 1–4 and 2–3 are not parallel, which is due to the stress dependence of the
dielectric constant. The converted energy can be shown to be:
Since the input energy density 2
2 max
1
2W sT= , the coupling factor is given by:
The maximum energy harvesting density and coupling occurs when E0 is set to
be zero and E1 is set to Emax. Then,
and its coupling factor is
( )2 2
1 max 1 0W T M E E= − (5.20)
( )( )
2 2
1 02
2 2
max 1 0
k1
2
M E E
sT M E E
−=
+ − (5.21)
2
1max max max ,W T ME= (5.22)
22 max
2
max max
k1
2
ME
sT ME
=+
(5.23)
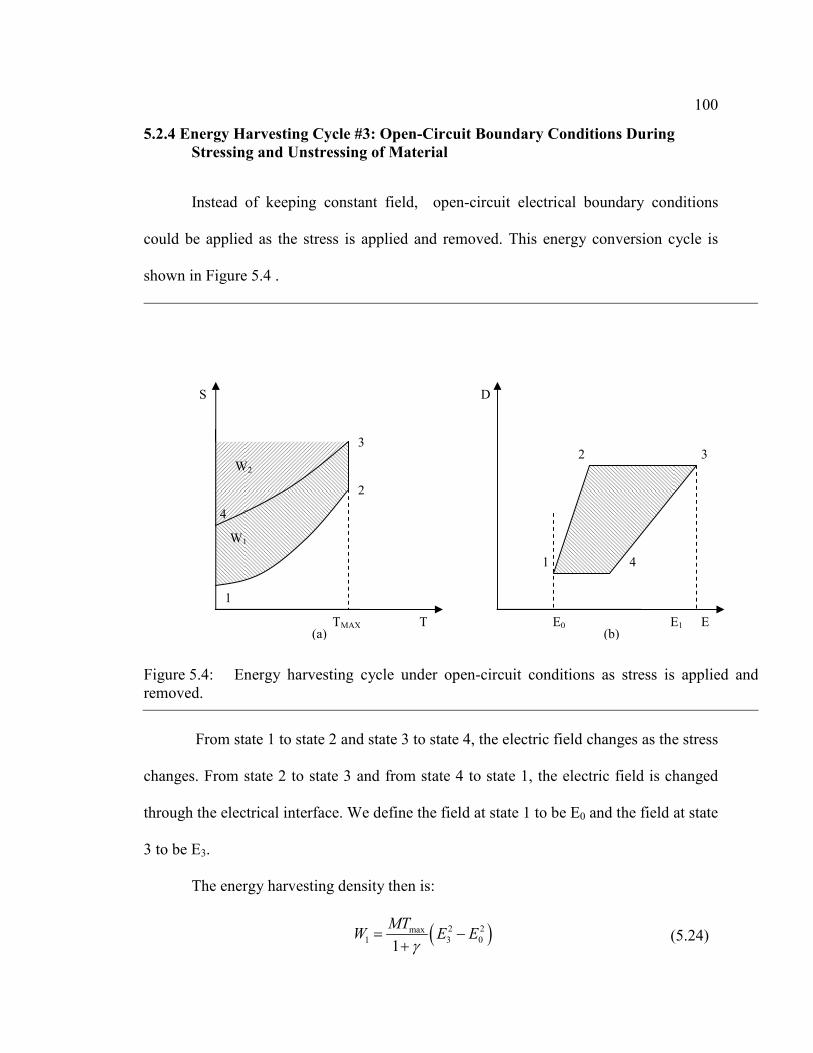
100
5.2.4 Energy Harvesting Cycle #3: Open-Circuit Boundary Conditions During
Stressing and Unstressing of Material
Instead of keeping constant field, open-circuit electrical boundary conditions
could be applied as the stress is applied and removed. This energy conversion cycle is
shown in Figure 5.4 .
From state 1 to state 2 and state 3 to state 4, the electric field changes as the stress
changes. From state 2 to state 3 and from state 4 to state 1, the electric field is changed
through the electrical interface. We define the field at state 1 to be E0 and the field at state
3 to be E3.
The energy harvesting density then is:
Figure 5.4: Energy harvesting cycle under open-circuit conditions as stress is applied and
removed.
( )2 2max1 3 0
1
MTW E E
γ= −
+ (5.24)
(a) (b)
1
2
3
1
2 3
E0 TMAX
W2
W1
4
4
E1
S
T E
D
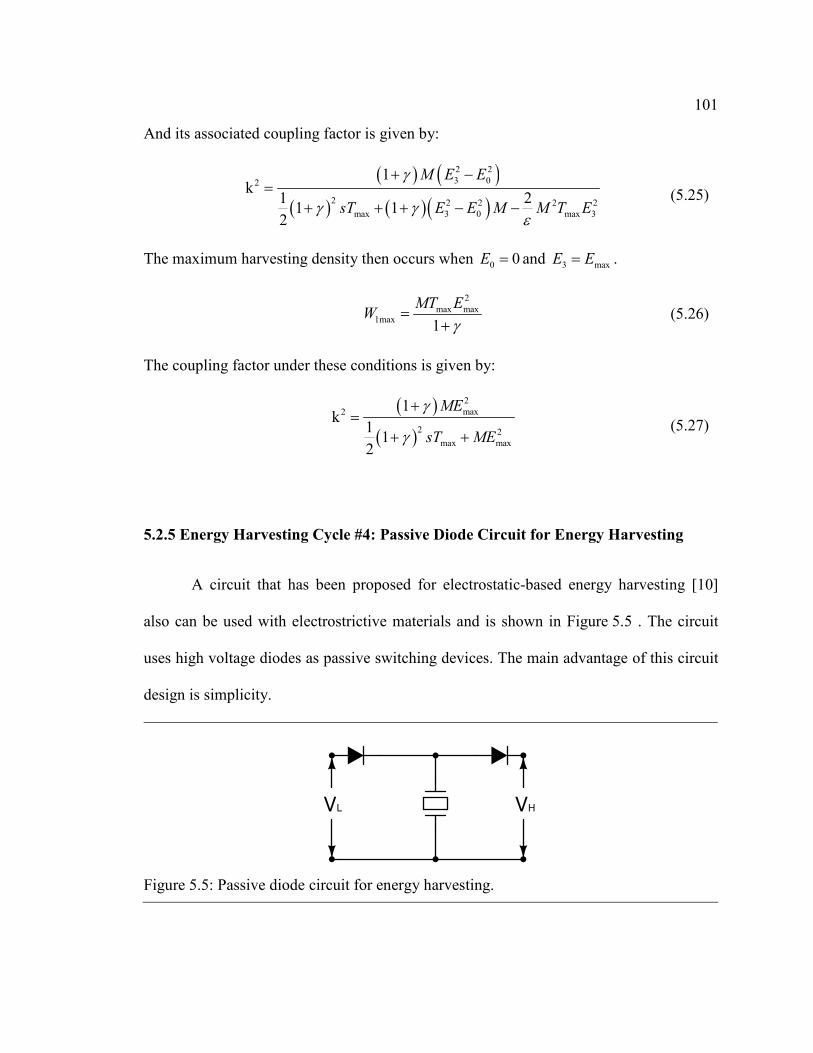
101
And its associated coupling factor is given by:
The maximum harvesting density then occurs when 0 0E = and 3 maxE E= .
The coupling factor under these conditions is given by:
5.2.5 Energy Harvesting Cycle #4: Passive Diode Circuit for Energy Harvesting
A circuit that has been proposed for electrostatic-based energy harvesting [10]
also can be used with electrostrictive materials and is shown in Figure 5.5 . The circuit
uses high voltage diodes as passive switching devices. The main advantage of this circuit
design is simplicity.
( ) ( )( ) ( )( )
2 2
3 02
2 2 2 2 2
max 3 0 max 3
1k
1 21 1
2
M E E
sT E E M M T E
γ
γ γε
+ −=
+ + + − − (5.25)
2
max max1max
1
MT EW
γ=
+ (5.26)
( )
( )
2
max2
2 2
max max
1k
11
2
ME
sT ME
γ
γ
+=
+ +
(5.27)
VL VH
Figure 5.5: Passive diode circuit for energy harvesting.
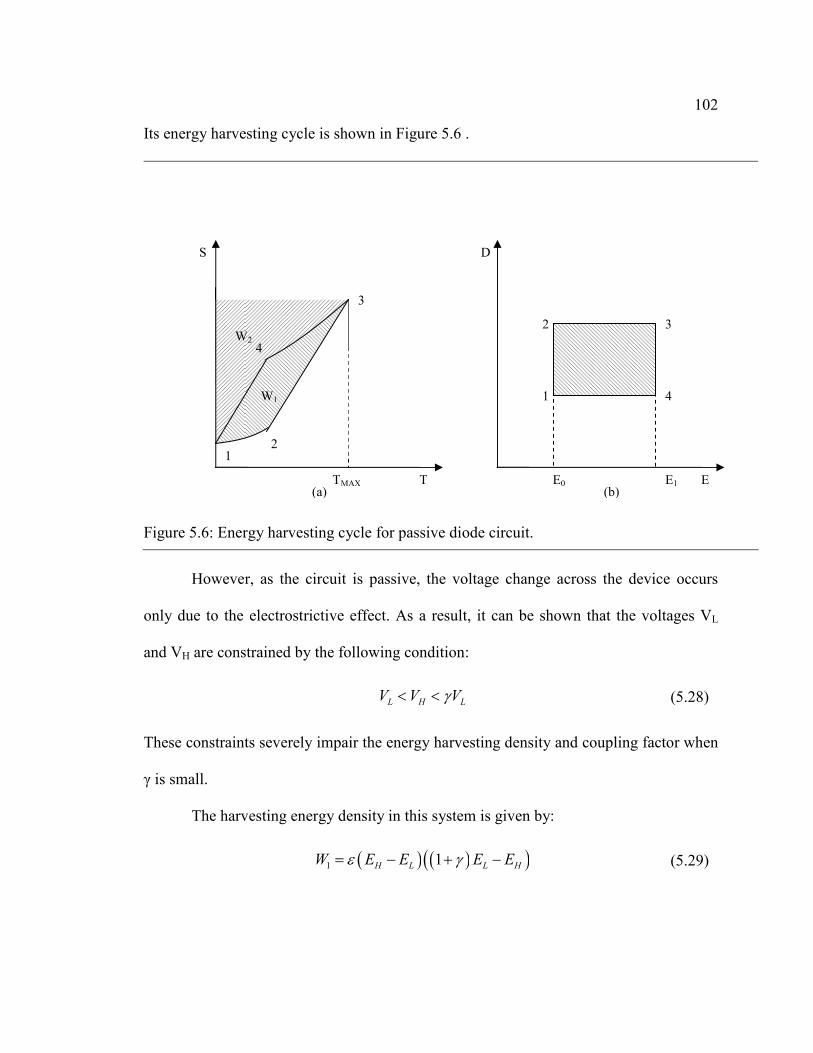
102
Its energy harvesting cycle is shown in Figure 5.6 .
However, as the circuit is passive, the voltage change across the device occurs
only due to the electrostrictive effect. As a result, it can be shown that the voltages VL
and VH are constrained by the following condition:
These constraints severely impair the energy harvesting density and coupling factor when
γ is small.
The harvesting energy density in this system is given by:
Figure 5.6: Energy harvesting cycle for passive diode circuit.
L H LV V Vγ< < (5.28)
( ) ( )( )1 1H L L HW E E E Eε γ= − + − (5.29)
(a) (b)
1
3
1
2
3
E0 TMAX
W2
4
4
E1
S
T E
D
2
W1
103
where EL and EH are the electric fields associated with VL and VH, respectively. The
coupling factor is given by:
The energy conversion density and coupling is maximized when:
If we set maxHH E= , density is given by:
and its associated coupling factor is:
5.2.6 Sinusoidal excitation
In this section we analyze the case where the mechanical and electrical excitations
both consist of constant components and sinusoidal-varying components of the same
frequency, as shown in the following
( ) ( )( )( )
2
22
max
2 1k
H L L H
H L
E E E E
sT E E
ε γ
ε
− + −=
− − (5.30)
( )2
2 1L HE E
γγ
+=
+ (5.31)
( )2
1max max max2 1
W MT Eγγ
=+
(5.32)
( )( )
2
max2
2 2
max max
2 1k
2 1
ME
sT ME
γ γ
γ γ
+=
+ + (5.33)
( )( )
0 1
0 1
sin ,
sin
E E t E
T T t T
ω
ω ϕ
= +
= + + (5.34)
104
The current density is the derivative of flux density with respect of time, and is
calculated as
In order to simplify the calculation, we choose ( )sin n tω and ( )cos m tω as orthogonal
bases of a Hilbert space, where m and n are integers, and define the inner product as,
we have , 0a b ≠ , only when a b= , so the only term that contributes to the electrical
power is ( )1 0cosE T tω ϕ+ . The power density is therefore
The energy harvesting density under these conditions is therefore:
Assuming electric field and stress are constrained between zero and their
maximum values 0 1 max
1
2E E E= = and 1 max
1
2T T= , this energy harvesting density will be
maximized when 2
πϕ = − , which is
( ) ( )( ) ( ) ( )( )0 0 0 0 1 1 0cos 2 cos 2 cos cosi E t M E T t E T t E T tωε ω ω ω ϕ ω ω ϕ= + + + + + (5.35)
0
,
T
a b a bdt< >= ×∫ (5.36)
( ) ( )0 10 10
0 0
21sin cos sin
T TME ET
P Eidt t t ME ETT T
ωω ω ϕ ω ϕ= = + =∫ ∫ (5.37)
1 0 1 02 sinW ME ETπ ϕ= (5.38)
2
1max max max4
W ME Tπ
= (5.39)

105
5.3 Comparison of Different Boundary Conditions
Inspection of the expressions for maximum energy harvesting density for different
electrical boundary conditions reveals that they can be compared directly through a
normalization process based upon maximum applied stress and electric field
With this definition, the normalized value of energy harvesting density becomes
solely a function of the term γ. Figure 5.7 presents this comparison over a range of γ
from 0 to 1, which is well over the maximum limit achievable by existing electrostrictive
materials. Inspection of Figure 5.7 reveals that the constant-field condition has the best
energy harvesting density, with the open-circuit condition being comparable at low levels
of γ. The constant-field-and open- circuit condition and the passive-diode-circuit
condition increase with γ, but they fall well below that of the constant-field condition
over the range of γ presented here.
* 1max1max 2
max max
WW
MT E= (5.40)
106
In order to compare the effectiveness of the above electrical boundary conditions,
electrostrictive material properties based on experimental data were assigned to the
calculation, along with allowable electric field and stress values for safe operation.
Representative material parameters and limitations of two electrostrictive polymers,
PVDF based terpolymer and a polyurethane, are provided in Table 5.1 [7], [11].
0 0.2 0.4 0.6 0.8 10
0.2
0.4
0.6
0.8
1
γ
No
rmo
lized e
nerg
y d
ensity
Constant field & open−circuit
Constant field
Open−circuit
Passive diode
Sinusoidal Field
Figure 5.7: Theoretical prediction of Electrostrictive energy harvesting under different
harvesting circuits
Table 5.1: Electrostrictive Material Parameters and Their Operation Limitations.
Electrostrictive
Material
ε33 M13
(V/m)-2
S11
(Pa-1)
Emax
(MV/m)
Tmax
(MPa)
γ
Terpolymer 050ε
182 10−× 92.5 10−× 150 20 0.181
Polyurethane 07.5ε
183.6 10−× 95.9 10−× 175 2 0.217

107
Resulting energy harvesting densities (the maximum energy density harvested
W1max) and their associated coupling factors are provided in Table 5.2 and Table 5.3
below. It can be seen that, even for the same polymer, different electric boundary
conditions can result in quite different values of harvested energy.
So far, electrostrictive materials have been theoretically shown to possess
significant electric energy harvesting densities. Of the electrical boundary conditions
investigated, the best harvested energy density occurs when the electric field in the
material is increased from zero to its maximum value at maximum stress, then returned to
zero at minimum stress. In the case of a small value of γ, a similar set of boundary
conditions in which the device is open circuited during the stressing and unstressing of
the material provides similar energy harvesting densities. Boundary conditions related to
Table 5.2: Maximum Energy Harvesting Density and Associated Coupling Factor for
Various Electrical Boundary Conditions, Terpolymer Material.
Electrical boundary conditions W1max(J/cm3) 2k
Constant field & open-circuit 0.117 0.233
Constant field 0.900 0.643
Open-circuit 0.762 0.665
Passive diode 0.069 0.130
Sinusoidal field 0.706 N/A
Table 5.3: Maximum Energy Harvesting Density and Associated Coupling Factor for
Various Electrical Boundary Conditions, Polyurethane Material.
Electrical boundary conditions W1max(J/cm3) 2k
Constant field & open-circuit 0.032 0.283
Constant field 0.221 0.651
Open-circuit 0.181 0.679
Passive diode 0.020 0.156
Sinusoid 0.173 N/A

108
the standard definition of coupling factor, and to a passive diode circuit, are shown to
provide relatively low energy harvesting density over the range of γ achievable by
existing electrostrictive materials. While sinusoidal voltage excitation does not perform
best, its smooth transition of voltage and easy implementation might be advantageous for
certain applications and when dielectric loss are not considered. In the next section we
will use this approach as a demonstration.
Chapter 6
Quasi-static Electrostrictive Energy Harvesting Experiment
6.1 Experimental Setup
An experiment was performed to demonstrate the very high energy harvesting
density of electrostrictive polymer material using an active approach. Because only high
voltages (up to 1000V) and small currents (tens micro-amperes) are generated by
available samples, we did not use a power electronic inverter as a driving circuit. Instead,
a commercially available high-voltage amplifier is used. Its current and voltage are
closely monitored to calculate the power flow between the electrostrictive device and the
voltage amplifier.
6.1.1 MECHANICAL SYSTEM AND EXPERIMENTAL SETUP
The mechanical driver of the energy harvesting system consisted of a loudspeaker
(6Ω, Aiwa) driven by an 300W audio amplifier (PM175, Carver) with a load cell (ELPM-
T3E-1KL, Entran Device Inc) to measure the force applied on the polymer film. One end
of the electrostrictive thin film was attached to the loudspeaker’s voice coil, and the other
end is clamped to a fixed sample holder. The motion of the voice coil applies tensile
stress to the sample. Its displacement is measured by a photonic sensor (MTI 2000, MTI
Instruments). Using the transverse strain and the stress calculated from load cell and
photonic sensor, the material’s compliance can be calculated by

110
The electrical boundary condition is controlled by the high voltage amplifier
(Model 610D, Trek Inc), which is capable of providing voltage and current up to 10 kV
and 2mA, respectively. The monitoring signals for the applied current or voltage are
given through analog output ports of the amplifier. The mechanical and electrical
excitation is controlled by a signal conditioning system (SC-2345, National Instruments).
The Labview software environment is used for programming the control and data
acquisition of the active energy harvesting process. This experimental setup is shown in
Figure 6.1
111
1
SStrainS
stress T= = (6.1)
Figure 6.1: Experiment setup for electrostrictive materials
Data acquisition
& control
Audio amplifier Fotonic sensor HV amplifier
Voltage
Sensor header
Voltage
Current
Monitoring
Load cell
Sample
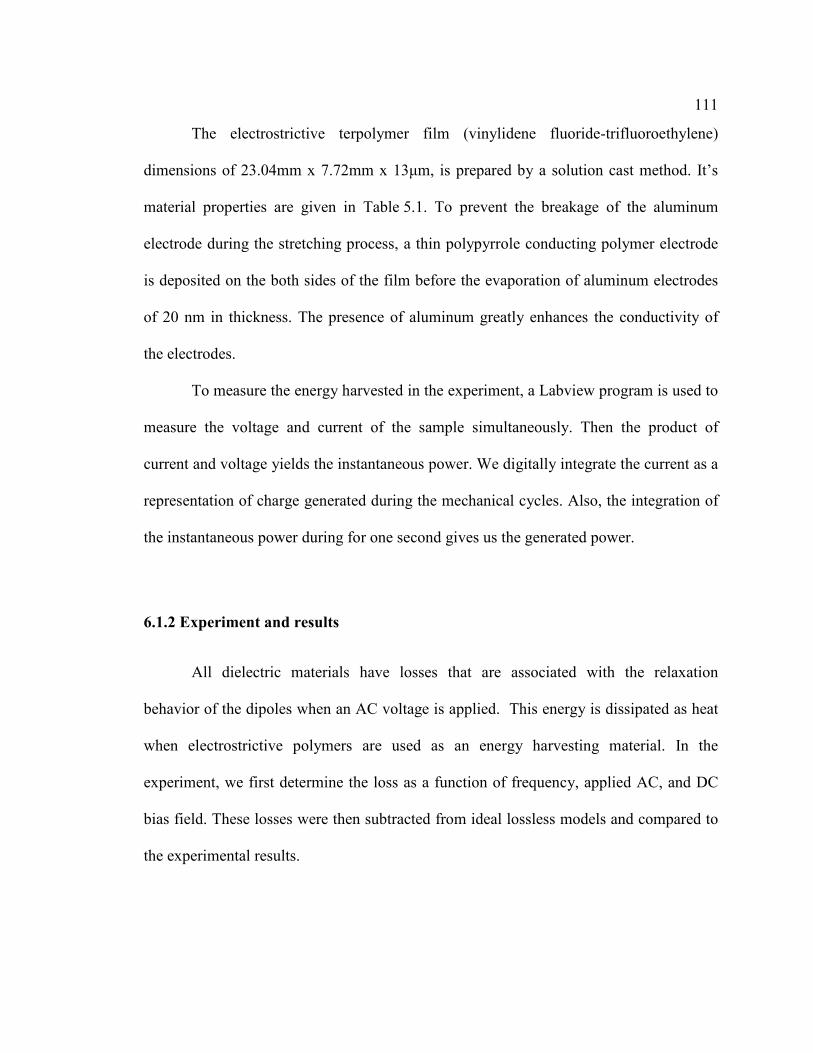
111
The electrostrictive terpolymer film (vinylidene fluoride-trifluoroethylene)
dimensions of 23.04mm x 7.72mm x 13µm, is prepared by a solution cast method. It’s
material properties are given in Table 5.1. To prevent the breakage of the aluminum
electrode during the stretching process, a thin polypyrrole conducting polymer electrode
is deposited on the both sides of the film before the evaporation of aluminum electrodes
of 20 nm in thickness. The presence of aluminum greatly enhances the conductivity of
the electrodes.
To measure the energy harvested in the experiment, a Labview program is used to
measure the voltage and current of the sample simultaneously. Then the product of
current and voltage yields the instantaneous power. We digitally integrate the current as a
representation of charge generated during the mechanical cycles. Also, the integration of
the instantaneous power during for one second gives us the generated power.
6.1.2 Experiment and results
All dielectric materials have losses that are associated with the relaxation
behavior of the dipoles when an AC voltage is applied. This energy is dissipated as heat
when electrostrictive polymers are used as an energy harvesting material. In the
experiment, we first determine the loss as a function of frequency, applied AC, and DC
bias field. These losses were then subtracted from ideal lossless models and compared to
the experimental results.
112
6.1.2.1 Determined the loss
The electrostrictive polymer sample is fixed on both ends to sample holders so the
mechanical influence is kept to a minimum, and then an AC voltage is applied using a
high voltage amplifier. The input current and voltage is closely monitored to calculate the
power loss by integrating the product of current and voltage. The results are shown in
Figure 6.2.
10 20 30 40 50 60 70 80 90 1000
1
2
3
4
5
6
7
AC voltage (V))
Specific
loss (
mW
/cc/c
ycle
)
DC=500v at 50Hz
DC=0V at 50 Hz
DC=500V at 20Hz
DC=0V at 20Hz
DC=500V at 10 HZ
DC=0V at 10Hz
Figure 6.2: Power loss under different electrical excitation under a the fixed strain
mechanical boundary condition.
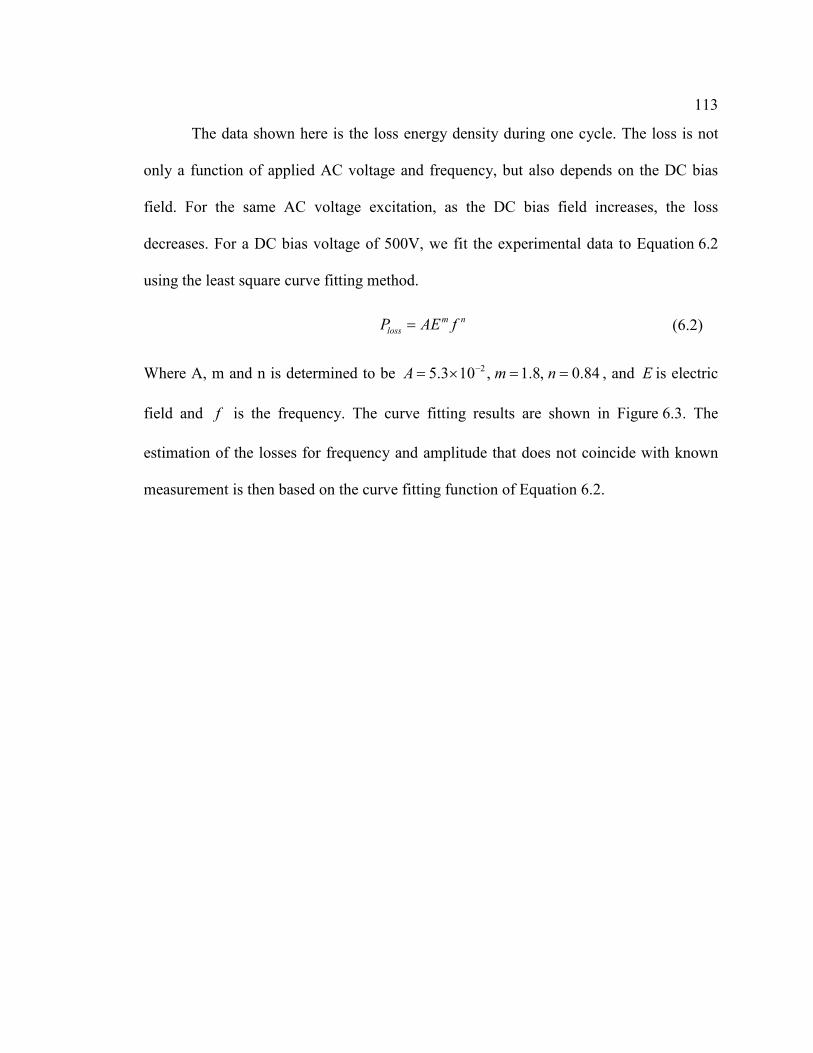
113
The data shown here is the loss energy density during one cycle. The loss is not
only a function of applied AC voltage and frequency, but also depends on the DC bias
field. For the same AC voltage excitation, as the DC bias field increases, the loss
decreases. For a DC bias voltage of 500V, we fit the experimental data to Equation 6.2
using the least square curve fitting method.
Where A, m and n is determined to be 25.3 10 , 1.8, 0.84A m n−= × = = , and E is electric
field and f is the frequency. The curve fitting results are shown in Figure 6.3. The
estimation of the losses for frequency and amplitude that does not coincide with known
measurement is then based on the curve fitting function of Equation 6.2.
m n
lossP AE f= (6.2)
114
6.1.2.2 Energy harvesting
Energy harvesting was then performed by applying sinusoidal mechanical
longitudinal stress to the sample, with a resulting maximum strain of 0.7%. The phase
and amplitude of applied electrical AC voltage and DC voltage to the sample is manually
controlled through the Labview interface. The phase is relative to the signal that is fed
into the audio amplifier. We found there is a phase shift of 65 degrees between the signal
feed into audio amplifier and the actual force exerted on the sample. This phase shift is
due the dynamics of the audio amplifier and the speaker.
10 20 30 40 50 60 70 80 90 1000
1
2
3
4
5
6
7
AC voltage (V))
Sp
ecific
loss (
mW
/cc/c
ycle
)
Figure 6.3: Cure fitting of loss measurement data to Equation 6.2
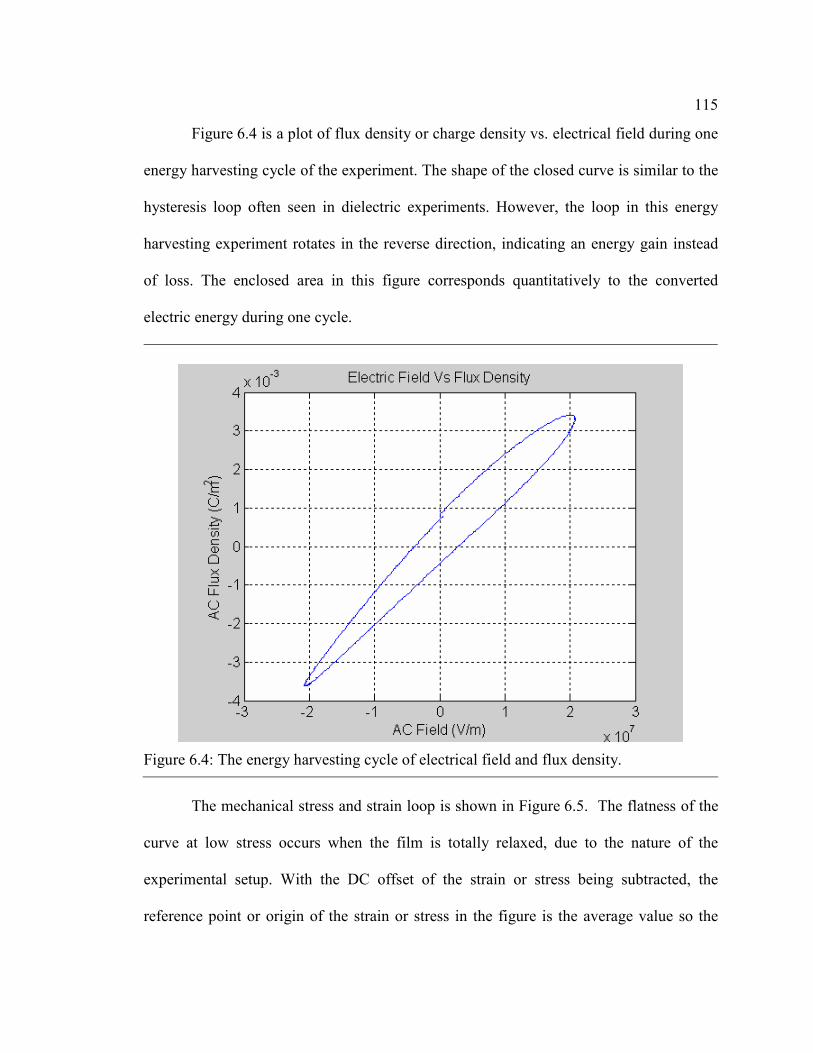
115
Figure 6.4 is a plot of flux density or charge density vs. electrical field during one
energy harvesting cycle of the experiment. The shape of the closed curve is similar to the
hysteresis loop often seen in dielectric experiments. However, the loop in this energy
harvesting experiment rotates in the reverse direction, indicating an energy gain instead
of loss. The enclosed area in this figure corresponds quantitatively to the converted
electric energy during one cycle.
The mechanical stress and strain loop is shown in Figure 6.5. The flatness of the
curve at low stress occurs when the film is totally relaxed, due to the nature of the
experimental setup. With the DC offset of the strain or stress being subtracted, the
reference point or origin of the strain or stress in the figure is the average value so the
Figure 6.4: The energy harvesting cycle of electrical field and flux density.

116
negative stress value does not correspond to compressive strain or stress but zero stress.
The enclosed area of the loop represents the input mechanical energy of one cycle.
The energy harvesting experiment is conducted with 0.7% maximum strain, and a
500V DC bias voltage is applied to the film. We vary the amplitude and phase of the AC
voltage at a frequency of 1 Hz. The average power flow into the device is plotted in
Figure 6.6.
Figure 6.5: Strain stress plot of electrostrictive energy harvsting
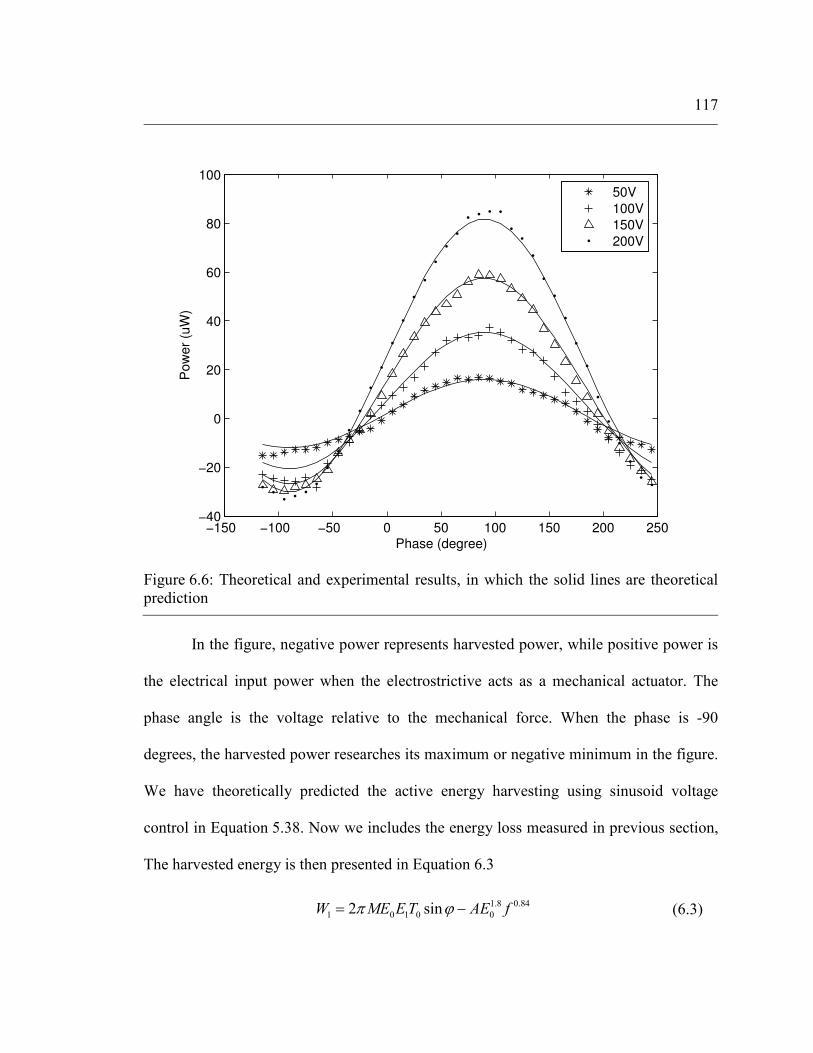
117
In the figure, negative power represents harvested power, while positive power is
the electrical input power when the electrostrictive acts as a mechanical actuator. The
phase angle is the voltage relative to the mechanical force. When the phase is -90
degrees, the harvested power researches its maximum or negative minimum in the figure.
We have theoretically predicted the active energy harvesting using sinusoid voltage
control in Equation 5.38. Now we includes the energy loss measured in previous section,
The harvested energy is then presented in Equation 6.3
−150 −100 −50 0 50 100 150 200 250−40
−20
0
20
40
60
80
100
Phase (degree)
Pow
er
(uW
)50V
100V
150V
200V
Figure 6.6: Theoretical and experimental results, in which the solid lines are theoretical
prediction
1.8 0.84
1 0 1 0 02 sinW ME ET AE fπ ϕ= − (6.3)

118
This theoretical prediction is also plotted in the figure in the solid lines in
comparison to the experimental data points.
The voltage and mechanical force waveforms of the experiment at this optimized
condition are shown in Figure 6.7
The experimental data of the voltage and force also indicate the optimized phase
condition, that the voltage lead the mechanical force by 90 degrees. The Fourier
transformation of the voltage and current wave of the energy harvesting under optimized
conditions is given in Figure 6.8
Figure 6.7: Mechanical force and voltage wave on the sample during active energy
harvesting experiment. (For both channels AC coupling was used in data acquisition)

119
It is interesting to note in the above figure that, while the voltage is almost purely
sinusoidal at 1 Hz, the current has a noticeable component at a harmonic frequency of 2
Hz. This is due to the non-linear effect of the electrostrictive material. According to
Equation 5.35, the magnitude of this current is
From the above equation the electrostrictive coupling coefficient M could
therefore be calculated from the AC electrical field and mechanical stress as
( ) 2182.2 10 /V m−−× , which is close to the known number tabulated in Table 5.1. The
existence of the harmonic current is due to the inherently non-linear characteristic of
electrostrictive material.
Finally, the results of the electrostrictive energy harvesting experimental are
compared to the other energy harvesting materials in Table 6.1
Figure 6.8: Frequency domain of current and voltage wave during active energy
harvesting, only 0~10 Hz is shown in figure
0 02doublei ME Tω= (6.4)
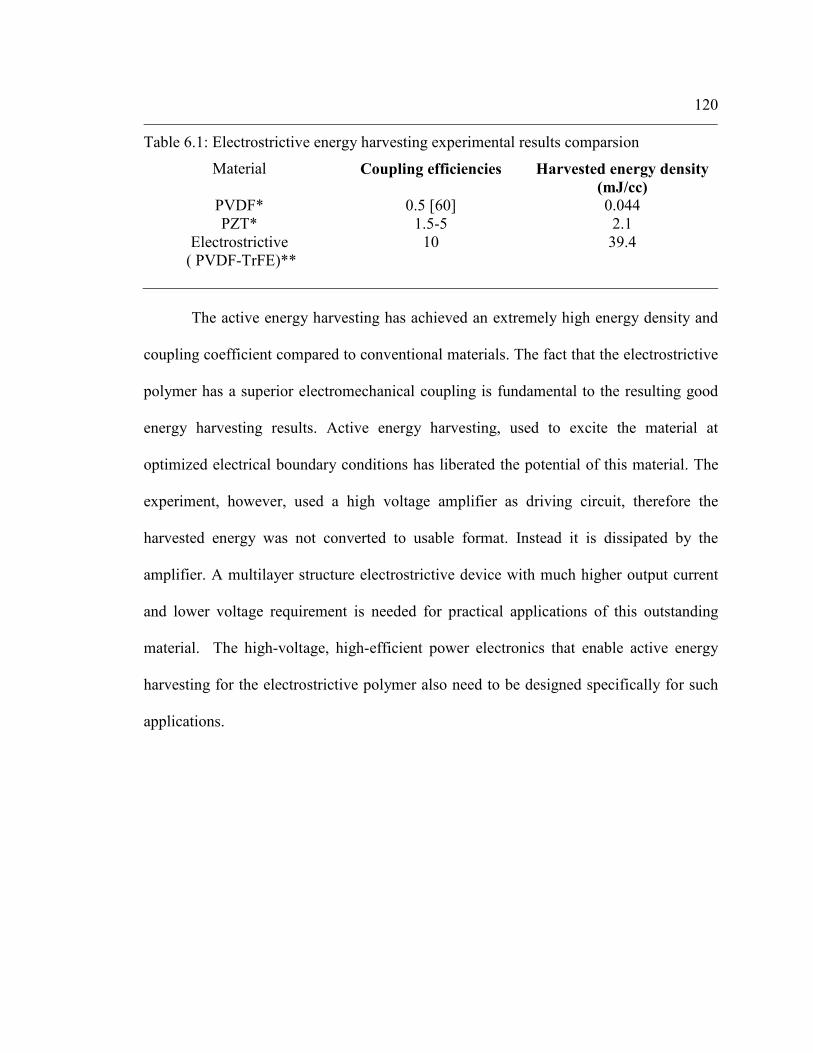
120
The active energy harvesting has achieved an extremely high energy density and
coupling coefficient compared to conventional materials. The fact that the electrostrictive
polymer has a superior electromechanical coupling is fundamental to the resulting good
energy harvesting results. Active energy harvesting, used to excite the material at
optimized electrical boundary conditions has liberated the potential of this material. The
experiment, however, used a high voltage amplifier as driving circuit, therefore the
harvested energy was not converted to usable format. Instead it is dissipated by the
amplifier. A multilayer structure electrostrictive device with much higher output current
and lower voltage requirement is needed for practical applications of this outstanding
material. The high-voltage, high-efficient power electronics that enable active energy
harvesting for the electrostrictive polymer also need to be designed specifically for such
applications.
Table 6.1: Electrostrictive energy harvesting experimental results comparsion
Material Coupling efficiencies Harvested energy density
(mJ/cc) PVDF* 0.5 [60] 0.044
PZT* 1.5-5 2.1
Electrostrictive
( PVDF-TrFE)**
10 39.4
Chapter 7
Conclusions and Future Work
7.1 Summary
This thesis has established a modeling technique that is unique in that it uses
electrical mechanical boundary integration methods to analyze the energy conversion
process. As we gain better understanding of how mechanical energy is converted to
electrical energy in piezoelectric and electrostrictive materials, it is intuitive to think
along the lines of actively controlling the electrical boundary conditions (voltage/charge)
for better energy harvesting effects. This directly leads to the concept of active energy
harvesting.
As detailed theoretical analysis shows, the key for a successful active energy
harvesting system relies on three aspects of the system. First, the power electronics
circuit must be able to apply higher voltage to the device than the open circuit voltage of
a piezoelectric device. For optimized operation, the power electronics might need to
apply substantially higher voltage to the device. Second, the power efficiency of power
electronics directly impacts the performance of the system. This is because the capacitive
nature of a piezoelectric device results in a large portion of reactive power in the energy
conversion process. Lastly, the voltage and mechanical excitation must be in certain
phase relations for optimized power, which might need a mechanical sensor.

122
Experimental study also confirms that active energy harvesting outperforms the
traditional diode rectifier circuit by a large margin. The experimental data matches the
theoretical analysis quite well.
The study of electrostrictive polymers as energy harvesting material is also highly
interesting. We theoretically determined the energy harvesting circuits that best fit to this
kind of material. And more exciting is that the experiment also shows exceptional high
energy harvesting density, which could be achieved using actively controlled electrical
boundary conditions. The data is explained by the theoretical model if the experimentally
measured dielectric loss is subtracted from the ideal lossless model.
7.2 Future Work
From a theoretical side, this thesis developed the model under a quasi-static
assumption. In fact, it is highly desirable to include the structural dynamics in the model.
Some preliminary work has indicated that active energy harvesting is also highly
attractive for vibration energy harvesting. It can increase the power output at resonance
frequency and also broadens the half-power bandwidth.
For practice, highly efficient, high voltage power electronics need to be developed
along with ultra-low power control circuits. One major obstacle of an active energy
harvesting circuit is the ‘cool start’ problem. That is, when the storage unit is depleted,
how can one design a system that could still power the control circuit and accumulate
energy? This is more difficult for electrostrictive materials, which always need certain
bias fields to be active.
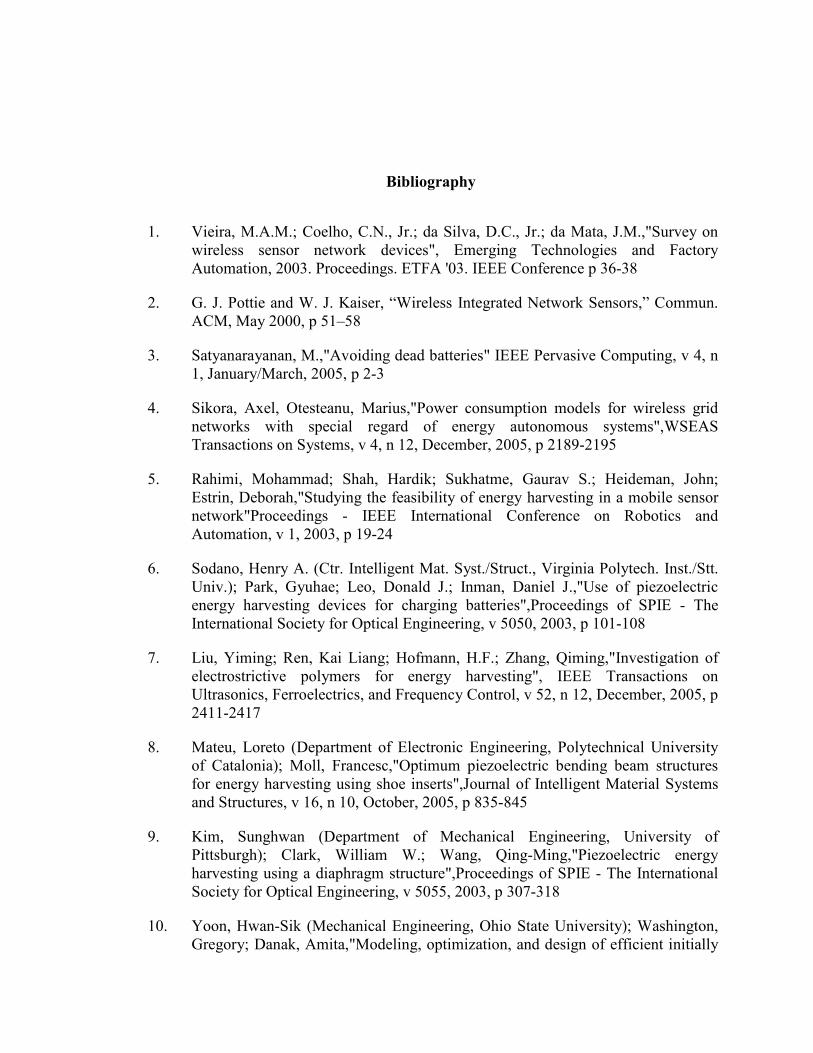
Bibliography
1. Vieira, M.A.M.; Coelho, C.N., Jr.; da Silva, D.C., Jr.; da Mata, J.M.,"Survey on
wireless sensor network devices", Emerging Technologies and Factory
Automation, 2003. Proceedings. ETFA '03. IEEE Conference p 36-38
2. G. J. Pottie and W. J. Kaiser, “Wireless Integrated Network Sensors,” Commun.
ACM, May 2000, p 51–58
3. Satyanarayanan, M.,"Avoiding dead batteries" IEEE Pervasive Computing, v 4, n
1, January/March, 2005, p 2-3
4. Sikora, Axel, Otesteanu, Marius,"Power consumption models for wireless grid
networks with special regard of energy autonomous systems",WSEAS
Transactions on Systems, v 4, n 12, December, 2005, p 2189-2195
5. Rahimi, Mohammad; Shah, Hardik; Sukhatme, Gaurav S.; Heideman, John;
Estrin, Deborah,"Studying the feasibility of energy harvesting in a mobile sensor
network"Proceedings - IEEE International Conference on Robotics and
Automation, v 1, 2003, p 19-24
6. Sodano, Henry A. (Ctr. Intelligent Mat. Syst./Struct., Virginia Polytech. Inst./Stt.
Univ.); Park, Gyuhae; Leo, Donald J.; Inman, Daniel J.,"Use of piezoelectric
energy harvesting devices for charging batteries",Proceedings of SPIE - The
International Society for Optical Engineering, v 5050, 2003, p 101-108
7. Liu, Yiming; Ren, Kai Liang; Hofmann, H.F.; Zhang, Qiming,"Investigation of
electrostrictive polymers for energy harvesting", IEEE Transactions on
Ultrasonics, Ferroelectrics, and Frequency Control, v 52, n 12, December, 2005, p
2411-2417
8. Mateu, Loreto (Department of Electronic Engineering, Polytechnical University
of Catalonia); Moll, Francesc,"Optimum piezoelectric bending beam structures
for energy harvesting using shoe inserts",Journal of Intelligent Material Systems
and Structures, v 16, n 10, October, 2005, p 835-845
9. Kim, Sunghwan (Department of Mechanical Engineering, University of
Pittsburgh); Clark, William W.; Wang, Qing-Ming,"Piezoelectric energy
harvesting using a diaphragm structure",Proceedings of SPIE - The International
Society for Optical Engineering, v 5055, 2003, p 307-318
10. Yoon, Hwan-Sik (Mechanical Engineering, Ohio State University); Washington,
Gregory; Danak, Amita,"Modeling, optimization, and design of efficient initially

124
curved piezoceramic unimorphs for energy harvesting applications",Journal of
Intelligent Material Systems and Structures, v 16, n 10, October, 2005, p 877-888
11. Roundy, Shad (Australian National University, Dept. of Engineering); Zhang,
Yang, "Toward self-tuning adaptive vibration based micro-
generators",Proceedings of SPIE - The International Society for Optical
Engineering, v 5649, n PART 1, Smart Structures, Devices, and Systems II, 2005,
p 373-384
12. Datasheet PMG7-6 Perpetuum Ltd http://www.perpetuum.co.uk/products.htm
13. Ottman, Geffrey K. (Applied Physics Laboratory, Johns Hopkins University);
Hofmann, Heath F.; Bhatt, Archin C.; Lesieutre, George A.,"Adaptive
piezoelectric energy harvesting circuit for wireless remote power supply",IEEE
Transactions on Power Electronics, v 17, n 5, September, 2002, p 669-676
14. Shenck, N.S.; Paradiso, J.A.,"Energy scavenging with shoe-mounted
piezoelectrics",IEEE Micro, v 21, n 3, May/June, 2001, p 30-42
15. Guan, Mingjie (Smart Materials and Structures Laboratory, Department of
Automation and Computer-Aided Engineering, Chinese University of Hong
Kong); Liao, Wei-Hsin,"On the energy storage devices in piezoelectric energy
harvesting",Proceedings of SPIE - The International Society for Optical
Engineering, v 6169, Smart Structures and Materials 2006: Damping and
Isolation, 2006, p 616-619
16. Nye, T.W. (TRW Space and Electronics Group); Manning, R.A.; Qassim,
K.,"Performance of active vibration control technology: The ACTEX flight
experiments",Smart Materials and Structures, v 8, n 6, Dec, 1999, p 767-780
17. Radcliffe, C.J. (Michigan State Univ); Wang, K.-W; Tzou, H.S.; Hendricks, E.W.
eds.,"Active Control of Noise and Vibration - 1992",American Society of
Mechanical Engineers, Dynamic Systems and Control Division (Publication)
DSC, v 38, Active Control of Noise and Vibration - 1992, p 363-367
18. Vujic, Nikola (Ctr. Intelligent Mat. Syst./Struct., Mechanical Engineering
Department, Virginia Tech); Leo, Donald J.; Lindner, Douglas K.,"Power
regeneration in active vibration isolation systems",Proceedings of SPIE - The
International Society for Optical Engineering, v 5052, 2003, p 368-379
19. Miles, R.W. (Northumbria Photovoltaics Applications Centre, School of
Informatics, Engineering and Technology, Northumbria University) "Photovoltaic
solar cells: Choice of materials and production methods" Vacuum, v 80, n 10,
Aug 3, 2006, p 1090-1097
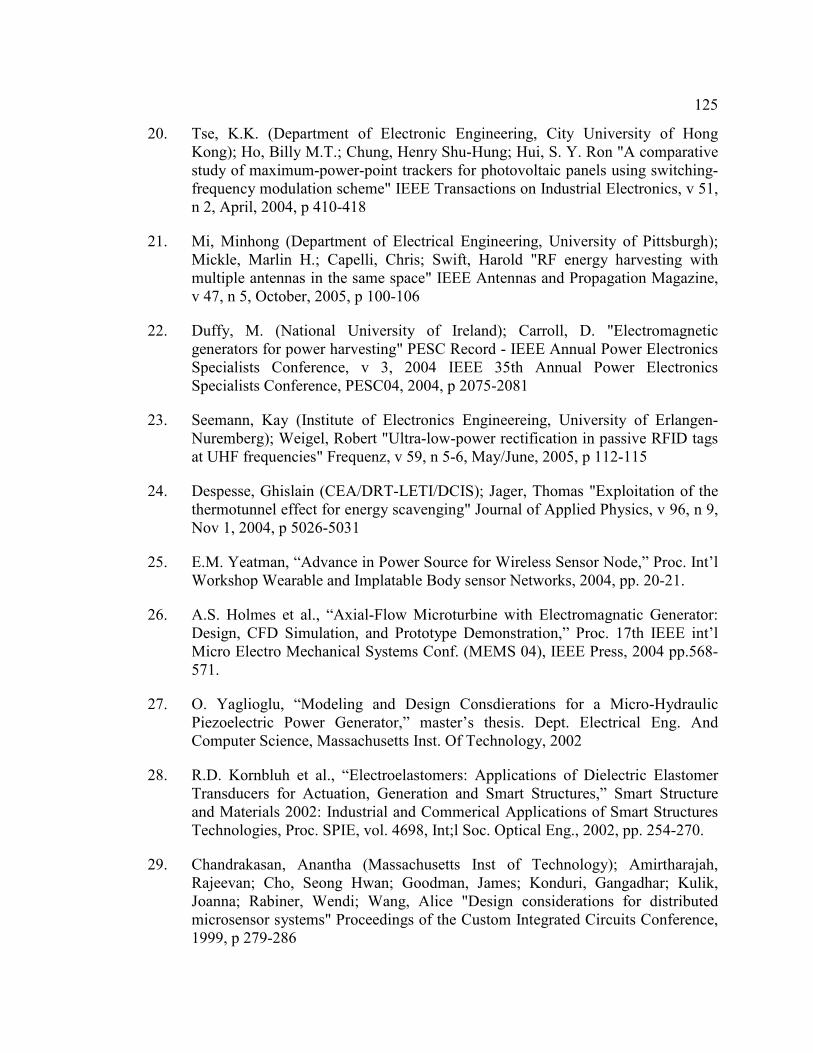
125
20. Tse, K.K. (Department of Electronic Engineering, City University of Hong
Kong); Ho, Billy M.T.; Chung, Henry Shu-Hung; Hui, S. Y. Ron "A comparative
study of maximum-power-point trackers for photovoltaic panels using switching-
frequency modulation scheme" IEEE Transactions on Industrial Electronics, v 51,
n 2, April, 2004, p 410-418
21. Mi, Minhong (Department of Electrical Engineering, University of Pittsburgh);
Mickle, Marlin H.; Capelli, Chris; Swift, Harold "RF energy harvesting with
multiple antennas in the same space" IEEE Antennas and Propagation Magazine,
v 47, n 5, October, 2005, p 100-106
22. Duffy, M. (National University of Ireland); Carroll, D. "Electromagnetic
generators for power harvesting" PESC Record - IEEE Annual Power Electronics
Specialists Conference, v 3, 2004 IEEE 35th Annual Power Electronics
Specialists Conference, PESC04, 2004, p 2075-2081
23. Seemann, Kay (Institute of Electronics Engineereing, University of Erlangen-
Nuremberg); Weigel, Robert "Ultra-low-power rectification in passive RFID tags
at UHF frequencies" Frequenz, v 59, n 5-6, May/June, 2005, p 112-115
24. Despesse, Ghislain (CEA/DRT-LETI/DCIS); Jager, Thomas "Exploitation of the
thermotunnel effect for energy scavenging" Journal of Applied Physics, v 96, n 9,
Nov 1, 2004, p 5026-5031
25. E.M. Yeatman, “Advance in Power Source for Wireless Sensor Node,” Proc. Int’l
Workshop Wearable and Implatable Body sensor Networks, 2004, pp. 20-21.
26. A.S. Holmes et al., “Axial-Flow Microturbine with Electromagnatic Generator:
Design, CFD Simulation, and Prototype Demonstration,” Proc. 17th IEEE int’l
Micro Electro Mechanical Systems Conf. (MEMS 04), IEEE Press, 2004 pp.568-
571.
27. O. Yaglioglu, “Modeling and Design Consdierations for a Micro-Hydraulic
Piezoelectric Power Generator,” master’s thesis. Dept. Electrical Eng. And
Computer Science, Massachusetts Inst. Of Technology, 2002
28. R.D. Kornbluh et al., “Electroelastomers: Applications of Dielectric Elastomer
Transducers for Actuation, Generation and Smart Structures,” Smart Structure
and Materials 2002: Industrial and Commerical Applications of Smart Structures
Technologies, Proc. SPIE, vol. 4698, Int;l Soc. Optical Eng., 2002, pp. 254-270.
29. Chandrakasan, Anantha (Massachusetts Inst of Technology); Amirtharajah,
Rajeevan; Cho, Seong Hwan; Goodman, James; Konduri, Gangadhar; Kulik,
Joanna; Rabiner, Wendi; Wang, Alice "Design considerations for distributed
microsensor systems" Proceedings of the Custom Integrated Circuits Conference,
1999, p 279-286
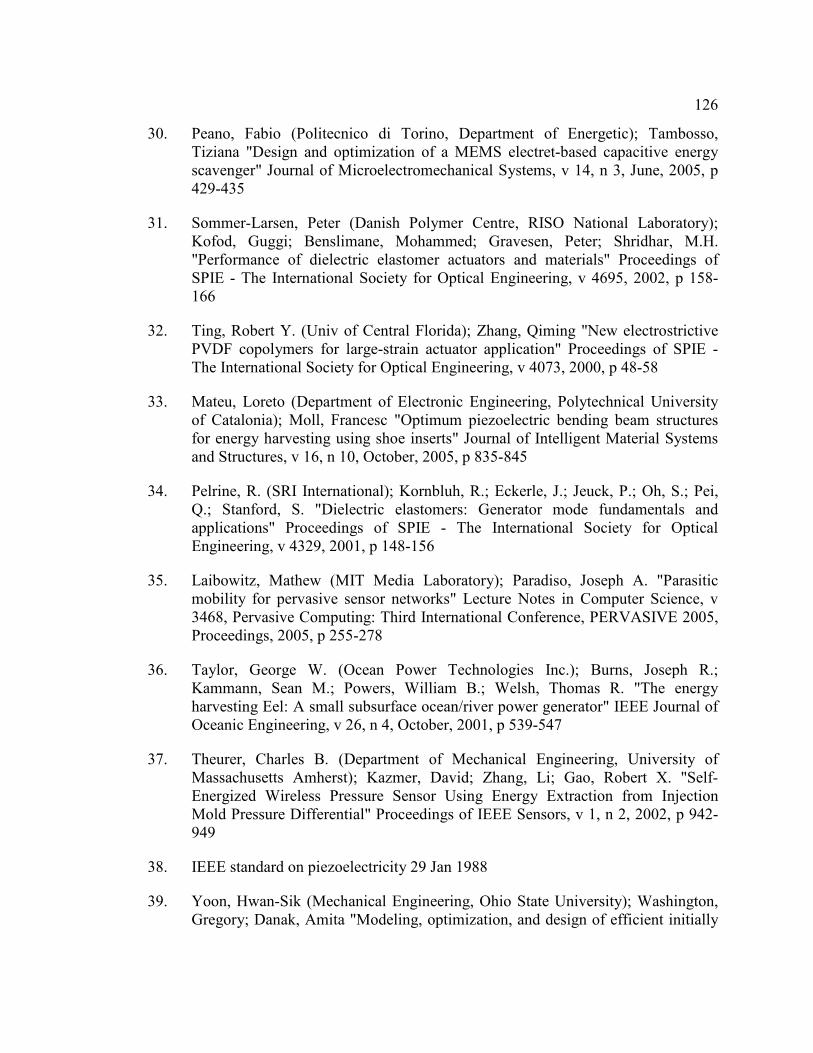
126
30. Peano, Fabio (Politecnico di Torino, Department of Energetic); Tambosso,
Tiziana "Design and optimization of a MEMS electret-based capacitive energy
scavenger" Journal of Microelectromechanical Systems, v 14, n 3, June, 2005, p
429-435
31. Sommer-Larsen, Peter (Danish Polymer Centre, RISO National Laboratory);
Kofod, Guggi; Benslimane, Mohammed; Gravesen, Peter; Shridhar, M.H.
"Performance of dielectric elastomer actuators and materials" Proceedings of
SPIE - The International Society for Optical Engineering, v 4695, 2002, p 158-
166
32. Ting, Robert Y. (Univ of Central Florida); Zhang, Qiming "New electrostrictive
PVDF copolymers for large-strain actuator application" Proceedings of SPIE -
The International Society for Optical Engineering, v 4073, 2000, p 48-58
33. Mateu, Loreto (Department of Electronic Engineering, Polytechnical University
of Catalonia); Moll, Francesc "Optimum piezoelectric bending beam structures
for energy harvesting using shoe inserts" Journal of Intelligent Material Systems
and Structures, v 16, n 10, October, 2005, p 835-845
34. Pelrine, R. (SRI International); Kornbluh, R.; Eckerle, J.; Jeuck, P.; Oh, S.; Pei,
Q.; Stanford, S. "Dielectric elastomers: Generator mode fundamentals and
applications" Proceedings of SPIE - The International Society for Optical
Engineering, v 4329, 2001, p 148-156
35. Laibowitz, Mathew (MIT Media Laboratory); Paradiso, Joseph A. "Parasitic
mobility for pervasive sensor networks" Lecture Notes in Computer Science, v
3468, Pervasive Computing: Third International Conference, PERVASIVE 2005,
Proceedings, 2005, p 255-278
36. Taylor, George W. (Ocean Power Technologies Inc.); Burns, Joseph R.;
Kammann, Sean M.; Powers, William B.; Welsh, Thomas R. "The energy
harvesting Eel: A small subsurface ocean/river power generator" IEEE Journal of
Oceanic Engineering, v 26, n 4, October, 2001, p 539-547
37. Theurer, Charles B. (Department of Mechanical Engineering, University of
Massachusetts Amherst); Kazmer, David; Zhang, Li; Gao, Robert X. "Self-
Energized Wireless Pressure Sensor Using Energy Extraction from Injection
Mold Pressure Differential" Proceedings of IEEE Sensors, v 1, n 2, 2002, p 942-
949
38. IEEE standard on piezoelectricity 29 Jan 1988
39. Yoon, Hwan-Sik (Mechanical Engineering, Ohio State University); Washington,
Gregory; Danak, Amita "Modeling, optimization, and design of efficient initially
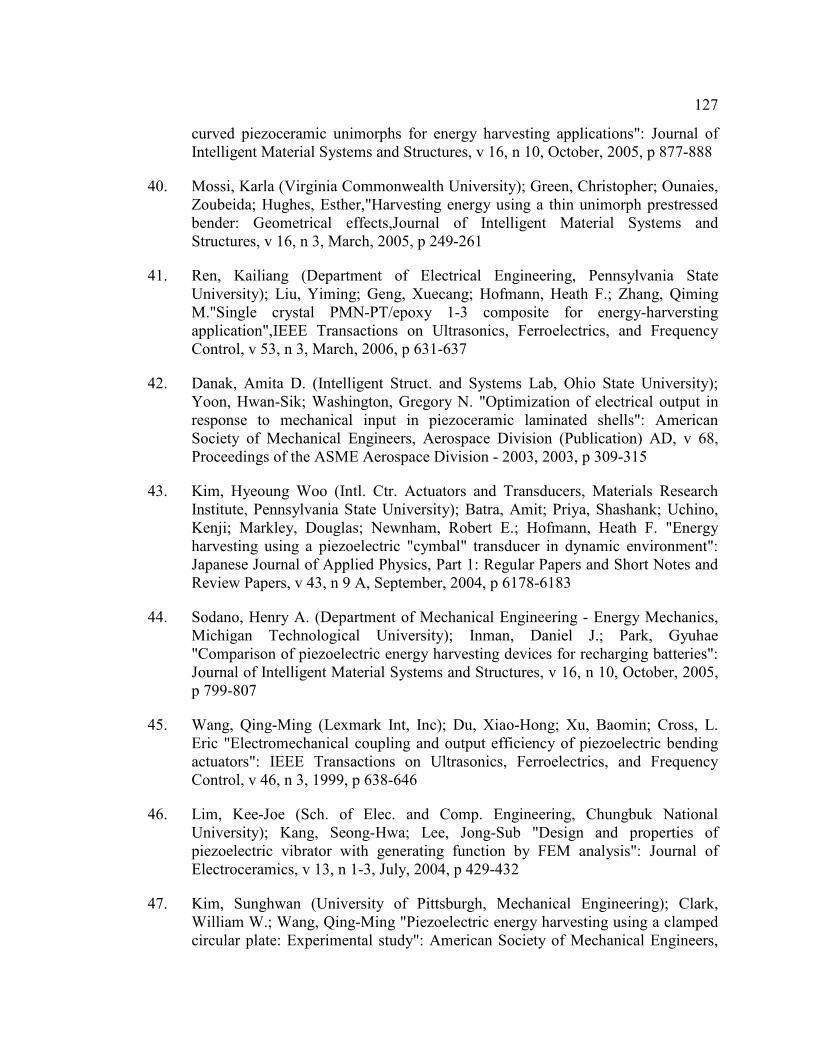
127
curved piezoceramic unimorphs for energy harvesting applications": Journal of
Intelligent Material Systems and Structures, v 16, n 10, October, 2005, p 877-888
40. Mossi, Karla (Virginia Commonwealth University); Green, Christopher; Ounaies,
Zoubeida; Hughes, Esther,"Harvesting energy using a thin unimorph prestressed
bender: Geometrical effects,Journal of Intelligent Material Systems and
Structures, v 16, n 3, March, 2005, p 249-261
41. Ren, Kailiang (Department of Electrical Engineering, Pennsylvania State
University); Liu, Yiming; Geng, Xuecang; Hofmann, Heath F.; Zhang, Qiming
M."Single crystal PMN-PT/epoxy 1-3 composite for energy-harversting
application",IEEE Transactions on Ultrasonics, Ferroelectrics, and Frequency
Control, v 53, n 3, March, 2006, p 631-637
42. Danak, Amita D. (Intelligent Struct. and Systems Lab, Ohio State University);
Yoon, Hwan-Sik; Washington, Gregory N. "Optimization of electrical output in
response to mechanical input in piezoceramic laminated shells": American
Society of Mechanical Engineers, Aerospace Division (Publication) AD, v 68,
Proceedings of the ASME Aerospace Division - 2003, 2003, p 309-315
43. Kim, Hyeoung Woo (Intl. Ctr. Actuators and Transducers, Materials Research
Institute, Pennsylvania State University); Batra, Amit; Priya, Shashank; Uchino,
Kenji; Markley, Douglas; Newnham, Robert E.; Hofmann, Heath F. "Energy
harvesting using a piezoelectric "cymbal" transducer in dynamic environment":
Japanese Journal of Applied Physics, Part 1: Regular Papers and Short Notes and
Review Papers, v 43, n 9 A, September, 2004, p 6178-6183
44. Sodano, Henry A. (Department of Mechanical Engineering - Energy Mechanics,
Michigan Technological University); Inman, Daniel J.; Park, Gyuhae
"Comparison of piezoelectric energy harvesting devices for recharging batteries":
Journal of Intelligent Material Systems and Structures, v 16, n 10, October, 2005,
p 799-807
45. Wang, Qing-Ming (Lexmark Int, Inc); Du, Xiao-Hong; Xu, Baomin; Cross, L.
Eric "Electromechanical coupling and output efficiency of piezoelectric bending
actuators": IEEE Transactions on Ultrasonics, Ferroelectrics, and Frequency
Control, v 46, n 3, 1999, p 638-646
46. Lim, Kee-Joe (Sch. of Elec. and Comp. Engineering, Chungbuk National
University); Kang, Seong-Hwa; Lee, Jong-Sub "Design and properties of
piezoelectric vibrator with generating function by FEM analysis": Journal of
Electroceramics, v 13, n 1-3, July, 2004, p 429-432
47. Kim, Sunghwan (University of Pittsburgh, Mechanical Engineering); Clark,
William W.; Wang, Qing-Ming "Piezoelectric energy harvesting using a clamped
circular plate: Experimental study": American Society of Mechanical Engineers,
128
Aerospace Division (Publication) AD, v 68, Proceedings of the ASME Aerospace
Division - 2003, 2003, p 461-469
48. Richard Feyman, Robert B. Leighton, Matthew L. Snads “The feynman lecture on
physics” Vol. II, 17-7 Welsey 1989
49. Ottman, Geffrey K. (Dept. of Electrical Engineering, The Pennsylvania State
University); Hofmann, Heath F.; Lesieutre, George A. "Optimized piezoelectric
energy harvesting circuit using step-down converter in discontinuous conduction
mode" PESC Record - IEEE Annual Power Electronics Specialists Conference, v
4, 2002, p 1988-1994
50. Lefeuvre, Elie (Laboratoire de Genie Electrique et Ferroelectricite, INSA de
Lyon); Badel, Adrien; Richard, Claude; Guyomar, Daniel "Piezoelectric energy
harvesting device optimization by synchronous electric charge extraction"Journal
of Intelligent Material Systems and Structures, v 16, n 10, October, 2005, p 865-
876
51. P. Smalser, “Power transfer of piezoelectric generated energy,” U.S.Patent, 5 703
474, 1997.
52. Badel, A. (Institut National des Sciences Appliquees de Lyon, Laboratoire de
Genie Electrique et Ferroelectricite); Sebald, G.; Guyomar, D.; Lallart, M.;
Lefeuvre, E.; Richard, C.; Qiu, J. "Piezoelectric vibration control by synchronized
switching on adaptive voltage sources: Towards wideband semi-active damping"
Journal of the Acoustical Society of America, v 119, n 5, 2006, p 2815-2825
53. Richard, Claude (Inst Natl des Sciences Appliquees); Guyomar, Daniel; Audigier,
David; Bassaler, Henri "Enhanced semi passive damping using continuous
switching of a piezoelectric device on an inductor" Proceedings of SPIE - The
International Society for Optical Engineering, v 3989, 2000, p 288-299
54. Brennan, M.J. (Univ of Southampton); Garcia-Bonito, J.; Elliott, S.J.; David, A.;
Pinnington, R.J. "Design of a piezoelectric actuator for active vibration control"
American Society of Mechanical Engineers, Design Engineering Division
(Publication) DE, v 93, Active Control of Vibration and Noise, 1996, p 315-322
55. Hagood, N.W. and Ghandi, K. 2003. “Electrical power extraction from
mechanical disturbances”, U.S. Patent 6,580,177.
56. Alsweify, Khaled A. (California Polytechnic State Univ); Kolkailah, Faysal A.;
Farghaly, Said H. "Active and passive damping control of intelligent structure
vibration"International SAMPE Symposium and Exhibition (Proceedings), v 43, n
1, 1998, p 413-425
129
57. Kloos, Gerhard (Eindhoven Univ of Technology) "Quadratic electrostriction in
polymers"Annual Technical Conference - ANTEC, Conference Proceedings, v 2,
Materials, 1996, p 2365-2368
58. R. Pelrine, R. D. Kornbluh, J. Eckerle, P. Jeuck, S. Oh, Q. Pei,and S. Stanford,
“Dielectric elastomers: Generator mode fundamentals vol. 4329, pp. 148–156,
Mar. 2001.
59. Q. M. Zhang and J. Scheinbeim, “Electric EAP,” in Electroactive Polymer [EAP]
Actuators as Artificial Muscles. Y. Bar-Cohen, Ed. 2nd ed. Bellingham: SPIE
Press, 2004, pp. 95–150.
60. Lee, C.S. (Department of Physics, Ctr. Electro/Photo Responsive Molec., Korea
University); Joo, J.; Han, S.; Koh, S.K. "Multifunctional transducer using poly
(vinylidene fluoride) active layer and highly conducting poly (3,4-
ethylenedioxythiophene) electrode: Actuator and generator" Applied Physics
Letters, v 85, n 10, Sep 6, 2004, p 1841-1843
61. Makihara, Kanjuro, Onoda, Junjiro, Miyakawa, Takeya, "Low energy dissipation
electric circuit for energy harvesting" Smart Materials and Structures, v 15, n 5,
Oct 1, 2006, p 1493-1498
62. Burns, J.R., Smalser, P., Taylor, G.W. and Welsh, T.R. 2003. “Switched resonant
power conversion electronics”, U.S. Patent 6,528,928 .
63. Faiz, A. (Laboratoire de Genie Electrique et Ferroeectricite (LGEF), INSA de
Lyon); Guyomar, D.; Petit, L.; Buttay, C. "Semi-passive piezoelectric noise
control in transmission by synchronized switching damping on voltage source"
Journal De Physique. IV : JP, v 128, September, 2005, p 171-176

VITAE
Yiming Liu
Education
PhD Candidate, Electrical Engineering
GPA 3.7/4.0 Pennsylvania State University August 1999–December 2006
Bachelor of Science, Physics
GPA 3.8/4.0 Nanjing University August 1992–May 1996
Work Experience
KCF Technologies State College, PA August 2004– December 2006
Embedded Software & System Design Engineer
• Energy Harvesting circuit design
• Smart Tether embedded system design
• Robotic arm for sound intensity measurement system integration
Awards and Honors
• Braddock Fellowship (1999-2000)
• People’s Scholarship (1992-1994)
• Duncan Fellowship (1999-2000)
• Yinsong Scholarship (1992-1993)
.