acquisition of indigo natural resources
TRANSCRIPT
1
Acquisition of Indigo Natural ResourcesJune 2021
NYSE: SWNwww.swn.com
2
Forward-Looking StatementsCertain statements and information herein may constitute “forward-looking statements” within the meaning of Section 27A of the Securities Act of 1933, as amended, and Section 21E of the Exchange Act, as amended. The words “believe,” “expect,” “anticipate,” “plan,” "predict," “intend,” "seek," “foresee,” “should,” “would,” “could,” “attempt,” “appears,” “forecast,” “outlook,” “estimate,” “project,” “potential,” “may,” “will,” “likely,” “guidance,” “goal,” “model,” “target,” “budget” and other similar expressions are intended to identify forward-looking statements, which are generally not historical in nature. Statements may be forward looking even in the absence of these particular words. Examples of forward-looking statements include, but are not limited to, statements regarding the proposed acquisition of Indigo Natural Resources LLC (the “Proposed Transaction”), expected synergies and other benefits from and costs in connection with the Proposed Transaction, estimated financial metrics giving effect to the Proposed Transaction, our financial position, business strategy, production, reserve growth and other plans and objectives for our future operations, and generation of free cash flow. These forward-looking statements are based on our current expectations and beliefs concerning future developments and their potential effect on us. The forward-looking statements contained in this document are largely based on our expectations for the future, which reflect certain estimates and assumptions made by our management. These estimates and assumptions reflect our best judgment based on currently known market conditions, operating trends, and other factors. Although we believe such estimates and assumptions to be reasonable, they are inherently uncertain and involve a number of risks and uncertainties that are beyond our control. As such, management’s assumptions about future events may prove to be inaccurate. For a more detailed description of the risks and uncertainties involved, see “Risk Factors” in our most recently filed Annual Report on Form 10-K, subsequent Quarterly Reports on Form 10-Q, Current Reports on Form 8-K, and other SEC filings. We do not intend to publicly update or revise any forward-looking statements as a result of new information, future events, changes in circumstances, or otherwise. These cautionary statements qualify all forward-looking statements attributable to us, or persons acting on our behalf. Management cautions you that the forward-looking statements contained herein are not guarantees of future performance, and we cannot assure you that such statements will be realized or that the events and circumstances they describe will occur. Factors that could cause actual results to differ materially from those anticipated or implied in the forward-looking statements herein include, but are not limited to: the timing and extent of changes in market conditions and prices for natural gas, oil and natural gas liquids (“NGLs”), including regional basis differentials and the impact of reduced demand for our production and products in which our production is a component due to governmental and societal actions taken in response to COVID-19 or other public health crises and any related company or governmental policies and actions to protect the health and safety of individuals or governmental policies or actions to maintain the functioning of national or global economies and markets; our ability to fund our planned capital investments; a change in our credit rating, an increase in interest rates and any adverse impacts from the discontinuation of the London Interbank Offered Rate; the extent to which lower commodity prices impact our ability to service or refinance our existing debt; the impact of volatility in the financial markets or other global economic factors; difficulties in appropriately allocating capital and resources among our strategic opportunities; the timing and extent of our success in discovering, developing, producing and estimating reserves; our ability to maintain leases that may expire if production is not established or profitably maintained; our ability to realize the expected benefits from recent acquisitions or the Proposed Transaction; costs in connection with the Proposed Transaction; the consummation of or failure to consummate the Proposed Transaction and the timing thereof; costs in connection with the Proposed Transaction; integration of operations and results subsequent to the Proposed Transaction; our ability to transport our production to the most favorable markets or at all; the impact of government regulation, including changes in law, the ability to obtain and maintain permits, any increase in severance or similar taxes, and legislation or regulation relating to hydraulic fracturing, climate and over-the-counter derivatives; the impact of the adverse outcome of any material litigation against us or judicial decisions that affect us or our industry generally; the effects of weather; increased competition; the financial impact of accounting regulations and critical accounting policies; the comparative cost of alternative fuels; credit risk relating to the risk of loss as a result of non-performance by our counterparties; and any other factors listed in the reports we have filed and may file with the SEC that are incorporated by reference herein. All written and oral forward-looking statements attributable to us are expressly qualified in their entirety by this cautionary statement.
Cautionary Note to U.S. InvestorsThe SEC permits oil and gas companies, in their filings with the SEC, to disclose only proved, probable and possible reserves. We use the terms "resource" and “EUR” in this presentation that the SEC’s guidelines prohibit us from including in filings with the SEC. The quarterly reserves data included in this release are estimates we prepared that have not been audited by our independent reserve engineers. All such estimates are inherently more speculative than estimates of proved reserves and are subject to substantially greater risk of actually being realized. U.S. investors are urged to consider closely the oil and gas disclosures and associated risk factors in our Form 10-K and other reports and filings with the SEC. Copies are available from the SEC and from the SWN website.
Use of Non-GAAP InformationThis presentation contains non-GAAP financial measures, such as adjusted net income, adjusted EBITDA and net cash flow, including certain key statistics and estimates. We report our financial results in accordance with accounting principles generally accepted in the United States of America (“GAAP”). However, management believes certain non-GAAP performance measures may provide users of this financial information additional meaningful comparisons between current results and the results of our peers and of prior periods. Please see the Appendix for definitions and reconciliations of the non-GAAP financial measures that are based on reconcilable historical information.
Cautionary Statements
Brittany Raiford832.796.7906
Bernadette Butler832.796.6079
Investor Relations Contacts
3
Important Additional Information will be Filed with the SECThis presentation is being made in respect of the proposed acquisition (the “Proposed Transaction”) of Indigo Natural Resources LLC ("Indigo") by Southwestern Energy Company ("SWN”). The issuance of the stock consideration for the Proposed Transaction will be submitted to the shareholders of SWN for their approval. In connection with the proposed transaction, SWN will file with the U.S. Securities and Exchange Commission (the "SEC") a proxy statement (the "proxy statement"). INVESTORS AND SHAREHOLDERS OF SWN ARE URGED TO CAREFULLY READ THE PROXY STATEMENT, AND OTHER RELEVANT DOCUMENTS TO BE FILED WITH THE SEC BY SWN, IN THEIR ENTIRETY WHEN THEY BECOME AVAILABLE BECAUSE THEY WILL CONTAIN IMPORTANT INFORMATION ABOUT SWN, INDIGO, THE PROPOSED TRANSACTION AND RELATEDMATTERS. The definitive proxy statement and other relevant materials (when they become available) and any other documents filed by SWN with the SEC may be obtained free of charge at the SEC’s website, at www.sec.gov or through SWN’s website at www.swn.com. These documents may also be obtained free of charge from SWN by requesting them by mail at Investor Relations, 10000 Energy Drive, Spring, Texas 77389, or by telephone at (832) 796-7906.
Participants in the SolicitationSWN and its directors, executive officers and certain other members of management and employees may be deemed to be participants in the solicitation of proxies from SWN’s shareholders with respect to the approval of the issuance of shares of SWN common stock in the Proposed Transaction. Information regarding the ownership of SWN's stock and other securities by SWN's directors and executive officers is included in SEC filings on Forms 3, 4, and 5, which can be found through SWN's website (www.swn.com) or through the SEC's website at www.sec.gov. Information can also be found in SWN's other SEC filings, including the company's Annual Report on Form 10-K for the fiscal year ended 2020 filed with the SEC on March 1, 2021, and its definitive proxy statement for the 2021 annual meeting of shareholders filed with the SEC on April 8, 2021. More detailed and updated information regarding the identity of potential participants, and their direct or indirect interests, by security holdings or otherwise, will be set forth in the proxy statement and other materials to be filed with the SEC in connection with the Proposed Transaction. Shareholders should read the proxy statement carefully when it becomes available before making any voting or other decisions.
Use of ProjectionsThe financial, operational, industry and market projections, estimates and targets in this presentation are forward-looking statements that are based on assumptions that are inherently subject to significant uncertainties and contingencies, many of which are beyond SWN's and Indigo's control. The assumptions and estimates underlying the projected, expected or target results are inherently uncertain and are subject to a wide variety of significant business, economic, regulatory and competitive risks and uncertainties that could cause actual results to differ materially from those contained in the financial, operational, industry and market projections, estimates and targets, including assumptions, risks and uncertainties described in "Forward-looking Statements" above.
Additional Information

4
Shareholder Returns Driven StrategyLeading natural gas powerhouse in a low carbon future
• Deliver free cash flow
• Enhance returns from disciplined capital allocation
• HSE / ESG is a core value
• Efficiently convert resource to reserves
• Drive value through development of organic and/or acquired Tier 1 assets
• Invest in highly economic projects that deliver strong corporate returns
• Maintain stringent cost management
• Expand margins
• Hedge to reduce commodity and basis risk while responsibly retaining access to upside
• Reduce debt
• Disciplined approach in evaluating strategic opportunities, considering economics, balance sheet, free cash flow and returns
• Prioritize transactions that enhance returns and deliver synergies
• Leverage track record of successful integration and execution
• Position SWN to capture the tangible benefits of scale
• Leverage competitive advantage in operated large-scale developments
• Further enhance well performance and reduce base decline
• Continue to integrate innovative technology
• Accelerate capital and operational efficiencies to drive down costs
• Optimize commercial and marketing agreements
• Vertical integration as a competitive advantage
CREATESUSTAINABLE VALUE
INCREASESCALE
PROGRESSBEST-IN-CLASS EXECUTION
PROTECTFINANCIAL STRENGTH
5
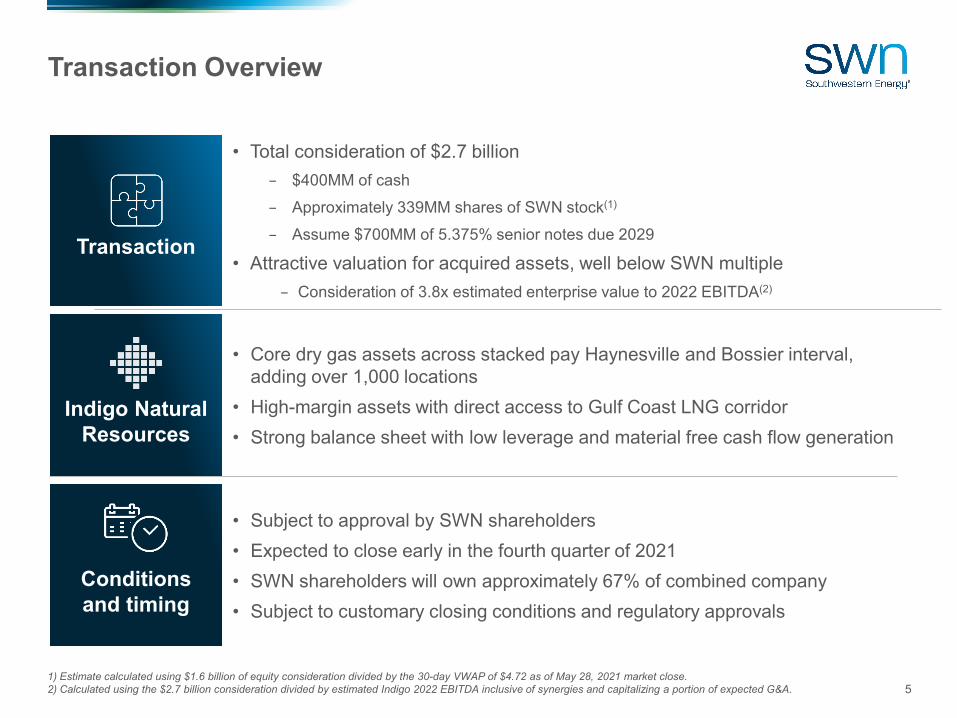
• Total consideration of $2.7 billion– $400MM of cash – Approximately 339MM shares of SWN stock(1)
– Assume $700MM of 5.375% senior notes due 2029
• Attractive valuation for acquired assets, well below SWN multiple– Consideration of 3.8x estimated enterprise value to 2022 EBITDA(2)
Transaction Overview
1) Estimate calculated using $1.6 billion of equity consideration divided by the 30-day VWAP of $4.72 as of May 28, 2021 market close.2) Calculated using the $2.7 billion consideration divided by estimated Indigo 2022 EBITDA inclusive of synergies and capitalizing a portion of expected G&A.
• Core dry gas assets across stacked pay Haynesville and Bossier interval, adding over 1,000 locations
• High-margin assets with direct access to Gulf Coast LNG corridor• Strong balance sheet with low leverage and material free cash flow generation
• Subject to approval by SWN shareholders• Expected to close early in the fourth quarter of 2021• SWN shareholders will own approximately 67% of combined company• Subject to customary closing conditions and regulatory approvals
Transaction
Indigo Natural Resources
Conditions and timing
6
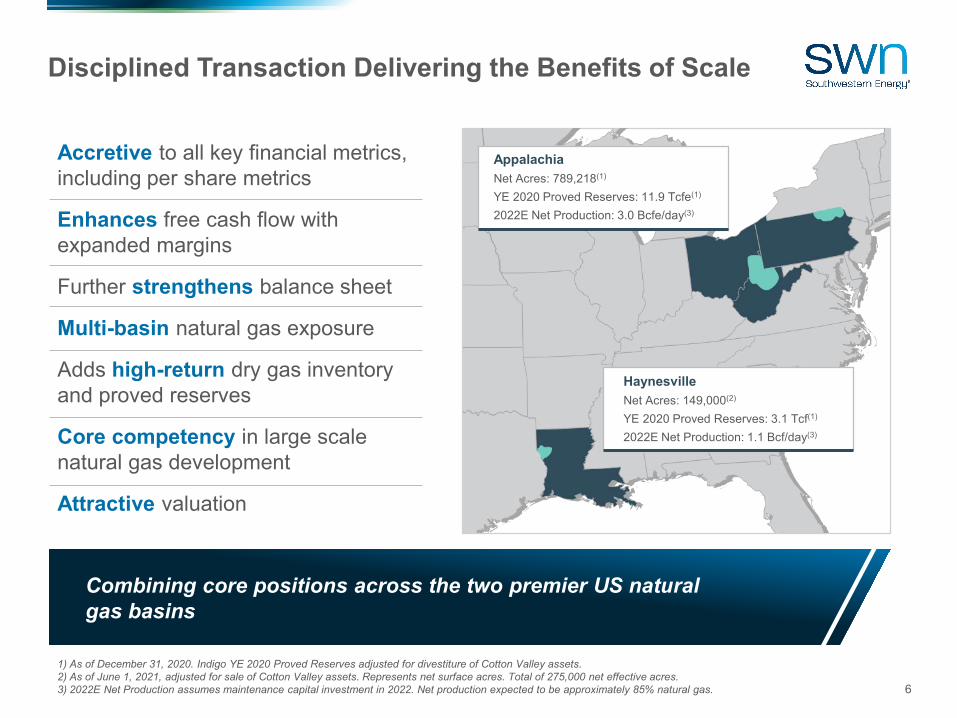
Accretive to all key financial metrics, including per share metrics
Enhances free cash flow with expanded margins
Further strengthens balance sheet
Multi-basin natural gas exposure
Adds high-return dry gas inventory and proved reserves
Core competency in large scale natural gas development
Attractive valuation
Disciplined Transaction Delivering the Benefits of Scale
Combining core positions across the two premier US natural gas basins
HaynesvilleNet Acres: 149,000(2)
YE 2020 Proved Reserves: 3.1 Tcf(1)
2022E Net Production: 1.1 Bcf/day(3)
AppalachiaNet Acres: 789,218(1)
YE 2020 Proved Reserves: 11.9 Tcfe(1)
2022E Net Production: 3.0 Bcfe/day(3)
1) As of December 31, 2020. Indigo YE 2020 Proved Reserves adjusted for divestiture of Cotton Valley assets.2) As of June 1, 2021, adjusted for sale of Cotton Valley assets. Represents net surface acres. Total of 275,000 net effective acres.3) 2022E Net Production assumes maintenance capital investment in 2022. Net production expected to be approximately 85% natural gas.
7
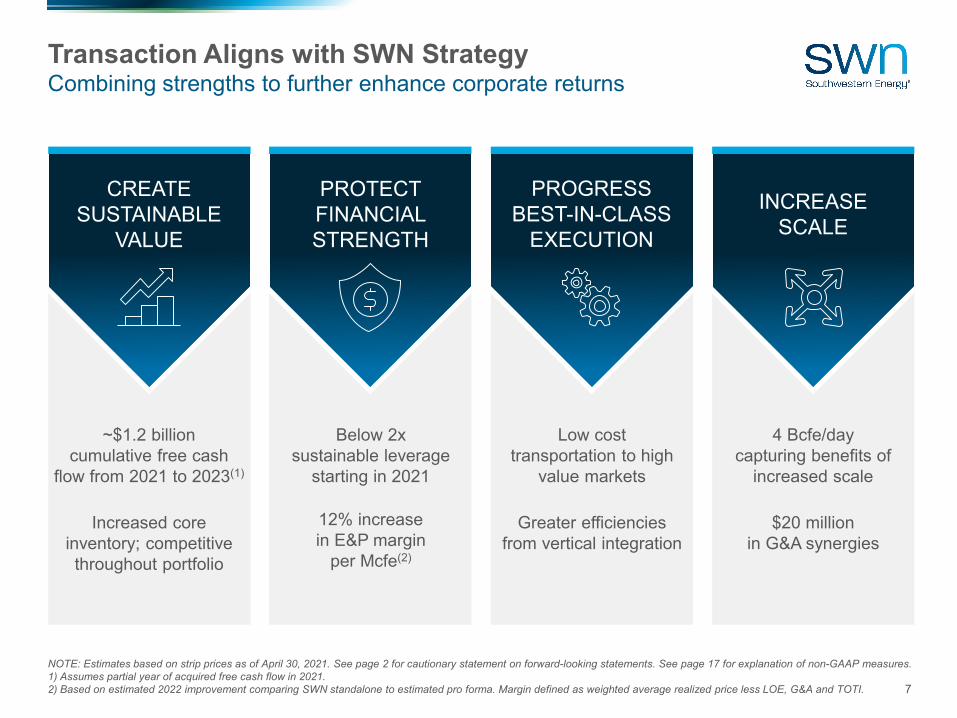
Transaction Aligns with SWN StrategyCombining strengths to further enhance corporate returns
~$1.2 billioncumulative free cash
flow from 2021 to 2023(1)
Increased coreinventory; competitive throughout portfolio
CREATESUSTAINABLE
VALUE
4 Bcfe/daycapturing benefits of
increased scale
$20 millionin G&A synergies
INCREASESCALE
Low costtransportation to high
value markets
Greater efficiencies from vertical integration
PROGRESS BEST-IN-CLASS
EXECUTION
Below 2xsustainable leverage
starting in 2021
12% increasein E&P margin
per Mcfe(2)
PROTECT FINANCIAL STRENGTH
NOTE: Estimates based on strip prices as of April 30, 2021. See page 2 for cautionary statement on forward-looking statements. See page 17 for explanation of non-GAAP measures. 1) Assumes partial year of acquired free cash flow in 2021.2) Based on estimated 2022 improvement comparing SWN standalone to estimated pro forma. Margin defined as weighted average realized price less LOE, G&A and TOTI.
8
LOUISIANA
TEXAS
SABINE
DESOTO
RED RIVER
NATCHIT
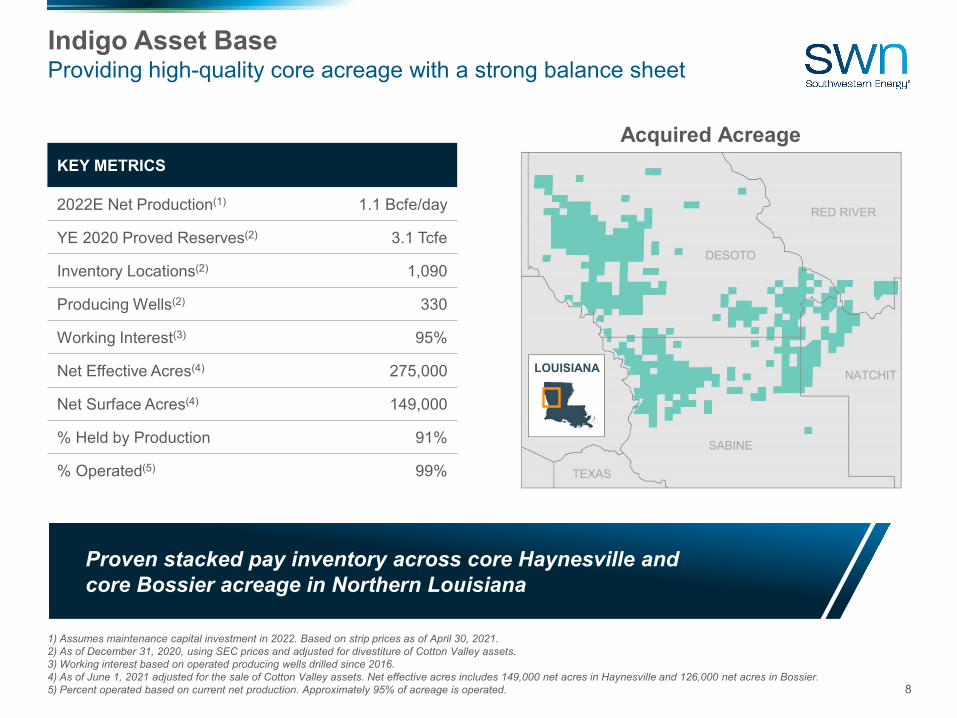
KEY METRICS
2022E Net Production(1) 1.1 Bcfe/day
YE 2020 Proved Reserves(2) 3.1 Tcfe
Inventory Locations(2) 1,090
Producing Wells(2) 330
Working Interest(3) 95%
Net Effective Acres(4) 275,000
Net Surface Acres(4) 149,000
% Held by Production 91%
% Operated(5) 99%
Indigo Asset BaseProviding high-quality core acreage with a strong balance sheet
Acquired Acreage
1) Assumes maintenance capital investment in 2022. Based on strip prices as of April 30, 2021.2) As of December 31, 2020, using SEC prices and adjusted for divestiture of Cotton Valley assets.3) Working interest based on operated producing wells drilled since 2016. 4) As of June 1, 2021 adjusted for the sale of Cotton Valley assets. Net effective acres includes 149,000 net acres in Haynesville and 126,000 net acres in Bossier.5) Percent operated based on current net production. Approximately 95% of acreage is operated.
Proven stacked pay inventory across core Haynesville and core Bossier acreage in Northern Louisiana
9
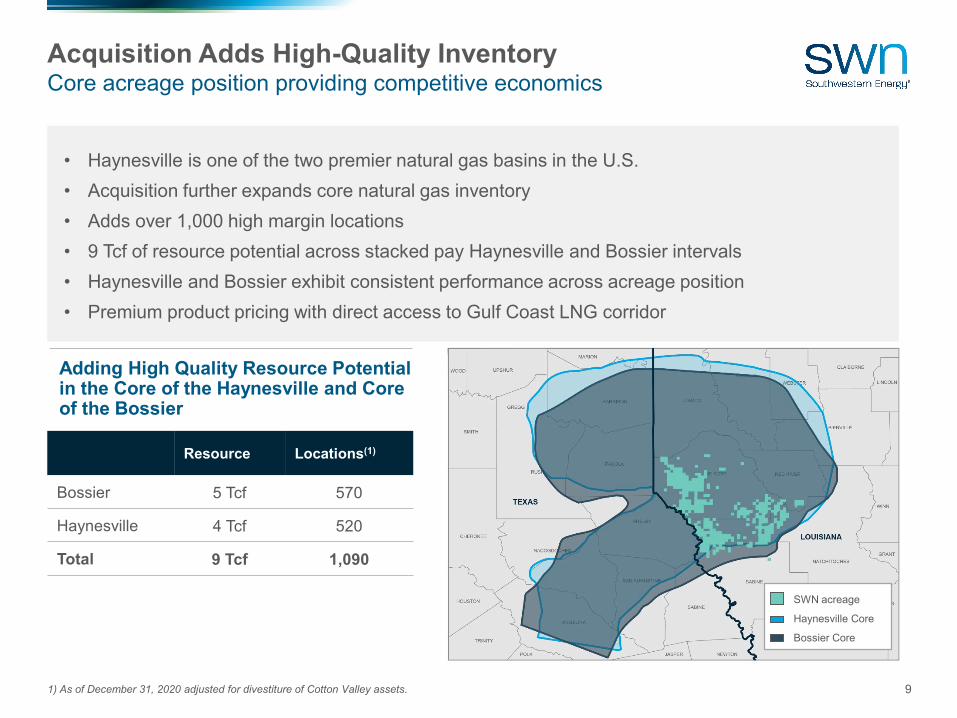
• Haynesville is one of the two premier natural gas basins in the U.S.• Acquisition further expands core natural gas inventory• Adds over 1,000 high margin locations• 9 Tcf of resource potential across stacked pay Haynesville and Bossier intervals• Haynesville and Bossier exhibit consistent performance across acreage position• Premium product pricing with direct access to Gulf Coast LNG corridor
Acquisition Adds High-Quality InventoryCore acreage position providing competitive economics
Adding High Quality Resource Potential in the Core of the Haynesville and Core of the Bossier
Resource Locations(1)
Bossier 5 Tcf 570
Haynesville 4 Tcf 520
Total 9 Tcf 1,090
1) As of December 31, 2020 adjusted for divestiture of Cotton Valley assets.
SWN acreage
Haynesville Core
Bossier Core
10
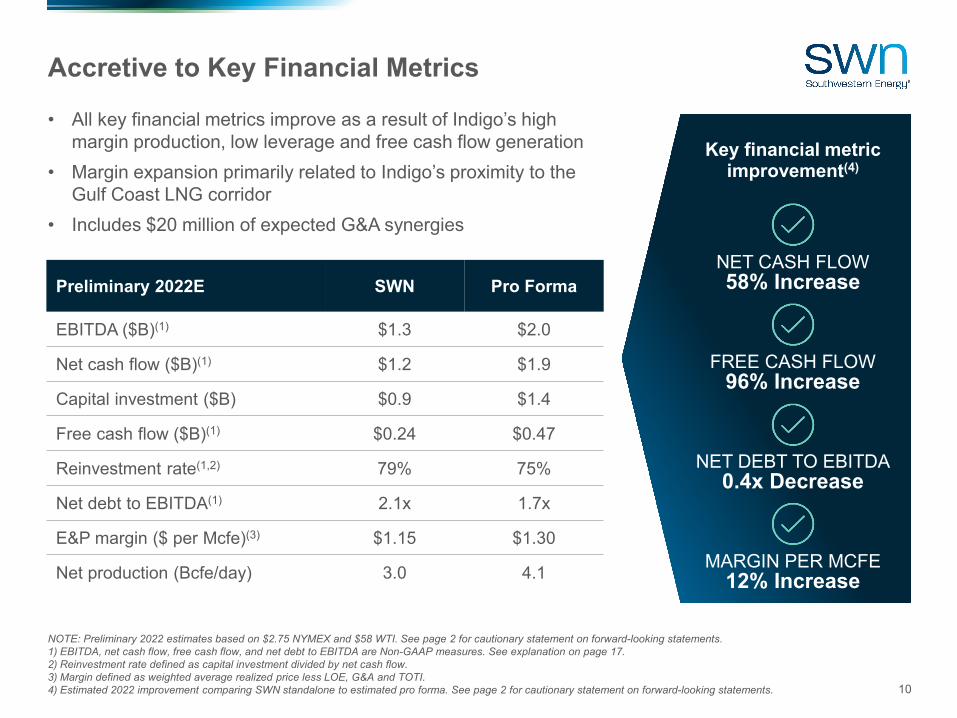
• All key financial metrics improve as a result of Indigo’s high margin production, low leverage and free cash flow generation
• Margin expansion primarily related to Indigo’s proximity to the Gulf Coast LNG corridor
• Includes $20 million of expected G&A synergies
Accretive to Key Financial Metrics
NOTE: Preliminary 2022 estimates based on $2.75 NYMEX and $58 WTI. See page 2 for cautionary statement on forward-looking statements.1) EBITDA, net cash flow, free cash flow, and net debt to EBITDA are Non-GAAP measures. See explanation on page 17. 2) Reinvestment rate defined as capital investment divided by net cash flow. 3) Margin defined as weighted average realized price less LOE, G&A and TOTI. 4) Estimated 2022 improvement comparing SWN standalone to estimated pro forma. See page 2 for cautionary statement on forward-looking statements.
NET CASH FLOW58% Increase
FREE CASH FLOW96% Increase
NET DEBT TO EBITDA0.4x Decrease
MARGIN PER MCFE12% Increase
Key financial metric improvement(4)
Preliminary 2022E SWN Pro Forma
EBITDA ($B)(1) $1.3 $2.0
Net cash flow ($B)(1) $1.2 $1.9
Capital investment ($B) $0.9 $1.4
Free cash flow ($B)(1) $0.24 $0.47
Reinvestment rate(1,2) 79% 75%
Net debt to EBITDA(1) 2.1x 1.7x
E&P margin ($ per Mcfe)(3) $1.15 $1.30
Net production (Bcfe/day) 3.0 4.1
11
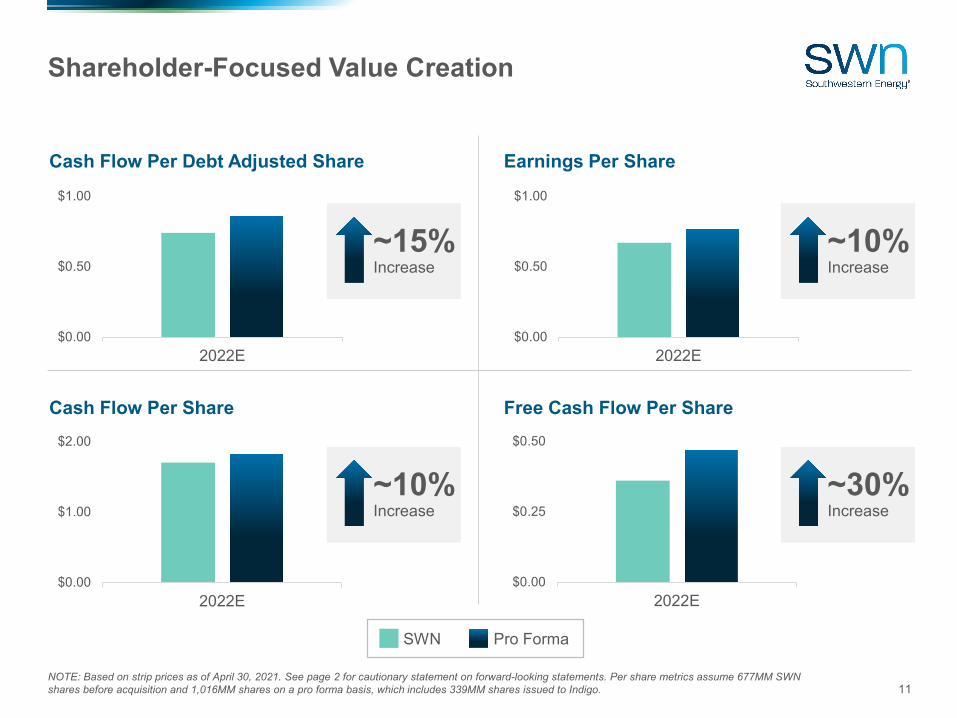
Shareholder-Focused Value Creation
$0.00
$0.50
$1.00
2022E$0.00
$0.50
$1.00
2022E
$0.00
$1.00
$2.00
2022E$0.00
$0.25
$0.50
2022E
Cash Flow Per Debt Adjusted Share
Free Cash Flow Per ShareCash Flow Per Share
Earnings Per Share
~15%Increase
SWN Pro Forma
NOTE: Based on strip prices as of April 30, 2021. See page 2 for cautionary statement on forward-looking statements. Per share metrics assume 677MM SWN shares before acquisition and 1,016MM shares on a pro forma basis, which includes 339MM shares issued to Indigo.
~10%Increase
~30%Increase
~10%Increase
12
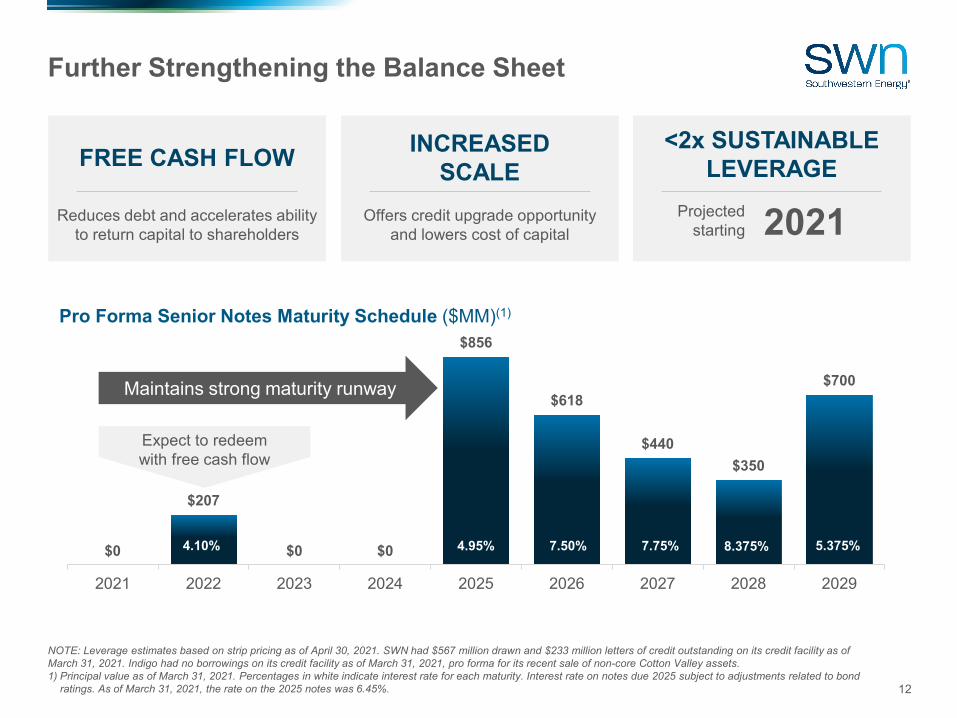
$0
$207
$0 $0
$856
$618
$440$350
$700
2021 2022 2023 2024 2025 2026 2027 2028 2029
Further Strengthening the Balance Sheet
Pro Forma Senior Notes Maturity Schedule ($MM)(1)
NOTE: Leverage estimates based on strip pricing as of April 30, 2021. SWN had $567 million drawn and $233 million letters of credit outstanding on its credit facility as of March 31, 2021. Indigo had no borrowings on its credit facility as of March 31, 2021, pro forma for its recent sale of non-core Cotton Valley assets. 1) Principal value as of March 31, 2021. Percentages in white indicate interest rate for each maturity. Interest rate on notes due 2025 subject to adjustments related to bond
ratings. As of March 31, 2021, the rate on the 2025 notes was 6.45%.
4.95% 7.50% 7.75% 8.375%
INCREASED SCALE
Offers credit upgrade opportunity and lowers cost of capital 2021Projected
starting
Maintains strong maturity runway
Expect to redeem with free cash flow
<2x SUSTAINABLE LEVERAGE
5.375%4.10%
FREE CASH FLOW
Reduces debt and accelerates ability to return capital to shareholders
13
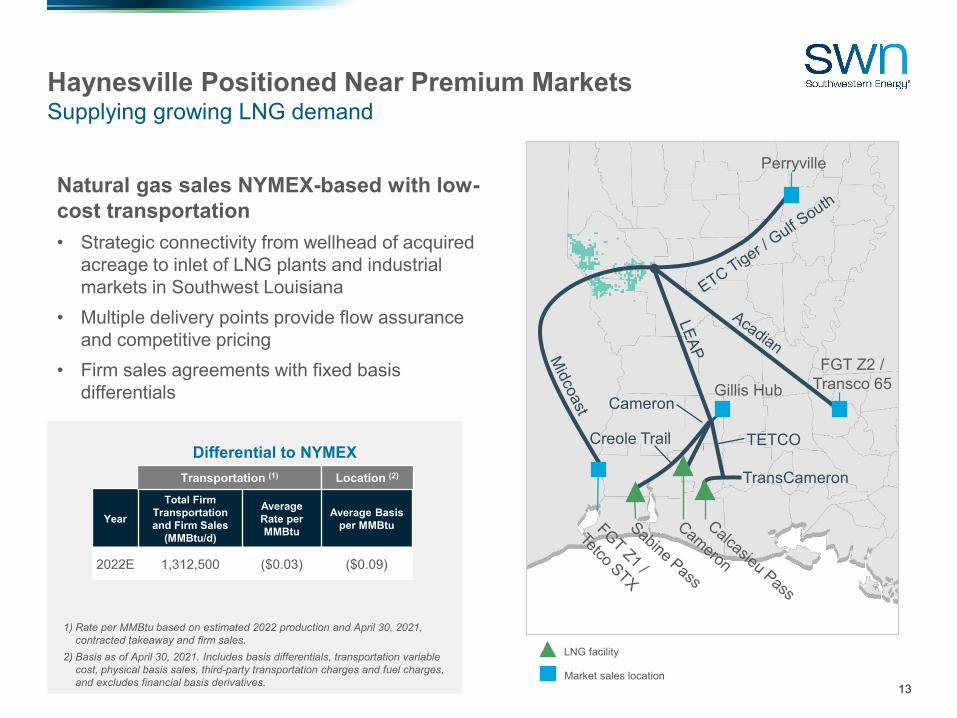
Natural gas sales NYMEX-based with low-cost transportation• Strategic connectivity from wellhead of acquired
acreage to inlet of LNG plants and industrial markets in Southwest Louisiana
• Multiple delivery points provide flow assurance and competitive pricing
• Firm sales agreements with fixed basis differentials
Haynesville Positioned Near Premium MarketsSupplying growing LNG demand
1) Rate per MMBtu based on estimated 2022 production and April 30, 2021, contracted takeaway and firm sales.
2) Basis as of April 30, 2021. Includes basis differentials, transportation variable cost, physical basis sales, third-party transportation charges and fuel charges, and excludes financial basis derivatives.
1
Differential to NYMEX
Year
Total Firm Transportation and Firm Sales
(MMBtu/d)
Average Rate per MMBtu
Average Basis per MMBtu
2022E 1,312,500 ($0.03) ($0.09)
Transportation (1) Location (2)
13
LNG facility
FGT Z2 / Transco 65Gillis Hub
TETCO
TransCameron
Cameron
Creole Trail
Perryville
Market sales location
14
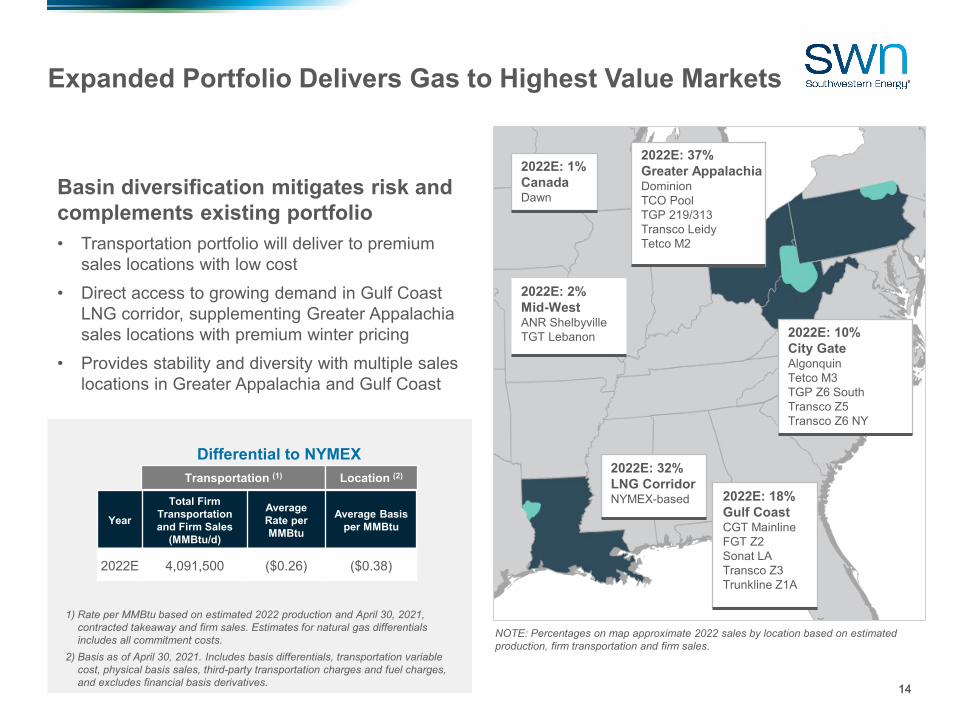
Basin diversification mitigates risk and complements existing portfolio• Transportation portfolio will deliver to premium
sales locations with low cost• Direct access to growing demand in Gulf Coast
LNG corridor, supplementing Greater Appalachia sales locations with premium winter pricing
• Provides stability and diversity with multiple sales locations in Greater Appalachia and Gulf Coast
Expanded Portfolio Delivers Gas to Highest Value Markets
1) Rate per MMBtu based on estimated 2022 production and April 30, 2021, contracted takeaway and firm sales. Estimates for natural gas differentials includes all commitment costs.
2) Basis as of April 30, 2021. Includes basis differentials, transportation variable cost, physical basis sales, third-party transportation charges and fuel charges, and excludes financial basis derivatives.
2022E: 18%Gulf CoastCGT MainlineFGT Z2Sonat LATransco Z3Trunkline Z1A
2022E: 10%City GateAlgonquinTetco M3TGP Z6 SouthTransco Z5Transco Z6 NY
Differential to NYMEX
Year
Total Firm Transportation and Firm Sales
(MMBtu/d)
Average Rate per MMBtu
Average Basis per MMBtu
2022E 4,091,500 ($0.26) ($0.38)
Transportation (1) Location (2)
2022E: 2%Mid-WestANR ShelbyvilleTGT Lebanon
2022E: 1%CanadaDawn
2022E: 32%LNG CorridorNYMEX-based
NOTE: Percentages on map approximate 2022 sales by location based on estimated production, firm transportation and firm sales.
14
2022E: 37%Greater AppalachiaDominionTCO PoolTGP 219/313Transco LeidyTetco M2

15
Experienced multi-basin operator
Proficiently integrated previous acquisitions
Competitive advantage in large-scale natural gas development
Talented marketing team experienced with Gulf Coast markets
Key Haynesville operating and technical capabilities expected to be retained
Vertically integrated business provides upside value opportunities
Proven operational execution, including well cost reductions and base decline management
Operational Expertise Provides Advantage in New Basin
BEST-IN-CLASS EXECUTION Positioned for Success in Haynesville

16
DISCIPLINED CAPITAL ALLOCATIONAsset flexibility with diverse commodity profile competing for capital and enhancing returns
FREE CASH FLOWMaintenance capital program delivering meaningful free cash flow
BALANCE SHEET STRENGTHLow leverage and leading debt maturity runway
OPERATIONAL EXCELLENCE & LOGISTICS MANAGEMENTSWN-owned and operated drilling rigs and frac fleet; integrated piped water systems
DIVERSE TRANSPORTATION PORTFOLIODelivering to premium markets
TIER 1 NATURAL GAS ASSET BASEHighly economic dry gas inventory across Appalachia and Haynesville
STRINGENT COST MANAGEMENTTop quartile well costs; broad reductions across all expense categories
RECOGNIZED ESG LEADERSHIPLow GHG and methane intensity; recognized chemical disclosure and management; leading corporate governance standards
PROVEN MANAGEMENT TEAMHighly experienced, dynamic team focused on long-term value creation
Why Invest in SWN?
MARGIN ENHANCING LIQUIDS PRODUCTION Highest condensate yield acreage in Appalachia
Delivering today, capturing tomorrow
17
Net debt is defined as short-term debt plus long-term debt less cash and cash equivalents. EBITDA is defined as net income (loss) plus interest, income tax expense (benefit), depreciation, depletion and amortization, expenses associated with the restructuring charges, impairments, legal settlements and gains (losses) on unsettled derivatives less gains (losses) on sale of assets and gains on early extinguishment of debt over the prior 12-month period. Net cash flow is defined as cash flow from operating activities before changes in operating assets and liabilities. Free cash flow is defined as net cash flow less accrual-based capital expenditures and estimates free cash flow for future periods is based on strip pricing as of April 30, 2021. Southwestern has included information concerning Net debt / EBITDA because it is used by certain investors as a measure of the ability of a company to service or incur indebtedness and because it is a financial measure commonly used in the energy industry. Net debt / EBITDA should not be considered in isolation or as a substitute for net income, net cash provided by operating activities or other income or cash flow data prepared in accordance with generally accepted accounting principles or as a measure of the Company's profitability or liquidity. Net debt / EBITDA, as defined above, may not be comparable to similarly titled measures of other companies. These adjusted amounts are not a measure of financial performance under GAAP.
The Company does not provide a reconciliation to estimated Free Cash Flow because the Company does not provide the GAAP financial measures of net income or loss or net cash provided by operating activities on a forward-looking basis because it is unable to predict, without unreasonable effort, certain components thereof including, but not limited to capital expenditures, production and realized prices for production. These items are inherently uncertain and depend on various factors, many of which are beyond its control. As such, any associated estimate and its impact on GAAP performance and cash flow measures could vary materially based on a variety of acceptable management assumptions.
Explanation of Non-GAAP Measures