acoustic microscopy: resolution subcellular · ningacoustic microscopy for the analysis of...
TRANSCRIPT
Proc. Nati. Acad. Sci. USAVol. 76, No. 7, pp. 3325-3829, July 1979Biophysics
Acoustic microscopy: Resolution of subcellular detail(ultrasound/mechanical properties/cytoplasmic thickness/nuclei, actin cables, and mitochondria)
R. N. JOHNSTON*, A. ATALARt, J. HEISERMANt, V. JIPSONt, AND C. F. QUATEtt*Department of Biological Sciences, and tEdward L. Ginzton Laboratory, Stanford University, Stanford, California 94305
Contributed by C. F. Quate, April 24, 1979
ABSTRACT Recent advances now permit the use of scan-ning acoustic microscopy for the analysis of subcellular com-ponents. By sequential viewing of identified fixed cells withacoustic, light, and electron microscopy, we have establishedthat the acoustic microscope can readily detect such featuresas nuclei and nucleoli, mitochondria, and actin cables. Underoptimal conditions, images can even be obtained of filopodia,slender projections of the cell surface that are approximately0.1-0.2 Jim in diameter. Small objects separated by as little as0.5-0.7 jum can successfully be resolved. Three aspects of theacoustic micrographs prepared in this preliminary survey seemespecially prominent. These are, first, the extraordinary levelof acoustic contrast that can differentiate the various cyto-plasmic organelles, even in regions of very thin cytoplasm;second, the reversals in acoustic contrast that occur when al-tering the plane of focus; and third, the sensitivity of the acousticresponse to overall cytoplasmic thickness. The acoustic micro-scope uses a novel source of contrast that is based on local me-chanical properties. In addition, it can provide a degree of res-olution that is comparable to that of the light microscope.
Much of our current understanding of cellular structure andfunction has been gained through the application of a varietyof microscopic techniques. With light microscopy, advancesin the methods of fixation and staining [for example, the recentdevelopment of immunofluorescence microscopy (see ref. 1)]and in optical systems [for example, phase contrast (2), Nom-arski (3), Hoffman modulation (4), and polarized light mi-croscopy (5)] have permitted major increases in knowledgeabout both living and fixed biological material. The electronmicroscope, in both the transmission and scanning modes, hasof course greatly extended our understanding of the finestructure of nonliving preparations.We now report the application of a novel type of microscopy,
acoustic microscopy, to the analysis of subcellular components.We compare images obtained in the acoustic microscope withimages of the same cells obtained by light and electron mi-croscopy. This report is an update of an earlier paper (6), inwhich the visualization of single cells with the scanning acousticmicroscope was first described. Since then, advances in acoustictechnology have permitted major increases in resolution to alevel now comparable to that of light microscopy (7). The im-petus toward development of the acoustic microscope rests onthe unique method of analysis, the use of high-frequency soundwaves. The properties detected by acoustic radiation are dif-ferent from those detected by either light or electron radiation,and present exciting possibilities for the examination, in afundamentally new way, of biological material.
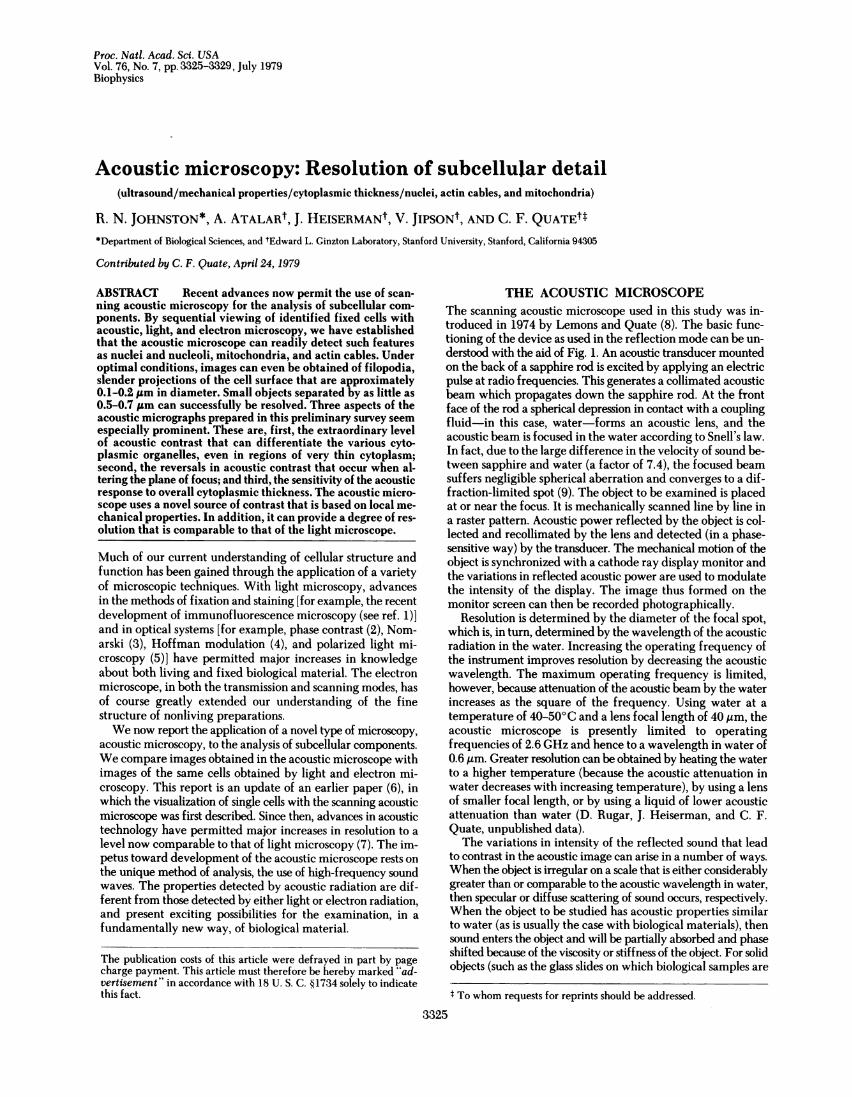
THE ACOUSTIC MICROSCOPEThe scanning acoustic microscope used in this study was in-troduced in 1974 by Lemons and Quate (8). The basic func-tioning of the device as used in the reflection mode can be un-derstood with the aid of Fig. 1. An acoustic transducer mountedon the back of a sapphire rod is excited by applying an electricpulse at radio frequencies. This generates a collimated acousticbeam which propagates down the sapphire rod. At the frontface of the rod a spherical depression in contact with a couplingfluid-in this case, water-forms an acoustic lens, and theacoustic beam is focused in the water according to Snell's law.In fact, due to the large difference in the velocity of sound be-tween sapphire and water (a factor of 7.4), the focused beamsuffers negligible spherical aberration and converges to a dif-fraction-limited spot (9). The object to be examined is placedat or near the focus. It is mechanically scanned line by line ina raster pattern. Acoustic power reflected by the object is col-lected and recollimated by the lens and detected (in a phase-sensitive way) by the transducer. The mechanical motion of theobject is synchronized with a cathode ray display monitor andthe variations in reflected acoustic power are used to modulatethe intensity of the display. The image thus formed on themonitor screen can then be recorded photographically.
Resolution is determined by the diameter of the focal spot,which is, in turn, determined by the wavelength of the acousticradiation in the water. Increasing the operating frequency ofthe instrument improves resolution by decreasing the acousticwavelength. The maximum operating frequency is limited,however, because attenuation of the acoustic beam by the waterincreases as the square of the frequency. Using water at atemperature of 40-500C and a lens focal length of 40 Am, theacoustic microscope is presently limited to operatingfrequencies of 2.6 GHz and hence to a wavelength in water of0.6 gim. Greater resolution can be obtained by heating the waterto a higher temperature (because the acoustic attenuation inwater decreases with increasing temperature), by using a lensof smaller focal length, or by using a liquid of lower acousticattenuation than water (D. Rugar, J. Heiserman, and C. F.Quate, unpublished data).The variations in intensity of the reflected sound that lead
to contrast in the acoustic image can arise in a number of ways.When the object is irregular on a scale that is either considerablygreater than or comparable to the acoustic wavelength in water,then specular or diffuse scattering of sound occurs, respectively.When the object to be studied has acoustic properties similarto water (as is usually the case with biological materials), thensound enters the object and will be partially absorbed and phaseshifted because of the viscosity or stiffness of the object. For solidobjects (such as the glass slides on which biological samples are
t To whom requests for reprints should be addressed.
3325
The publication costs of this article were defrayed in part by pagecharge payment. This article must therefore be hereby marked "ad-vertisement" in accordance with 18 U. S. C. §1734 solely to indicatethis fact.
Proc. Nati. Acad. Sci. USA 76 (1979)
\ 'I REEFLECTINGOBJECT
'I
ANDDISPLAYI'j~~
scope.jt
2 11H20OUTPUT iiiTO AMPLIFIERI iAND DISPLAY
x-y SCANNING
FIG. 1. Schematic illustration of the scanning acoustic micro-scope. See text for details of operation.frequently mounted for observation), most of the sound is re-flected but, depending on the position of focus, phase shifts maybe introduced in the process of reflection. These events can all
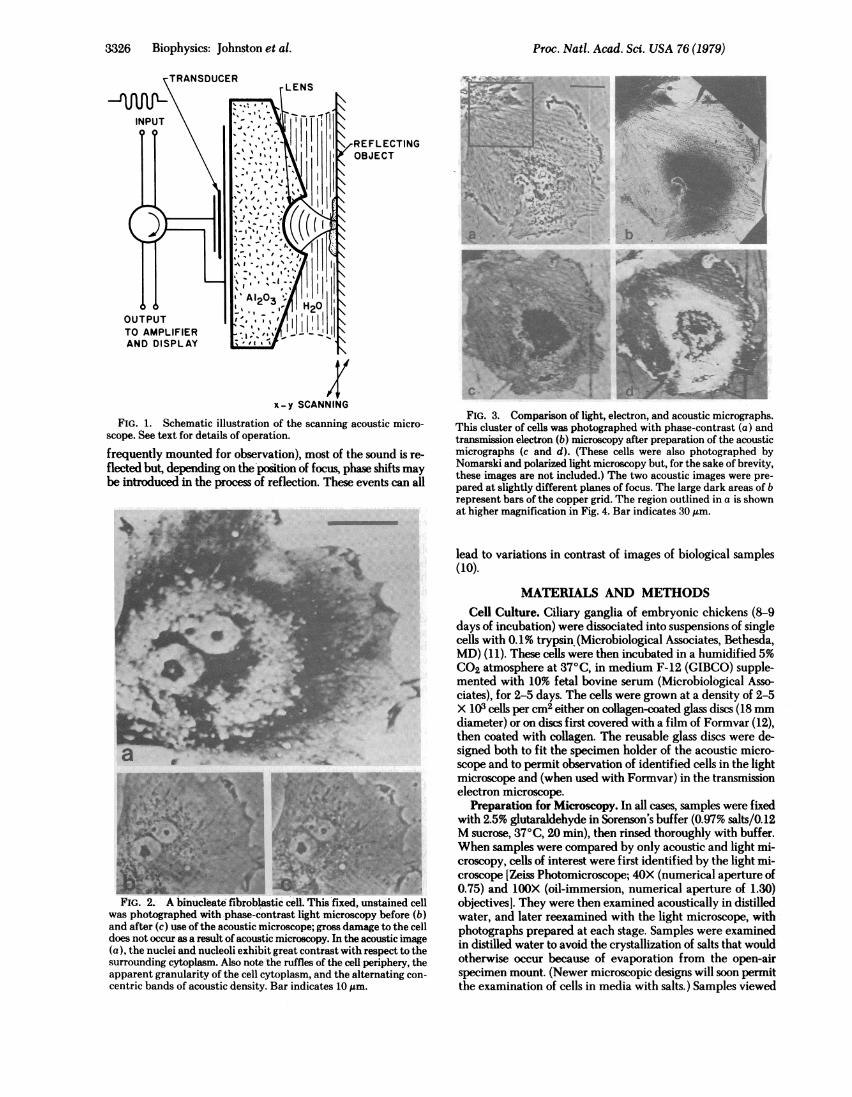
FIG. 2. A binucleate fibroblastic cell. This fixed, unstained cellwas photographed with phase-contrast light microscopy before (b)and after (c) use ofthe acoustic microscope; gross damage to the celldoes not occur as a result of acoustic microscopy. In the acoustic image(a), the nuclei and nucleoli exhibit great contrast with respect to thesurrounding cytoplasm. Also note the ruffles of the cell periphery, theapparent granularity of the cell cytoplasm, and the alternating con-centric bands of acoustic density. Bar indicates 10 ,m.
b
FIG. 3. Comparison of light, electron, and acoustic micrographs.This cluster of cells was photographed with phase-contrast (a) andtransmission electron (b) microscopy after preparation of the acousticmicrographs (c and d). (These cells were also photographed byNomarski and polarized light microscopy but, for the sake of brevity,these images are not included.) The two acoustic images were pre-pared at slightly different planes of focus. The large dark areas of brepresent bars of the copper grid. The region outlined in a is shownat higher magnification in Fig. 4. Bar indicates 30 ,m.
lead to variations in contrast of images of biological samples(10).
MATERIALS AND METHODSCell Culture. Ciliary ganglia of embryonic chickens (8-9
days of incubation) were dissociated into suspensions of singlecells with 0.1% trypsin. (Microbiological Associates, Bethesda,MD) (11). These cells were then incubated in a humidified 5%CO2 atmosphere at 370C, in medium F-12 (GIBCO) supple-mented with 10% fetal bovine serum (Microbiological Asso-ciates), for 2-5 days. The cells were grown at a density of 2-5X 10³ cells per cm2 either on collagen-coated glass discs (18mmdiameter) or on discs first covered with a film of Formvar (12),then coated with collagen. The reusable glass discs were de-signed both to fit the specimen holder of the acoustic micro-scope and to permit observation of identified cells in the lightmicroscope and (when used with Formvar) in the transmissionelectron microscope.
Preparation for Microscopy. In all cases, samples were fixedwith 2.5% glutaraldehyde in Sorenson's buffer (0.97% salts/0.12M sucrose, 370C, 20 min), then rinsed thoroughly with buffer.When samples were compared by only acoustic and light mi-croscopy, cells of interest were first identified by the light mi-croscope [Zeiss Photomicroscope; 40X (numerical aperture of0.75) and lOOX (oil-immersion, numerical aperture of 1.30)objectives]. They were then examined acoustically in distilledwater, and later reexamined with the light microscope, withphotographs prepared at each stage. Samples were examinedin distilled water to avoid the crystallization of salts that wouldotherwise occur because of evaporation from the open-airspecimen mount. (Newer microscopic designs will soon permitthe examination of cells in media with salts.) Samples viewed
-3"'226 Biophysics: Johnston et al.
Proc. Natl. Acad. Sci. USA 76 (1979) 3327
ret~~~~d p a. ~.v<-**
4,~~~~~~~~~~~~~~~~~~k~
I_ _ sf . ssi4'& r ig-mu
F. A, A -
.s, F i 2 '.'>'~~~~~~~~iE tBit
44rOMQW-M
_;Sv 2! ~~U As A n atd *A
FI. 4. Reio of celua ineacin Thi reio is shw at a loe magnfictioin.Fi.3iTeaostcmcorp])rpeeth
a ,.
_ok ~~~~~~~~~~~~~~~~~~~~~~~~~~~~~-.sI1,-.e
_,A asM
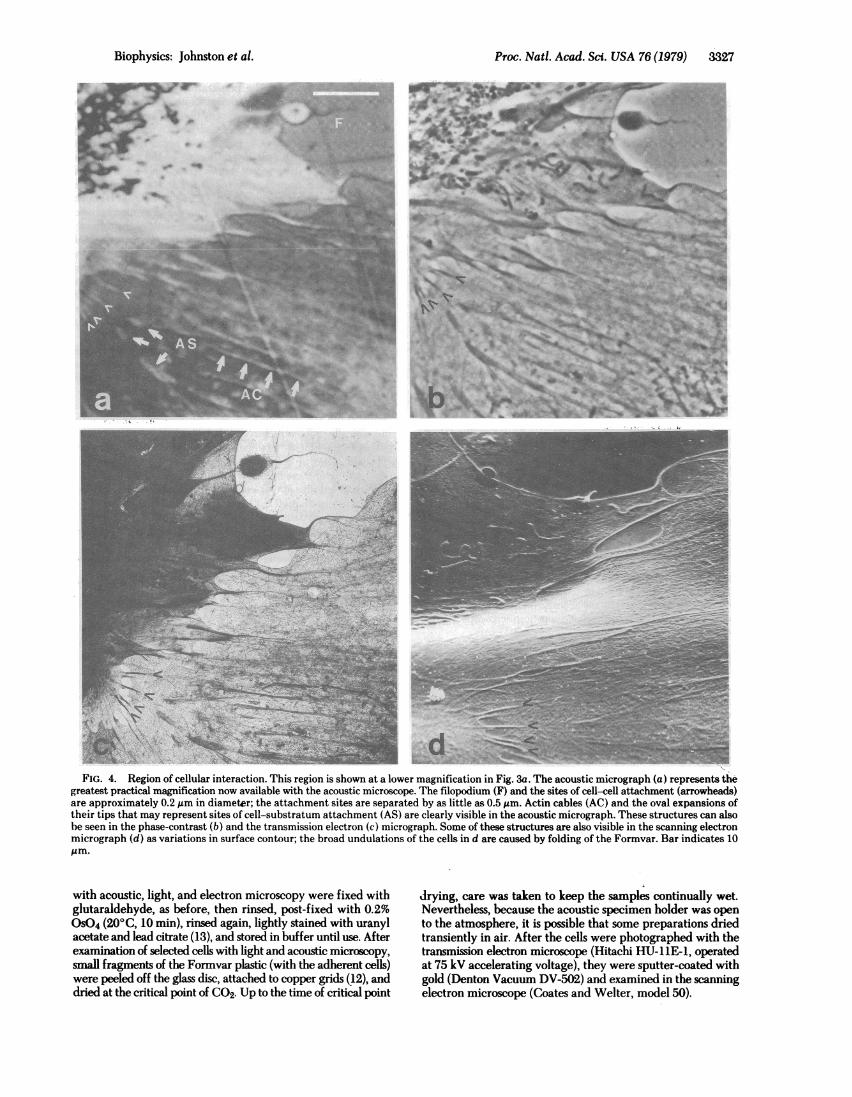
FIG. 4. Region of cellular interaction. This region is shown at a lower magnification in Fig. 3a. The acoustic micrograph (a) represents thegreatest practical magnification now available with the acoustic microscope. Theellopodium (F) and the sites of cell-cell attachment (arrowheads)are approximately 0.2 ,m in diametgr; the attachment sites are separated by as little as 0.5 Am. Actin cables (AC) and the oval expansions oftheir tips that may represent sites of cell-substratum attachment (AS) are clearly visible in the acoustic micrograph. These structures can alsobe seen in the phase-contrast (b) and the transmission electron (c) micrograph. Someof(thesestructures are also visible in the scanning electronmicrograph (d) as variations in surface contour; the broad undulations of the cells in d are caused by folding of the Forevar. Bar indicates 10
with acoustic, light, and electron microscopy were fixed with drying, care was taken to keep the samples continually wet.glutaraldehyde, as before, then rinsed, post-fixed with 0.2% Nevertheless, because the acoustic'specimen holder was openOS04 (20°C, 10 min), ninsed again, lightly stained with uranyl to the atmosphere,, it is possible that some preparations driedacetate and lead citrate (13), and stored in buffer until use. After transiently in air. After the cells were photographed with theexamination of selected cells with light and acoustic microscopy, transmission electron microscope (Hitachi HU-11E-1, operatedsmall fragments of the Formvar plastic (with the adherent cells) at 75 kV accelerating voltage), they were sputter-coated withwere peeled off the glass disc, attached to copper grids (12), and gold (Denton Vacuum DV-502) and examined in the scanningdried at the critical point of CO2. Up to the time of critical point electron microscope (Coates and Welter, model 50).
Biophysics: Johnston et al.
Proc. Natl. Acad. Sci. USA 76 (1979)
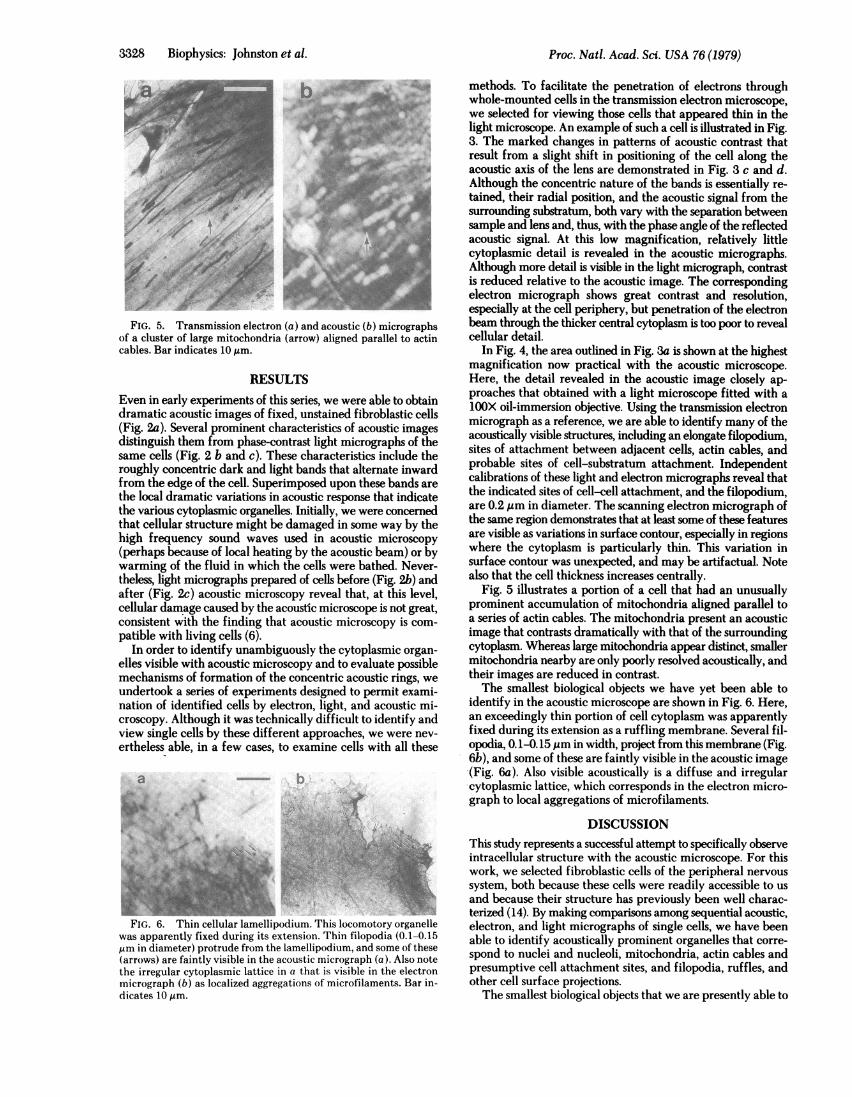
FIG. 5. Transmission electron (a) and acoustic (b) micrographsof a cluster of large mitochondria (arrow) aligned parallel to actin
cables. Bar indicates 10 Am.
RESULTS
Even in early experiments of this series, we were able to obtain
dramatic acoustic images of fixed, unstained fibroblastic cells
(Fig. 2a). Several prominent characteristics of acoustic images
distinguish them from phase-contrast light micrographs of the
same cells (Fig. 2 b and c). These characteristics include the
roughly concentric dark and light bands that alternate inward
from the edge of the cell. Superimposed upon these bands are
the local dramatic variations in acoustic response that indicate
the various cytoplasmic organelles. Initially, we were concerned
that cellular structure might be damaged in some way by the
high frequency sound waves used in acoustic microscopy(perhaps because of local heating by the acoustic beam) or bywarming of the fluid in which the cells were bathed. Never-
theless, light micrographs prepared of cells before (Fig. 2b) and
after (Fig. 2c acoustic microscopy reveal that, at this level,cellular damage caused by the acoustic microscope is not great,
consistent with the finding that acoustic microscopy is com-patible with living cells (6).
In order to identify unambiguously the cytoplasmic organ-
elles visible with acoustic microscopy and to evaluate possiblemechanisms of formation of the concentric acoustic rings, weundertook a series of experiments designed to permit exami-
nation of identified cells by electron, light, and acoustic mi-
croscopy. Although it was technically difficult to identify andview single cells by these different approaches, we were nev-
ertheless able, in a few cases, to examine cells with all these
a
3t
4PAE
-:
wt.:AzzvAL >
FIG. 6. Thin cellular lamellipodium. This locomotory organellewas apparently fixed during its extension. Thin filopodia (0.1-0.15pm in diameter) protrude from the lamellipodium, and some of these(arrows) are faintly visible in the acoustic micrograph (a). Also notethe irregular cytoplasmic lattice in a that is visible in the electronmicrograph (b) as localized aggregations of microfilaments. Bar in-dicates 10 gm.
methods. To facilitate the penetration of electrons throughwhole-mounted cells in the transmission electron microscope,we selected for viewing those cells that appeared thin in thelight microscope. An example of such a cell is illustrated in Fig.3. The marked changes in patterns of acoustic contrast thatresult from a slight shift in positioning of the cell along theacoustic axis of the lens are demonstrated in Fig. 3 c and d.Although the concentric nature of the bands is essentially re-tained, their radial position, and the acoustic signal from thesurrounding substratum, both vary with the separation betweensample and lens and, thus, with the phase angle of the reflectedacoustic signal. At this low magnification, relatively littlecytoplasmic detail is revealed in the acoustic micrographs.Although more detail is visible in the light micrograph, contrastis reduced relative to the acoustic image. The correspondingelectron micrograph shows great contrast and resolution,especially at the cell periphery, but penetration of the electronbeam through the thicker central cytoplasm is too poor to revealcellular detail.
In Fig. 4, the area outlined in Fig. Sa is shown at the highestmagnification now practical with the acoustic microscope.Here, the detail revealed in the acoustic image closely ap-proaches that obtained with a light microscope fitted with a10OX oil-immersion objective. Using the transmission electronmicrograph as a reference, we are able to identify many of theacoustically visible structures, including an elongate filopodium,sites of attachment between adjacent cells, actin cables, andprobable sites of cell-substratum attachment. Independentcalibrations of these light and electron micrographs reveal thatthe indicated sites of cell-cell attachment, and the filopodium,are 0.2 pim in diameter. The scanning electron micrograph ofthe same region demonstrates that at least some of these featuresare visible as variations in surface contour, especially in regionswhere the cytoplasm is particularly thin. This variation insurface contour was unexpected, and may be artifactual. Notealso that the cell thickness increases centrally.
Fig. 5 illustrates a portion of a cell that had an unusuallyprominent accumulation of mitochondria aligned parallel toa series of actin cables. The mitochondria present an acousticimage that contrasts dramatically with that of the surroundingcytoplasm. Whereas large mitochondria appear distinct, smallermitochondria nearby are only poorly resolved acoustically, andtheir images are reduced in contrast.The smallest biological objects we have yet been able to
identify in the acoustic microscope are shown in Fig. 6. Here,an exceedingly thin portion of cell cytoplasm was apparentlyfixed during its extension as a ruffling membrane. Several fil-opodia, 0. 1-0. 15 ptm in width, project from this membrane (Fig.6b), and some of these are faintly visible in the acoustic image(Fig. 6a). Also visible acoustically is a diffuse and irregularcytoplasmic lattice, which corresponds in the electron micro-graph to local aggregations of microfilaments.
DISCUSSIONThis study represents a successful attempt to specifically observeintracellular structure with the acoustic microscope. For thiswork, we selected fibroblastic cells of the peripheral nervoussystem, both because these cells were readily accessible to usand because their structure has previously been well charac-terized (14). By making comparisons among sequential acoustic,electron, and light micrographs of single cells, we have beenable to identify acoustically prominent organelles that corre-spond to nuclei and nucleoli, mitochondria, actin cables andpresumptive cell attachment sites, and filopodia, ruffles, andother cell surface projections.The smallest biological objects that we are presently able to
%0-"'O28Biophysics: Johnston et al.
.its
Proc. Nati. Acad. Sci. USA 76 (1979) 3829
detect acoustically, such as filopodia and other thin organelles,have diameters of 0.1-0.2 ,um, though these are identifiableonly when other organelles are not nearby. The ability of theacoustic microscope to resolve adjacent small objects is some-what less. We estimate that the minimal separation of biologicalobjects that can be acoustically resolved is about 0.5-0.7 Am,or approximately one wavelength. Although a light microscopeequipped with an oil-immersion lens can surpass this perfor-mance, the difference is not great. We anticipate that im-provements in acoustic microscopy over the next few years willnarrow this gap further, and the acoustic instrument may intime even exceed the resolving power of the light microscope.Electron microscopists, of course, need not fear competition onthis front.
Nevertheless, the acoustic microscope already offers poten-tially useful features that are characteristic of neither light norelectron microscopy. First, the degree of acoustic contrast thatdifferentiates cytoplasmic organelles can be impressive, evenwhen these organelles are unstained. Second, the acoustic mi-croscope is apparently sensitive to slight variations in cyto-plasmic thickness and provides a degree of information that isotherwise readily obtainable only in the interference micro-scope or in the scanning electron microseope. Finally, theacoustic microscope, unlike the electron microscope, is com-patible with living cells (6).The precise mechanisms by which biological objects generate
acoustic contrast are not yet well understood. Localized changesin cytoplasmic mechanical properties, which could result invariations both in acoustic absorbance and in phase angle of thereflected signal, should contribute to acoustic contrast (15, 16).The phase angle of the acoustic response can vary as a functionof at least two cytoplasmic parameters. An acoustic pulsepropagating through a region of reduced density or increasedmechanical stiffness would increase in velocity of propagationand thereby undergo a phase advance with respect to adjacentsignals. Depending on the plane of acoustic focus, this wouldbe interpreted by the microscope as either a relative lighteningor a relative darkening of the visual image. On the other hand,anr acoustic pulse propagating through a homogeneous objectthat is of variable thickness would undergo a greater phaseadvance, perhaps through multiples of x, in the thicker regions.
We suspect that the latter mechanism may account, in largepart, for the existence of the acoustic rings that appear to followthe contours of cells as they thicken toward their centers. Wedo not yet know, however, to what extent the local variationsin acoustic contrast that are associated with cytoplasmic or-ganelles correlate with mechanical or viscoelastic propertiesthat might result in acoustic absorbance or phase shift. To an-swer these and other questions, further comparisons amongacoustic and electron microscopic images of cells must bemade.We thank Kate Barald, Paul Green, and Norman Wessells for crit-
icisms of this manuscript. We also thank Belen Palmer and FranThomas for technical assistance. The culturing of cells and light andelectron microscopy were performed in Wessells' laboratory. This workwas supported by Research Grants 1 R01 GM-25826-01 and RGHD-04708 from the National Institutes of Health. R.N.J. was partiallysupported by a Natural Sciences and Engineering Research Councilof Canada scholarship.
1. Osborn, M. & Weber, K. (1977) Cell 12,561-571.2. Zernike, F. (1942) Physica 9,686-974.3. Allen, R. D., David, G. B. & Nomarski, G. (1969) Z. Wissenschaft.
Mikrosk. und Mikrosk. Tech. 69, 193-221.4. Hoffman, R. (1977) J. Microsc. 110, 205-222.5. Inoue, S. (1952) Exp. Cell Res. Suppl. 2,305-318.6. Lemons, R. A. & Quate, C. F. (1975) Science 188, 905-911.7. Jipson, V. & Quate, C. F. (1978) Appl. Phys. Lett. 32, 789-
791.8. Lemons, R. A. & Quate, C. F. (1974) Appl. Phys. Lett. 24,
163-165.9. Lemons, R. A. & Quate, C. F. (1973) in Proceedings of the Ul-
trasonics Symposium, ed. deKlerk, J. (IEEE, New York), pp.18-20.
10. Atalar, A. (1978) J. Appl. Phys. 49,5130-5139.11. Helfand, S. L., Smith, G. A. & Wessells, N. K. (1976) Dev. Biol.
50,541-547.12. Buckley, I. K. & Porter, K. R. (1975) J. Microsc. 104, 107-120.13. Luduefia, M. A. & Wessells, N. K. (1973) Dev. Biol. 30, 427-
440.14. Wessells, N. K., Luduefia, M. A., Letourneau, P. C., Wrenn, J.
T. & Spooner, B. S. (1974) Tissue Cell 4,757-776.15. Atalar, A., Jipson, V., Koch, R. & Quate, C. F. (1979) Annu. Rev.
Mater. Sci. 9, 255-281.16. Marmor, M. F., Wickramasinghe, H. K. & Lemons, R. A. (1977)
Invest. Ophthalmol. Vis. Sci. 16,660-666.
Biophysics: Johnston et al.