acoustic microscopy: latest developments and applications · future science group 49 acoustic...
TRANSCRIPT

47ISSN 1755-5191Imaging Med. (2009) 1(1), 47–6310.2217/IIM.09.8 © 2009 Future Medicine Ltd
Acoustic microscopy: latest developments and applications
REVIEW
Scanning acoustic microscopy (SAM) introduced a new form of contrast that is based on the mechanical properties of what is imaged. For bone, cartilage, tendon and cardiovascular tissues, micro-acoustic properties provided important information on biomechanical properties. Biomechanics of these tissues are especially important for assessing the pathophysiology. Cells are considered to consist of visco-elastic materials and SAM is capable of imaging information on viscosity by attenuation and information on elasticity by sound speed. Recent developments such as ultrasound impedance microscopy, 3D ultrasound microscopy and high frequency array transducer may realize a clinically applicable SAM in the near future.
KEYWORDS: 3D ultrasound n acoustic microscopy n biomechanics n bone n cartilage n cell n high-frequency ultrasound n soft tissue n ultrasound impedance
Yoshifumi SaijoBiomedical Imaging Laboratory, Graduate School of Biomedical Engineering, Tohoku University, Sendai, Japan Tel.: +81 22 717 8514; Fax: +81 22 795 5882; [email protected]
The resolution of ultrasound imaging depends on the ultrasonic frequency because the wavelength and beam width are inversely proportional to the frequency:
fc
=m
1.02BD
fDFc
=
where l: wavelength; BD : beam width; c : sound speed; D : diameter of transducer; f: frequency of ultrasound; F: focal length.
In clinical settings, several MHz-range ultra-sound is used in abdominal echography and echo-cardiography. A 7.5–13 -MHz ultrasound is applied for observation of carotid artery and muscles, a 20–45-MHz ultrasound is applied for intravascu-lar ultrasound (IVUS) and a 60-MHz ultrasound is applied for ophthalmology. Trade-off between resolution and penetration depth should be consid-ered in the selection of the frequency. In our expe-rience, the penetration depth of 100-MHz ultra-sound effective for image processing is 3–5 mm. Thus, high-frequency ultrasound was applicable to observe near field objects.
Optics has been available in the world of microscopy for many years. However, its target is restricted to largely transparent media. Sokolov in the former Soviet Union first proposed the concept of an ‘ultrasonic microscope’ in order to visualize opaque media in 1949 [1]. Sokolov pointed out that the wavelength of 3-GHz ultra-sound in water was the same as the wavelength of green light in air. At that time, however, the technologies to produce 3-GHz ultrasound did not exist.
In 1959, Dunn and Fry at University of Illinois (IL, USA) developed an ‘ultrasonic absorption microscope method’ with 12-MHz ultrasound [2]. During the 1970s, high-frequency techniques were developed for the microwave technology for radar and for satellite communications. In 1973, Quate and Lemons at Stanford University (CA, USA) developed a scanning acoustic microscope (SAM) [3], the basic design of which is now used in the biomedical field.
Scanning acoustic microscope was first used biomedically in the early phase of acoustic microscopy history. SAM introduced a new form of contrast that is based on the mechanical prop-erties of what is imaged. There are three unique features of SAM compared with other micro-scopy, such as optical, electron and atomic force. First, SAM can be applied for easy and simple histopathological examinations because it does not require special staining techniques as the contrast observed in SAM images is dependent on the acoustic properties (i.e., density, stiffness and attenuation) and on the topographic contour of the tissue.
Second, microscopic acoustic properties obtained with high-frequency ultrasound can be used for assessing echo intensity and texture in clinical echography with lower frequency ultra-sound. Density, ρ, and sound speed, c, determine the characteristic acoustic impedance, Z, of the material as:
z c=t
On the assumption that the interface between two fluid-like media is infinite and plane, the relative reflected sound power, in dB, can be
Imaging Med. (2009) 1(1)48 future science group
REVIEW Saijo
determined by the specific acoustic impedance of each medium as:
10log 10logdBPP
Z Z
Z Z
i
r
a b
a b10 10 2
2
= =+
-
^^
hh
where Pr: sound power reflected at interface;
Pi: incident sound power; Z
a: acoustic imped-
ance of medium a; Zb: acoustic impedance of
medium b.Third, SAM data can be used as the basic
data for assessing the biomechanics of tissues and cells. In particular, it is useful for the micro-scopic target where direct mechanical measure-ments cannot be applied. In its simplest form, the relation between the sound speed and the elastic bulk modulus of liquid-like media is:
cK
=t
where ρ: density; c: sound speed; K: elastic bulk modulus.
As a biological soft tissue may be considered as a liquid-like material, this equation may be applied to assess its elastic properties. Recent biomechani-cal studies have suggested that the mechanical properties of tissues may not be sufficiently similar to liquids and should be treated as soft solid mate-rials. However, the acoustical relations of solid materials can also be described by the following equation if the material is assumed to be isotropic:
1 1 2
1c
E=
+ -
-
t v v
v
^ ^^h h
h
where σ: poisson’s ratio; ρ: density; c: sound speed; E: Young’s modulus.
This relation shows that the Young’s modulus of tissue and the sound speed are closely related.
Soft materials are sometimes considered as viscoelastic material. At that time, viscosity is also derived from acoustic properties [4]:
3
2
34
c
fv s3
2 2
= +at
rh h` j
where α: absorption; hv: volumetric viscosity; hs: shear viscosity; ρ: density; c: sound speed; f: frequency.
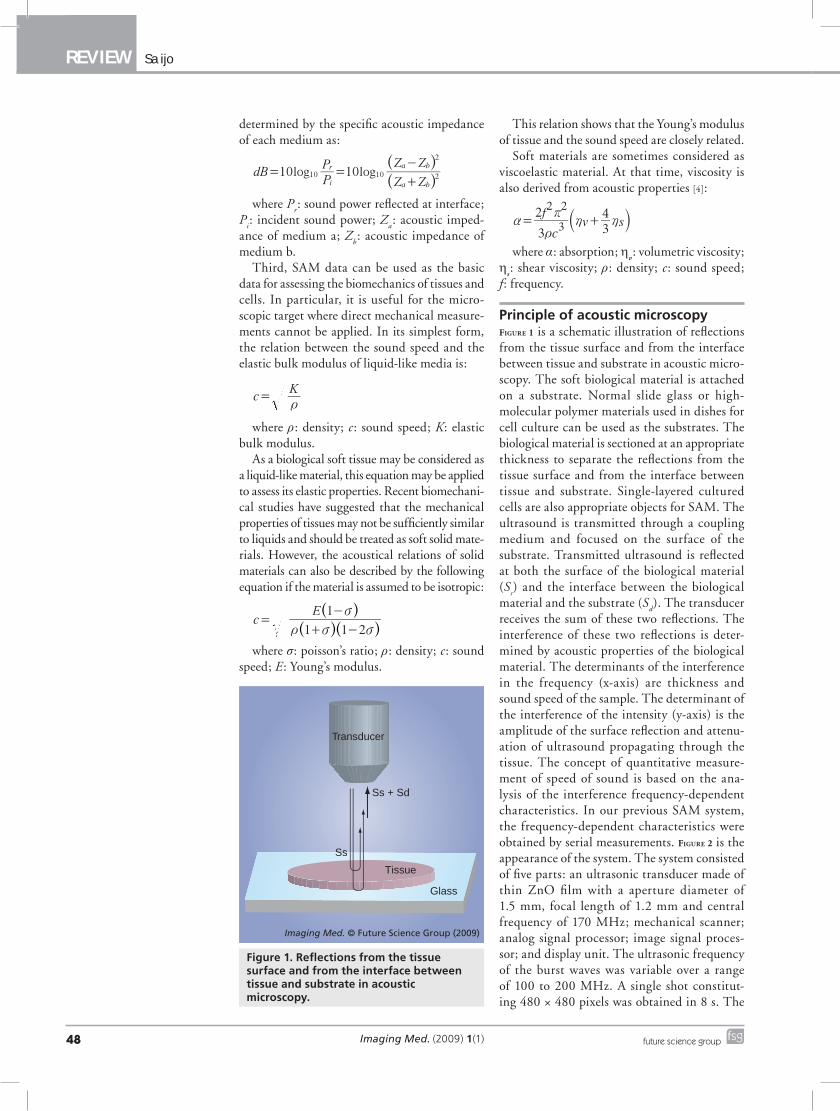
Principle of acoustic microscopyFigure 1 is a schematic illustration of reflections from the tissue surface and from the interface between tissue and substrate in acoustic micro-scopy. The soft biological material is attached on a substrate. Normal slide glass or high-molecular polymer materials used in dishes for cell culture can be used as the substrates. The biological material is sectioned at an appropriate thickness to separate the reflections from the tissue surface and from the interface between tissue and substrate. Single-layered cultured cells are also appropriate objects for SAM. The ultrasound is transmitted through a coupling medium and focused on the surface of the substrate. Transmitted ultrasound is reflected at both the surface of the biological material (S
s) and the interface between the biological
material and the substrate (Sd). The transducer
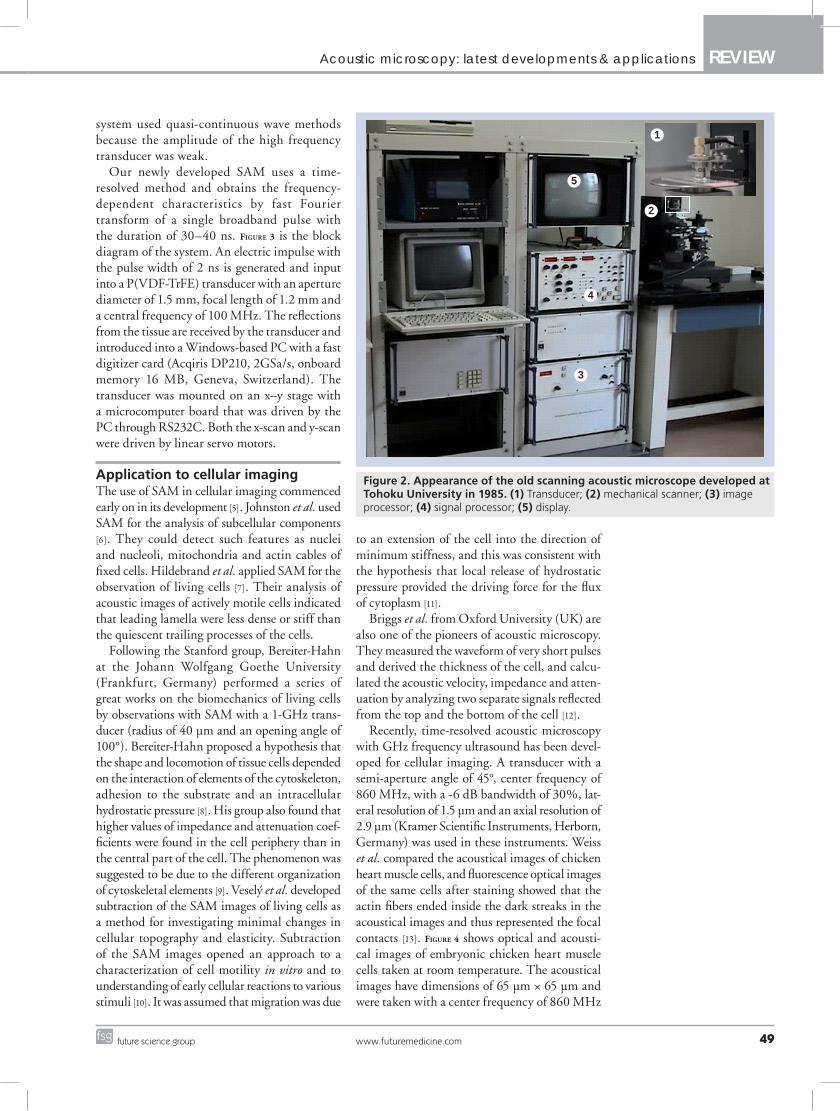
receives the sum of these two reflections. The interference of these two reflections is deter-mined by acoustic properties of the biological material. The determinants of the interference in the frequency (x-axis) are thickness and sound speed of the sample. The determinant of the interference of the intensity (y-axis) is the amplitude of the surface reflection and attenu-ation of ultrasound propagating through the tissue. The concept of quantitative measure-ment of speed of sound is based on the ana-lysis of the interference frequency-dependent characteristics. In our previous SAM system, the frequency-dependent characteristics were obtained by serial measurements. Figure 2 is the appearance of the system. The system consisted of five parts: an ultrasonic transducer made of thin ZnO film with a aperture diameter of 1.5 mm, focal length of 1.2 mm and central frequency of 170 MHz; mechanical scanner; analog signal processor; image signal proces-sor; and display unit. The ultrasonic frequency of the burst waves was variable over a range of 100 to 200 MHz. A single shot constitut-ing 480 × 480 pixels was obtained in 8 s. The
Transducer
Ss + Sd
Ss
Tissue
Glass
Imaging Med. © Future Science Group (2009)
Figure 1. Reflections from the tissue surface and from the interface between tissue and substrate in acoustic microscopy.
www.futuremedicine.com 49future science group
Acoustic microscopy: latest developments & applications REVIEW
system used quasi-continuous wave methods because the amplitude of the high frequency transducer was weak.
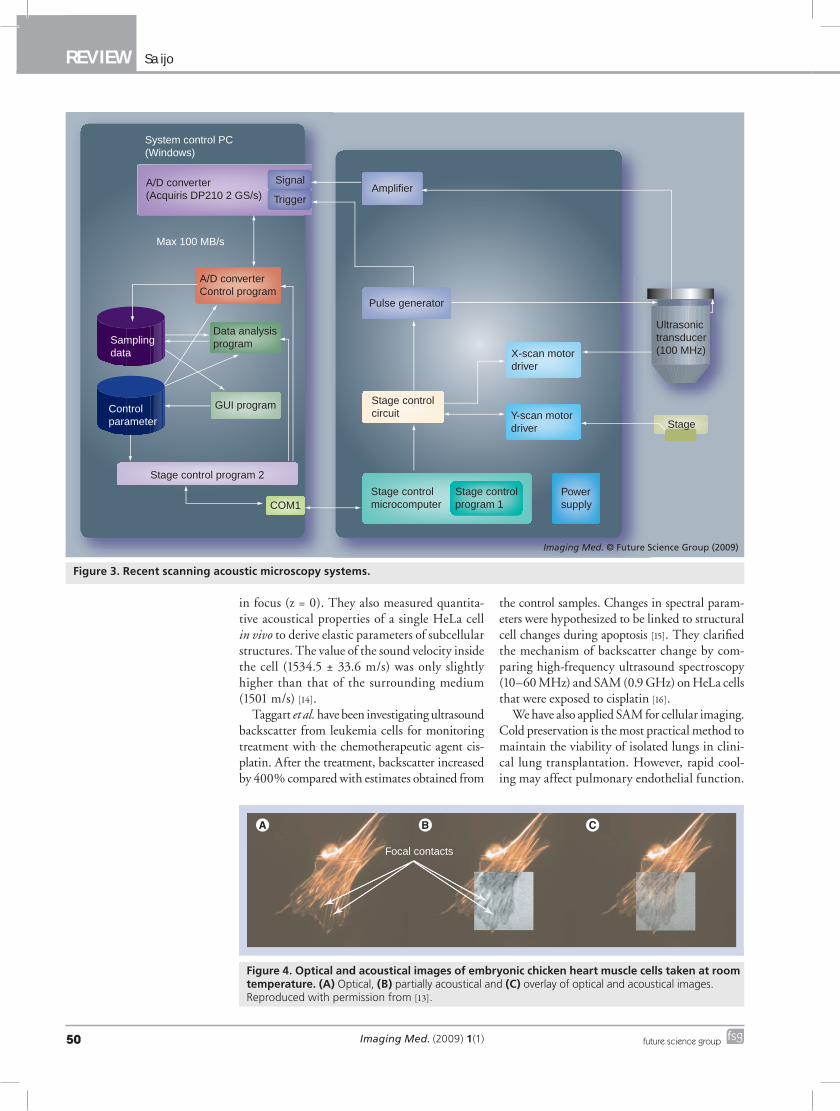
Our newly developed SAM uses a time-resolved method and obtains the frequency-dependent characteristics by fast Fourier transform of a single broadband pulse with the duration of 30–40 ns. Figure 3 is the block diagram of the system. An electric impulse with the pulse width of 2 ns is generated and input into a P(VDF-TrFE) transducer with an aperture diameter of 1.5 mm, focal length of 1.2 mm and a central frequency of 100 MHz. The reflections from the tissue are received by the transducer and introduced into a Windows-based PC with a fast digitizer card (Acqiris DP210, 2GSa/s, onboard memory 16 MB, Geneva, Switzerland). The transducer was mounted on an x–y stage with a microcomputer board that was driven by the PC through RS232C. Both the x-scan and y-scan were driven by linear servo motors.
Application to cellular imagingThe use of SAM in cellular imaging commenced early on in its development [5]. Johnston et al. used SAM for the ana lysis of subcellular components [6]. They could detect such features as nuclei and nucleoli, mitochondria and actin cables of fixed cells. Hildebrand et al. applied SAM for the observation of living cells [7]. Their ana lysis of acoustic images of actively motile cells indicated that leading lamella were less dense or stiff than the quiescent trailing processes of the cells.
Following the Stanford group, Bereiter-Hahn at the Johann Wolfgang Goethe University (Frankfurt, Germany) performed a series of great works on the biomechanics of living cells by observations with SAM with a 1-GHz trans-ducer (radius of 40 µm and an opening angle of 100°). Bereiter-Hahn proposed a hypothesis that the shape and locomotion of tissue cells depended on the interaction of elements of the cytoskeleton, adhesion to the substrate and an intracellular hydrostatic pressure [8]. His group also found that higher values of impedance and attenuation coef-ficients were found in the cell periphery than in the central part of the cell. The phenomenon was suggested to be due to the different organization of cytoskeletal elements [9]. Veselý et al. developed subtraction of the SAM images of living cells as a method for investigating minimal changes in cellular topography and elasticity. Subtraction of the SAM images opened an approach to a characterization of cell motility in vitro and to understanding of early cellular reactions to various stimuli [10]. It was assumed that migration was due
to an extension of the cell into the direction of minimum stiffness, and this was consistent with the hypothesis that local release of hydrostatic pressure provided the driving force for the flux of cytoplasm [11].
Briggs et al. from Oxford University (UK) are also one of the pioneers of acoustic microscopy. They measured the waveform of very short pulses and derived the thickness of the cell, and calcu-lated the acoustic velocity, impedance and atten-uation by analyzing two separate signals reflected from the top and the bottom of the cell [12].
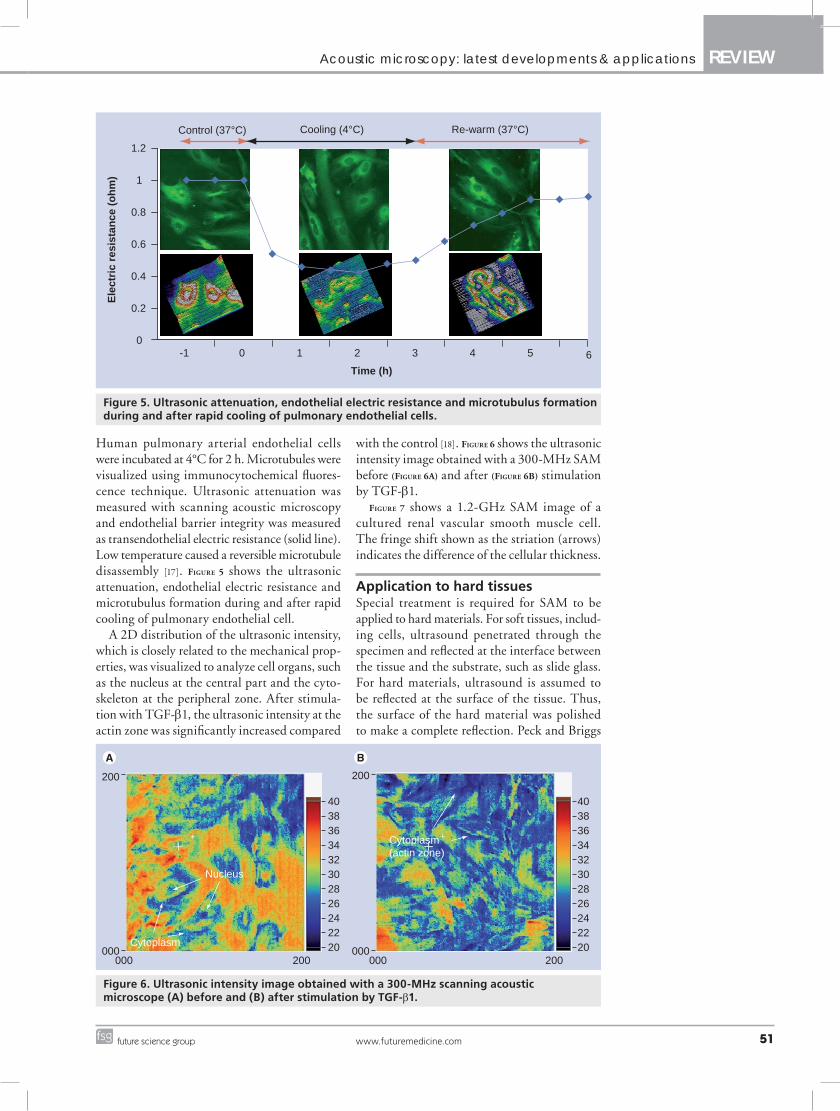
Recently, time-resolved acoustic microscopy with GHz frequency ultrasound has been devel-oped for cellular imaging. A transducer with a semi-aperture angle of 45°, center frequency of 860 MHz, with a -6 dB bandwidth of 30%, lat-eral resolution of 1.5 µm and an axial resolution of 2.9 µm (Kramer Scientific Instruments, Herborn, Germany) was used in these instruments. Weiss et al. compared the acoustical images of chicken heart muscle cells, and fluorescence optical images of the same cells after staining showed that the actin fibers ended inside the dark streaks in the acoustical images and thus represented the focal contacts [13]. Figure 4 shows optical and acousti-cal images of embryonic chicken heart muscle cells taken at room temperature. The acoustical images have dimensions of 65 µm × 65 µm and were taken with a center frequency of 860 MHz
1
2
3
4
5
Figure 2. Appearance of the old scanning acoustic microscope developed at Tohoku University in 1985. (1) Transducer; (2) mechanical scanner; (3) image processor; (4) signal processor; (5) display.
Imaging Med. (2009) 1(1)50 future science group
REVIEW Saijo
in focus (z = 0). They also measured quantita-tive acoustical properties of a single HeLa cell in vivo to derive elastic parameters of subcellular structures. The value of the sound velocity inside the cell (1534.5 ± 33.6 m/s) was only slightly higher than that of the surrounding medium (1501 m/s) [14].
Taggart et al. have been investigating ultrasound backscatter from leukemia cells for monitoring treatment with the chemotherapeutic agent cis-platin. After the treatment, backscatter increased by 400% compared with estimates obtained from
the control samples. Changes in spectral param-eters were hypothesized to be linked to structural cell changes during apoptosis [15]. They clarified the mechanism of backscatter change by com-paring high-frequency ultrasound spectroscopy (10–60 MHz) and SAM (0.9 GHz) on HeLa cells that were exposed to cisplatin [16].
We have also applied SAM for cellular imaging. Cold preservation is the most practical method to maintain the viability of isolated lungs in clini-cal lung transplantation. However, rapid cool-ing may affect pulmonary endothelial function.
System control PC(Windows)
Max 100 MB/s
GUI program
Stage control program 2
COM1
Amplifier
Pulse generator
Stage controlcircuit
X-scan motordriver
Y-scan motor driver
Power supply
Stage controlmicrocomputer
Stage controlprogram 1
Sampling data
Controlparameter
A/D converter(Acquiris DP210 2 GS/s) Trigger
Signal
A/D converterControl program
Data analysisprogram
Stage
Ultrasonic transducer(100 MHz)
Imaging Med. © Future Science Group (2009)
Figure 3. Recent scanning acoustic microscopy systems.
Focal contacts
Figure 4. Optical and acoustical images of embryonic chicken heart muscle cells taken at room temperature. (A) Optical, (B) partially acoustical and (C) overlay of optical and acoustical images.Reproduced with permission from [13].
www.futuremedicine.com 51future science group
Acoustic microscopy: latest developments & applications REVIEW
Human pulmonary arterial endothelial cells were incubated at 4°C for 2 h. Microtubules were visualized using immunocytochemical fluores-cence technique. Ultrasonic attenuation was measured with scanning acoustic microscopy and endothelial barrier integrity was measured as transendothelial electric resistance (solid line). Low temperature caused a reversible micro tubule disassembly [17]. Figure 5 shows the ultrasonic attenuation, endothelial electric resistance and microtubulus formation during and after rapid cooling of pulmonary endothelial cell.
A 2D distribution of the ultrasonic intensity, which is closely related to the mechanical prop-erties, was visualized to analyze cell organs, such as the nucleus at the central part and the cyto-skeleton at the peripheral zone. After stimula-tion with TGF-b1, the ultrasonic intensity at the actin zone was significantly increased compared
with the control [18]. Figure 6 shows the ultrasonic intensity image obtained with a 300-MHz SAM before (Figure 6A) and after (Figure 6B) stimulation by TGF-b1.
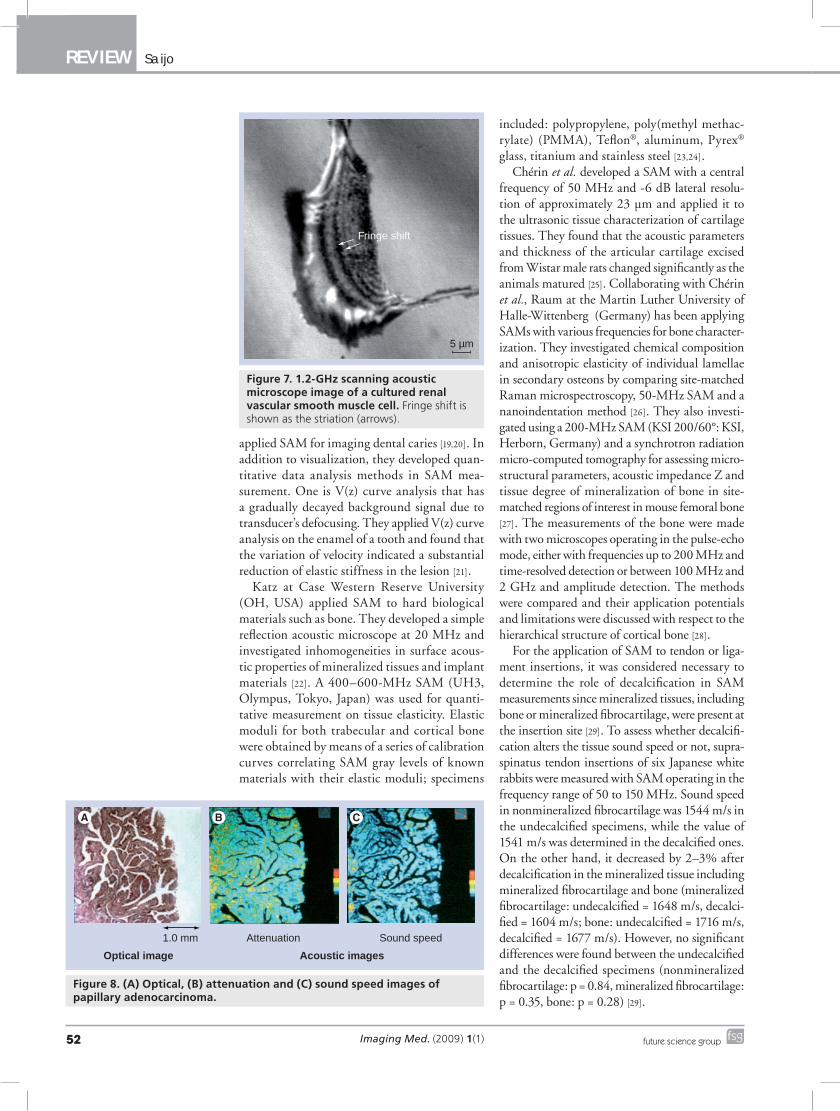
Figure 7 shows a 1.2-GHz SAM image of a cultured renal vascular smooth muscle cell. The fringe shift shown as the striation (arrows) indicates the difference of the cellular thickness.
Application to hard tissuesSpecial treatment is required for SAM to be applied to hard materials. For soft tissues, includ-ing cells, ultrasound penetrated through the specimen and reflected at the interface between the tissue and the substrate, such as slide glass. For hard materials, ultrasound is assumed to be reflected at the surface of the tissue. Thus, the surface of the hard material was polished to make a complete reflection. Peck and Briggs
Control (37°C)
Ele
ctri
c re
sist
ance
(o
hm
)
Time (h)
0
0.2
0.4
0.6
0.8
1
1.2
-1 0 1 2 3 4 5 6
Cooling (4°C) Re-warm (37°C)
Figure 5. Ultrasonic attenuation, endothelial electric resistance and microtubulus formation during and after rapid cooling of pulmonary endothelial cells.
Nucleus
Cytoplasm
200
200000
000
4038363432302826242220
Cytoplasm(actin zone)
200
200000000
4038363432302826242220
Figure 6. Ultrasonic intensity image obtained with a 300-MHz scanning acoustic microscope (A) before and (B) after stimulation by TGF-b1.
Imaging Med. (2009) 1(1)52 future science group
REVIEW Saijo
applied SAM for imaging dental caries [19,20]. In addition to visualization, they developed quan-titative data ana lysis methods in SAM mea-surement. One is V(z) curve ana lysis that has a gradually decayed background signal due to transducer’s defocusing. They applied V(z) curve ana lysis on the enamel of a tooth and found that the variation of velocity indicated a substantial reduction of elastic stiffness in the lesion [21].
Katz at Case Western Reserve University (OH, USA) applied SAM to hard biological materials such as bone. They developed a simple reflection acoustic microscope at 20 MHz and investigated inhomogeneities in surface acous-tic properties of mineralized tissues and implant materials [22]. A 400–600-MHz SAM (UH3, Olympus, Tokyo, Japan) was used for quanti-tative measurement on tissue elasticity. Elastic moduli for both trabecular and cortical bone were obtained by means of a series of calibration curves correlating SAM gray levels of known materials with their elastic moduli; specimens
included: polypropylene, poly(methyl methac-rylate) (PMMA), Teflon®, aluminum, Pyrex® glass, titanium and stainless steel [23,24].
Chérin et al. developed a SAM with a central frequency of 50 MHz and -6 dB lateral resolu-tion of approximately 23 µm and applied it to the ultrasonic tissue characterization of cartilage tissues. They found that the acoustic parameters and thickness of the articular cartilage excised from Wistar male rats changed significantly as the animals matured [25]. Collaborating with Chérin et al., Raum at the Martin Luther University of Halle-Wittenberg (Germany) has been applying SAMs with various frequencies for bone character-ization. They investigated chemical composition and anisotropic elasticity of individual lamellae in secondary osteons by comparing site-matched Raman microspectroscopy, 50-MHz SAM and a nanoindentation method [26]. They also investi-gated using a 200-MHz SAM (KSI 200/60°: KSI, Herborn, Germany) and a synchrotron radiation micro-computed tomography for assessing micro-structural parameters, acoustic impedance Z and tissue degree of mineralization of bone in site-matched regions of interest in mouse femoral bone [27]. The measurements of the bone were made with two microscopes operating in the pulse-echo mode, either with frequencies up to 200 MHz and time-resolved detection or between 100 MHz and 2 GHz and amplitude detection. The methods were compared and their application potentials and limitations were discussed with respect to the hierarchical structure of cortical bone [28].
For the application of SAM to tendon or liga-ment insertions, it was considered necessary to determine the role of decalcification in SAM measurements since mineralized tissues, including bone or mineralized fibrocartilage, were present at the insertion site [29]. To assess whether decalcifi-cation alters the tissue sound speed or not, supra-spinatus tendon insertions of six Japanese white rabbits were measured with SAM operating in the frequency range of 50 to 150 MHz. Sound speed in nonmineralized fibrocartilage was 1544 m/s in the undecalcified specimens, while the value of 1541 m/s was determined in the decalcified ones. On the other hand, it decreased by 2–3% after decalcification in the mineralized tissue including mineralized fibrocartilage and bone (mineralized fibrocartilage: undecalcified = 1648 m/s, decalci-fied = 1604 m/s; bone: undecalcified = 1716 m/s, decalcified = 1677 m/s). However, no significant differences were found between the undecalcified and the decalcified specimens (nonmineralized fibrocartilage: p = 0.84, mineralized fibrocartilage: p = 0.35, bone: p = 0.28) [29].
Fringe shift
5 µm
Figure 7. 1.2-GHz scanning acoustic microscope image of a cultured renal vascular smooth muscle cell. Fringe shift is shown as the striation (arrows).
Optical image Acoustic images
Attenuation Sound speed1.0 mm
Figure 8. (A) Optical, (B) attenuation and (C) sound speed images of papillary adenocarcinoma.

www.futuremedicine.com 53future science group
Acoustic microscopy: latest developments & applications REVIEW
Norm
1700
So
un
d s
pee
d (
m/s
) 1650
1600
1550
1500
1450Pap Well Mod Poor Sig
Application to soft tissuesAs described earlier, soft tissues should be sliced thinly so that ultrasound can penetrate through the tissue and reflected at the interface between tissue and substrate. From our experiences, a specimen of approximately 10 µm thickness was appropriate for 100-MHz SAM because of signal amplitude and image quality. If the speed of sound is 1500 m/s in the specimen, the wavelength of the 100-MHz ultrasound is approximately 15 µm. Thus, flight-of-time measurement in the time domain is difficult for the thickness measurement of such materials. van der Steen used the spectral phase differ-ence method for the measurement of samples 5–10 µm thick. The glass plate ref lections were gated out, then the signal was Fourier-transformed into the frequency domain. The obtained phase spectra were unwrapped, sub-tracted and subsequently a linear fit was made through this phase difference spectrum. The slope of this line yielded the difference in arrival time [30]. Our group proposed a unique method for calculating thickness and sound speed of the thinly sliced tissues considering the interfer-ence between surface and bottom reflections of tone-burst ultrasound waves [31,32].
n Gastric cancerGastric cancer tissues were classified into five groups according to their pathological findings: papillary adenocarcinoma, well-differentiated tubular adenocarcinoma, moderately differen-tiated tubular adenocarcinoma, poorly differ-entiated adenocarcinoma and signet-ring cell carcinoma [31]. Figure 8 is an example of optical (hematoxylin–eosin staining) and acoustical images of papillary adenocarcinoma. The bar graph in Figure 9 shows sound speed in normal mucosa and five kinds of cancer tissues.
The values of the sound speed increased as the cellular differentiation proceeded through the three kinds of tubular adenocarcinoma. As the density of the biological soft tissues can be assumed to be nearly constant, increased sound speed can thus be interpreted to mean that tubu-lar adenocarcinoma tissues become acoustically stiffer as the differentiation of the tissue pro-ceeds. Electron microscopy has shown that the number of desmosomes, which are required for cell-to-cell adhesion, is significantly decreased in poorly differentiated adenocarcinoma. Well-differentiated tubular adenocarcinoma specimens exhibit nearly the same number of desmosomes as in normal mucosal tissue. This increasing trend was thus regarded as the result of tightening of the intercellular attachment. Both the attenuation constant and the sound speed were significantly lower in the signet-ring cell carcinoma than in the adenocarcinoma. The intracellular com-ponent of the signet-ring cell carcinoma is the periodic acid-Schiff stain positive substrate. The
Figure 9. Sound speed in normal mucosa and five kinds of cancer tissues. Mod: Moderately differentiated tubular adenocarcinoma; Norm: Normal mucosa; Pap: Papillary adenocarcinoma; Poor: Poorly differentiated adenocarcinoma; Sig: Signet-ring cell carcinoma; Well: Well-differentiated tubular adenocarcinoma.
F F F
Attenuation Sound speed
Acoustic imagesOpitcal image
1.0 mm
Figure 10. (A) Optical, (B) attenuation and (C) sound speed images of acute myocardial infarction.
Imaging Med. (2009) 1(1)54 future science group
REVIEW Saijo
lower values of the attenuation and sound speed may be accounted for by the intracellular chemi-cal components of the tumor tissues. These data of gastric cancer tumors clearly show that the SAM system can be used to classify the types of cancer tissues, as revealed by measurement of the acoustic parameters of the pathologies [31].
n Myocardial infarctionSince cardiac B-scans were developed at Tohoku University (Japan) in the early 1960s [33], the ori-gin of the strong echo in the myocardium has been investigated by various methods. In the sensitivity varying method, relative echo intensity of the tis-sue was compared with those of the left ventricu-lar cavity (defined as zero) and the pericardium (defined as the strongest) was used for semiquan-titative ana lysis of the echo intensity of myocar-dium. The echo intensity of the myocardium and histopathology were compared in hypertrophic cardiomyopathy. The study showed a relationship between strong echo portion and collagen fiber distribution [34]. However, there have been several reports that collagen content and myocardial echo amplitude did not show significant correlation [35].
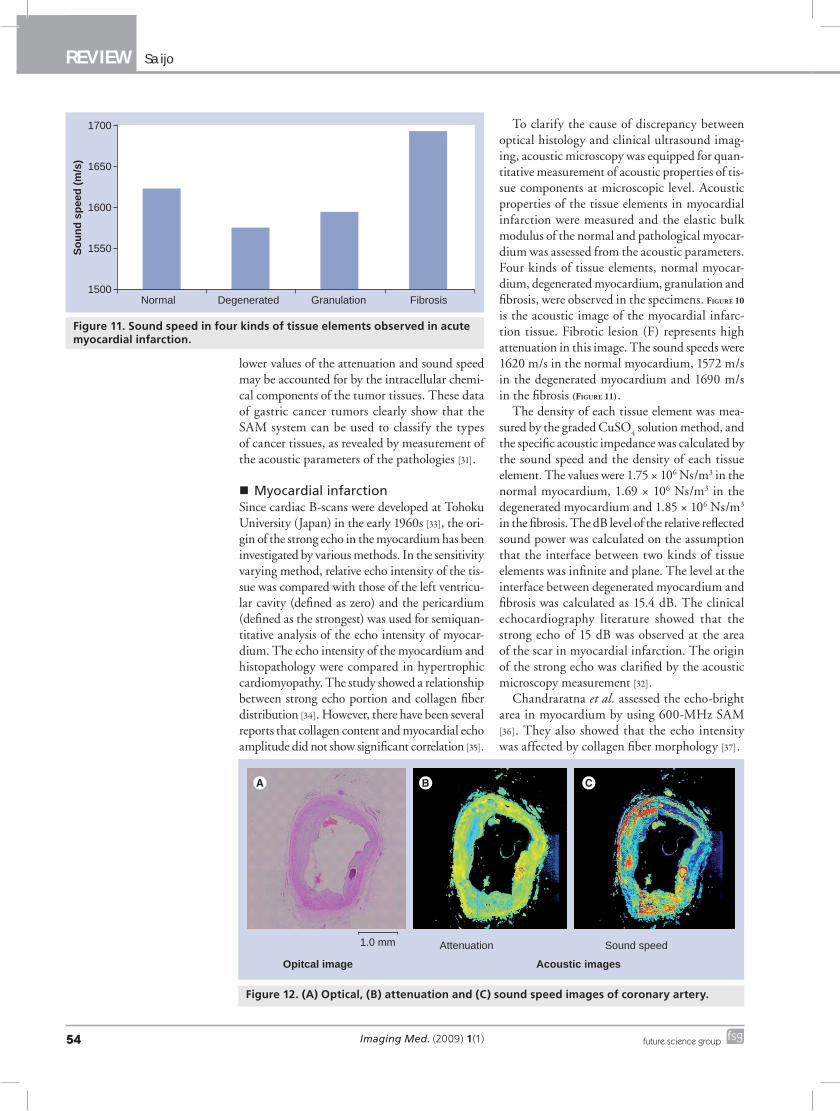
To clarify the cause of discrepancy between optical histology and clinical ultrasound imag-ing, acoustic microscopy was equipped for quan-titative measurement of acoustic properties of tis-sue components at microscopic level. Acoustic properties of the tissue elements in myocardial infarction were measured and the elastic bulk modulus of the normal and pathological myocar-dium was assessed from the acoustic parameters. Four kinds of tissue elements, normal myocar-dium, degenerated myocardium, granulation and fibrosis, were observed in the specimens. Figure 10 is the acoustic image of the myocardial infarc-tion tissue. Fibrotic lesion (F) represents high attenuation in this image. The sound speeds were 1620 m/s in the normal myocardium, 1572 m/s in the degenerated myocardium and 1690 m/s in the fibrosis (Figure 11).
The density of each tissue element was mea-sured by the graded CuSO
4 solution method, and
the specific acoustic impedance was calculated by the sound speed and the density of each tissue element. The values were 1.75 × 10⁶ Ns/m3 in the normal myocardium, 1.69 × 10⁶ Ns/m3 in the degenerated myocardium and 1.85 × 10⁶ Ns/m3 in the fibrosis. The dB level of the relative reflected sound power was calculated on the assumption that the interface between two kinds of tissue elements was infinite and plane. The level at the interface between degenerated myocardium and fibrosis was calculated as 15.4 dB. The clinical echocardiography literature showed that the strong echo of 15 dB was observed at the area of the scar in myocardial infarction. The origin of the strong echo was clarified by the acoustic microscopy measurement [32].
Chandraratna et al. assessed the echo-bright area in myocardium by using 600-MHz SAM [36]. They also showed that the echo intensity was affected by collagen fiber morphology [37].
So
un
d s
pee
d (
m/s
)
1700
1650
1600
1550
1500Normal Degenerated Granulation Fibrosis
Figure 11. Sound speed in four kinds of tissue elements observed in acute myocardial infarction.
Attenuation Sound speed
Acoustic imagesOpitcal image
1.0 mm
Figure 12. (A) Optical, (B) attenuation and (C) sound speed images of coronary artery.
www.futuremedicine.com 55future science group
Acoustic microscopy: latest developments & applications REVIEW
As the biological tissues are modeled as fluid, the values of bulk modulus can also be calculated from the values of sound speed and density. The value of the bulk modulus was 2.84 × 10⁹ N/m2 in the normal myocardium, 2.65 × 10⁹ N/m2 in the degenerated myocardium and 3.12 × 10⁹ N/m2 in the fibrosis. One of the roles of collagen fibers in acute myocardial infarction is to prevent the expansion of the infarction, and the frequency of left ventricular rupture has been reported to be higher in the group that exhibits no remarkable increment of the scar in the myocardium [38]. From the measurements, the bulk modulus of fibrosis was highest in the tissue components in myocardial infarction. This suggested that fibrosis formation soon after myocardial infarction may prevent infarct expansion and cardiac rupture.
n KidneyInvestigation of the kidney by SAM was started by Dunn and Kessler at the dawn of acoustic microscopy [39]. However, the quantitative data on kidney tissues were presented 20 years later when our group re-started investigations of the
kidney. Regarding renal cell carcinoma, the val-ues of attenuation constant and sound speed were lower in both kinds of cancer cells than those in normal kidney, although a significant difference was not found between the clear cell and granu-lar cell. Furthermore, both acoustic parameters of cancer cells were significantly lower than those in hemorrhage and fibrosis. These data suggest that the elasticity of renal cell carcinoma tissue may be
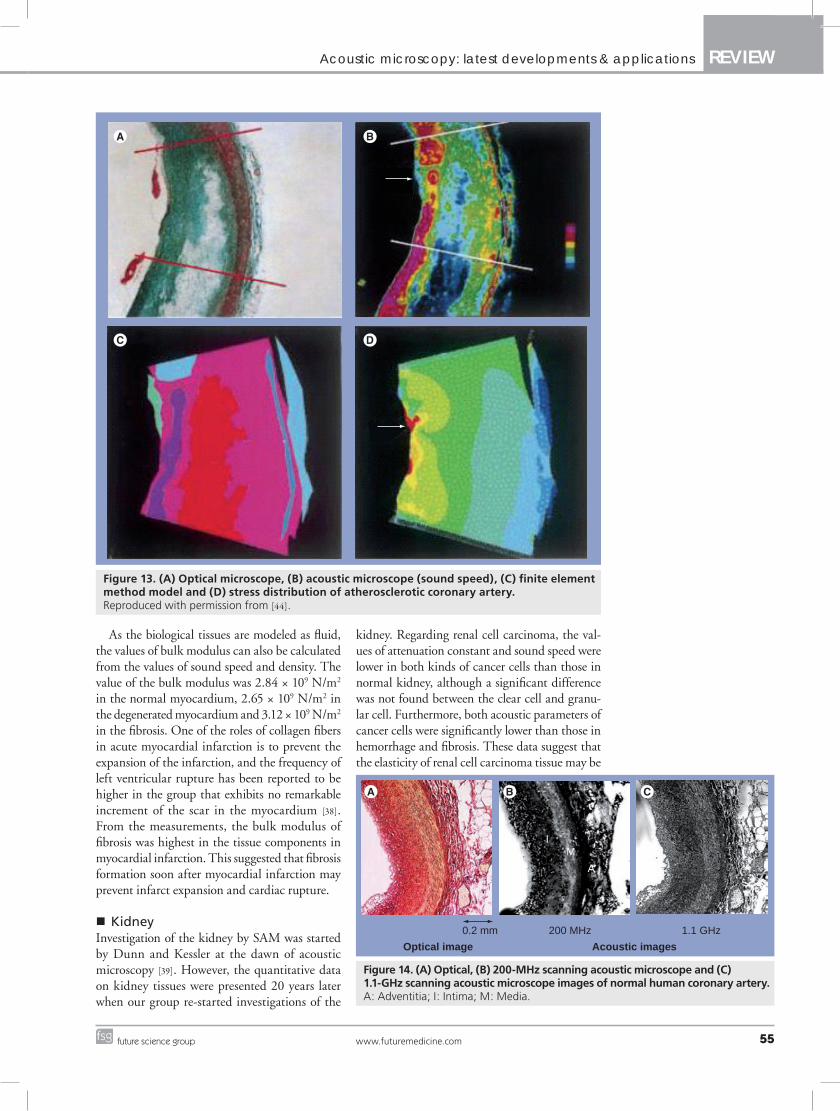
Figure 13. (A) Optical microscope, (B) acoustic microscope (sound speed), (C) finite element method model and (D) stress distribution of atherosclerotic coronary artery.Reproduced with permission from [44].
Optical image Acoustic images
0.2 mm 200 MHz 1.1 GHz
IM
A
Figure 14. (A) Optical, (B) 200-MHz scanning acoustic microscope and (C) 1.1-GHz scanning acoustic microscope images of normal human coronary artery. A: Adventitia; I: Intima; M: Media.
Imaging Med. (2009) 1(1)56 future science group
REVIEW Saijo
lower than that of normal kidney. Moreover, the high intensity echo in clinical echography may be related to the heterogeneity of the microacoustic field in the carcinoma tissue [40]. We also applied SAM to differentiate renal angiomyolipoma from renal cell carcinoma [41].
For the acoustic properties of dialyzed kid-ney, the attenuation constant for inflammatory granulation tissue was significantly higher than that for hyaline degeneration tissue (p < 0.001). Sound speed was high for granulation tissue, but tended to diminish gradually for hyaline degenera-tion. Sound speed increased again with progres-sion to cystic degeneration (p < 0.001), but the attenuation constant remained low. When a cystic kidney contained a malignant lesion, the previ-ously low attenuation constant rose at that site (p < 0.001), and the previously high sound speed was diminished (p < 0.001). Our data suggest that the physical properties of dialyzed kidneys at dif-ferent stages of pathology can be classified by their acoustic properties [42].
n AtherosclerosisThe normal coronary artery consists of three parts and the structure is represented in the opti-cal microscopic images. The intima comprises endothelium, inner elastic membrane and thin collagen fibers, the media comprises elastic fibers and smooth muscle, and the adventitia comprises collagen fibers. The atherosclerotic intima con-sists of thick collagen fibers, calcification and a lipid pool. In this study, the acoustic properties of five kinds of tissue elements (viz., the inti-mal collagen fiber, calcification, normal media, adventitia and fatty plaque) were measured. The cross-sectional images of coronary arteries were observed by both optical (Elastica-Masson stain-ing) and acoustic microscopy [43]. Figure 12 shows an example of coronary artery images.
Based on the sound speed distribution, regions with different elastic parameters were divided. Geometric and compositional information of each acoustic image was digitized using NIH Image 1.60 software (free software from NIH) on Power Macintosh 9600/233. Finite element meshes were generated using ANSYS 5.5 (SAS IP, Inc., PA, USA) software on a workstation (Ultra10, Sun Microsystems, CA, USA). The finite element models were solved for an intraluminal pressure load of 110 mmHg (14.6 kPa). In the calculation process, the region in the images was considered as a part of circumferential vessel wall and the central angle was 30°. The sound speed distribution was inhomogeneous and the discontinuity of the elas-tic property in the fibrous cap was observed in the atherosclerotic coronary artery. Next, the fibrotic region was divided into four regions according to the elasticity distribution. The first principle stress distribution of the normal coronary artery showed that the stress was dominant in the intima but was uniform. The stress distribution in the athero-sclerotic plaque showed that the mean value of the stress was smaller than that found in the intima of the normal coronary artery, but the peak stress was very high and concentrated into the crack-like structure of the fibrous cap (Figure 13A–D). The results indicated that the pathophysiology of coro-nary plaque rupture was strongly correlated with biomechanical properties of the tissue components in coronary artery [44].
Figure 14 shows the optical 200-MHz and 1.1-GHz acoustic microscope images of normal human coronary artery. The resolution is better in the 1.1-GHz image. For example, each elastic fiber in the media can be observed in the 1.1-GHz image while the media is almost homogeneous in the 200-MHz image. However, the three-layered appearance of coronary artery is more obvious in
10 MM
16:27:18 019512/19/2002
500 µm
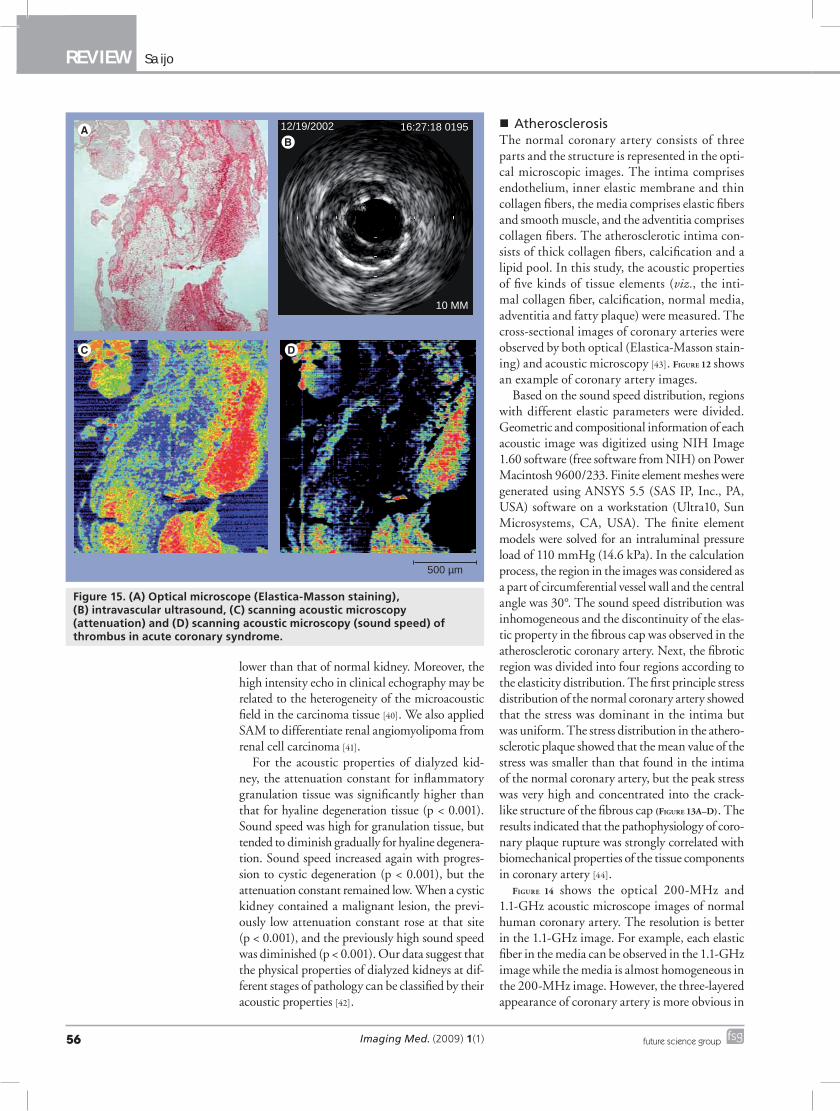
Figure 15. (A) Optical microscope (Elastica-Masson staining), (B) intravascular ultrasound, (C) scanning acoustic microscopy (attenuation) and (D) scanning acoustic microscopy (sound speed) of thrombus in acute coronary syndrome.

www.futuremedicine.com 57future science group
Acoustic microscopy: latest developments & applications REVIEW
the 200-MHz image. The intima and adventitia show higher ultrasonic attenuation than that of the media.
For the assessment of plaque rupture in a vulnerable plaque, SAM investigations on athero sclerosis-prone mice were performed. The acoustic properties of the normal vessel wall and plaques, particularly fibrous caps of lipid-rich plaques, were evaluated in the aortic roots of six normal C57BL mice and 12 athero-sclerosis-prone apoE-deficient (apoE-/-) mice by SAM. After processing, the attenuation of high-frequency (1.1-GHz) focused ultrasound was measured in unstained tissue sections by SAM followed by quantification of the amount and type of collagen in picrosirius red stained sec-tions by means of polarized light microscopy. Collagen appeared green in thin fibrous caps and bright orange in thick caps by polarized light microscopy. The attenuation of ultrasound was significantly higher in the collagen fibers with orange color compared with those with green color (17.2 vs 6.6 × 10³ dB/mm) [45].
Human carotid atherosclerotic lesions were observed by GHz-range SAM. The athero-sclerotic lesions were characterized by either thickened fibrosis with dense collagen fibers or lipid accumulation with sparse collagen net-work by optical microscopy. SAM revealed that the fibrosis was classified into type I and III collagen by attenuation of ultrasound and that the sound field of lipid accumulation lesions became inhomogeneous. The results would provide the scientific basis for the images of vulnerable plaques being produced in diagnostic ultrasound [46].
Comparison of in vivo IVUS image and in vitro excised tissue showed the importance of SAM for understanding lower ultrasound image. Figure 15 shows the comparison of optical microscope (Elastica-Masson staining), IVUS, SAM (attenuation) and SAM (sound speed) of thrombus in acute coronary syndrome. The tissue was obtained by an aspiration catheter (PercuSerge™, Medtronic, Minneapolis, MN, USA) in a clinical setting.
1500
1550
1600
1650
So
un
d s
pee
d (
m/s
)
4 8 16
1500
1550
1600
1650
So
un
d s
pee
d (
m/s
)
4 8 16 1500
1550
1600
1650
So
un
d s
pee
d (
m/s
)
4 8 16
1500
1550
1600
1650
So
un
d s
pee
d (
m/s
)
4 8 16
Control groupImmobilized group
I
Time (weeks)
Time (weeks)Time (weeks)
Time (weeks)
Figure 16. Gradation color images and sound speed changes of articular cartilage assessed by scanning acoustic microscopy. (A & B) shows gradation color images of the tibial articular cartilage at 16 weeks; (C & D) shows each corresponding area to each upper row with hematoxylin and eosin staining, respectively. (A & C) the immobilized group; (B & D) the control group; (E) gradation color scale bar. The low sound speed area gradually expanded from the surface of the articular cartilage in the immobilized group. (F & G) shows the femoral cartilage; (H & I) shows the tibial cartilage of the sound speed. (F & H) the transitional area; (G & I) the noncontact area.Reproduced with permission from [48].
Imaging Med. (2009) 1(1)58 future science group
REVIEW Saijo
n Articular tissuesAs described earlier, SAM data can be used as the basic data for assessing biomechanics of tissues and cells. Research into biomechanics is widely performed in the field of orthopedic surgery. The acoustic properties of rabbit supraspinatus tendon insertions were measured by SAM. In the tendon proper and the nonmineralized fibrocartilage, the sound speed and attenuation constant gradu-ally decreased as the predominant collagen type changed from I to II. In mineralized fibrocartilage, they increased markedly with the mineralization of the fibrocartilaginous tissue. These results indi-cate that the nonmineralized fibrocartilage shows the lowest elastic modulus among four zones at the insertion site, which could be interpreted as an adaptation to various types of biomechanical stress [47].
Our group also attempted to determine the changes of articular cartilage of the knee joint during immobilization in a rat model. The
knee joints of adult male rats were immobilized at 150° of flexion using an internal fixator for 3 days, and 1, 2, 4, 8 and 16 weeks. The articular cartilage from the medial midcondylar region of the knee was obtained, divided into three areas (noncontact area, transitional area and contact area), and, in each area, a degree of degenera-tion was evaluated by gross observation, histo-morphometric grading, and measurements of thickness and number of chondrocytes (Figure 16
shows the results). Degeneration of the articu-lar cartilage was mainly observed in the contact and transitional areas. Matrix staining intensity by safranin-O and the number of chondrocytes were decreased in these two areas. The thickness of the articular cartilage in the noncontact and contact areas was unchanged, but it was increased in the transitional area. Decrease in sound speed was observed in the transitional area of both the femoral and tibial cartilage, indicating the softening of the articular cartilage. The changes
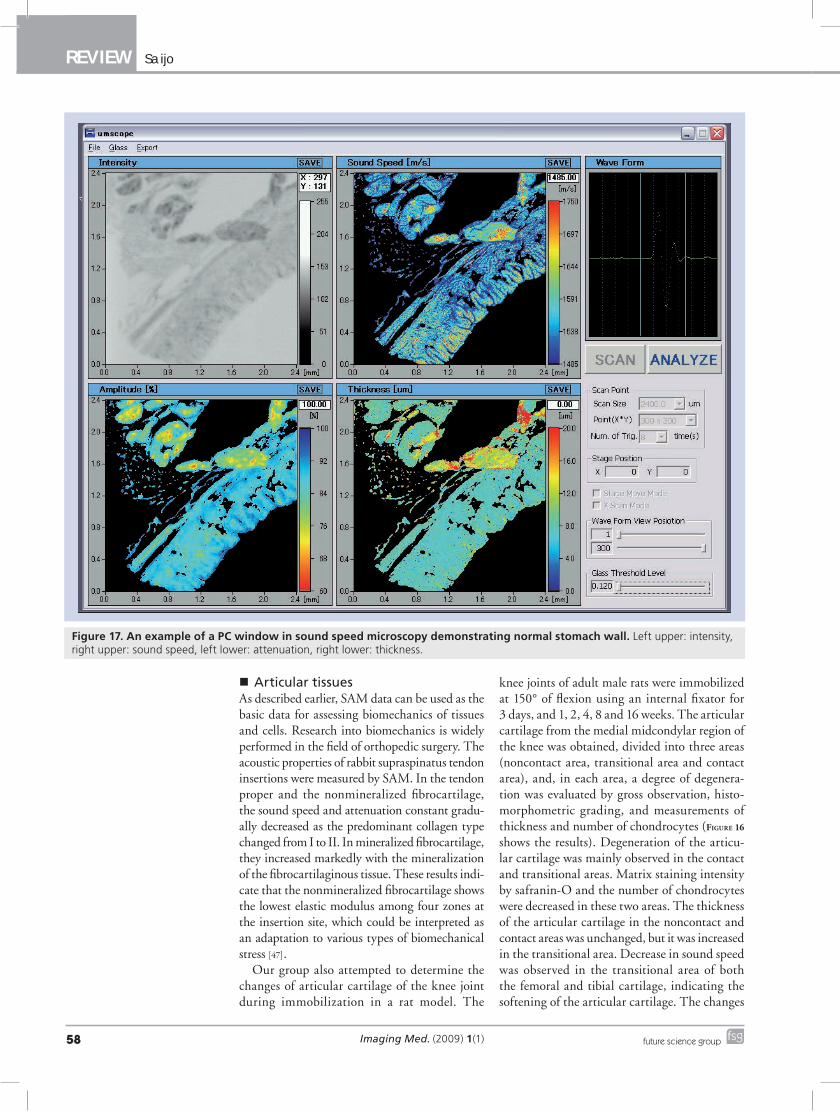
Figure 17. An example of a PC window in sound speed microscopy demonstrating normal stomach wall. Left upper: intensity, right upper: sound speed, left lower: attenuation, right lower: thickness.

www.futuremedicine.com 59future science group
Acoustic microscopy: latest developments & applications REVIEW
of articular cartilage became obvious as early as 1 week after immobilization. These changes may be due to a lack of mechanical stress or a lack of joint fluid circulation during immobilization [48].
Latest developments of acoustic microscopy in instrumentationWith the development of high-frequency engi-neering and computer science, acoustic micro-scopy is still developing in the 21st century. In previous SAMs, only the peak signal at each point was sampled and plotted as a 2D image. Ultrafast digitizer cards with a sampling fre-quency of more than 1 GHz have enabled us to capture the whole waveform at each point simul-taneously. The whole signal acquisition enabled ultrasound speed microscopy [49]. However, our old SAM still has advantages over recent SAMs in the scanning speed. The old SAM obtained 480 × 480 pixel image in 8 s while our new SAM obtained 300 × 300 pixel image in 60 s. The old SAM was constructed using precise hand-crafted technologies. In particular, the x-axis scan is driven by a spiral spring technique with an oscil-lating speed of 60 Hz that originated from the technologies used in the Japanese watch industry. The new SAM with the latest linear motors has not yet achieved such high-speed scanning.
n Ultrasound speed microscopyWhole reflection waveform from the glass sur-face was captured and used as a reference wave-form. The waveform obtained at the tissue area consisted of two reflections: one from the surface and one from the interface of the tissue and glass. The two components cannot be separated in a time domain ana lysis. Thus, frequency domain ana lysis was performed by analyzing the inter-ference between the two reflections. Intensity and phase spectra were calculated by Fourier transforming the waveform and normalized by the reference waveform. Thus, the thickness, attenuation and sound speed is calculated [49]. Figure 17 is the PC window of ultrasound speed microscopy representing stomach wall.
n Ultrasound impedance microscopyOne of the objectives of SAM application in medicine and biology is easy observation. Although classical SAM methods do not require tissue staining, they require thin slicing of the tissue. Figure 18 shows the concept of conventional SAM, ultrasound impedance microscopy and 3D ultrasound microscopy. For easier observa-tion, we have developed ultrasound impedance
microscopy. Figure 19 shows the schematic illustra-tion of the relation between the beam propaga-tion and the tissue. Figure 19A shows the classi-cal SAM. The ultrasound propagates through the thinly sliced specimen or cultured cells and reflects at the interface between the specimen and substrate. Figure 19B shows the ultrasound imped-ance microscopy. The ultrasound propagates through the thin plastic plate and is reflected at the interface between plastic and tissue [50].
The target signal is compared with the reference signal and interpreted into acoustic impedance, as shown in Figure 20:
1
1
1 .
1 .
Z
S
S
S
S
Z
S
S
Z Z
Z Z
S
S
Z Z
Z Z
Zargarg
arg
t ett et
t et
0
0
arg
arg
sub
ref
t et
sub ref
sub ref
ref
t et
sub ref
sub ref
sub=
+
-
=
++
-
-+
-
Ultrasound impedance microscope(Tissue surface)
3D ultrasound microscope(In vivo observation)
Conventional SAM(Thinly sliced tissue,single-layered cultured cells)
Imaging Med. © Future Science Group (2009)
Figure 18. Concept of conventional scanning acoustic microscopy, ultrasound impedance microscopy and 3D ultrasound microscopy.SAM: Scanning acoustic microscopy.
Transducer
Tissue
Glass
Penetrate through tissue, reflect atglass surface
Thin slicingrequired in vitro
Transducer
Tissue
TissuePlastic plate
Penetrate throughplastic plate, reflectat tissue surface
Thin slicing notrequired ex vivo
Acoustic microscopy Ultrasound impedance microscopy
Imaging Med. © Future Science Group (2009)
Figure 19. Relation between the beam propagation and the tissue in (A) conventional scanning acoustic microscopy and (B) ultrasound impedance microscopy.

Imaging Med. (2009) 1(1)60 future science group
REVIEW Saijo
WM
IGL
MLPL
Figure 21. Ultrasonic impedance microscope image of a rat brain. IGL: Internal granular layer; ML: Molecular layer; PL: Purkinje layer; WM: White matter in mature cerebellum. Image courtesy of Dr Sachiko Yoshida at Toyohashi University of Technology (Japan).
where Sref
: reflection from the reference; Starget
: reflection from the target; S
0: transmitted sig-
nal; Zref
: acoustic impedances of the reference; Z
sub: acoustic impedances of the substrate; Z
target:
acoustic impedances of the target.
Rats were dissected and the whole brain was removed. A sagittal section of the brain was pre-pared by a rotor slicer. The specimen was rinsed and preserved in phosphate-buffered saline. For optical observation, some adjacent slices were sub-jected to immunohistochemical staining against calbindin D-28k. Figure 21 shows the brain of a rat. Four layers are visible: molecular layer (ML), Purkinje layer, internal granular layer and white matter in mature cerebellum. Parallel fibers in ML are the axons of granule cells and play an impor-tant role in cerebella neural connection. Migrating granule cells elongate them horizontally and form many excitatory synapses to the dendrites of Purkinje cells. These are major neuronal circuits of the cerebellum, thus parallel fibers construct rich ML of the brain.
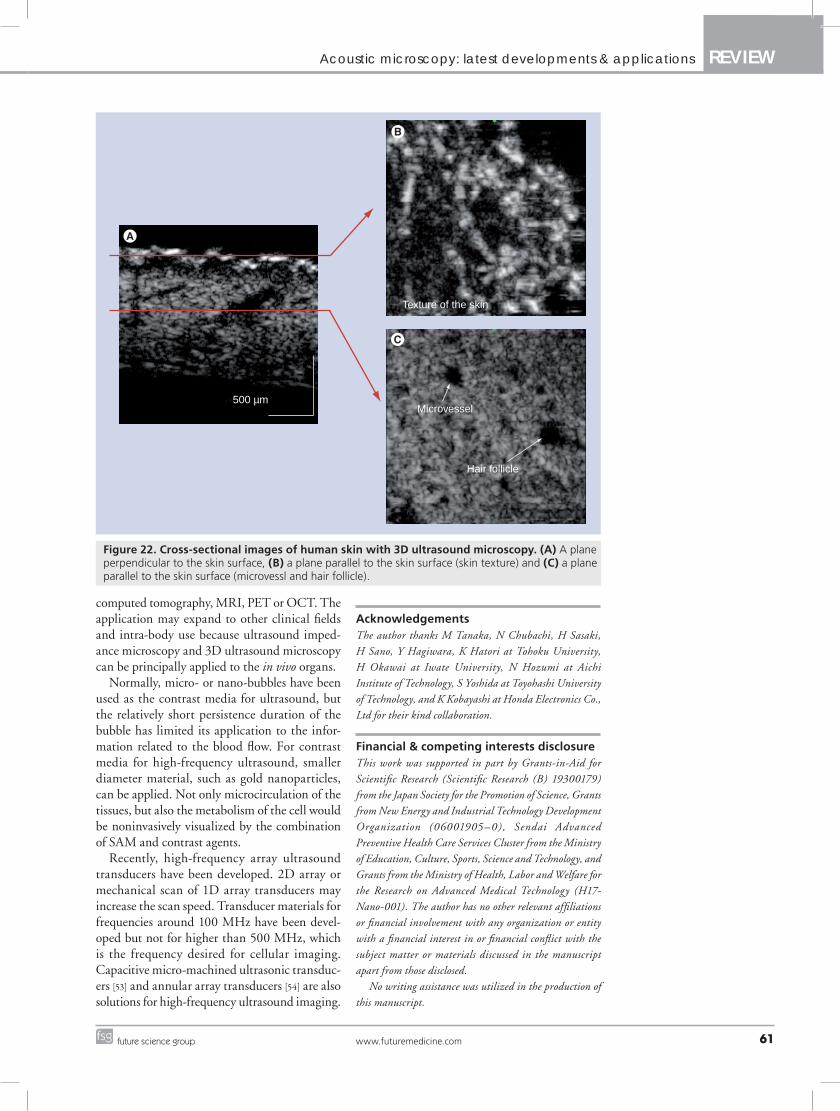
n 3D ultrasound microscopyAs the aforementioned systems 2D scan over the objects, small modification of the geometry of the ultrasound transducer and captured wavelength enabled 3D reflection data from a specimen. A polyvinylidene difluoride (PVDF) transducer with a diameter of 2.4 mm and a focal length of 3.2 mm was fabricated for 3D imaging, while a PVDF transducer with a diameter of 1.8 mm and a focal length of 1.5 mm was used for conven-tional SAM. Figure 22 shows the cross-sections of human skin; Figure 22A is a plane perpendicular to the skin surface, Figure 22B is a plane parallel to the skin surface demonstrating the texture of the skin and Figure 22C shows the microvessels and hair follicles. Figure 23 shows cross-sectional images of human skin with optical coherence tomography (OCT) [51]. The image quality of 3D ultrasound is comparative to that of OCT.
n Other latest technologiesClassically, a transducer was mechanically scanned over specimens in the SAMs. Fabrication of 2D, high-frequency array transducer for faster imag-ing and digital beam forming has been desired for years. Today, VisualSonics, led by Foster, released a 30–70-MHz linear-array probe for small animal imaging onto the market [52]. Lemor at Fraunhofer Institute (Munich, Germany) has also developed a linear-array probe with a frequency of 100 MHz. Mechanical scan of these linear-array transducers may realize a real-time scan in future SAMs.
Future perspectiveScanning acoustic microscopy will continue to be a unique imaging modality because it provides mechanical properties of tissues that are not visu-alized directly by other imaging modalities such as
SubstrateZtarget
Starget
S0
Target
TransducerTarget
Water
Zref
Sref
S0
Reference
Imaging Med. © Future Science Group (2009)
Figure 20. Signals in ultrasonic impedance microscopy. S0: Transmitted signal;
Sref
: reflection from the reference; Starget
: reflection from the target; Zref
: acoustic impedances of the reference; Z
target: acoustic impedances of the target.
www.futuremedicine.com 61future science group
Acoustic microscopy: latest developments & applications REVIEW
500 µm
Texture of the skin
Microvessel
Hair follicle
Figure 22. Cross-sectional images of human skin with 3D ultrasound microscopy. (A) A plane perpendicular to the skin surface, (B) a plane parallel to the skin surface (skin texture) and (C) a plane parallel to the skin surface (microvessl and hair follicle).
computed tomography, MRI, PET or OCT. The application may expand to other clinical fields and intra-body use because ultrasound imped-ance microscopy and 3D ultrasound microscopy can be principally applied to the in vivo organs.
Normally, micro- or nano-bubbles have been used as the contrast media for ultrasound, but the relatively short persistence duration of the bubble has limited its application to the infor-mation related to the blood flow. For contrast media for high-frequency ultrasound, smaller diameter material, such as gold nanoparticles, can be applied. Not only microcirculation of the tissues, but also the metabolism of the cell would be noninvasively visualized by the combination of SAM and contrast agents.
Recently, high-frequency array ultrasound transducers have been developed. 2D array or mechanical scan of 1D array transducers may increase the scan speed. Transducer materials for frequencies around 100 MHz have been devel-oped but not for higher than 500 MHz, which is the frequency desired for cellular imaging. Capacitive micro-machined ultrasonic transduc-ers [53] and annular array transducers [54] are also solutions for high-frequency ultrasound imaging.
AcknowledgementsThe author thanks M Tanaka, N Chubachi, H Sasaki, H Sano, Y Hagiwara, K Hatori at Tohoku University, H Okawai at Iwate University, N Hozumi at Aichi Institute of Technology, S Yoshida at Toyohashi University of Technology, and K Kobayashi at Honda Electronics Co., Ltd for their kind collaboration.
Financial & competing interests disclosureThis work was supported in part by Grants-in-Aid for Scientific Research (Scientific Research (B) 19300179) from the Japan Society for the Promotion of Science, Grants from New Energy and Industrial Technology Development Organization (06001905–0), Sendai Advanced Preventive Health Care Services Cluster from the Ministry of Education, Culture, Sports, Science and Technology, and Grants from the Ministry of Health, Labor and Welfare for the Research on Advanced Medical Technology (H17-Nano-001). The author has no other relevant affiliations or financial involvement with any organization or entity with a financial interest in or financial conflict with the subject matter or materials discussed in the manuscript apart from those disclosed.
No writing assistance was utilized in the production of this manuscript.

Imaging Med. (2009) 1(1)62 future science group
REVIEW Saijo
8 Bereiter-Hahn J: Architecture of tissue cells. The structural basis which determines shape and locomotion of cells. Acta Biotheor. 34(2–4), 139–148 (1985).
9 Litniewski J, Bereiter-Hahn J: Measurements of cells in culture by scanning acoustic microscopy. J. Microsc. 158(Pt 1), 95–107 (1990).
10 Veselý P, Lücers H, Riehle M, Bereiter-Hahn J: Subtraction scanning acoustic microscopy reveals motility domains in cells in vitro. Cell Motil. Cytoskeleton 29(3), 231–240 (1994).
11 Bereiter-Hahn J, Lüers H: Subcellular tension fields and mechanical resistance of the lamella front related to the direction of locomotion. Cell Biochem. Biophys. 29(3), 243–262 (1998).
12 Briggs GA, Wang J, Gundle R: Quantitative acoustic microscopy of individual living human cells. J. Microsc. 172(Pt 1), 3–12 (1993).
13 Weiss EC, Lemor RM, Pilarczyk G, Anastasiadis P, Zinin PV: Imaging of focal contacts of chicken heart muscle cells by
high-frequency acoustic microscopy. Ultrasound Med. Biol. 33(8), 1320–1326 (2007).
14 Weiss EC, Anastasiadis P, Pilarczyk G, Lemor RM, Zinin PV: Mechanical properties of single cells by high-frequency time-resolved acoustic microscopy. IEEE Trans. Ultrason. Ferroelectr. Freq. Control 54(11), 2257–2271 (2007).
15 Taggart LR, Baddour RE, Giles A, Czarnota GJ, Kolios MC: Ultrasonic characterization of whole cells and isolated nuclei. Ultrasound Med. Biol. 33(3), 389–401 (2007).
16 Brand S, Weiss EC, Lemor RM, Kolios MC: High frequency ultrasound tissue characterization and acoustic microscopy of intracellular changes. Ultrasound Med. Biol. 34(9), 1396–1407 (2008).
17 Suzuki S, Bing H, Sugawara T et al.: Paclitaxel prevents loss of pulmonary endothelial barrier integrity during cold preservation. Transplantation 78(4), 524–529 (2004).
18 Hagiwara Y, Saijo Y, Ando A et al.: Ultrasonic intensity microscopy for imaging of living cells. Ultrasonics 49(3), 386–388 (2009).
Figure 23. Cross-sectional images of human skin with optical coherence tomography. (A & B) Basal cell carcinoma and (C & D) normal skin.Reproduced with permission from [51].
Executive summary
� The principle and brief history of scanning acoustic microscopy (SAM) for medicine and biology are described here. SAM is able to visualize high-quality microscopy images of tissues and cells suitable for histopathological examinations.
� For bone, cartilage, tendon and cardiovascular tissues, micro-acoustic properties provided important information on biomechanical properties. Biomechanics of these tissues are especially important for assessing the pathophysiology.
� Cells are considered to consist of visco-elastic materials and SAM has shown information on viscosity by attenuation and information on elasticity by sound speed. Instead of stretching cells or using atomic force microscopy for measuring biomechanical properties, SAM can be used to measure precise mechanical property distribution without contact to the cells.
� SAM introduced a new form of contrast that is based on the mechanical properties of what is imaged. Recent developments such as ultrasound impedance microscopy, 3D ultrasound microscopy and high-frequency array transducer may realize a clinically applicable SAM in the near future.
Bibliography1 Sokolov S: The ultrasonic microscope.
Dokl. Akad. Nauk SSSR 64, 333–335 (1949).
2 Dunn F, Fry WJ: Ultrasonic absorption microscope. J. Acoust. Soc. Am. 31(5), 632–633 (1959).
3 Lemons RA, Quate CF: A scanning acoustic microscope. Proceedings of the 1973 IEEE Ultrasonics Symposium. 18–21 (1973).
4 Mikhailov IG, Soloviev VA, Syrnikov YP: Basics of Molecular Acoustics. Khimia Publ, Moscow, Russia (1964).
5 Lemons RA, Quate CF: Acoustic microscopy: biomedical applications. Science 188(4191), 905–911 (1975).
6 Johnston RN, Atalar A, Heiserman J, Jipson V, Quate CF: Acoustic microscopy: resolution of subcellular detail. Proc. Natl Acad. Sci. USA 76(7), 3325–3329 (1979).
7 Hildebrand JA, Rugar D, Johnston RN, Quate CF: Acoustic microscopy of living cells. Proc. Natl Acad. Sci. USA 78(3), 1656–1660 (1981).
www.futuremedicine.com 63future science group
Acoustic microscopy: latest developments & applications REVIEW
19 Peck SD, Briggs GA: A scanning acoustic microscope study of the small caries lesion in human enamel. Caries Res. 20(4), 356–360 (1986).
20 Peck SD, Briggs GA: The caries lesion under the scanning acoustic microscope. Adv. Dent. Res. 1(1), 50–63 (1987).
21 Peck SD, Rowe JM, Briggs GA: Studies on sound and carious enamel with the quantitative acoustic microscope. J. Dent. Res. 68(2), 107–112 (1989).
22 Meunier A, Katz JL, Christel P, Sedel L: A reflection scanning acoustic microscope for bone and bone-biomaterials interface studies. J. Orthop. Res. 6(5), 770–775 (1988).
23 Katz JL, Meunier A: Scanning acoustic microscope studies of the elastic properties of osteons and osteon lamellae. J. Biomech. Eng. 115(4B), 543–548 (1993).
24 Bumrerraj S, Katz JL: Scanning acoustic microscopy study of human cortical and trabecular bone. Ann. Biomed. Eng. 29(12), 1034–1042 (2001).
25 Chérin E, Saïed A, Pellaumail B et al.: Assessment of rat articular cartilage maturation using 50-MHz quantitative ultrasonography. Osteoarthr. Cartil. 9(2), 178–186 (2001).
26 Hofmann T, Heyroth F, Meinhard H, Fränzel W, Raum K: Assessment of composition and anisotropic elastic properties of secondary osteon lamellae. J. Biomech. 39(12), 2282–2294 (2006).
27 Raum K, Hofmann T, Leguerney I et al.: Variations of microstructure, mineral density and tissue elasticity in B6/C3H mice. Bone 41(6), 1017–1024 (2007).
28 Raum K: Microelastic imaging of bone. IEEE Trans. Ultrason. Ferroelectr. Freq. Control 55(7), 1417–1431 (2008).
29 Sano H, Hattori K, Saijo Y, Kokubun S: Does decalcification alter the tissue sound speed of rabbit supraspinatus tendon insertion? In vitro measurement using scanning acoustic microscopy. Ultrasonics 44(3), 297–301 (2006).
30 van der Steen AF, Cuypers MH, Thijssen JM, de Wilde PC: Influence of histochemical preparation on acoustic parameters of liver tissue: a 5-MHz study. Ultrasound Med. Biol. 17(9), 879–891 (1991).
31 Saijo Y, Tanaka M, Okawai H, Dunn F: The ultrasonic properties of gastric cancer tissues obtained with a scanning acoustic microscope system. Ultrasound Med. Biol. 17(7), 709–714 (1991).
32 Saijo Y, Tanaka M, Okawai H, Sasaki H, Nitta SI, Dunn F: Ultrasonic tissue characterization of infarcted myocardium
by scanning acoustic microscopy. Ultrasound Med. Biol. 23(1), 77–85 (1997).
33 Tanaka M, Neyazaki T, Kosaka S et al.: Ultrasonic evaluation of anatomical abnormalities of heart in congenital and acquired heart diseases. Br. Heart J. 33(5), 686–698 (1971).
34 Tanaka M, Nitta S, Nitta K et al.: Non-invasive estimation by cross sectional echocardiography of myocardial damage in cardiomyopathy. Br. Heart J. 53(2), 137–152 (1985).
35 Lythall DA, Bishop J, Greenbaum RA et al.: Relationship between myocardial collagen and echo amplitude in non-fibrotic hearts. Eur. Heart J. 14(3), 344–350 (1993).
36 Chandraratna PA, Whittaker P, Chandraratna PM, Gallet J, Kloner RA, Hla A: Characterization of collagen by high-frequency ultrasound: evidence for different acoustic properties based on collagen fiber morphologic characteristics. Am. Heart J. 133(3), 364–368 (1997).
37 Tabel GM, Whittaker P, Vlachonassios K, Sonawala M, Chandraratna PA: Collagen fiber morphology determines echogenicity of myocardial scar: implications for image interpretation. Echocardiography 23(2), 103–107 (2006).
38 Uusimaa P, Risteli J, Niemelä M et al.: Collagen scar formation after acute myocardial infarction: relationships to infarct size, left ventricular function, and coronary artery patency. Circulation 96(8), 2565–2572 (1997).
39 Kessler LW, Fields SI, Dunn F: Acoustic microscopy of mammalian kidney. J. Clin. Ultrasound 2(4), 317–320 (1974).
40 Sasaki H, Tanaka M, Saijo Y et al.: Ultrasonic tissue characterization of renal cell carcinoma tissue. Nephron 74(1), 125–130 (1996).
41 Sasaki H, Saijo Y, Tanaka M, Nitta S, Yambe T, Terasawa Y: Characterization of renal angiomyolipoma by scanning acoustic microscopy. J. Pathol. 181(4), 455–461 (1997).
42 Sasaki H, Saijo Y, Tanaka M et al.: Acoustic properties of dialysed kidney by scanning acoustic microscopy. Nephrol. Dial. Transplant. 12(10), 2151–2154 (1997).
43 Saijo Y, Hozumi N, Lee C et al.: Ultrasonic speed microscopy for imaging of coronary artery. Ultrasonics 44(Suppl. 1), e51–e55 (2006).
44 Saijo Y, Ohashi T, Sasaki H, Sato M, Jorgensen CS, Nitta S: Application of scanning acoustic microscopy for assessing
stress distribution in atherosclerotic plaque. Ann. Biomed. Eng. 29(12), 1048–1053 (2001).
45 Saijo Y, Jørgensen CS, Falk E: Ultrasonic tissue characterization of collagen in lipid-rich plaques in apoE-deficient mice. Atherosclerosis 158(2), 289–295 (2001).
46 Saijo Y, Jørgensen CS, Mondek P, Sefránek V, Paaske W: Acoustic inhomogeneity of carotid arterial plaques determined by GHz frequency range acoustic microscopy. Ultrasound Med. Biol. 28(7), 933–937 (2002).
47 Sano H, Saijo Y, Kokubun S: Non-mineralized fibrocartilage shows the lowest elastic modulus in the rabbit supraspinatus tendon insertion: measurement with scanning acoustic microscopy. J. Shoulder Elbow Surg. 15(6), 743–749 (2006).
48 Hagiwara Y, Ando A, Chimoto E, Saijo Y, Ohmori-Matsuda K, Itoi E: Changes of articular cartilage after immobilization in a rat knee contracture model. J. Orthop. Res. 27(2), 236–242 (2009).
49 Saijo Y, Santos Filho E, Sasaki H et al.: Ultrasonic tissue characterization of atherosclerosis by a speed-of-sound microscanning system. IEEE Trans. Ultrason. Ferroelectr. Freq. Control 54(8), 1571–1577 (2007).
50 Saijo Y, Hozumi N, Kobayashi K et al.: Ultrasound speed and impedance microscopy for in vivo imaging. Conf. Proc. IEEE Eng. Med. Biol. Soc. 2007, 1350–1353 (2007).
51 Mogensen M, Joergensen TM, Nürnberg BM et al.: Assessment of optical coherence tomography imaging in the diagnosis of non-melanoma skin cancer and benign lesions versus normal skin: observer-blinded evaluation by dermatologists and pathologists. Dermatol. Surg. 35(6), 965–972 (2009).
52 Lukacs M, Yin J, Pang G et al.: Performance and characterization of new micromachined high-frequency linear arrays. IEEE Trans. Ultrason. Ferroelectr. Freq. Control 53(10), 1719–1729 (2006).
53 Demirci U, Ergun AS, Oralkan O, Karaman M, Khuri-Yakub BT: Forward-viewing CMUT arrays for medical imaging. IEEE Trans. Ultrason. Ferroelectr. Freq. Control 51(7), 887–895 (2004).
54 Mamou J, Aristizábal O, Silverman RH, Ketterling JA, Turnbull DH: High-frequency chirp ultrasound imaging with an annular array for ophthalmologic and small-animal imaging. Ultrasound Med. Biol. 35(7), 1198–1208 (2009).