acoustic measurement of suspended fine particle ... center for physical acoustics, university of...
TRANSCRIPT
United States Department of Agriculture Agricultural Research Service
National Sedimentation Laboratory
Oxford, Mississippi 38655
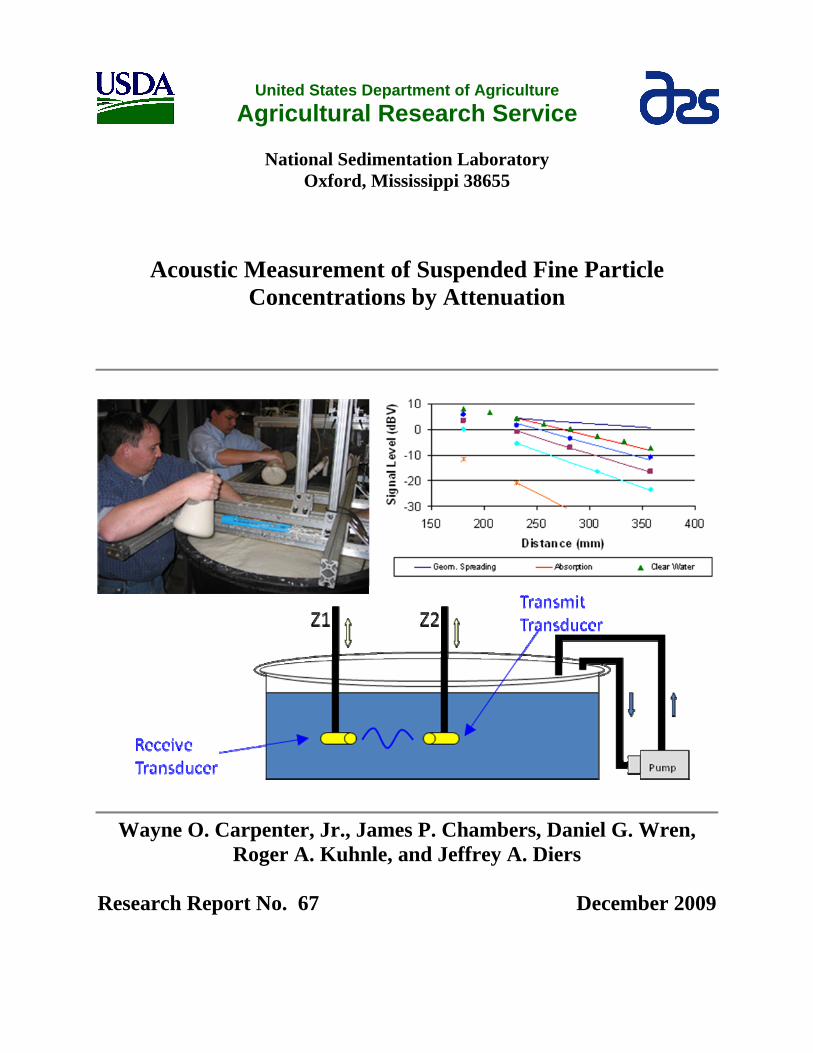
Acoustic Measurement of Suspended Fine Particle Concentrations by Attenuation
Wayne O. C el G. Wren, Roger A. Kuhnle, a d Jeffrey A. Diers
Research Report No. 67 December 2009
arpenter, Jr., James P. Chambers, Danin
Acoustic Measurement of Suspended Fine Particle Concentrations by Attenuation
Wayne O. Carpenter, Jr. and James P. Chambers
National Center for Physical Acoustics, University of Mississippi, 1 Coliseum Drive, University,
MS 38677-1848
Daniel G. Wren, Roger A. Kuhnle, and Jeffrey A. Diers
USDA-ARS-NSL, P.O. Box 1157, Oxford, MS 38655
Abstract
Knowledge of sediment concentration is important in the study of streams and rivers.
The work presented explores the appropriate frequency and transducer spacing for acoustic
measurement of suspended particles in the range of 0.1 – 64 microns. High frequency (20 MHz)
acoustic signal attenuation was used to measure the concentration of fine sediment particles in a
laboratory environment. A small tank with a pitch-catch transducer configuration was used to
measure the attenuation caused by kaolinite, bentonite, and silt concentrations over a range of
distances (180 – 357 mm). As much as a 35 dB change in signal level was observed over a range
of kaolinite and bentonite concentrations (1 – 14 g/L) and silt concentrations (1.5 – 5.5 g/L) over
the 180 mm to 357 mm range. Additional measurements to assess the limits of detection of the
setup were performed at 180 mm for kaolinite concentrations (0.01 – 0.7 g/L), bentonite
concentrations (0.01 – 0.7 g/L), and silt concentrations (0.006 – 0.7 g/L). The data suggest that a
fixed distance of 180 mm between the transducers will be capable of measuring a wide range of
concentrations. The ultimate goal of this project is the fabrication and deployment of an
autonomous instrument for field studies of fine sediments transported by streams and rivers.
1

I. Introduction
Suspended sediments are a global-scale pollutant whose yield has been estimated at 20 billion
tons per year.1 In many streams, the majority of sediment moves during flood events caused by
a few large storms per year.2 These flood events are unpredictable and frequently occur at night,
making the collection of physical sediment samples difficult and sometimes dangerous. Manual
techniques yield samples that are widely spaced in time, small in number, and flow intrusive. To
improve the spatial and temporal density of suspended sediment data, the continuing
development of automated measurement systems is essential. Ultrasonic measurement systems
can detect particles with a high degree of both spatial and temporal resolution, making them ideal
for addressing the needs those who rely on sediment data.3,4
Acoustic technology has great potential for improving the current state of suspended-
sediment measurement technology; it can be relatively inexpensive, lends itself well to remote
deployment, and is non-intrusive.5 Most acoustic systems have targeted sand sized particles (62-
2000 µm) due to their heterogeneous distribution with depth.4 However, a large portion of the
sediment load in a stream may be <62 µm, a size range that is well-distributed throughout the
cross-section.6,7 These fine sediment particle concentrations have been observed to be as high as
56% by weight.8,9
This report describes experiments aimed at the development of a device that will use
measurements of acoustic signal attenuation during propagation through water containing clay
and silt particles to determine the particle concentration. The two clays, kaolinite and bentonite,
were chosen for several reasons. In the sea floor, clays represent 40-80% of silicate minerals in
pelagic sediments.10 There is also a strong effect of kaolinite content on the acoustic properties
in sedimentary rocks and unconsolidated mixtures.11,12 Bentonite at 0.2 µm and kaolinite at 5
2

µm represent a wide range of clay particle sizes. These two clays are also readily available from
commercial sources. In a river with suspended sediment loads, silt concentrations may reach
10g/L or more. These high silt concentrations cause abrasion on the turbines. It is
recommendable to shut down the turbines to prevent damage if particle concentration is higher
than 5 g/L.13
Previous work on acoustic attenuation by fine particles focused on fixed pitch/catch
configuration distances. Greenwood et al.14 measured ultrasonic attenuation in a kaolin-water
slurry (1 micron particles) from 0-0.2 volume fraction and utilized a frequency range of 0.5-3
MHz at a fixed distance of approximately 0.1016 m. At each frequency, they found that
attenuation was a linear function of the volume fraction and had a linear dependence on
frequency within the 0.5 – 3 MHz range. To measure kaolinite/water suspensions in near 40%
solid-volume, Green and Esquivel-Sirvent (1999)15 used a bench-top 1L suspension chamber
with two ultrasonic transducers (3.5 and 7 MHz) and a micrometer stage allowing adjustments in
transmit/receive path length. The effect of the increasing frequency produced only a moderate
increase in attenuation and a slight increase in the concentration of maximum absorption. The
present work focuses on suspended sediment concentrations much smaller (0.010 – 14 g/L) than
some of the aforementioned studies. These lower concentrations, which encompass what one
would find in streams,11 made it possible to neglect multiple scattering since the concentrations
were below 10 g/L.16
II. Methods and Equipment
Experimental data were collected in a recirculation tank at the National Center for Physical
Acoustics (NCPA) in collaboration with the USDA-ARS-National Sedimentation Laboratory. A
3
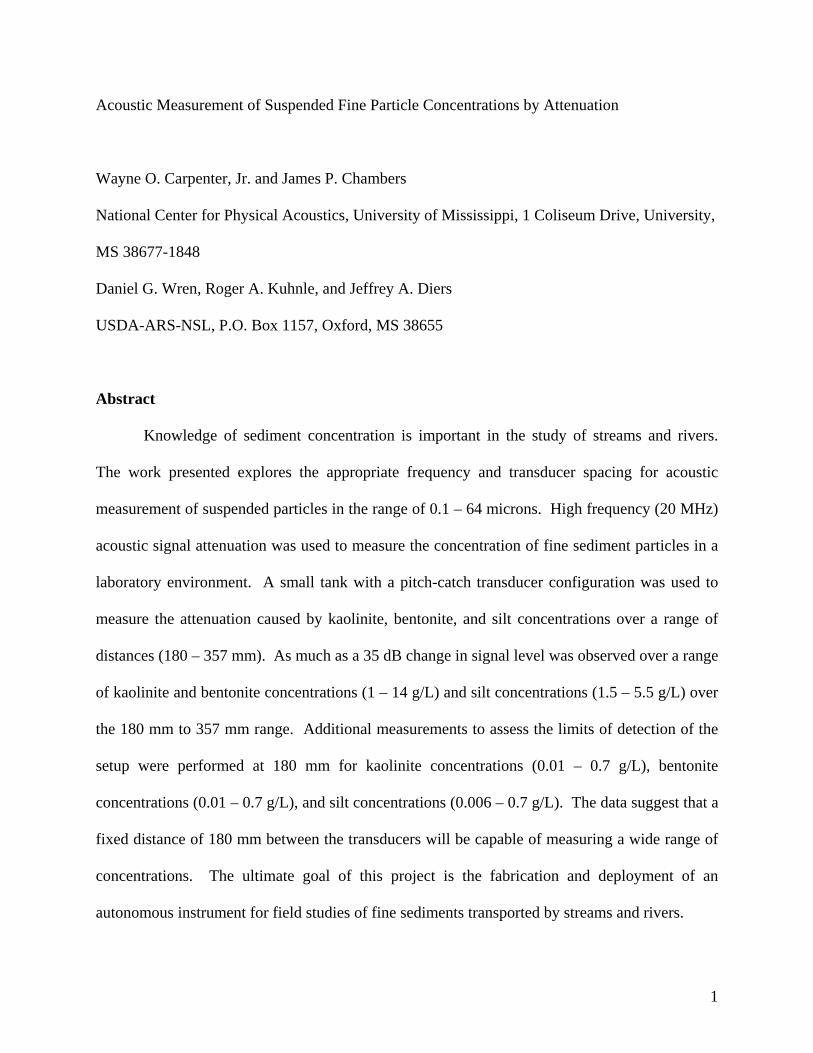
110 gallon (416.9 L) elliptical tank was used to recirculate and suspend the fine sediment
particles as illustrated in Figure 1. The dimensions of the tank were 126 cm long, 85 cm wide,
and 51.5 cm deep. The water and fine sediment particles were recirculated using a Weg Electric
Corp. ½ hp 220V centrifugal pump. The tank had extruded aluminum rails mounted on its top to
allow three-dimensional alignment of the transducers. A point gauge was mounted to the rails to
verify that the same water level was used during the measurements.
FIG. 1. Recirculation tank
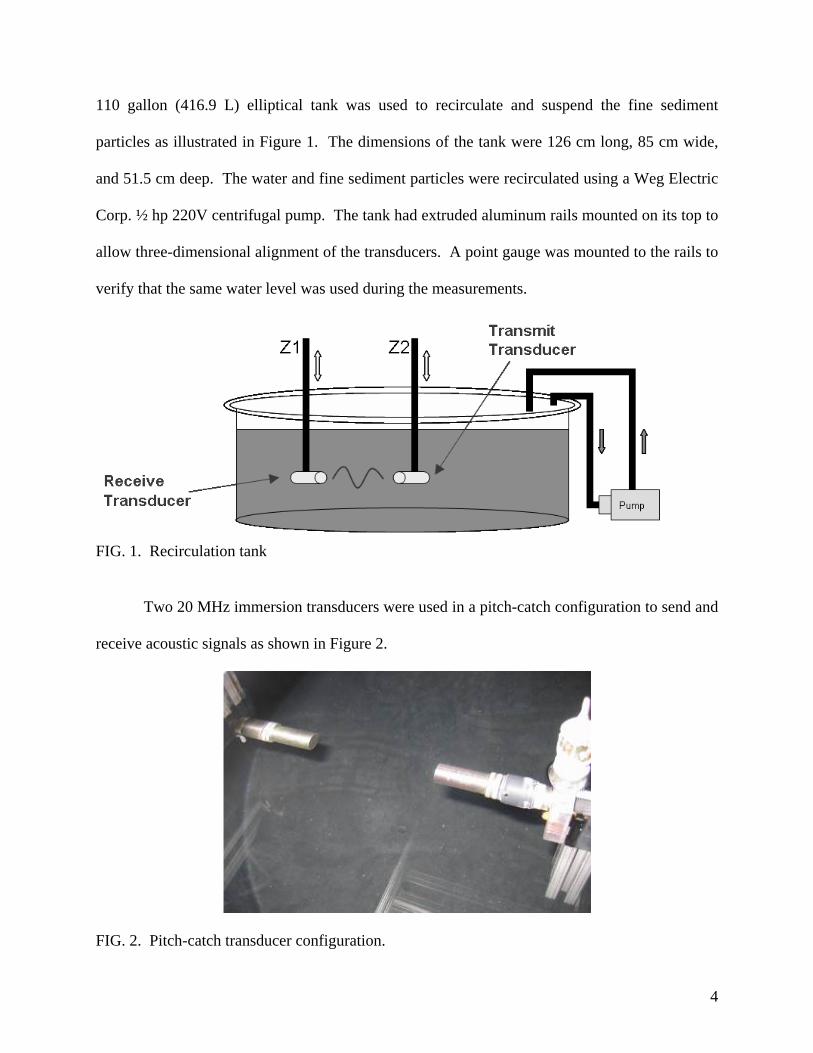
Two 20 MHz immersion transducers were used in a pitch-catch configuration to send and
receive acoustic signals as shown in Figure 2.
FIG. 2. Pitch-catch transducer configuration.
4

The transducers were placed 4.5 cm under the water surface and separated by 2.8 – 36.0 cm in
2.54 cm increments. At each range setting, the transducers were aligned by adjusting their
position until the maximum signal amplitude was achieved, thus ensuring that the active
elements were aligned with one another. The data were collected and averaged for 1000 bursts
per range setting. Each experiment was repeated three times and the results were averaged.
Averaging was used to remove statistical variations due to the random relative motion of the
scatterers.17
The acoustic data collection system consisted of off-the-shelf components for
transmitting and acquiring acoustic data. A custom written LabVIEW program was used to
operate the instruments. A Hewlett Packard 3314A function generator transmitted the acoustic
signal. The waveform tone burst was set to 10Vpeak, 100 cycles, and a 10 ms delay between
bursts to allow the reverberant signal to completely dissipate. The signal was both sent and
received with NDT Systems IBHG202 20 MHz immersion transducers with a ¼” (3 mm)
diameter active element. At 20 MHz, the generated acoustic wavelength in clear water is
approximately 74 µm. The sediment particle size range was 0.1-64 microns. The near-field
length, N, for these transducers is given as 136 mm and the half angle beam width is 0.365o.
Thus, we expect to be well in the far field at a distance of 230 mm and not have any multipath
effects from the surface. The received acoustic signal was amplified by an Olympus 5682 500
KHz - 25 MHz preamplifier, and then captured with a National Instruments 2-channel, 8-bit,
1GS/s per channel oscilloscope card (NI PXI-PCI-5152).
Kaolinite and bentonite with concentrations of 0.01 – 24 g/L and silt with concentrations
of 0.006 – 24 g/L in tap water (70 – 72 ˚F) were used in the experiments. The kaolinite particles
had a particle diameter range of 2 – 5 µm. The bentonite particles had a particle diameter of 0.2-
5

1µm. The kaolinite particles stayed well separated due to the recirculation pump, but the
bentonite particles tended to flocculate. Therefore, prior to adding the bentonite to the
circulation tank, sodium hexametaphosphate, a deflocculant, was added in a 1:100 ratio and
allowed to completely dissolve. The mixing process is shown in Figure 3.
FIG. 3. Adding fine sediment concentrations to the recirculation tank.
The silts had a particle diameter range of 45 – 60 µm. The silt particles were separated, but
required more mixing time to insure all particles were suspended.
Duplicate 1-L pump samples were taken in pre-tared pyrex flasks at each concentration.
Samples of the fluid/sediment mixture were used to verify that a uniform distribution of particles
in the tank was achieved. The physical samples were obtained using a vacuum pump connected
by a hose to a small bronze tube near the receive transducer. Concentrations were determined by
weighing each fluid/sediment sample, decanting the sample, and placing the sediment into pre-
tared pans that were oven dried at 60˚C for approximately 48 hours. Then, the flasks were re-
weighed to obtain particle mass and sediment concentration.
6
III. Theoretical model
In the following expression, the received voltage as a function of range and concentration is
determined by both spherical spreading and absorption due to either pure water or the water-
sediment mixture.18
)(00 0RReRRVV −−= α (1)
The reference voltage, V0, is recorded at the reference position, R0. The reference data point
V0R0 must be selected outside of the near-field of the transducer. The reference distance used in
these experiments is 230 mm. The measured voltage, V, corresponds to the position, R. The
total sound attenuation coefficient, α, is a function of water temperature and suspended-particle
concentration. It should be noted that the purpose of the work is not to determine the attenuation
of the sediment from scattering theory,18 but rather to determine if the presence of suspended
particles in concentrations that commonly occur in streams will cause enough signal attenuation
to be usable for field measurements.
To estimate the absorption coefficients for each of the concentrations, the clear water
reference voltage and associated distance is compared to the measured voltage resulting from the
fine sediment particle concentration. The resulting attenuation values are averaged over all
distances for each concentration. This provides an absorption coefficient for each concentration.
IV. Experimental findings
Figure 4 shows the results for signal loss in the estimated far-field past 180 cm for both pure
water and kaolinite mixtures. The geometrical spreading curve shows the 6 dB loss per doubling
7

of distance (6 dB/DD) associated with simple spherical spreading while the data shows the
significant contribution of attenuation to signal loss from both tap water and suspended sediment
mixtures. For the purpose of prediction and evaluation of an absorption coefficient, the data at a
range of 230 mm was used as the start of the far field as the data closer than this shows the
residual effect of the near field. The absorption coefficient for the water used in these
experiments was found to be 8.3 Np/m, which is comparable to the 8.7 Np/m one can calculate
for distilled water at 72˚F. B is an empirical constant with a value of 3.38x10⁻⁶ Np/m.19
⎟⎠⎞
⎜⎝⎛
+⋅
×=
⋅=
27315206
2
109.21 TT
T
f
ffBα (2)
(3)
Any discrepancy, perhaps due to specific water chemistry, would be present for both the
reference clear water and water-sediment mixtures both in the lab experiment and ultimately
field measurements.
Figure 4 also shows the signal level changes with range for kaolinite concentrations
ranging from 1.4 – 13.6 g/L. As the concentration increases, absorption increases and the signal
level decreases. Using Equation 1, the absorption coefficient was estimated for each
concentration of kaolinite using a best fit to the data and is shown in Table I.
8

-30
-25
-20
-15
-10
-5
0
5
10
150 200 250 300 350 400
Distance (mm)
Sig
nal L
evel
(dB
V)
Geom. Spreading Absorption & Spreading Clear Water
1.4 g/L Kaolinite 2.8 g/L Kaolinite 5.6 g/L Kaolinite
13.6 g/L Kaolinite
FIG. 4. Signal level (dBV) for kaolinite concentrations (1.4 – 13.6 g/L).
Concentration (g/L) Absorption (Np/m)
1.4 11.2
2.8 13.7
5.6 19.6
TABLE I. Kaolinite concentrations and calculated absorption coefficients
Figure 5 shows the signal level changes for bentonite with concentrations ranging from
1.7 – 13.4 g/L. Figure 3 also shows the signal level for geometrical spreading and absorption in
clear and sediment laden water at pre-determined distances for data past 230 mm. Similar to the
kaolinite measurements, as the concentration increases, absorption increases and the signal level
decreases. However, the signal levels for the bentonite mixtures are higher and the absorption is
lower than in the kaolinite mixtures. Kaolinite particles are larger than bentonite, and should be
9

expected to scatter and attenuate more signal than a similar concentration of bentonite particles.
The calculated attenuations for the bentonite mixtures are shown in Table II.
-30
-25
-20
-15
-10
-5
0
5
10
150 200 250 300 350 400
Distance (mm)
Sign
al L
evel
(dBV
)
Geom. Spreading Absorption & Spreading Clear Water
1.7 g/L Bentonite 2.9 g/L Bentonite 5.7 g/L Bentonite
13.4 g/L Bentonite
FIG. 5. Signal level (dBV) for bentonite concentrations (1.7 – 13.4 g/L) at pre-determined distances.
Concentration (g/L) Absorption (Np/m)
1.7 9.5
2.9 11.2
5.7 13.0
13.4 20.6
TABLE II. Bentonite concentrations and calculated absorption coefficients
Figure 6 shows the signal level changes for silt with concentrations ranging from 1.5 –
5.5 g/L. Additional measurements at higher concentrations could not be determined, because the
signal to noise ratio was extremely low (20 mVpp). Similar to the previous plots, Figure 6 shows
10
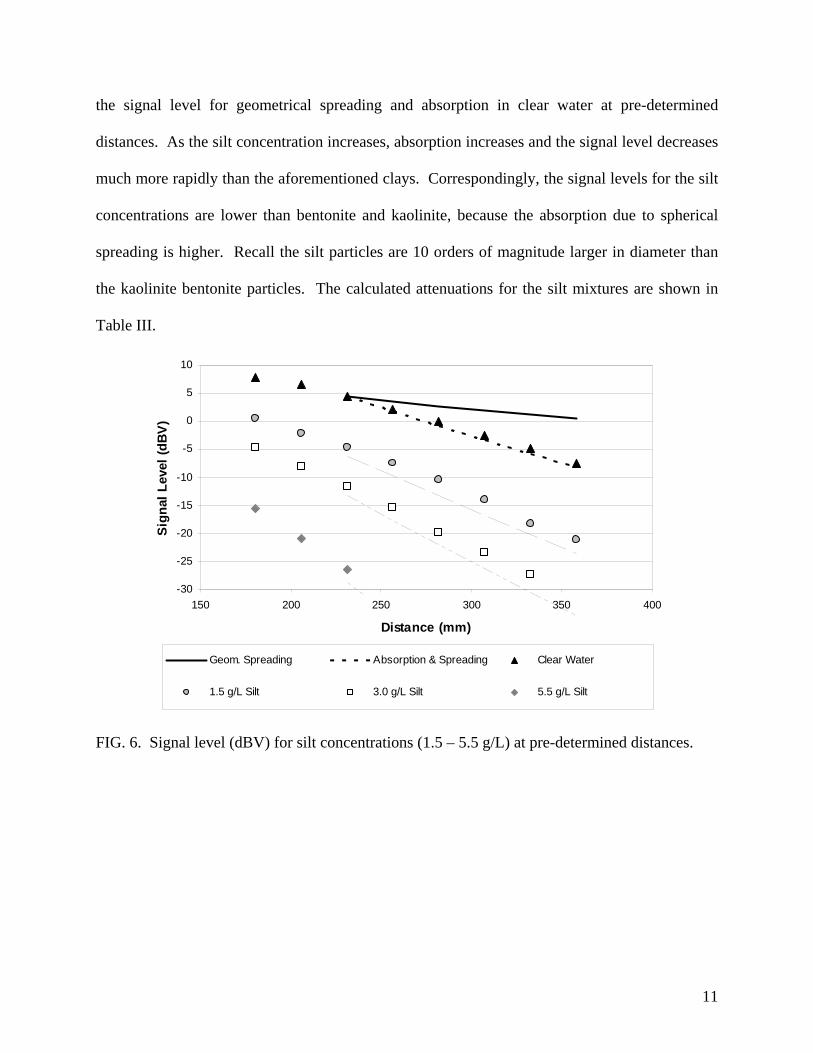
the signal level for geometrical spreading and absorption in clear water at pre-determined
distances. As the silt concentration increases, absorption increases and the signal level decreases
much more rapidly than the aforementioned clays. Correspondingly, the signal levels for the silt
concentrations are lower than bentonite and kaolinite, because the absorption due to spherical
spreading is higher. Recall the silt particles are 10 orders of magnitude larger in diameter than
the kaolinite bentonite particles. The calculated attenuations for the silt mixtures are shown in
Table III.
-30
-25
-20
-15
-10
-5
0
5
10
150 200 250 300 350 400
Distance (mm)
Sign
al L
evel
(dBV
)
Geom. Spreading Absorption & Spreading Clear Water
1.5 g/L Silt 3.0 g/L Silt 5.5 g/L Silt
FIG. 6. Signal level (dBV) for silt concentrations (1.5 – 5.5 g/L) at pre-determined distances.
11

Concentration (g/L) Absorption (Np/m)
1.5 12.3
3.0 15.8
5.5 23.5
TABLE III. Silt concentrations and calculated absorption coefficients
For kaolinite and bentonite concentrations within the range of approximately 13 – 23 g/L,
attenuation measurements were recorded in the near field at pre-determined distances from 28 –
180 mm in 2.54 cm increments. Attenuation of silt concentrations in the near field were
recorded in the range of 5.5 – 24.4 g/L. Figures 7, 8, and 9 show the near field measurements of
kaolinite, bentonite, and silt concentrations, respectively.
-30
-25
-20
-15
-10
-5
0
5
10
15
0 20 40 60 80 100 120 140 160 180 200
Distance (mm)
Sign
al L
evel
(dB
V)
Clear Water 13.6 g/L Kaolinite 18.7 g/L Kaolinite 23.3 g/L Kaolinite
FIG. 7. Signal level (dBV) for kaolinite concentrations (13.6 – 23.3 g/L) at pre-determined distances in the near field.
12

-30
-25
-20
-15
-10
-5
0
5
10
15
0 20 40 60 80 100 120 140 160 180 200
Distance (mm)
Sign
al L
evel
(dB
V)
Clear Water 13.4 g/L Bentonite 18.7 g/L Bentonite 23.6 g/L Bentonite
FIG. 8. Signal level (dBV) for bentonite concentrations (13.4 – 23.6 g/L) at pre-determined distances in the near field.
-30
-25
-20
-15
-10
-5
0
5
10
15
0 20 40 60 80 100 120 140 160 180 200
Distance (mm)
Sign
al L
evel
(dBV
)
Clear Water 5.5 g/L Silt 14.1 g/L Silt 18.9 g/L Silt 24.4 g/L Silt
FIG. 9. Signal level (dBV) for silt concentrations (5.5 – 24.5 g/L) at pre-determined distances in the near field.
While we have performed calculations to investigate the attenuation beginning at 230 mm
and beyond, the data at 180 mm has significance in that we are able to investigate the full range
13

of sediment concentrations considered. At distances greater than 180 mm, the attenuation caused
by high concentrations is greater than the dynamic range of our instrumentation and the signal is
lost in the noise. Conversely, at ranges closer than 180 mm (data not presented) it was difficult
to distinguish the attenuation of lowest sediment concentrations from that of clear water.
Figure 10 shows signal level relative to clear water for various kaolinite, bentonite, and
silt concentrations at 180 mm. The tested concentration range was 1.4 – 14.1 g/L for kaolinite,
1.7 – 13.4 g/L for bentonite, and 1.5 – 5.5 g/L for silt. The signal level loss due to water
attenuation (approximately 8dBV) has been subtracted from this data to show the effect of
increasing particle concentration. As indicated in the plot, an increase in suspended sediment
concentration resulted in a corresponding decrease in signal level. An increase in particle size
diameter (i.e. silt particles are larger than kaolinite particles, which are larger than bentonite
particles) also resulted in a decrease in signal level. The 20 MHz acoustic system was able to
measure signal loss over the entire range of concentrations considered at the 180 mm range.
-40.000
-35.000
-30.000
-25.000
-20.000
-15.000
-10.000
-5.000
0.000
5.000
0 5 10 15
Concentration (g/L)
Sign
al L
evel
Diff
eren
ce (d
BV re
to
clea
r wat
er)
Kaolinite Bentonite Silt
FIG. 10. Signal level (dBV) for kaolinite, bentonite, and silt concentrations at a distance of 180 mm signal level of clear water subtracted from measurements.
14

In Figure 11, additional measurements were performed to assess the low concentration
measurement limits of the experimental setup at the 180 mm range. The measurements were
performed at 180 mm for kaolinite and bentonite concentrations (0.01 – 0.7 g/L) and silt
concentrations (0.006 – 0.7 g/L). Note kaolinite and bentonite concentrations at 0.006 g/L were
undetected.
-5.000
-4.500
-4.000
-3.500
-3.000
-2.500
-2.000
-1.500
-1.000
-0.500
0.000
0 0.2 0.4 0.6 0.8 1
Concentration (g/L)
Sig
nal L
evel
Diff
eren
ce (d
BV
re to
cl
ear
wat
er)
Kaolinite Bentonite Silt
FIG. 11: Signal level (dBV) for kaolinite, bentonite, and silt concentrations at a distance of 180 mm signal level of clear water subtracted from measurements.
It is evident from Figures 10 and 11 that similar concentrations of different fine materials
can cause different levels of signal attenuation. This will present similar challenges to the
measurement of sand sized particles with respect to the effect of particle size on the accuracy of
concentration measurement. It may be possible to make educated assumptions to narrow down
the range of possible particle sizes, or to use a combination of attenuation/backscatter to
constrain the problem. These issues will be explored more fully in future work; however, the
15

work reported here establishes an important baseline that will be used in the design of new
experiments and instrumentation.
V. Conclusion
The feasibility of measuring particle concentration using the attenuation of high frequency
acoustic waves traversing a suspension of fine particles in water was investigated in a series of
laboratory experiments. The data showed that, as concentration increased, attenuation increased
and signal level decreased over a distance and using a frequency that are physically reasonable
for field measurements. The use of a 20 MHz pitch/catch transducer arrangement to measure the
concentration of 5 micron particles, or smaller, suspended in water appears to be practical at a
range of distances from 180 mm to 357 mm. In the 180 – 357 mm range, the tested
concentration range was 1.4 – 13.6 g/L for kaolinite, 1.7 – 13.4 g/L for bentonite, and 1.5 – 5.5
g/L for silt. Near field measurements in the 28 – 180 mm range had a tested concentration range
of 13.6 – 23.3 g/L for kaolinite, 13.4 – 23.6 g/L for bentonite, and 5.5 – 24.4 g/L for silt. At the
180 mm range, the pitch-catch configuration was capable of detecting concentration ranges of
0.01 – 13.6 g/L for kaolinite, 0.01 – 13.4 g/L for bentonite, and 0.006 – 5.5 g/L for silt. This
work suggests that fixed distance measurements of approximately 180 mm can be used to
evaluate a broad range of concentrations in the field.
VI. Future Work
This data suggest that a fixed distance between transducers will be capable of measuring a wide
range of concentrations. Subsequent experiments will include acoustic attenuation
measurements of clay/silt mixtures to better represent fluvial environments.
16
Future work will include the fabrication and deployment of an autonomous instrument for
field studies of fine sediments transported by streams and rivers. Several hardware components
of the laboratory setup (i.e. Hewlett Packard 3314A function generator and National Instruments
2-channel, 8-bit, 1GS/s per channel oscilloscope card) will be replaced by a digital signal
possessor, transmitter, and receiver boards in a rugged, field deployable housing. These products
are still in development.
Acknowledgments
The research reported here was supported by the Federal Interagency Sedimentation Project.
This work would not have been possible without the capable efforts of J. D. Heffington and
Patrick Coln.
References
1 J. N. Holeman, “The sediment yield of major rivers of the world,” Water Resour. Res. 4, 737–
747 (1968).
2 M. E. Nelson and P. C. Benedict, “Measurement and analysis of suspended loads in streams,”
Trans. Am. Soc. Civ. Eng., Proceedings, No. 31, Paper No. 2450, 891–918 (1950).
3 C. Shen and U. Lemmin, “Ultrasonic measurements of suspended sediments: A concentration
profiling system with attenuation compensation,” Meas. Sci. Technol. 7, 1191–1194 (1996).
4 P. D. Thorne, G. P. Holdaway, and P. J. Hardcastle, “Constraining acoustic backscatter
estimates of suspended sediment concentration profiles using the bed echo,” J. Acoust. Soc. Am.
98(4), 2280–2288 (1995).
17
5 D. G. Wren, B. D. Barkdoll, R. A. Kuhnle, and R. W. Derrow, “Field techniques for
suspended-sediment measurement,” J. Hydrol. Eng. 126, 97–104 (2000).
6 R. A. Kuhnle, S. J. Bennett, C. V. Alonso, R. L. Bingner, and E. Langendoen, “Sediment
transport processes in agricultural watersheds,” Int. J. Sediment Res. 15, 182–197 (2000).
7 R. A. Kuhnle, D. G. Wren, and J. P. Chambers, “Prediction of the grain size of suspended
sediment: Implications for calculating suspended sediment concentrations using single frequency
acoustic backscatter,” Int. J. Sediment Res. 22, 1–15 (2007).
8 E. W. Lane, “Notes on limit of sediment concentration,” J. Sediment Petrol. 10, 95–96 (1940).
9 C. T. Yang, F. J. M. Simoes, “Wash load and bed-material load transport in theYellow River,”
J. Hydrol. Eng. 131(5), 415–416 (2005).
10 D. Eisma, Suspended Matter in the Aquatic Environments (Springer-Verlag, Berlin, 1993).
11 B. Kowallis, L. E. A. Jones, and H. F. Wang, “Velocity-porosity-clay content: Systematics of
poorly consolidated sandstones,” J. Geophys. 89, 10355–10364 (1984).
12 D. Marion, A. Nur, H. Yin, and D. Han, “Compressional velocity and porosity in sand-clay
mixtures,” J. Geophys. 57, 554–563 (1992).
13 T. Staubli, P. Gruber, and B. Luescher, “How much silt is acceptable for the acoustic
discharge measurement,” Hydro Conference, Sept. 27, 2006.
14 M. S. Greenwood, J. L. Mai, and M. S. Good, “Attenuation measurements of ultrasound in a
kaolin-water slurry: A linear dependence upon frequency,” J. Acoust. Soc. Am. 94(2), 908–916
(1993).
15 D. H. Green and R. Esquivel-Sirvent, “Acoustic behavior at the fluid/solid transition of
kaolinite suspensions,” J. Geophys. 64(1), 89 (1999).
18
16 J. Y. Sheng and A. E. Hay, “An examination of the spherical scatterer approximation in
aqueous suspensions of sand,” J. Acoust. Soc. Am. 83, 598–610 (1988).
17 L. E. Kinsler, A. R. Frey, A. B. Coppens, and J. V. Saunders, Fundamentals of Acoustics, 3rd
ed. (Wiley, New York, 1982), p. 161.
18 A. E. Hay, “Sound scattering from a particle-laden, turbulent jet,” J. Acoust. Soc. Am. 90(4),
2055–2074 (1991).
19 M. Schulkin and H. W. Marsh, “Sound absorption in sea water,” J. Acoust. Soc. Am. 34, 864
– 865 (1962).
19
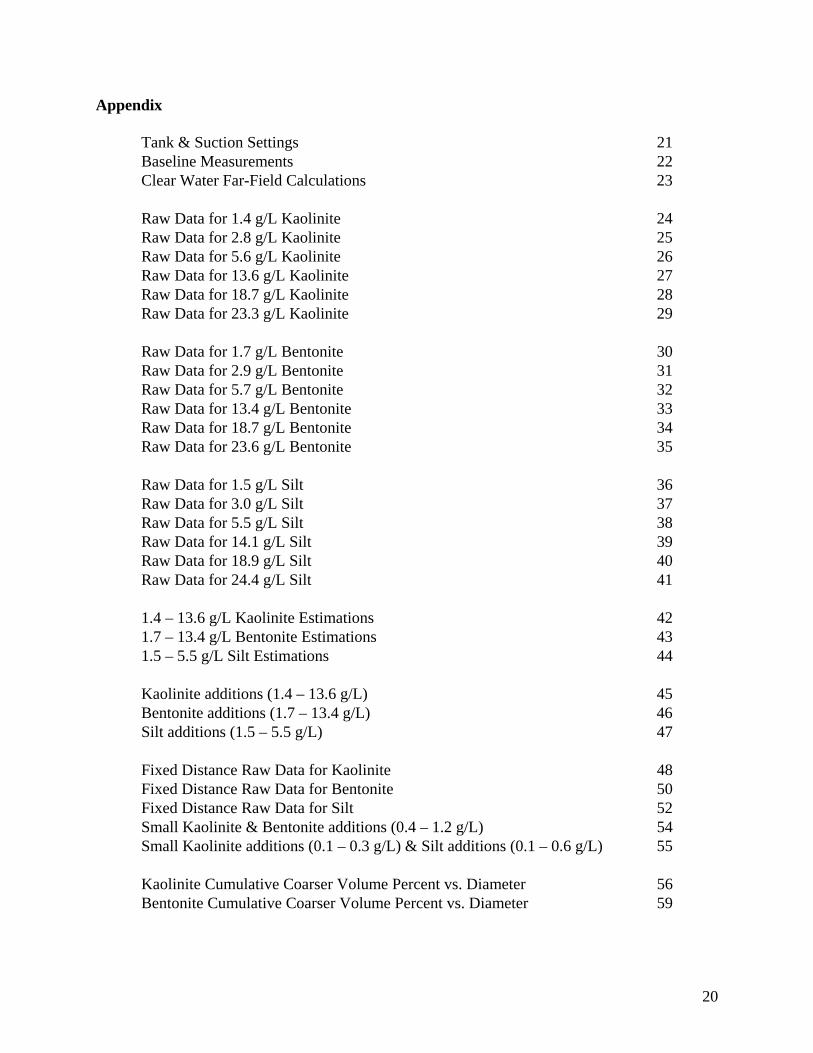
Appendix
Tank & Suction Settings 21Baseline Measurements 22Clear Water Far-Field Calculations 23
Raw Data for 1.4 g/L Kaolinite 24Raw Data for 2.8 g/L Kaolinite 25Raw Data for 5.6 g/L Kaolinite 26Raw Data for 13.6 g/L Kaolinite 27Raw Data for 18.7 g/L Kaolinite 28Raw Data for 23.3 g/L Kaolinite 29
Raw Data for 1.7 g/L Bentonite 30Raw Data for 2.9 g/L Bentonite 31Raw Data for 5.7 g/L Bentonite 32Raw Data for 13.4 g/L Bentonite 33Raw Data for 18.7 g/L Bentonite 34Raw Data for 23.6 g/L Bentonite 35
Raw Data for 1.5 g/L Silt 36Raw Data for 3.0 g/L Silt 37Raw Data for 5.5 g/L Silt 38Raw Data for 14.1 g/L Silt 39Raw Data for 18.9 g/L Silt 40Raw Data for 24.4 g/L Silt 41
1.4 – 13.6 g/L Kaolinite Estimations 421.7 – 13.4 g/L Bentonite Estimations 431.5 – 5.5 g/L Silt Estimations 44
Kaolinite additions (1.4 – 13.6 g/L) 45Bentonite additions (1.7 – 13.4 g/L) 46Silt additions (1.5 – 5.5 g/L) 47
Fixed Distance Raw Data for Kaolinite 48Fixed Distance Raw Data for Bentonite 50Fixed Distance Raw Data for Silt 52Small Kaolinite & Bentonite additions (0.4 – 1.2 g/L) 54Small Kaolinite additions (0.1 – 0.3 g/L) & Silt additions (0.1 – 0.6 g/L) 55
Kaolinite Cumulative Coarser Volume Percent vs. Diameter 56Bentonite Cumulative Coarser Volume Percent vs. Diameter 59
20
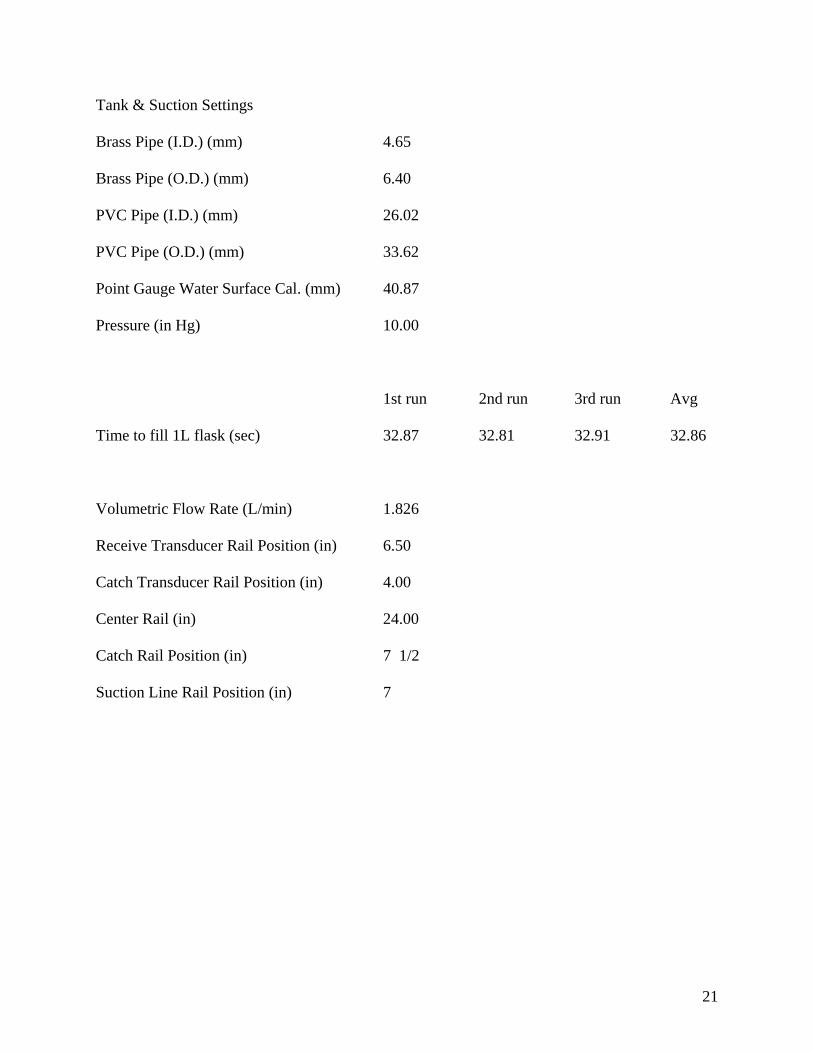
Tank & Suction Settings
Brass Pipe (I.D.) (mm) 4.65
Brass Pipe (O.D.) (mm) 6.40
PVC Pipe (I.D.) (mm) 26.02
PVC Pipe (O.D.) (mm) 33.62
Point Gauge Water Surface Cal. (mm) 40.87
Pressure (in Hg) 10.00
1st run 2nd run 3rd run Avg
Time to fill 1L flask (sec) 32.87 32.81 32.91 32.86
Volumetric Flow Rate (L/min) 1.826
Receive Transducer Rail Position (in) 6.50
Catch Transducer Rail Position (in) 4.00
Center Rail (in) 24.00
Catch Rail Position (in) 7 1/2
Suction Line Rail Position (in) 7
21

Baseline Measurements
Distance (mm) Reading x1 (in) Reading x2 (in) Run 1 Run 2 Avg (Vpp)
27.76 20 1/8 20 1/4 3.183 3.327 3.255
53.16 21 1/8 21 1/4 3.093 3.204 3.149
78.56 22 1/8 22 1/4 3.027 3.08 3.054
103.96 23 1/8 23 1/4 2.782 2.85 2.816
129.36 24 1/8 24 1/4 2.637 2.782 2.710
154.76 25 1/8 25 1/4 2.708 2.349 2.529
180.16 26 1/8 26 1/4 2.493 2.473 2.483
205.56 27 1/8 27 1/4 2.157 2.088 2.123
230.96 28 1/8 28 1/4 1.703 1.638 1.671
256.36 29 1/8 29 1/4 1.297 1.261 1.279
281.76 30 1/8 30 1/4 1.005 1.015 1.010
307.16 31 1/8 31 1/4 0.753 0.744 0.749
332.56 32 1/8 32 1/4 0.574 0.576 0.575
357.96 33 1/8 33 1/4 0.429 0.426 0.428
22
23
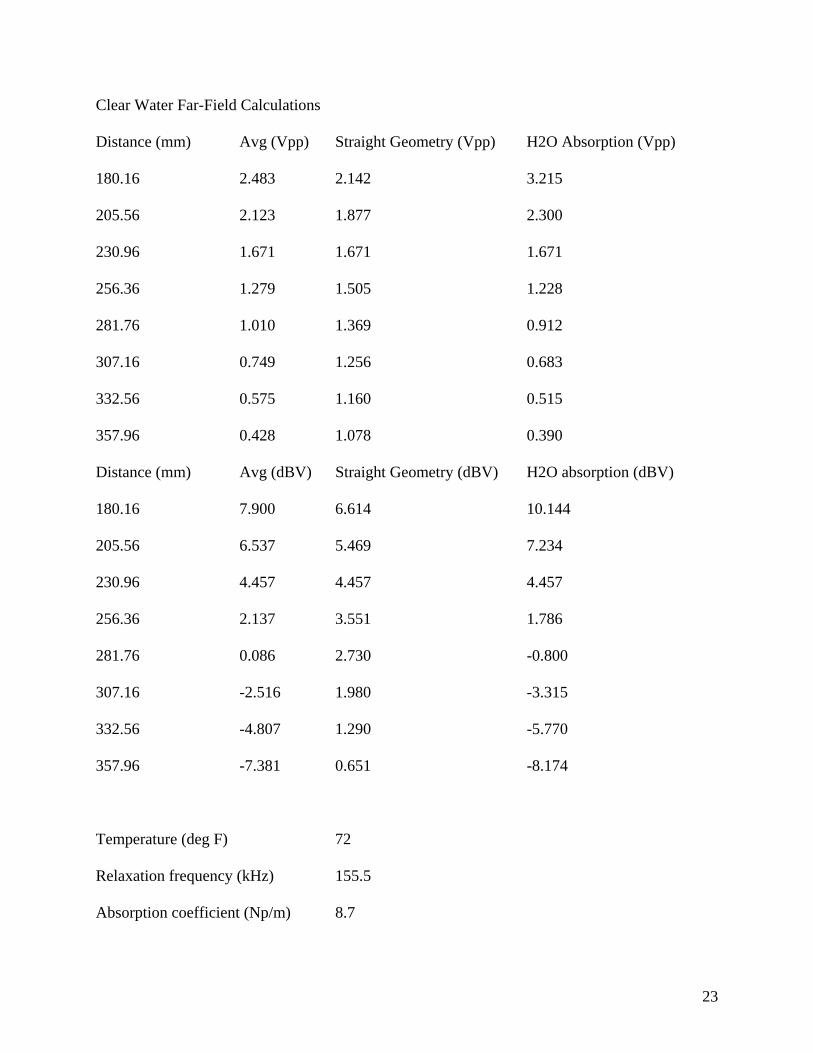
Clear Water Far-Field Calculations
Distance (mm) Avg (Vpp) Straight Geometry (Vpp) H2O Absorption (Vpp)
180.16 2.483 2.142 3.215
205.56 2.123 1.877 2.300
230.96 1.671 1.671 1.671
256.36 1.279 1.505 1.228
281.76 1.010 1.369 0.912
307.16 0.749 1.256 0.683
332.56 0.575 1.160 0.515
357.96 0.428 1.078 0.390
Distance (mm) Avg (dBV) Straight Geometry (dBV) H2O absorption (dBV)
180.16 7.900 6.614 10.144
205.56 6.537 5.469 7.234
230.96 4.457 4.457 4.457
256.36 2.137 3.551 1.786
281.76 0.086 2.730 -0.800
307.16 -2.516 1.980 -3.315
332.56 -4.807 1.290 -5.770
357.96 -7.381 0.651 -8.174
Temperature (deg F) 72
Relaxation frequency (kHz) 155.5
Absorption coefficient (Np/m) 8.7
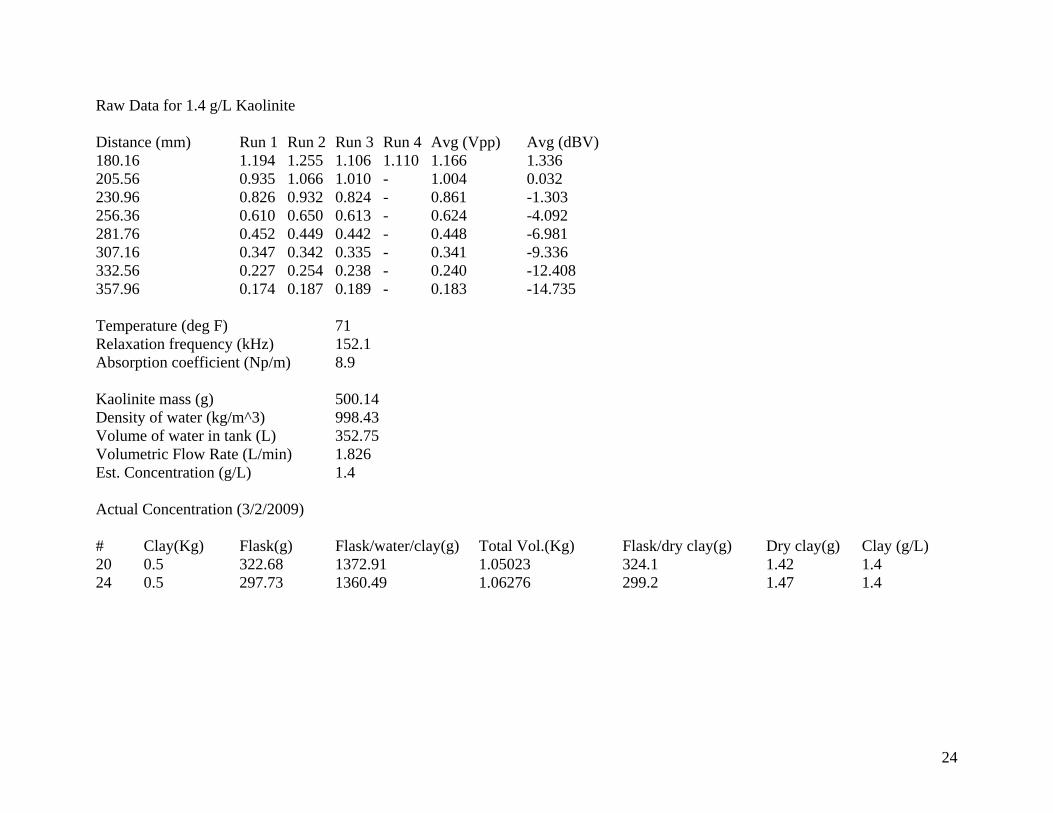
Raw Data for 1.4 g/L Kaolinite Distance (mm) Run 1 Run 2 Run 3 Run 4 Avg (Vpp) Avg (dBV) 180.16 1.194 1.255 1.106 1.110 1.166 1.336 205.56 0.935 1.066 1.010 - 1.004 0.032 230.96 0.826 0.932 0.824 - 0.861 -1.303 256.36 0.610 0.650 0.613 - 0.624 -4.092 281.76 0.452 0.449 0.442 - 0.448 -6.981 307.16 0.347 0.342 0.335 - 0.341 -9.336 332.56 0.227 0.254 0.238 - 0.240 -12.408 357.96 0.174 0.187 0.189 - 0.183 -14.735 Temperature (deg F) 71 Relaxation frequency (kHz) 152.1 Absorption coefficient (Np/m) 8.9 Kaolinite mass (g) 500.14 Density of water (kg/m^3) 998.43 Volume of water in tank (L) 352.75 Volumetric Flow Rate (L/min) 1.826 Est. Concentration (g/L) 1.4 Actual Concentration (3/2/2009) # Clay(Kg) Flask(g) Flask/water/clay(g) Total Vol.(Kg) Flask/dry clay(g) Dry clay(g) Clay (g/L) 20 0.5 322.68 1372.91 1.05023 324.1 1.42 1.4 24 0.5 297.73 1360.49 1.06276 299.2 1.47 1.4
24
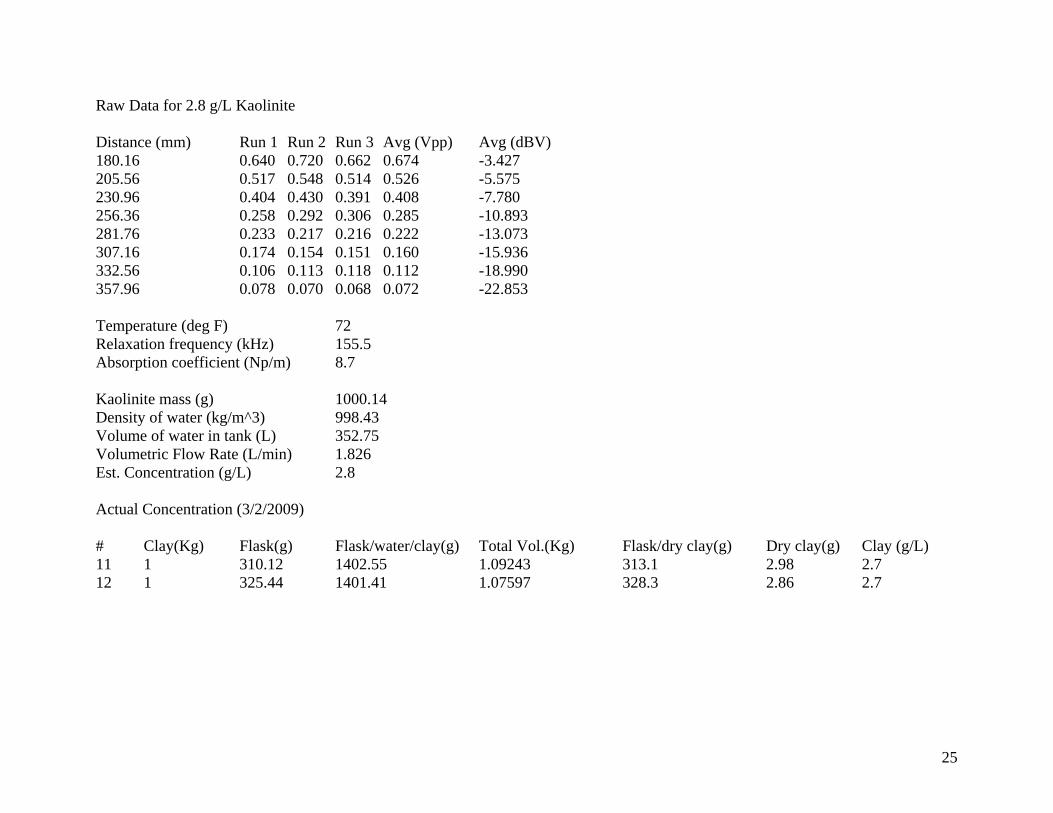
Raw Data for 2.8 g/L Kaolinite Distance (mm) Run 1 Run 2 Run 3 Avg (Vpp) Avg (dBV) 180.16 0.640 0.720 0.662 0.674 -3.427 205.56 0.517 0.548 0.514 0.526 -5.575 230.96 0.404 0.430 0.391 0.408 -7.780 256.36 0.258 0.292 0.306 0.285 -10.893 281.76 0.233 0.217 0.216 0.222 -13.073 307.16 0.174 0.154 0.151 0.160 -15.936 332.56 0.106 0.113 0.118 0.112 -18.990 357.96 0.078 0.070 0.068 0.072 -22.853 Temperature (deg F) 72 Relaxation frequency (kHz) 155.5 Absorption coefficient (Np/m) 8.7 Kaolinite mass (g) 1000.14 Density of water (kg/m^3) 998.43 Volume of water in tank (L) 352.75 Volumetric Flow Rate (L/min) 1.826 Est. Concentration (g/L) 2.8 Actual Concentration (3/2/2009) # Clay(Kg) Flask(g) Flask/water/clay(g) Total Vol.(Kg) Flask/dry clay(g) Dry clay(g) Clay (g/L) 11 1 310.12 1402.55 1.09243 313.1 2.98 2.7 12 1 325.44 1401.41 1.07597 328.3 2.86 2.7
25

Raw Data for 5.6 g/L Kaolinite Distance (mm) Run 1 Run 2 Run 3 Avg (Vpp) Avg (dBV) 180.16 0.280 0.296 0.242 0.273 -11.287 205.56 0.192 0.169 0.159 0.173 -15.222 230.96 0.124 0.122 0.107 0.118 -18.587 256.36 0.082 0.073 0.079 0.078 -22.158 281.76 0.050 0.044 0.042 0.045 -26.872 307.16 0.038 0.033 0.032 0.034 -29.286 Temperature (deg F) 70 Relaxation frequency (kHz) 148.7 Absorption coefficient (Np/m) 9.1 Kaolinite mass (g) 2000.33 Density of water (kg/m^3) 998.43 Volume of water in tank (L) 352.75 Volumetric Flow Rate (L/min) 1.826 Est. Concentration (g/L) 5.7 Actual Concentration (3/2/3009) # Clay(Kg) Flask(g) Flask/water/clay(g) Total Vol.(Kg) Flask/dry clay(g) Dry clay(g) Clay (g/L) 2 2 329.57 1343.55 1.01398 335.0 5.43 5.4 10 2 316.85 1433.87 1.11702 322.7 5.85 5.2
26

Raw Data for 13.6 g/L Kaolinite Distance (mm) Run 1 Run 2 Run 3 Avg (Vpp) Avg (dBV) 27.76 2.194 2.124 2.104 2.141 6.612 53.16 0.912 0.923 0.987 0.941 -0.528 78.56 0.389 0.423 0.395 0.402 -7.915 103.96 0.224 0.204 0.214 0.214 -13.392 129.36 0.113 0.104 0.101 0.106 -19.494 154.76 0.057 0.060 0.059 0.059 -24.583 180.16 0.041 0.038 0.038 0.039 -28.179 Temperature (deg F) 73 Relaxation frequency (kHz) 159.0 Absorption coefficient (Np/m) 8.5 Kaolinite mass (g) 5000.07 Density of water (kg/m^3) 998.43 Volume of water in tank (L) 352.75 Volumetric Flow Rate (L/min) 1.826 Est. Concentration (g/L) 14.2 Actual Concentration (3/2/3009) # Clay(Kg) Flask(g) Flask/water/clay(g) Total Vol.(Kg) Flask/dry clay(g) Dry clay(g) Clay (g/L) 3 5 324.97 1403.11 1.07814 339.6 14.63 13.6 7 5 297.45 1340.22 1.04277 311.5 14.05 13.5
27

Raw Data for 18.7 g/L Kaolinite Distance (mm) Run 1 Run 2 Run 3 Avg (Vpp) Avg (dBV) 27.76 2.063 2.209 2.218 2.163 6.702 53.16 0.843 0.923 0.914 0.893 -0.980 78.56 0.318 0.399 0.405 0.374 -8.543 103.96 0.115 0.154 0.148 0.139 -17.140 129.36 0.045 0.045 0.050 0.047 -26.620 Temperature (deg F) 73 Relaxation frequency (kHz) 159.0 Absorption coefficient (Np/m) 8.5 Kaolinite mass (g) 7000.08 Density of water (kg/m^3) 998.43 Volume of water in tank (L) 352.75 Volumetric Flow Rate (L/min) 1.826 Est. Concentration (g/L) 19.8 Actual Concentration (3/2/3009) # Clay(Kg) Flask(g) Flask/water/clay(g) Total Vol.(Kg) Flask/dry clay(g) Dry clay(g) Clay (g/L) 15 7 347.39 1352.29 1.0049 366.1 18.71 18.6 19 7 311.36 1369.7 1.05834 331.2 19.84 18.7
28
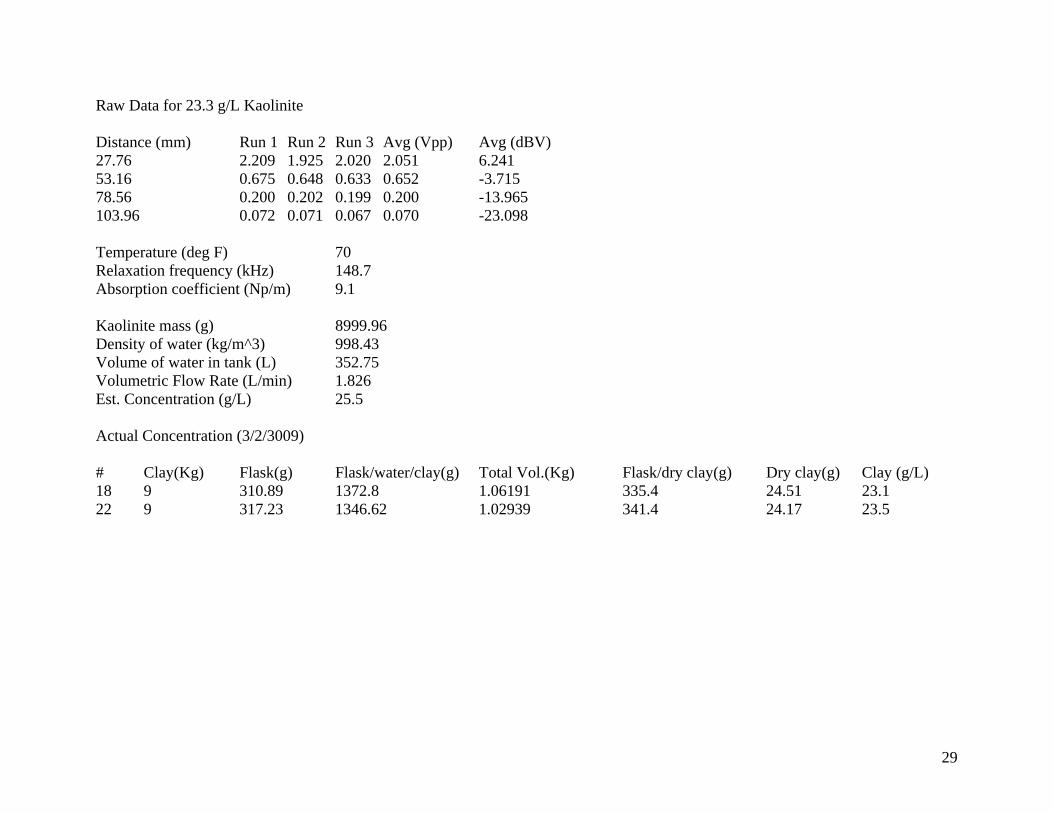
Raw Data for 23.3 g/L Kaolinite Distance (mm) Run 1 Run 2 Run 3 Avg (Vpp) Avg (dBV) 27.76 2.209 1.925 2.020 2.051 6.241 53.16 0.675 0.648 0.633 0.652 -3.715 78.56 0.200 0.202 0.199 0.200 -13.965 103.96 0.072 0.071 0.067 0.070 -23.098 Temperature (deg F) 70 Relaxation frequency (kHz) 148.7 Absorption coefficient (Np/m) 9.1 Kaolinite mass (g) 8999.96 Density of water (kg/m^3) 998.43 Volume of water in tank (L) 352.75 Volumetric Flow Rate (L/min) 1.826 Est. Concentration (g/L) 25.5 Actual Concentration (3/2/3009) # Clay(Kg) Flask(g) Flask/water/clay(g) Total Vol.(Kg) Flask/dry clay(g) Dry clay(g) Clay (g/L) 18 9 310.89 1372.8 1.06191 335.4 24.51 23.1 22 9 317.23 1346.62 1.02939 341.4 24.17 23.5
29
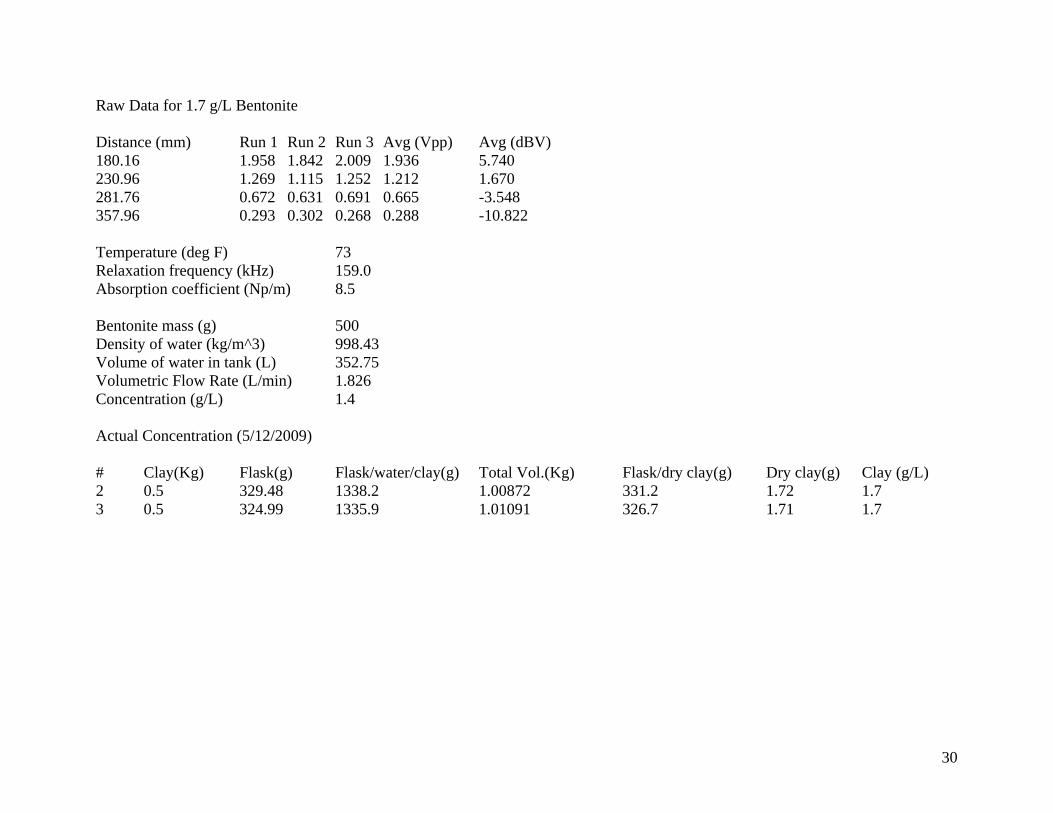
Raw Data for 1.7 g/L Bentonite Distance (mm) Run 1 Run 2 Run 3 Avg (Vpp) Avg (dBV) 180.16 1.958 1.842 2.009 1.936 5.740 230.96 1.269 1.115 1.252 1.212 1.670 281.76 0.672 0.631 0.691 0.665 -3.548 357.96 0.293 0.302 0.268 0.288 -10.822 Temperature (deg F) 73 Relaxation frequency (kHz) 159.0 Absorption coefficient (Np/m) 8.5 Bentonite mass (g) 500 Density of water (kg/m^3) 998.43 Volume of water in tank (L) 352.75 Volumetric Flow Rate (L/min) 1.826 Concentration (g/L) 1.4 Actual Concentration (5/12/2009) # Clay(Kg) Flask(g) Flask/water/clay(g) Total Vol.(Kg) Flask/dry clay(g) Dry clay(g) Clay (g/L) 2 0.5 329.48 1338.2 1.00872 331.2 1.72 1.7 3 0.5 324.99 1335.9 1.01091 326.7 1.71 1.7
30

Raw Data for 2.9 g/L Bentonite Distance (mm) Run 1 Run 2 Run 3 Avg (Vpp) Avg (dBV) 180.16 1.401 1.555 1.480 1.479 3.397 230.96 0.894 0.913 0.883 0.897 -0.947 281.76 0.437 0.464 0.436 0.446 -7.020 357.96 0.171 0.147 0.139 0.152 -16.344 Temperature (deg F) 72 Relaxation frequency (kHz) 155.5 Absorption coefficient (Np/m) 8.7 Bentonite mass (g) 1000 Density of water (kg/m^3) 998.43 Volume of water in tank (L) 352.75 Volumetric Flow Rate (L/min) 1.826 Est. Concentration (g/L) 2.8 Actual Concentration (5/12/2009) # Clay(Kg) Flask(g) Flask/water/clay(g) Total Vol.(Kg) Flask/dry clay(g) Dry clay(g) Clay (g/L) 12 1 325.44 1336.75 1.01131 328.4 2.96 2.9 24 1 297.73 1346.01 1.04828 300.8 3.07 2.9
31

Raw Data for 5.7 g/L Bentonite Distance (mm) Run 1 Run 2 Run 3 Avg (Vpp) Avg (dBV) 180.16 1.032 1.034 1.007 1.024 0.209 230.96 0.532 0.525 0.530 0.529 -5.531 307.16 0.158 0.150 0.150 0.153 -16.325 357.96 0.069 0.066 0.064 0.066 -23.565 Temperature (deg F) 75 Relaxation frequency (kHz) 166.2 Absorption coefficient (Np/m) 8.1 Bentonite mass (g) 2000 Density of water (kg/m^3) 998.43 Volume of water in tank (L) 352.75 Volumetric Flow Rate (L/min) 1.826 Est. Concentration (g/L) 5.7 Actual Concentration (5/12/2009) # Clay(Kg) Flask(g) Flask/water/clay(g) Total Vol.(Kg) Flask/dry clay(g) Dry clay(g) Clay (g/L) 7 2 297.47 1328.59 1.03112 303.3 5.83 5.7 10 2 316.80 1360.26 1.04346 322.7 5.9 5.7
32
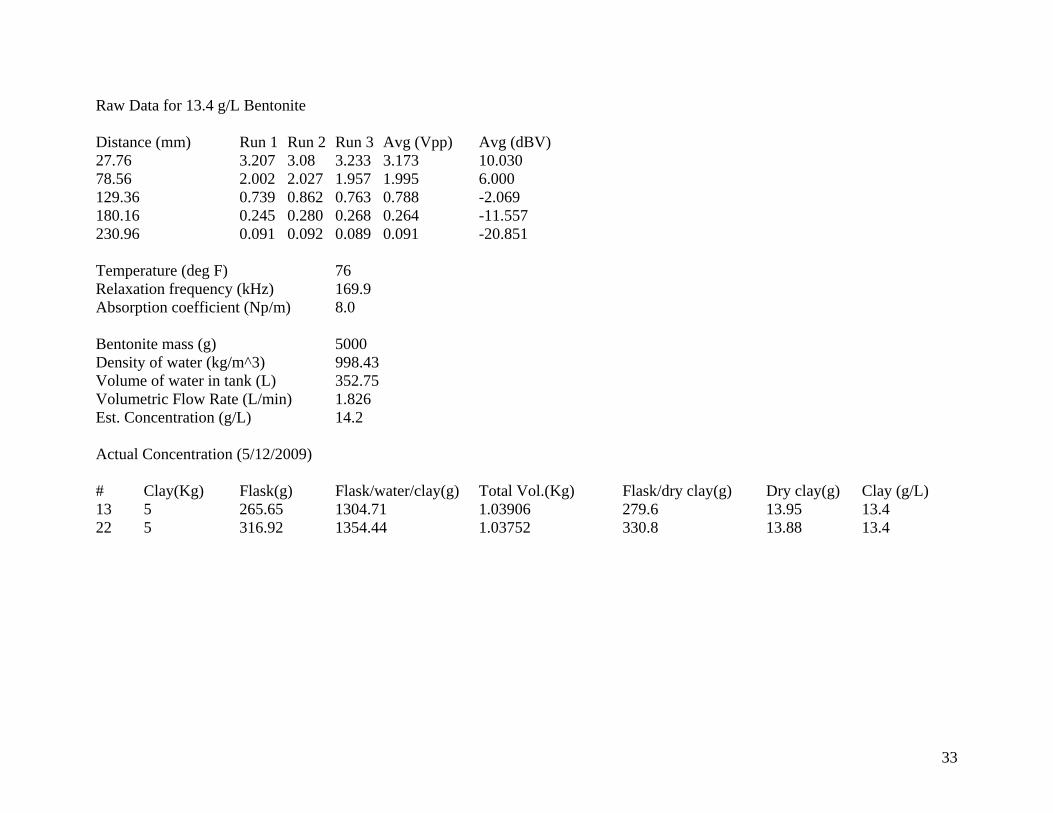
Raw Data for 13.4 g/L Bentonite Distance (mm) Run 1 Run 2 Run 3 Avg (Vpp) Avg (dBV) 27.76 3.207 3.08 3.233 3.173 10.030 78.56 2.002 2.027 1.957 1.995 6.000 129.36 0.739 0.862 0.763 0.788 -2.069 180.16 0.245 0.280 0.268 0.264 -11.557 230.96 0.091 0.092 0.089 0.091 -20.851 Temperature (deg F) 76 Relaxation frequency (kHz) 169.9 Absorption coefficient (Np/m) 8.0 Bentonite mass (g) 5000 Density of water (kg/m^3) 998.43 Volume of water in tank (L) 352.75 Volumetric Flow Rate (L/min) 1.826 Est. Concentration (g/L) 14.2 Actual Concentration (5/12/2009) # Clay(Kg) Flask(g) Flask/water/clay(g) Total Vol.(Kg) Flask/dry clay(g) Dry clay(g) Clay (g/L) 13 5 265.65 1304.71 1.03906 279.6 13.95 13.4 22 5 316.92 1354.44 1.03752 330.8 13.88 13.4
33

Raw Data for 18.7 g/L Bentonite Distance (mm) Run 1 Run 2 Run 3 Avg (Vpp) Avg (dBV) 27.76 3.146 3.009 3.139 3.098 9.822 78.56 1.257 1.342 1.257 1.285 2.180 129.36 0.416 0.373 0.388 0.392 -8.127 Temperature (deg F) 76 Relaxation frequency (kHz) 169.9 Absorption coefficient (Np/m) 8.0 Bentonite mass (g) 7000 Density of water (kg/m^3) 998.43 Volume of water in tank (L) 352.75 Volumetric Flow Rate (L/min) 1.826 Est. Concentration (g/L) 19.8 Actual Concentration (5/12/2009) # Clay(Kg) Flask(g) Flask/water/clay(g) Total Vol.(Kg) Flask/dry clay(g) Dry clay(g) Clay (g/L) 18 7 310.18 1388.18 1.078 330.3 20.12 18.7 19 7 311.33 1366.35 1.05502 331.1 19.77 18.7
34
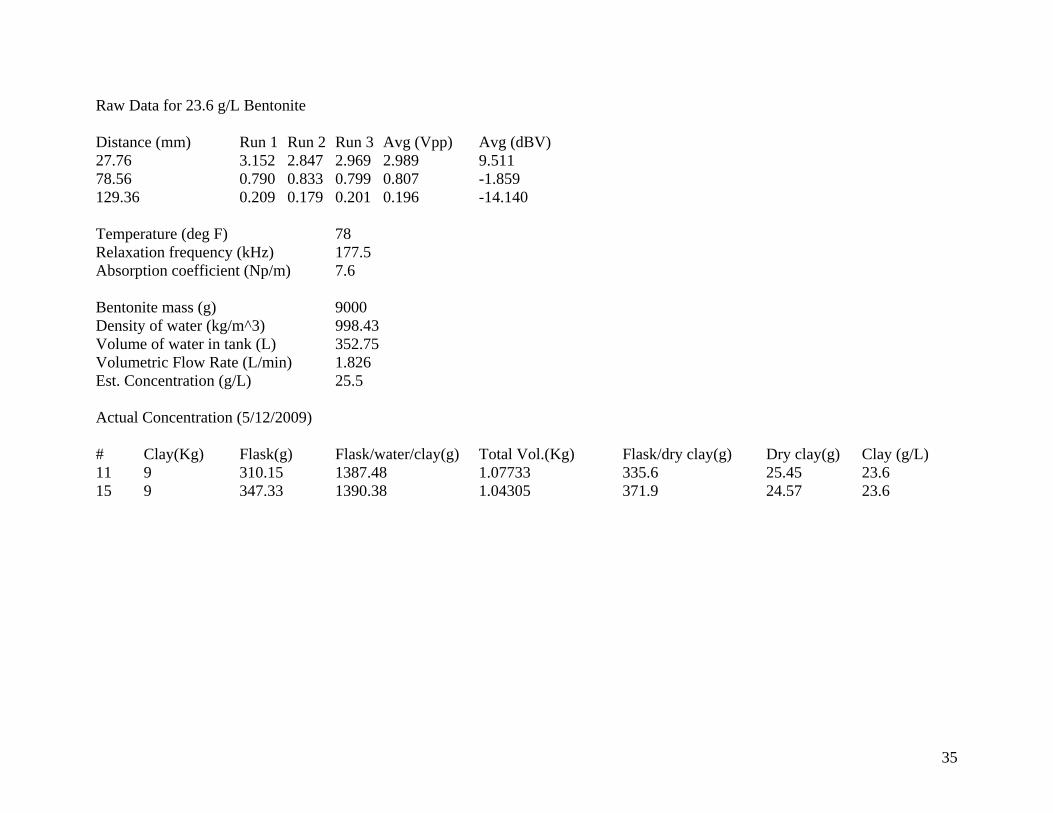
Raw Data for 23.6 g/L Bentonite Distance (mm) Run 1 Run 2 Run 3 Avg (Vpp) Avg (dBV) 27.76 3.152 2.847 2.969 2.989 9.511 78.56 0.790 0.833 0.799 0.807 -1.859 129.36 0.209 0.179 0.201 0.196 -14.140 Temperature (deg F) 78 Relaxation frequency (kHz) 177.5 Absorption coefficient (Np/m) 7.6 Bentonite mass (g) 9000 Density of water (kg/m^3) 998.43 Volume of water in tank (L) 352.75 Volumetric Flow Rate (L/min) 1.826 Est. Concentration (g/L) 25.5 Actual Concentration (5/12/2009) # Clay(Kg) Flask(g) Flask/water/clay(g) Total Vol.(Kg) Flask/dry clay(g) Dry clay(g) Clay (g/L) 11 9 310.15 1387.48 1.07733 335.6 25.45 23.6 15 9 347.33 1390.38 1.04305 371.9 24.57 23.6
35
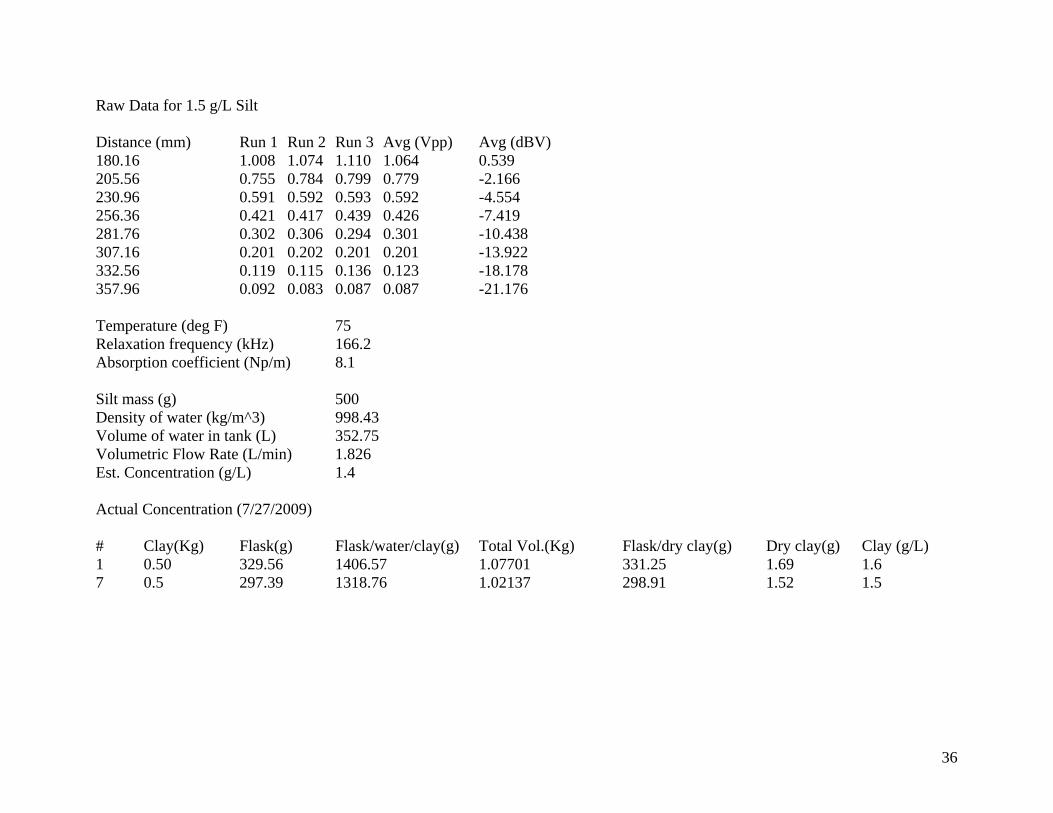
Raw Data for 1.5 g/L Silt Distance (mm) Run 1 Run 2 Run 3 Avg (Vpp) Avg (dBV) 180.16 1.008 1.074 1.110 1.064 0.539 205.56 0.755 0.784 0.799 0.779 -2.166 230.96 0.591 0.592 0.593 0.592 -4.554 256.36 0.421 0.417 0.439 0.426 -7.419 281.76 0.302 0.306 0.294 0.301 -10.438 307.16 0.201 0.202 0.201 0.201 -13.922 332.56 0.119 0.115 0.136 0.123 -18.178 357.96 0.092 0.083 0.087 0.087 -21.176 Temperature (deg F) 75 Relaxation frequency (kHz) 166.2 Absorption coefficient (Np/m) 8.1 Silt mass (g) 500 Density of water (kg/m^3) 998.43 Volume of water in tank (L) 352.75 Volumetric Flow Rate (L/min) 1.826 Est. Concentration (g/L) 1.4 Actual Concentration (7/27/2009) # Clay(Kg) Flask(g) Flask/water/clay(g) Total Vol.(Kg) Flask/dry clay(g) Dry clay(g) Clay (g/L) 1 0.50 329.56 1406.57 1.07701 331.25 1.69 1.6 7 0.5 297.39 1318.76 1.02137 298.91 1.52 1.5
36

Raw Data for 3.0 g/L Silt Distance (mm) Run 1 Run 2 Run 3 Avg (Vpp) Avg (dBV) 180.16 0.580 0.586 0.614 0.593 -4.534 205.56 0.385 0.395 0.411 0.397 -8.024 230.96 0.247 0.270 0.264 0.260 -11.689 256.36 0.164 0.172 0.169 0.168 -15.477 281.76 0.099 0.100 0.107 0.102 -19.828 307.16 0.070 0.069 0.064 0.068 -23.393 332.56 0.041 0.046 0.042 0.043 -27.331 Temperature (deg F) 75 Relaxation frequency (kHz) 166.2 Absorption coefficient (Np/m) 8.1 Silt mass (g) 1000 Density of water (kg/m^3) 998.43 Volume of water in tank (L) 352.75 Volumetric Flow Rate (L/min) 1.826 Est. Concentration (g/L) 2.8 Actual Concentration (7/27/2009) # Clay(Kg) Flask(g) Flask/water/clay(g) Total Vol.(Kg) Flask/dry clay(g) Dry clay(g) Clay (g/L) 3 1 324.86 1453.08 1.12822 328.25 3.39 3.0 4 1 340.54 1339.89 0.99935 343.46 2.92 2.9
37

Raw Data for 5.5 g/L Silt Distance (mm) Run 1 Run 2 Run 3 Avg (Vpp) Avg (dBV) 27.76 3.262 3.378 3.262 3.301 10.372 53.16 2.496 2.468 2.630 2.531 8.067 78.56 1.301 1.406 1.481 1.396 2.898 103.96 0.760 0.788 0.817 0.788 -2.066 129.36 0.437 0.427 0.427 0.430 -7.324 154.76 0.286 0.280 0.302 0.289 -10.772 180.16 0.160 0.156 0.177 0.164 -15.685 205.56 0.086 0.094 0.087 0.089 -21.012 230.96 0.044 0.048 0.052 0.048 -26.375 Temperature (deg F) 75 Relaxation frequency (kHz) 166.2 Absorption coefficient (Np/m) 8.1 Silt mass (g) 2000.02 Density of water (kg/m^3) 998.43 Volume of water in tank (L) 352.75 Volumetric Flow Rate (L/min) 1.826 Est. Concentration (g/L) 5.7 Actual Concentration (7/27/2009) # Clay(Kg) Flask(g) Flask/water/clay(g) Total Vol.(Kg) Flask/dry clay(g) Dry clay(g) Clay (g/L) 10 2 316.78 1338.57 1.02179 322.43 5.65 5.5 11 2 310.1 1362.28 1.05218 315.92 5.82 5.5
38

Raw Data for 14.1 g/L Silt Distance (mm) Run 1 Run 2 Run 3 Avg (Vpp) Avg (dBV) 27.76 2.417 2.523 2.492 2.477 7.880 53.16 1.016 0.876 0.934 0.942 -0.519 78.56 0.337 0.309 0.308 0.318 -9.951 103.96 0.116 0.119 0.134 0.123 -18.202 129.36 0.045 0.044 0.049 0.046 -26.745 Temperature (deg F) 77 Relaxation frequency (kHz) 173.7 Absorption coefficient (Np/m) 7.8 Silt mass (g) 5000.02 Density of water (kg/m^3) 998.43 Volume of water in tank (L) 352.75 Volumetric Flow Rate (L/min) 1.826 Est. Concentration (g/L) 14.2 Actual Concentration (7/27/2009) # Clay(Kg) Flask(g) Flask/water/clay(g) Total Vol.(Kg) Flask/dry clay(g) Dry clay(g) Clay (g/L) 12 5 325.4 1399.44 1.07404 340.71 15.31 14.3 13 5 265.67 1405.26 1.13959 281.35 15.68 13.8
39
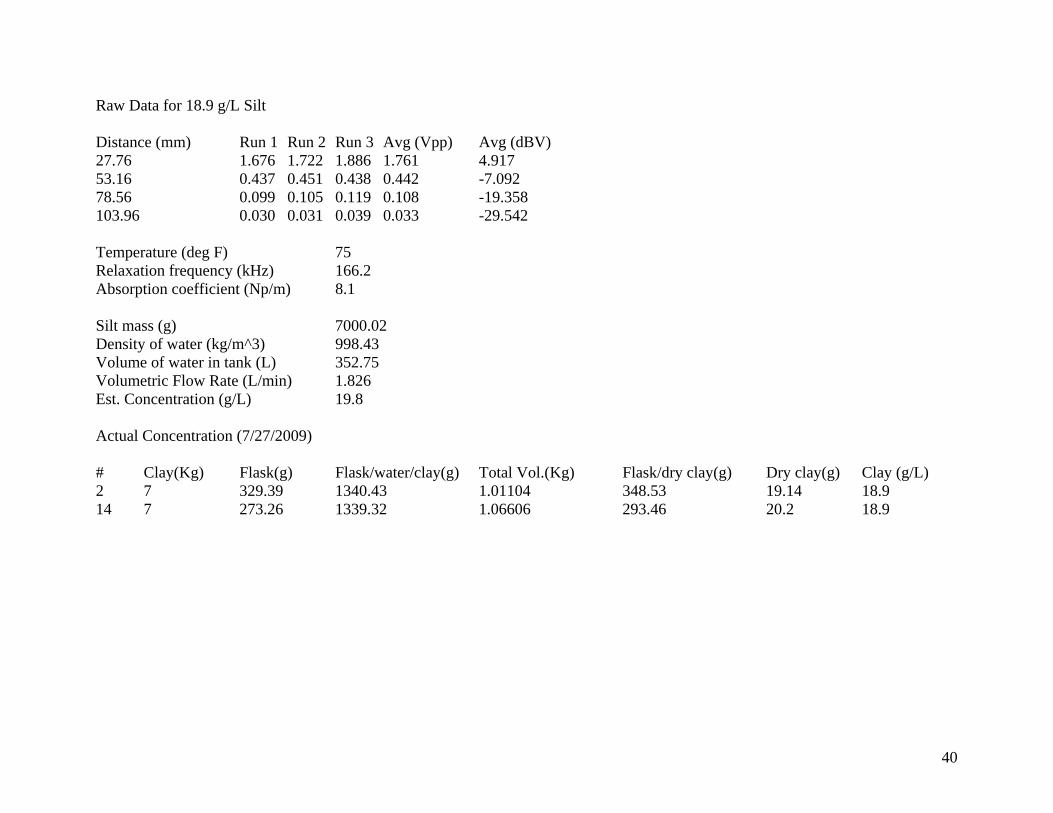
Raw Data for 18.9 g/L Silt Distance (mm) Run 1 Run 2 Run 3 Avg (Vpp) Avg (dBV) 27.76 1.676 1.722 1.886 1.761 4.917 53.16 0.437 0.451 0.438 0.442 -7.092 78.56 0.099 0.105 0.119 0.108 -19.358 103.96 0.030 0.031 0.039 0.033 -29.542 Temperature (deg F) 75 Relaxation frequency (kHz) 166.2 Absorption coefficient (Np/m) 8.1 Silt mass (g) 7000.02 Density of water (kg/m^3) 998.43 Volume of water in tank (L) 352.75 Volumetric Flow Rate (L/min) 1.826 Est. Concentration (g/L) 19.8 Actual Concentration (7/27/2009) # Clay(Kg) Flask(g) Flask/water/clay(g) Total Vol.(Kg) Flask/dry clay(g) Dry clay(g) Clay (g/L) 2 7 329.39 1340.43 1.01104 348.53 19.14 18.9 14 7 273.26 1339.32 1.06606 293.46 20.2 18.9
40

Raw Data for 24.4 g/L Silt Distance (mm) Run 1 Run 2 Run 3 Avg (Vpp) Avg (dBV) 27.76 1.258 1.262 1.244 1.255 1.971 53.16 0.217 0.242 0.235 0.231 -12.715 78.56 0.046 0.045 0.048 0.046 -26.682 Temperature (deg F) 76 Relaxation frequency (kHz) 169.9 Absorption coefficient (Np/m) 8.0 Bentonite mass (g) 9000.02 Density of water (kg/m^3) 998.43 Volume of water in tank (L) 352.75 Volumetric Flow Rate (L/min) 1.826 Est. Concentration (g/L) 25.5 Actual Concentration (7/27/2009) # Clay(Kg) Flask(g) Flask/water/clay(g) Total Vol.(Kg) Flask/dry clay(g) Dry clay(g) Clay (g/L) 22 9 316.85 1396.02 1.07917 343.35 26.5 24.6 24 9 297.67 1344.04 1.04637 322.92 25.25 24.1
41

1.4 – 13.6 g/L Kaolinite Absorption Coefficient Estimations Measured voltage data Distance (m) Clear Water (Vpp) 500g (Vpp) 1kg (Vpp) 2kg (Vpp) 5kg (Vpp) 0.180 2.483 1.166 0.674 0.273 0.039 0.206 2.123 1.004 0.526 0.173 - 0.231 1.671 0.861 0.408 0.118 - 0.256 1.279 0.624 0.285 0.078 - 0.282 1.01 0.448 0.222 0.045 - 0.307 0.749 0.341 0.16 0.034 - 0.333 0.575 0.24 0.112 - - 0.358 0.428 0.183 0.072 - - Estimated Absorption Coefficients Distance (m) Clear Water (Np/m) 500g (Np/m) 1kg (Np/m) 2kg (Np/m) 5kg (Np/m) 0.180 10.319 14.770 17.557 23.093 31.945 0.206 9.166 13.034 15.949 21.802 - 0.231 8.694 11.761 14.790 20.577 - 0.256 8.464 11.441 14.316 19.735 - 0.282 8.203 11.255 13.580 19.547 - 0.307 8.220 10.926 13.249 18.554 - 0.333 8.146 10.916 13.056 - - 0.358 8.190 10.685 13.166 - - Avg.(Np/m) 8.3 11.2 13.7 19.6 - *Average is compiled for 230 – 358 mm. Voltage estimations based on the calculated absorption coefficients: Distance (m) 500g (Vpp) 1kg (Vpp) 2kg (Vpp) 5kg (Vpp) 0.180 2.233 1.352 0.511 - 0.206 1.474 0.837 0.272 - 0.231 0.988 0.526 0.147 - 0.256 0.67 0.335 0.081 - 0.282 0.459 0.215 0.045 - 0.307 0.317 0.139 0.025 - 0.333 0.221 0.091 - - 0.358 0.154 0.06 - - Distance (m) 500g (dBV) 1kg (dBV) 2kg (dBV) 5kg (dBV) 0.180 6.978 2.62 -5.826 - 0.206 3.37 -1.546 -11.297 - 0.231 -0.105 -5.579 -16.633 - 0.256 -3.475 -9.507 -21.865 - 0.282 -6.758 -13.348 -27.01 - 0.307 -9.971 -17.119 -32.085 - 0.333 -13.124 -20.83 - -
42
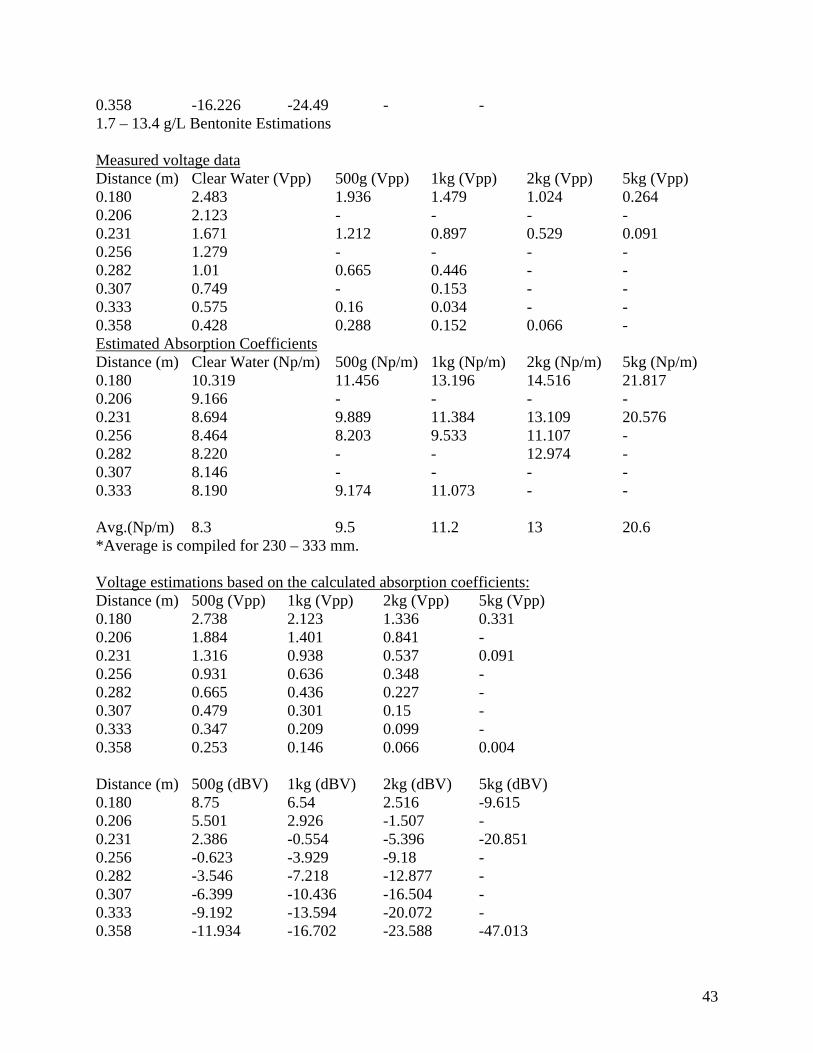
0.358 -16.226 -24.49 - - 1.7 – 13.4 g/L Bentonite Estimations Measured voltage data Distance (m) Clear Water (Vpp) 500g (Vpp) 1kg (Vpp) 2kg (Vpp) 5kg (Vpp) 0.180 2.483 1.936 1.479 1.024 0.264 0.206 2.123 - - - - 0.231 1.671 1.212 0.897 0.529 0.091 0.256 1.279 - - - - 0.282 1.01 0.665 0.446 - - 0.307 0.749 - 0.153 - - 0.333 0.575 0.16 0.034 - - 0.358 0.428 0.288 0.152 0.066 - Estimated Absorption Coefficients Distance (m) Clear Water (Np/m) 500g (Np/m) 1kg (Np/m) 2kg (Np/m) 5kg (Np/m) 0.180 10.319 11.456 13.196 14.516 21.817 0.206 9.166 - - - - 0.231 8.694 9.889 11.384 13.109 20.576 0.256 8.464 8.203 9.533 11.107 - 0.282 8.220 - - 12.974 - 0.307 8.146 - - - - 0.333 8.190 9.174 11.073 - - Avg.(Np/m) 8.3 9.5 11.2 13 20.6 *Average is compiled for 230 – 333 mm. Voltage estimations based on the calculated absorption coefficients: Distance (m) 500g (Vpp) 1kg (Vpp) 2kg (Vpp) 5kg (Vpp) 0.180 2.738 2.123 1.336 0.331 0.206 1.884 1.401 0.841 - 0.231 1.316 0.938 0.537 0.091 0.256 0.931 0.636 0.348 - 0.282 0.665 0.436 0.227 - 0.307 0.479 0.301 0.15 - 0.333 0.347 0.209 0.099 - 0.358 0.253 0.146 0.066 0.004 Distance (m) 500g (dBV) 1kg (dBV) 2kg (dBV) 5kg (dBV) 0.180 8.75 6.54 2.516 -9.615 0.206 5.501 2.926 -1.507 - 0.231 2.386 -0.554 -5.396 -20.851 0.256 -0.623 -3.929 -9.18 - 0.282 -3.546 -7.218 -12.877 - 0.307 -6.399 -10.436 -16.504 - 0.333 -9.192 -13.594 -20.072 - 0.358 -11.934 -16.702 -23.588 -47.013
43
44
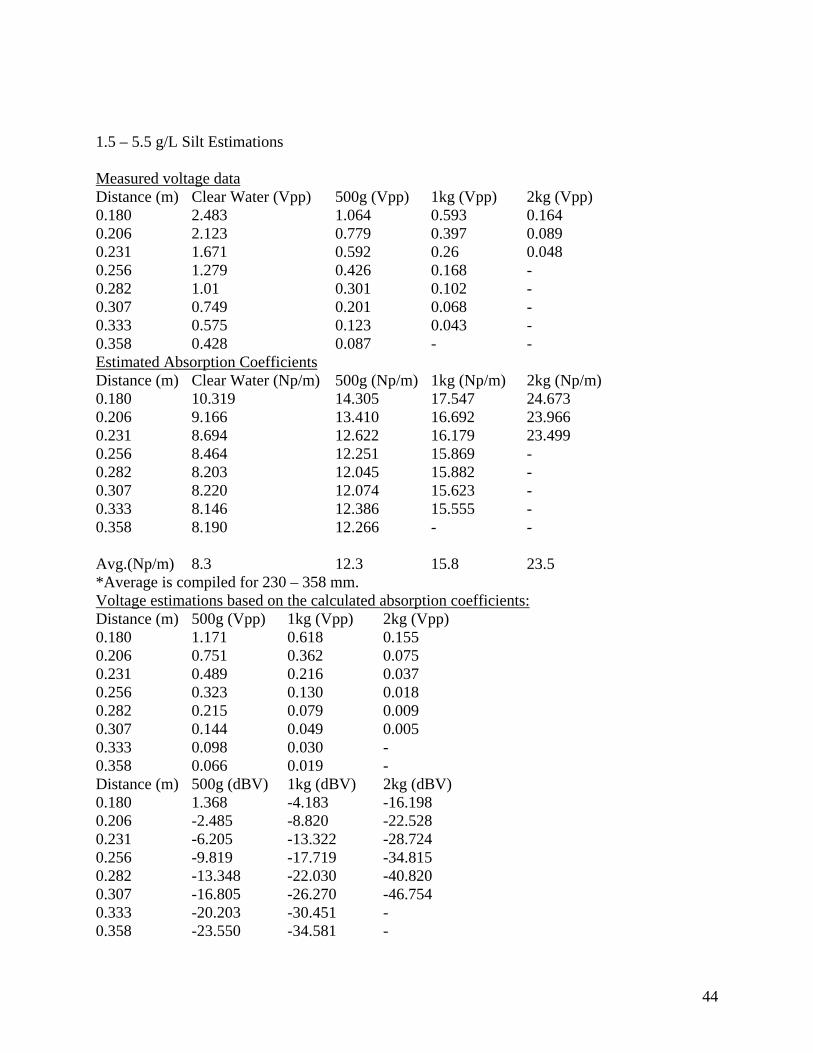
1.5 – 5.5 g/L Silt Estimations Measured voltage data Distance (m) Clear Water (Vpp) 500g (Vpp) 1kg (Vpp) 2kg (Vpp) 0.180 2.483 1.064 0.593 0.164 0.206 2.123 0.779 0.397 0.089 0.231 1.671 0.592 0.26 0.048 0.256 1.279 0.426 0.168 - 0.282 1.01 0.301 0.102 - 0.307 0.749 0.201 0.068 - 0.333 0.575 0.123 0.043 - 0.358 0.428 0.087 - - Estimated Absorption Coefficients Distance (m) Clear Water (Np/m) 500g (Np/m) 1kg (Np/m) 2kg (Np/m) 0.180 10.319 14.305 17.547 24.673 0.206 9.166 13.410 16.692 23.966 0.231 8.694 12.622 16.179 23.499 0.256 8.464 12.251 15.869 - 0.282 8.203 12.045 15.882 - 0.307 8.220 12.074 15.623 - 0.333 8.146 12.386 15.555 - 0.358 8.190 12.266 - - Avg.(Np/m) 8.3 12.3 15.8 23.5 *Average is compiled for 230 – 358 mm. Voltage estimations based on the calculated absorption coefficients: Distance (m) 500g (Vpp) 1kg (Vpp) 2kg (Vpp) 0.180 1.171 0.618 0.155 0.206 0.751 0.362 0.075 0.231 0.489 0.216 0.037 0.256 0.323 0.130 0.018 0.282 0.215 0.079 0.009 0.307 0.144 0.049 0.005 0.333 0.098 0.030 - 0.358 0.066 0.019 - Distance (m) 500g (dBV) 1kg (dBV) 2kg (dBV) 0.180 1.368 -4.183 -16.198 0.206 -2.485 -8.820 -22.528 0.231 -6.205 -13.322 -28.724 0.256 -9.819 -17.719 -34.815 0.282 -13.348 -22.030 -40.820 0.307 -16.805 -26.270 -46.754 0.333 -20.203 -30.451 - 0.358 -23.550 -34.581 -
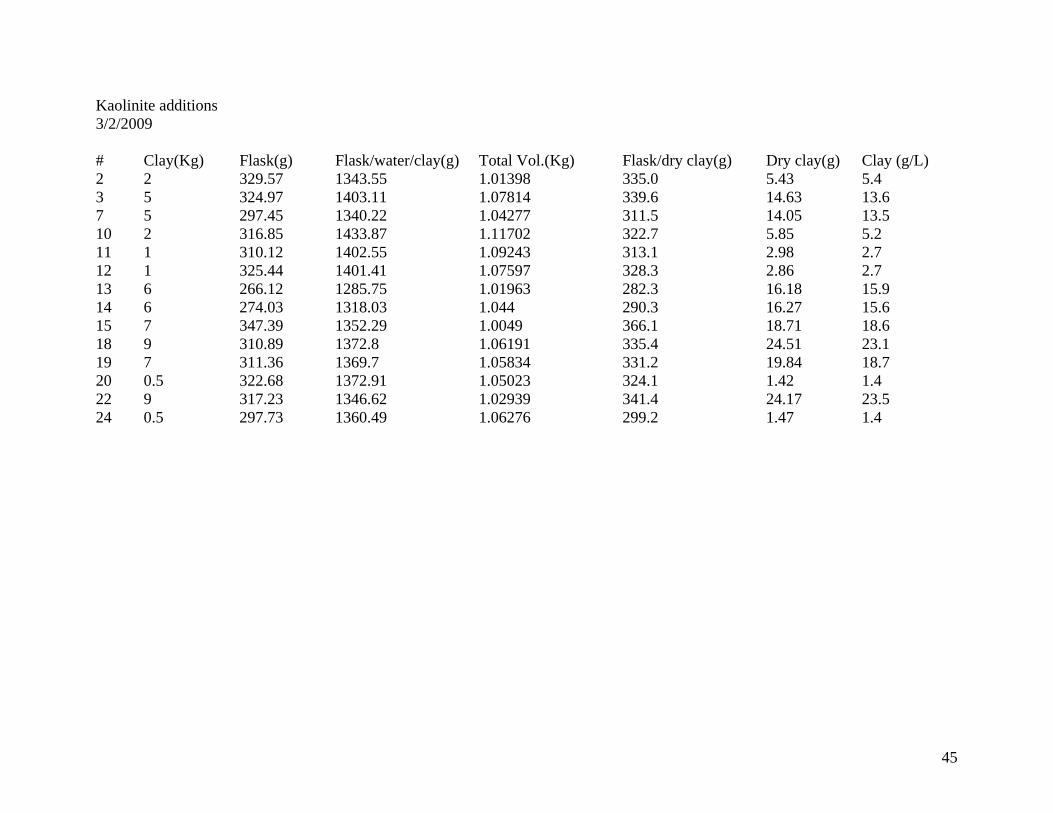
Kaolinite additions 3/2/2009 # Clay(Kg) Flask(g) Flask/water/clay(g) Total Vol.(Kg) Flask/dry clay(g) Dry clay(g) Clay (g/L) 2 2 329.57 1343.55 1.01398 335.0 5.43 5.4 3 5 324.97 1403.11 1.07814 339.6 14.63 13.6 7 5 297.45 1340.22 1.04277 311.5 14.05 13.5 10 2 316.85 1433.87 1.11702 322.7 5.85 5.2 11 1 310.12 1402.55 1.09243 313.1 2.98 2.7 12 1 325.44 1401.41 1.07597 328.3 2.86 2.7 13 6 266.12 1285.75 1.01963 282.3 16.18 15.9 14 6 274.03 1318.03 1.044 290.3 16.27 15.6 15 7 347.39 1352.29 1.0049 366.1 18.71 18.6 18 9 310.89 1372.8 1.06191 335.4 24.51 23.1 19 7 311.36 1369.7 1.05834 331.2 19.84 18.7 20 0.5 322.68 1372.91 1.05023 324.1 1.42 1.4 22 9 317.23 1346.62 1.02939 341.4 24.17 23.5 24 0.5 297.73 1360.49 1.06276 299.2 1.47 1.4
45
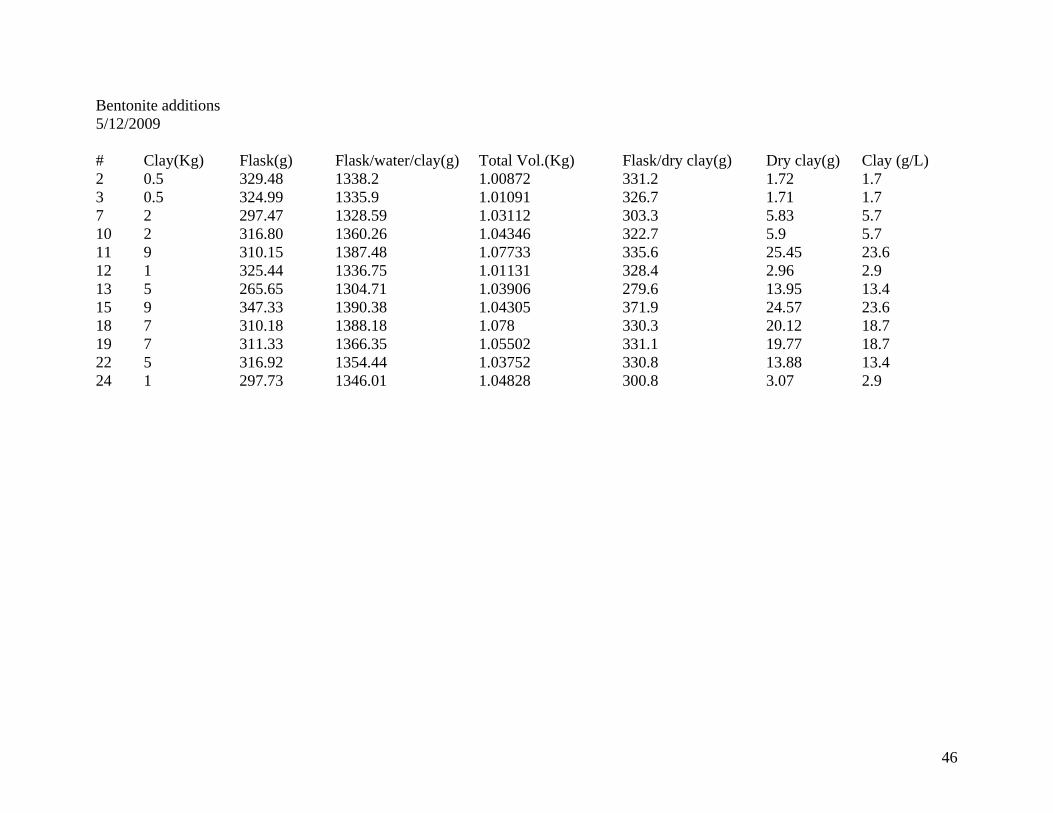
Bentonite additions 5/12/2009 # Clay(Kg) Flask(g) Flask/water/clay(g) Total Vol.(Kg) Flask/dry clay(g) Dry clay(g) Clay (g/L) 2 0.5 329.48 1338.2 1.00872 331.2 1.72 1.7 3 0.5 324.99 1335.9 1.01091 326.7 1.71 1.7 7 2 297.47 1328.59 1.03112 303.3 5.83 5.7 10 2 316.80 1360.26 1.04346 322.7 5.9 5.7 11 9 310.15 1387.48 1.07733 335.6 25.45 23.6 12 1 325.44 1336.75 1.01131 328.4 2.96 2.9 13 5 265.65 1304.71 1.03906 279.6 13.95 13.4 15 9 347.33 1390.38 1.04305 371.9 24.57 23.6 18 7 310.18 1388.18 1.078 330.3 20.12 18.7 19 7 311.33 1366.35 1.05502 331.1 19.77 18.7 22 5 316.92 1354.44 1.03752 330.8 13.88 13.4 24 1 297.73 1346.01 1.04828 300.8 3.07 2.9
46

Silt additions 7/27/2009 # Clay(Kg) Flask(g) Flask/water/clay(g) Total Vol.(Kg) Flask/dry clay(g) Dry clay(g) Clay (g/L) 1 0.50 329.56 1406.57 1.07701 331.25 1.69 1.6 2 7 329.39 1340.43 1.01104 348.53 19.14 18.9 3 1 324.86 1453.08 1.12822 328.25 3.39 3.0 4 1 340.54 1339.89 0.99935 343.46 2.92 2.9 7 0.5 297.39 1318.76 1.02137 298.91 1.52 1.5 10 2 316.78 1338.57 1.02179 322.43 5.65 5.5 11 2 310.1 1362.28 1.05218 315.92 5.82 5.5 12 5 325.4 1399.44 1.07404 340.71 15.31 14.3 13 5 265.67 1405.26 1.13959 281.35 15.68 13.8 14 7 273.26 1339.32 1.06606 293.46 20.2 18.9 22 9 316.85 1396.02 1.07917 343.35 26.5 24.6 24 9 297.67 1344.04 1.04637 322.92 25.25 24.1
47
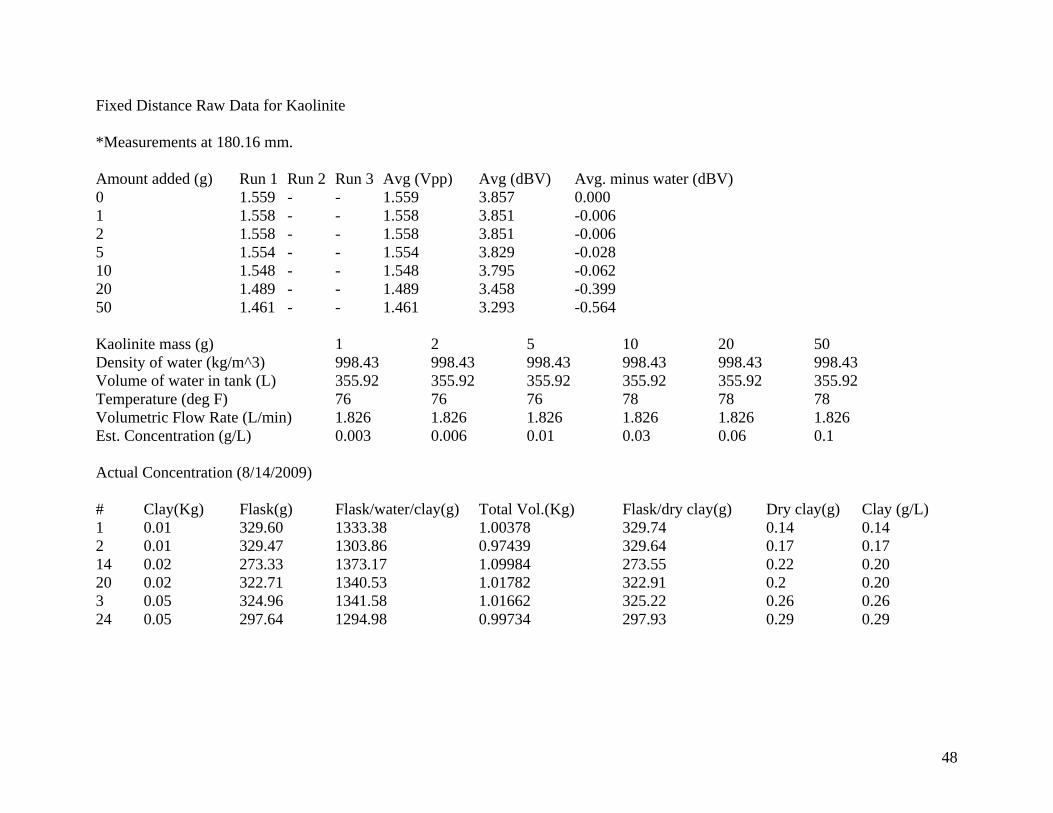
Fixed Distance Raw Data for Kaolinite *Measurements at 180.16 mm. Amount added (g) Run 1 Run 2 Run 3 Avg (Vpp) Avg (dBV) Avg. minus water (dBV) 0 1.559 - - 1.559 3.857 0.000 1 1.558 - - 1.558 3.851 -0.006 2 1.558 - - 1.558 3.851 -0.006 5 1.554 - - 1.554 3.829 -0.028 10 1.548 - - 1.548 3.795 -0.062 20 1.489 - - 1.489 3.458 -0.399 50 1.461 - - 1.461 3.293 -0.564 Kaolinite mass (g) 1 2 5 10 20 50 Density of water (kg/m^3) 998.43 998.43 998.43 998.43 998.43 998.43 Volume of water in tank (L) 355.92 355.92 355.92 355.92 355.92 355.92 Temperature (deg F) 76 76 76 78 78 78 Volumetric Flow Rate (L/min) 1.826 1.826 1.826 1.826 1.826 1.826 Est. Concentration (g/L) 0.003 0.006 0.01 0.03 0.06 0.1 Actual Concentration (8/14/2009) # Clay(Kg) Flask(g) Flask/water/clay(g) Total Vol.(Kg) Flask/dry clay(g) Dry clay(g) Clay (g/L) 1 0.01 329.60 1333.38 1.00378 329.74 0.14 0.14 2 0.01 329.47 1303.86 0.97439 329.64 0.17 0.17 14 0.02 273.33 1373.17 1.09984 273.55 0.22 0.20 20 0.02 322.71 1340.53 1.01782 322.91 0.2 0.20 3 0.05 324.96 1341.58 1.01662 325.22 0.26 0.26 24 0.05 297.64 1294.98 0.99734 297.93 0.29 0.29
48

Fixed Distance Raw Data for Kaolinite (cont.) *Measurements at 180.16 mm. Amount added (g) Run 1 Run 2 Run 3 Avg (Vpp) Avg (dBV) Avg. minus water (dBV) 0 1.559 - - 1.599 3.857 0.000 100 1.377 - - 1.377 2.779 -1.078 200 1.292 1.278 1.250 1.273 2.099 -1.758 Kaolinite mass (g) 100.14 200.14 Density of water (kg/m^3) 998.43 998.43 Volume of water in tank (L) 355.92 355.92 Temperature (deg F) 78 78 Volumetric Flow Rate (L/min) 1.826 1.826 Est. Concentration (g/L) 0.3 0.6 Actual Concentration (8/12/2009) # Clay(Kg) Flask(g) Flask/water/clay(g) Total Vol.(Kg) Flask/dry clay(g) Dry clay(g) Clay (g/L) 1 0.1 329.61 1326.25 0.99664 330.01 0.4 0.40 2 0.1 329.48 1319.41 0.98993 329.87 0.39 0.40 19 0.2 311.25 1455.73 1.14448 312.03 0.78 0.68 20 0.2 322.67 1321.78 0.99911 323.38 0.71 0.71
49

Fixed Distance Raw Data for Bentonite *Measurements at 180.16 mm. Amount added (g) Run 1 Run 2 Run 3 Avg (Vpp) Avg (dBV) Avg. minus water (dBV) 0 1.476 - - 1.476 3.382 0.000 1 1.476 - - 1.476 3.382 0.000 2 1.476 - - 1.476 3.382 0.000 5 1.474 - - 1.474 3.370 -0.012 10 1.467 - - 1.467 3.329 -0.053 20 1.458 - - 1.458 3.275 -0.107 50 1.444 - - 1.444 3.191 -0.191 Kaolinite mass (g) 1 2 5 10 20 50 Density of water (kg/m^3) 998.43 998.43 998.43 998.43 998.43 998.43 Volume of water in tank (L) 355.92 355.92 355.92 355.92 355.92 355.92 Temperature (deg F) 80 80 80 80 80 80 Volumetric Flow Rate (L/min) 1.826 1.826 1.826 1.826 1.826 1.826 Est. Concentration (g/L) 0.003 0.006 0.01 0.03 0.06 0.1
50

Fixed Distance Raw Data for Bentonite (cont.) *Measurements at 180.16 mm. Amount added (g) Run 1 Run 2 Run 3 Avg (Vpp) Avg (dBV) Avg. minus water (dBV) 0 2.103 - - 2.103 6.457 0.000 100 2.047 2.061 2.046 2.051 6.239 -0.217 200 1.910 1.891 1.877 1.893 5.543 -0.914 Kaolinite mass (g) 100 200 Density of water (kg/m^3) 998.43 998.43 Volume of water in tank (L) 355.92 355.92 Temperature (deg F) 79 79 Volumetric Flow Rate (L/min) 1.826 1.826 Est. Concentration (g/L) 0.3 0.6 Actual Concentration (8/12/2009) # Clay(Kg) Flask(g) Flask/water/clay(g) Total Vol.(Kg) Flask/dry clay(g) Dry clay(g) Clay (g/L) 4 0.1 340.58 1423.61 1.08303 341.03 0.45 0.42 9 0.1 305.42 1310.25 1.00483 305.83 0.41 0.40 11 0.2 310.07 1417.82 1.10775 310.84 0.77 0.70 14 0.2 273.34 1405.40 1.13206 274.1 0.76 0.67
51

Fixed Distance Raw Data for Silt *Measurements at 180.16 mm. Amount added (g) Run 1 Run 2 Run 3 Avg (Vpp) Avg (dBV) Avg. minus water (dBV) 0 1.643 - - 1.643 4.313 0.000 1 1.643 - - 1.643 4.313 0.000 2 1.615 - - 1.615 4.163 -0.150 5 1.587 1.573 1.573 1.578 3.960 -0.352 10 1.461 1.405 1.409 1.425 3.076 -1.236 20 1.362 1.349 1.362 1.358 2.656 -1.657 50 1.297 1.272 1.285 1.285 2.176 -2.137 Kaolinite mass (g) 1 2 5 10 20 50 Density of water (kg/m^3) 998.43 998.43 998.43 998.43 998.43 998.43 Volume of water in tank (L) 355.92 355.92 355.92 355.92 355.92 355.92 Temperature (deg F) 76 76 78 78 80 80 Volumetric Flow Rate (L/min) 1.826 1.826 1.826 1.826 1.826 1.826 Est. Concentration (g/L) 0.003 0.006 0.01 0.03 0.06 0.1 Actual Concentration (8/14/2009) # Clay(Kg) Flask(g) Flask/water/clay(g) Total Vol.(Kg) Flask/dry clay(g) Dry clay(g) Clay (g/L) 4 0.005 340.60 1346.45 1.00585 340.72 0.12 0.12 9 0.005 305.41 1310.30 1.00489 305.55 0.14 0.13 7 0.01 297.42 1337.31 1.03989 297.57 0.15 0.14 14 0.01 310.11 1335.17 1.02506 310.24 0.13 0.14 12 0.02 325.38 1347.22 1.02184 325.58 0.2 0.20 13 0.02 265.60 1266.63 1.00103 265.8 0.2 0.20 15 0.05 347.27 1362.77 1.0155 347.53 0.26 0.26 22 0.05 316.87 1324.74 1.00787 317.11 0.24 0.24
52

Fixed Distance Raw Data for Silt (cont.) *Measurements at 180.16 mm. Amount added (g) Run 1 Run 2 Run 3 Avg (Vpp) Avg (dBV) Avg. minus water (dBV) 0 1.643 - - 1.643 4.313 0.000 100 1.174 1.185 1.196 1.185 1.474 -2.838 200 1.041 1.031 1.009 1.027 0.231 -4.081 Kaolinite mass (g) 100 200 Density of water (kg/m^3) 998.43 998.43 Volume of water in tank (L) 355.92 355.92 Temperature (deg F) 76 76 Volumetric Flow Rate (L/min) 1.826 1.826 Est. Concentration (g/L) 0.3 0.6 Actual Concentration (8/14/2009) # Clay(Kg) Flask(g) Flask/water/clay(g) Total Vol.(Kg) Flask/dry clay(g) Dry clay(g) Clay (g/L) 18 0.1 310.10 1286.38 0.97628 310.47 0.37 0.38 21 0.1 299.40 1467.84 1.16844 299.89 0.49 0.42 5 0.2 323.14 1361.41 1.03827 323.81 0.67 0.65 10 0.2 316.73 1506.30 1.18957 317.57 0.84 0.71
53

Kaolinite and Bentonite (100, 200, 300, and 400 g) additions 8/12/2009 Kaolinite: # Clay(Kg) Flask(g) Flask/water/clay(g) Total Vol.(Kg) Flask/dry clay(g) Dry clay(g) Clay (g/L) 1 0.1 329.61 1326.25 0.99664 330.01 0.4 0.40 2 0.1 329.48 1319.41 0.98993 329.87 0.39 0.40 19 0.2 311.25 1455.73 1.14448 312.03 0.78 0.68 20 0.2 322.67 1321.78 0.99911 323.38 0.71 0.71 3 0.3 324.94 1309.64 0.9847 325.88 0.94 0.95 13 0.3 265.61 1228.04 0.96243 266.51 0.9 0.94 12 0.4 325.36 1344.47 1.01911 326.61 1.25 1.23 15 0.4 347.24 1347.48 1.00024 348.47 1.23 1.23 Bentonite: # Clay(Kg) Flask(g) Flask/water/clay(g) Total Vol.(Kg) Flask/dry clay(g) Dry clay(g) Clay (g/L) 4 0.1 340.58 1423.61 1.08303 341.03 0.45 0.42 9 0.1 305.42 1310.25 1.00483 305.83 0.41 0.40 11 0.2 310.07 1417.82 1.10775 310.84 0.77 0.70 14 0.2 273.34 1405.40 1.13206 274.1 0.76 0.67 18 0.3 310.08 1480.57 1.17049 311.19 1.11 0.95 21 0.3 299.40 1358.90 1.0595 300.43 1.03 0.97 22 0.4 316.81 1437.98 1.12117 318.19 1.38 1.23 24 0.4 297.62 1326.05 1.02843 298.89 1.27 1.23
54
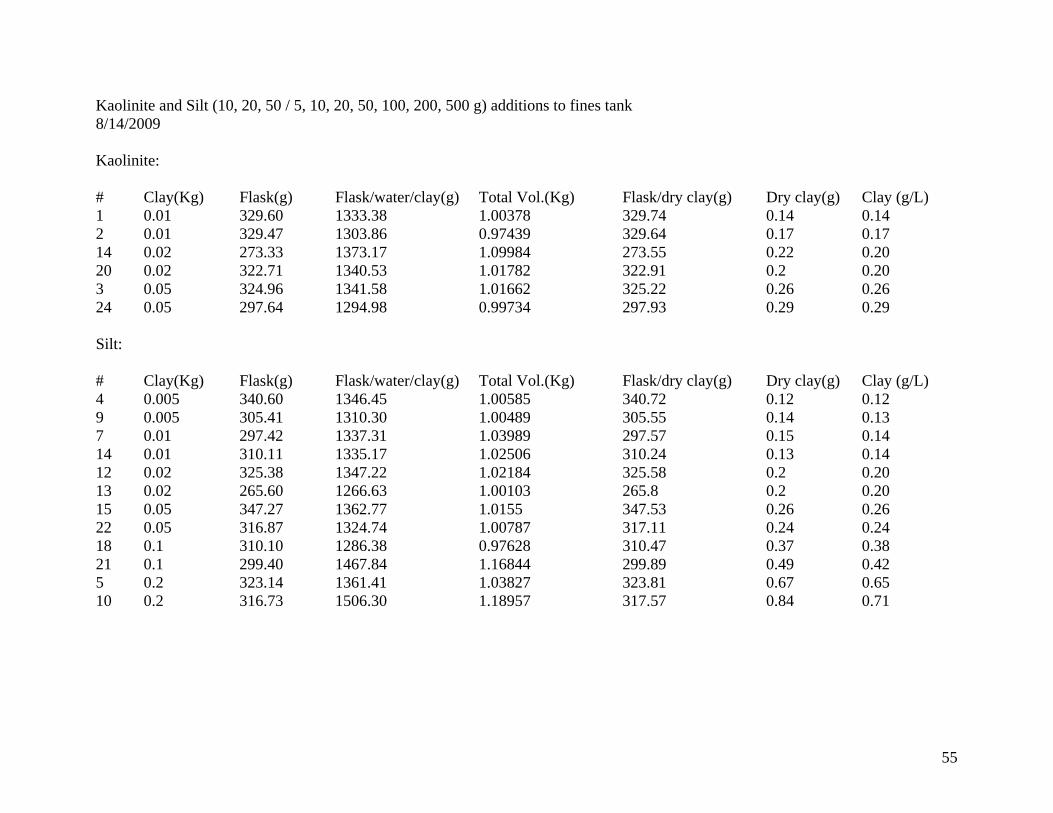
Kaolinite and Silt (10, 20, 50 / 5, 10, 20, 50, 100, 200, 500 g) additions to fines tank 8/14/2009 Kaolinite: # Clay(Kg) Flask(g) Flask/water/clay(g) Total Vol.(Kg) Flask/dry clay(g) Dry clay(g) Clay (g/L) 1 0.01 329.60 1333.38 1.00378 329.74 0.14 0.14 2 0.01 329.47 1303.86 0.97439 329.64 0.17 0.17 14 0.02 273.33 1373.17 1.09984 273.55 0.22 0.20 20 0.02 322.71 1340.53 1.01782 322.91 0.2 0.20 3 0.05 324.96 1341.58 1.01662 325.22 0.26 0.26 24 0.05 297.64 1294.98 0.99734 297.93 0.29 0.29 Silt: # Clay(Kg) Flask(g) Flask/water/clay(g) Total Vol.(Kg) Flask/dry clay(g) Dry clay(g) Clay (g/L) 4 0.005 340.60 1346.45 1.00585 340.72 0.12 0.12 9 0.005 305.41 1310.30 1.00489 305.55 0.14 0.13 7 0.01 297.42 1337.31 1.03989 297.57 0.15 0.14 14 0.01 310.11 1335.17 1.02506 310.24 0.13 0.14 12 0.02 325.38 1347.22 1.02184 325.58 0.2 0.20 13 0.02 265.60 1266.63 1.00103 265.8 0.2 0.20 15 0.05 347.27 1362.77 1.0155 347.53 0.26 0.26 22 0.05 316.87 1324.74 1.00787 317.11 0.24 0.24 18 0.1 310.10 1286.38 0.97628 310.47 0.37 0.38 21 0.1 299.40 1467.84 1.16844 299.89 0.49 0.42 5 0.2 323.14 1361.41 1.03827 323.81 0.67 0.65 10 0.2 316.73 1506.30 1.18957 317.57 0.84 0.71
55

Kaolinite Cumulative Coarser Volume Percent vs. Diameter Average of All Tests Test 1 Test 2 Test 3 Particle Cumulative Particle Cumulative Particle Cumulative Particle Cumulative Mean Part. Diameter Coarser Diameter Coarser Diameter Coarser Diameter Coarser Finer Diam. (µm) Volume % (µm) Volume % (µm) Volume % (µm) Volume % Vol.% (µm) 0.54 100.000 0.54 100.000 0.54 100.000 0.54 100.000 0.00 0.54 0.58 100.000 0.58 100.000 0.58 100.000 0.58 100.000 0.00 0.58 0.61 99.995 0.61 99.991 0.61 99.998 0.61 99.997 0.00 0.61 0.65 99.955 0.65 99.942 0.65 99.963 0.65 99.960 0.04 0.65 0.68 99.841 0.68 99.819 0.68 99.855 0.68 99.850 0.16 0.68 0.73 99.625 0.73 99.596 0.73 99.641 0.73 99.637 0.38 0.73 0.77 99.298 0.77 99.268 0.77 99.313 0.77 99.313 0.70 0.77 0.81 98.878 0.81 98.852 0.81 98.887 0.81 98.895 1.12 0.81 0.86 98.403 0.86 98.386 0.86 98.403 0.86 98.421 1.60 0.86 0.91 97.924 0.91 97.917 0.91 97.915 0.91 97.942 2.08 0.91 0.97 97.489 0.97 97.488 0.97 97.473 0.97 97.507 2.51 0.97 1.02 97.129 1.02 97.128 1.02 97.111 1.02 97.148 2.87 1.02 1.09 96.851 1.09 96.844 1.09 96.836 1.09 96.873 3.15 1.09 1.15 96.633 1.15 96.614 1.15 96.625 1.15 96.659 3.37 1.15 1.22 96.430 1.22 96.398 1.22 96.431 1.22 96.460 3.57 1.22 1.29 96.190 1.29 96.148 1.29 96.197 1.29 96.223 3.81 1.29 1.37 95.870 1.37 95.824 1.37 95.879 1.37 95.906 4.13 1.37 1.45 95.451 1.45 95.409 1.45 95.457 1.45 95.487 4.55 1.45 1.53 94.943 1.53 94.909 1.53 94.941 1.53 94.978 5.06 1.53 1.62 94.375 1.62 94.350 1.62 94.366 1.62 94.409 5.63 1.62 1.72 93.783 1.72 93.762 1.72 93.770 1.72 93.817 6.22 1.72 1.82 93.188 1.82 93.164 1.82 93.176 1.82 93.225 6.81 1.82 1.93 92.586 1.93 92.551 1.93 92.580 1.93 92.626 7.41 1.93 2.04 91.947 2.04 91.897 2.04 91.953 2.04 91.993 8.05 2.04 2.16 91.238 2.16 91.171 2.16 91.255 2.16 91.289 8.76 2.16
56

2.29 90.432 2.29 90.350 2.29 90.458 2.29 90.488 9.57 2.29 2.43 89.523 2.43 89.428 2.43 89.554 2.43 89.588 10.48 2.43 2.57 88.522 2.57 88.412 2.57 88.554 2.57 88.599 11.48 2.57 2.73 87.439 2.73 87.311 2.73 87.471 2.73 87.534 12.56 2.73 2.89 86.274 2.89 86.123 2.89 86.305 2.89 86.393 13.73 2.89 3.06 85.014 3.06 84.835 3.06 85.045 3.06 85.161 14.99 3.06 3.24 83.640 3.24 83.433 3.24 83.675 3.24 83.813 16.36 3.24 3.43 82.136 3.43 81.901 3.43 82.177 3.43 82.330 17.86 3.43 3.63 80.489 3.63 80.229 3.63 80.541 3.63 80.698 19.51 3.63 3.85 78.695 3.85 78.410 3.85 78.761 3.85 78.914 21.31 3.85 4.08 76.755 4.08 76.445 4.08 76.837 4.08 76.984 23.24 4.08 4.32 74.680 4.32 74.341 4.32 74.779 4.32 74.922 25.32 4.32 4.58 72.481 4.58 72.105 4.58 72.593 4.58 72.745 27.52 4.58 4.85 70.167 4.85 69.745 4.85 70.289 4.85 70.467 29.83 4.85 5.13 67.746 5.13 67.269 5.13 67.873 5.13 68.095 32.25 5.13 5.44 65.227 5.44 64.688 5.44 65.354 5.44 65.638 34.77 5.44 5.76 62.621 5.76 62.016 5.76 62.744 5.76 63.103 37.38 5.76 6.10 59.941 6.10 59.269 6.10 60.057 6.10 60.499 40.06 6.10 6.46 57.200 6.46 56.460 6.46 57.308 6.46 57.834 42.80 6.46 6.85 54.408 6.85 53.600 6.85 54.510 6.85 55.114 45.59 6.85 7.25 51.570 7.25 50.694 7.25 51.672 7.25 52.344 48.43 7.25 7.68 48.689 7.68 47.746 7.68 48.796 7.68 49.525 51.31 7.68 8.14 45.770 8.14 44.762 8.14 45.888 8.14 46.660 54.23 8.14 8.62 42.820 8.62 41.752 8.6 42.954 8.62 43.756 57.18 8.62 9.13 39.855 9.13 38.731 9.13 40.005 9.13 40.827 60.15 9.13 9.67 36.891 9.67 35.724 9.67 37.057 9.67 37.893 63.11 9.67 10.24 33.954 10.24 32.756 10.24 34.130 10.24 34.976 66.05 10.24 10.85 31.068 10.85 29.856 10.85 31.248 10.85 32.099 68.93 10.85 11.49 28.259 11.49 27.051 11.49 28.438 11.49 29.288 71.74 11.49 12.17 25.552 12.17 24.365 12.17 25.726 12.17 26.564 74.45 12.17 12.90 22.964 12.90 21.816 12.90 23.131 12.90 23.946 77.04 12.90 13.66 20.508 13.66 19.413 13.66 20.666 13.66 21.446 79.49 13.66 14.47 18.187 14.47 17.158 14.47 18.334 14.47 19.068 81.81 14.47
57
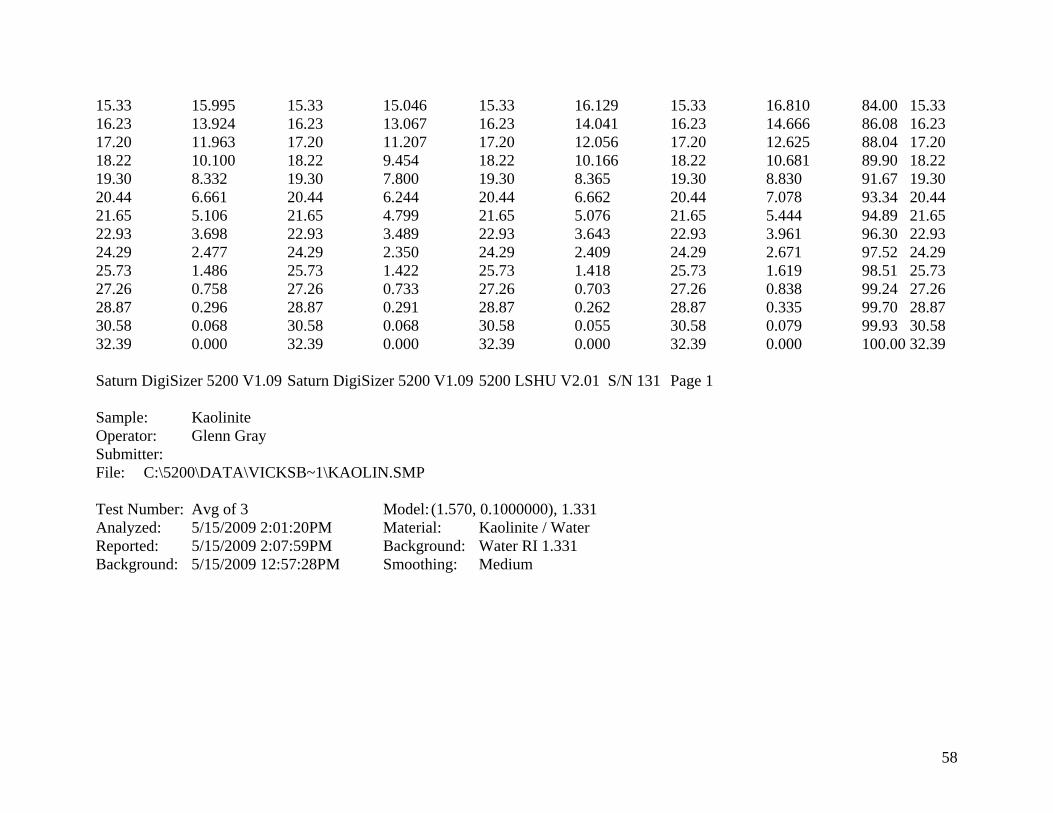
15.33 15.995 15.33 15.046 15.33 16.129 15.33 16.810 84.00 15.33 16.23 13.924 16.23 13.067 16.23 14.041 16.23 14.666 86.08 16.23 17.20 11.963 17.20 11.207 17.20 12.056 17.20 12.625 88.04 17.20 18.22 10.100 18.22 9.454 18.22 10.166 18.22 10.681 89.90 18.22 19.30 8.332 19.30 7.800 19.30 8.365 19.30 8.830 91.67 19.30 20.44 6.661 20.44 6.244 20.44 6.662 20.44 7.078 93.34 20.44 21.65 5.106 21.65 4.799 21.65 5.076 21.65 5.444 94.89 21.65 22.93 3.698 22.93 3.489 22.93 3.643 22.93 3.961 96.30 22.93 24.29 2.477 24.29 2.350 24.29 2.409 24.29 2.671 97.52 24.29 25.73 1.486 25.73 1.422 25.73 1.418 25.73 1.619 98.51 25.73 27.26 0.758 27.26 0.733 27.26 0.703 27.26 0.838 99.24 27.26 28.87 0.296 28.87 0.291 28.87 0.262 28.87 0.335 99.70 28.87 30.58 0.068 30.58 0.068 30.58 0.055 30.58 0.079 99.93 30.58 32.39 0.000 32.39 0.000 32.39 0.000 32.39 0.000 100.00 32.39 Saturn DigiSizer 5200 V1.09 Saturn DigiSizer 5200 V1.09 5200 LSHU V2.01 S/N 131 Page 1 Sample: Kaolinite Operator: Glenn Gray Submitter: File: C:\5200\DATA\VICKSB~1\KAOLIN.SMP Test Number: Avg of 3 Model: (1.570, 0.1000000), 1.331 Analyzed: 5/15/2009 2:01:20PM Material: Kaolinite / Water Reported: 5/15/2009 2:07:59PM Background: Water RI 1.331 Background: 5/15/2009 12:57:28PM Smoothing: Medium
58
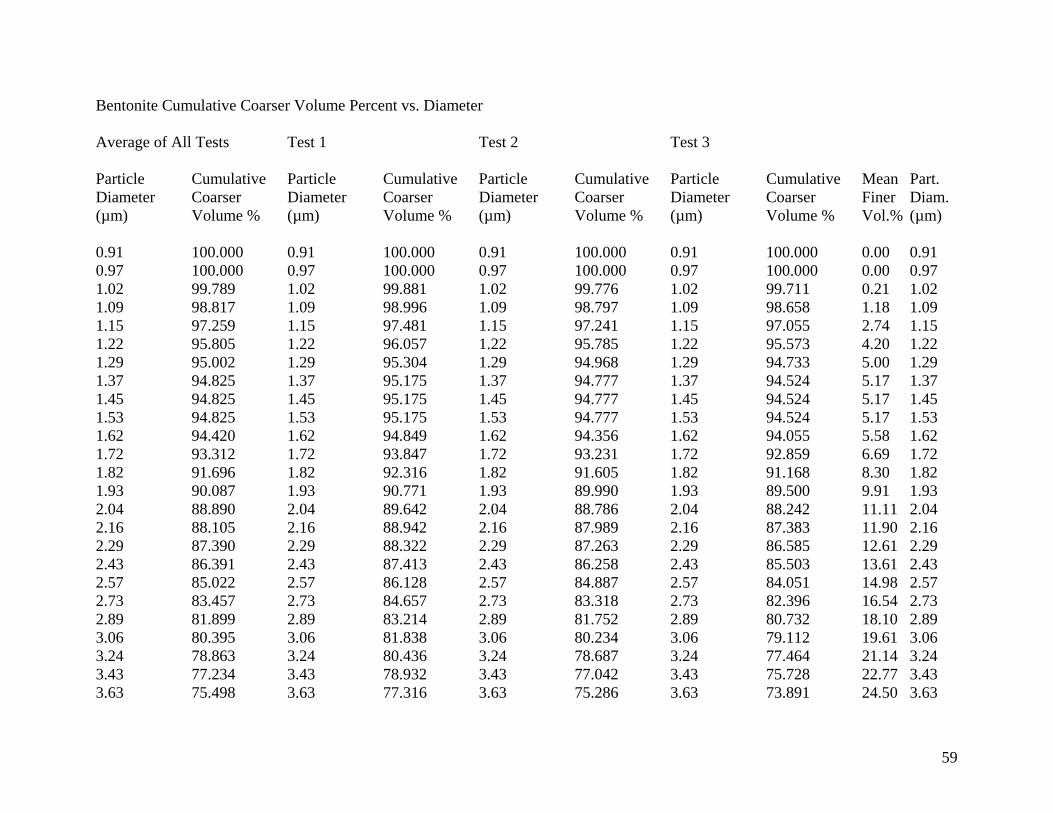
Bentonite Cumulative Coarser Volume Percent vs. Diameter Average of All Tests Test 1 Test 2 Test 3 Particle Cumulative Particle Cumulative Particle Cumulative Particle Cumulative Mean Part. Diameter Coarser Diameter Coarser Diameter Coarser Diameter Coarser Finer Diam. (µm) Volume % (µm) Volume % (µm) Volume % (µm) Volume % Vol.% (µm) 0.91 100.000 0.91 100.000 0.91 100.000 0.91 100.000 0.00 0.91 0.97 100.000 0.97 100.000 0.97 100.000 0.97 100.000 0.00 0.97 1.02 99.789 1.02 99.881 1.02 99.776 1.02 99.711 0.21 1.02 1.09 98.817 1.09 98.996 1.09 98.797 1.09 98.658 1.18 1.09 1.15 97.259 1.15 97.481 1.15 97.241 1.15 97.055 2.74 1.15 1.22 95.805 1.22 96.057 1.22 95.785 1.22 95.573 4.20 1.22 1.29 95.002 1.29 95.304 1.29 94.968 1.29 94.733 5.00 1.29 1.37 94.825 1.37 95.175 1.37 94.777 1.37 94.524 5.17 1.37 1.45 94.825 1.45 95.175 1.45 94.777 1.45 94.524 5.17 1.45 1.53 94.825 1.53 95.175 1.53 94.777 1.53 94.524 5.17 1.53 1.62 94.420 1.62 94.849 1.62 94.356 1.62 94.055 5.58 1.62 1.72 93.312 1.72 93.847 1.72 93.231 1.72 92.859 6.69 1.72 1.82 91.696 1.82 92.316 1.82 91.605 1.82 91.168 8.30 1.82 1.93 90.087 1.93 90.771 1.93 89.990 1.93 89.500 9.91 1.93 2.04 88.890 2.04 89.642 2.04 88.786 2.04 88.242 11.11 2.04 2.16 88.105 2.16 88.942 2.16 87.989 2.16 87.383 11.90 2.16 2.29 87.390 2.29 88.322 2.29 87.263 2.29 86.585 12.61 2.29 2.43 86.391 2.43 87.413 2.43 86.258 2.43 85.503 13.61 2.43 2.57 85.022 2.57 86.128 2.57 84.887 2.57 84.051 14.98 2.57 2.73 83.457 2.73 84.657 2.73 83.318 2.73 82.396 16.54 2.73 2.89 81.899 2.89 83.214 2.89 81.752 2.89 80.732 18.10 2.89 3.06 80.395 3.06 81.838 3.06 80.234 3.06 79.112 19.61 3.06 3.24 78.863 3.24 80.436 3.24 78.687 3.24 77.464 21.14 3.24 3.43 77.234 3.43 78.932 3.43 77.042 3.43 75.728 22.77 3.43 3.63 75.498 3.63 77.316 3.63 75.286 3.63 73.891 24.50 3.63
59
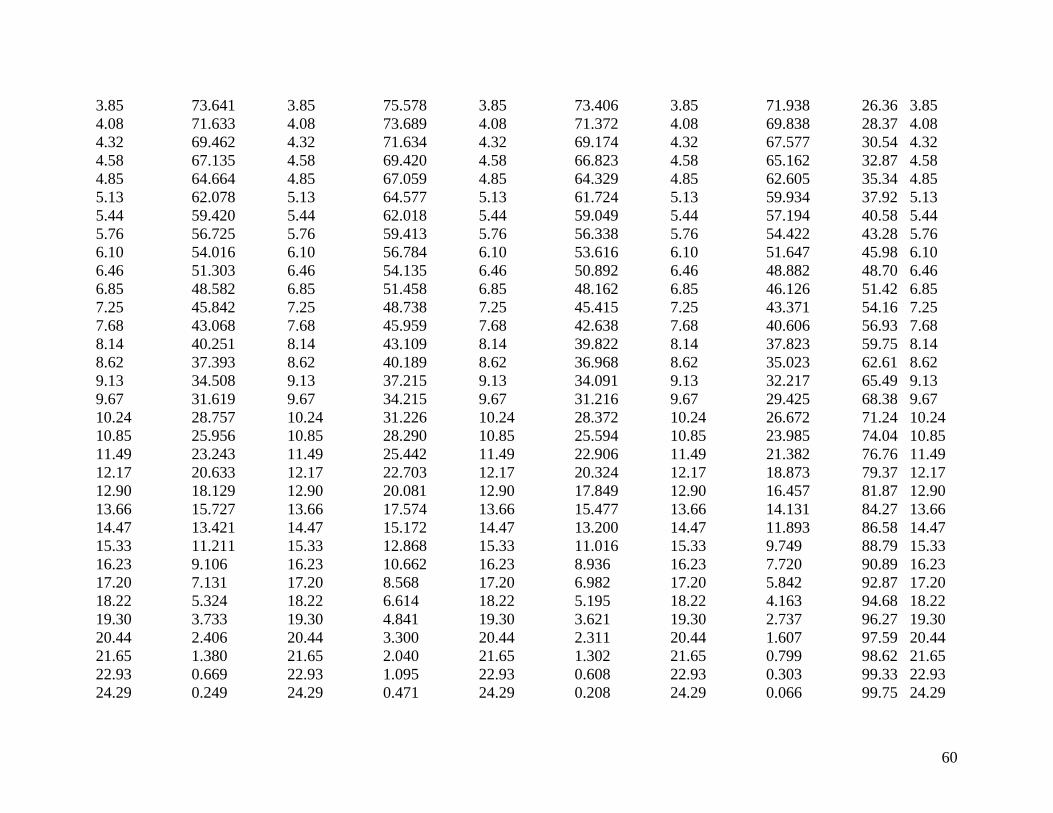
3.85 73.641 3.85 75.578 3.85 73.406 3.85 71.938 26.36 3.85 4.08 71.633 4.08 73.689 4.08 71.372 4.08 69.838 28.37 4.08 4.32 69.462 4.32 71.634 4.32 69.174 4.32 67.577 30.54 4.32 4.58 67.135 4.58 69.420 4.58 66.823 4.58 65.162 32.87 4.58 4.85 64.664 4.85 67.059 4.85 64.329 4.85 62.605 35.34 4.85 5.13 62.078 5.13 64.577 5.13 61.724 5.13 59.934 37.92 5.13 5.44 59.420 5.44 62.018 5.44 59.049 5.44 57.194 40.58 5.44 5.76 56.725 5.76 59.413 5.76 56.338 5.76 54.422 43.28 5.76 6.10 54.016 6.10 56.784 6.10 53.616 6.10 51.647 45.98 6.10 6.46 51.303 6.46 54.135 6.46 50.892 6.46 48.882 48.70 6.46 6.85 48.582 6.85 51.458 6.85 48.162 6.85 46.126 51.42 6.85 7.25 45.842 7.25 48.738 7.25 45.415 7.25 43.371 54.16 7.25 7.68 43.068 7.68 45.959 7.68 42.638 7.68 40.606 56.93 7.68 8.14 40.251 8.14 43.109 8.14 39.822 8.14 37.823 59.75 8.14 8.62 37.393 8.62 40.189 8.62 36.968 8.62 35.023 62.61 8.62 9.13 34.508 9.13 37.215 9.13 34.091 9.13 32.217 65.49 9.13 9.67 31.619 9.67 34.215 9.67 31.216 9.67 29.425 68.38 9.67 10.24 28.757 10.24 31.226 10.24 28.372 10.24 26.672 71.24 10.24 10.85 25.956 10.85 28.290 10.85 25.594 10.85 23.985 74.04 10.85 11.49 23.243 11.49 25.442 11.49 22.906 11.49 21.382 76.76 11.49 12.17 20.633 12.17 22.703 12.17 20.324 12.17 18.873 79.37 12.17 12.90 18.129 12.90 20.081 12.90 17.849 12.90 16.457 81.87 12.90 13.66 15.727 13.66 17.574 13.66 15.477 13.66 14.131 84.27 13.66 14.47 13.421 14.47 15.172 14.47 13.200 14.47 11.893 86.58 14.47 15.33 11.211 15.33 12.868 15.33 11.016 15.33 9.749 88.79 15.33 16.23 9.106 16.23 10.662 16.23 8.936 16.23 7.720 90.89 16.23 17.20 7.131 17.20 8.568 17.20 6.982 17.20 5.842 92.87 17.20 18.22 5.324 18.22 6.614 18.22 5.195 18.22 4.163 94.68 18.22 19.30 3.733 19.30 4.841 19.30 3.621 19.30 2.737 96.27 19.30 20.44 2.406 20.44 3.300 20.44 2.311 20.44 1.607 97.59 20.44 21.65 1.380 21.65 2.040 21.65 1.302 21.65 0.799 98.62 21.65 22.93 0.669 22.93 1.095 22.93 0.608 22.93 0.303 99.33 22.93 24.29 0.249 24.29 0.471 24.29 0.208 24.29 0.066 99.75 24.29
60

61
25.73 0.058 25.73 0.136 25.73 0.037 25.73 0.000 99.94 25.73 27.26 0.005 27.26 0.014 27.26 0.000 - - - - 28.87 0.000 28.87 0.000 - - - - - - Saturn DigiSizer 5200 V1.09 Saturn DigiSizer 5200 V1.09 5200 LSHU V2.01 S/N 131 Page 1 Sample: bentonite Operator: Glenn Gray Submitter: File: C:\5200\DATA\VICKSB~1\BENTON.SMP Test Number: Avg of 3 Model: (1.570, 0.1000000), 1.331 Analyzed: 5/15/2009 1:13:40PM Material: Bentonite / Water Reported: 5/15/2009 1:20:13PM Background: Water RI 1.331 Background: 5/15/2009 12:57:28PM Smoothing: Medium