acoustic impedance interpretation for sand department of ... ·...
TRANSCRIPT

AAPG Bulletin, v. 86, no. 10 (October 2002), pp. 1753–1771 1753
Acoustic impedanceinterpretation for sanddistribution adjacent to a riftboundary fault, Suphan Buribasin, ThailandS. Ronghe and K. Surarat
ABSTRACT
A seismic-derived acoustic impedance volume was used to imagethe locations and shapes of water-saturated sands deposited withinthe producing interval of a continental half graben. Wire-line logcrossplots showed that high values of impedance relate to sand li-thology. Constrained sparse spike inversion resulted in good com-parisons between the derived impedance traces and band-filteredwire-line impedances. Maximum impedance extractions in mapview and three-dimensional (3-D) displays revealed two styles ofsand distribution: axial deposits comprising delta lobes and bound-ary fault–induced deposits comprising fan deltas and sand-filledfeeder canyons. Coarse-grained sedimentation was dictated by thestructural configuration of the basin. Axial sedimentation progradedfrom south to north, plunging into the basin. Boundary-fault influ-ence on sedimentation was controlled by a transfer zone and relayramp geometry between en echelon fault segments and showed twocomponent pathways: fan deltas were transported perpendicular tothe fault, whereas feeder canyons transported sediment downslopeto interfinger with the rift-floor deposits. These styles of structureand sedimentation support previously published models of struc-tural-sedimentation interactions in rifts.
INTRODUCTION
Seismic inverse modeling, the decomposition of seismic data intoacoustic impedance traces (Lavergne and Willm, 1977; Lindseth,1979), aims to bridge the gap between subsurface geology and itsdigital expression as seismic amplitudes. Duboz et al. (1998) andLatimer et al. (2000) explained the advantages of interpretationon an acoustic impedance volume over conventional seismic
Copyright �2002. The American Association of Petroleum Geologists. All rights reserved.
Manuscript received August 28, 2000; revised manuscript received March 18, 2002; final acceptanceMay 16, 2002.
AUTHORS
S. Ronghe � Department of PetroleumGeoscience, University Brunei Darussalam,Jalan Tungku Link, Brunei Darussalam, BE1410; [email protected]
Sagar Ronghe received his B.Sc. degree ingeological oceanography from the UniversityCollege of North Wales, Bangor, UnitedKingdom, in 1991. He obtained an M.Sc.degree (distinction) in petroleum geosciencein 1992 and a Ph.D. in 1996, both from theUniversity of Aberdeen, United Kingdom.Sagar is a geophysicist, employed as alecturer with the Department of PetroleumGeoscience, University Brunei Darussalam. Hisinterests are in integrating seismic and wire-line data for predicting lithology, reservoirproperties, and fluid distributions throughseismic inverse modeling and geostatistics.
K. Surarat � Department of PetroleumGeoscience, University Brunei Darussalam,Jalan Tungku Link, Brunei Darussalam, BE1410; current address: PTT Exploration andProduction Public Co. Ltd., 555 Vibhavadi-Rangsit Road, Bangkok, 10900, Thailand;[email protected]
Korakot Surarat received her B.Sc. degree ingeology from Chulalongkorn University,Thailand, in 1993 and her M.Sc. degree inpetroleum geoscience from University BruneiDarussalam in 1999. She worked as a dataprocessor for Unocal Thailand between 1993and 1996. Korakot joined PTT Exploration andProduction Public Co. Ltd. in 1996 as ageophysicist, and she is currently with theArthit Asset Team. Her interests are inreservoir characterization.
ACKNOWLEDGEMENTS
We would like to thank PTT Exploration andProduction Public Co. Ltd. for provision ofdata and for permission to publish the results.Jason Geosystems and Landmark Graphic Cor-poration are thanked for donation of softwareto the Department of Petroleum Geoscience,University Brunei Darussalam (UBD). This arti-cle benefited considerably from reviews by J.Lambiase and C. Morley (UBD), M. Sams (Ja-son Geosystems), and J. E. Blott, B. Hart, andL. Liro (AAPG nominated reviewers).

1754 Acoustic Impedance Interpretation, Suphan Buri Basin (Thailand)
Figure 1. Major structural elements and Tertiary basin distri-butions, southern Central Plain, Thailand (modified fromO’Leary and Hill, 1989). Striped box in inset shows area location.Dashed lines represent the likely trends of preexisting basementfabrics that have influenced Tertiary fault-plane orientations (seeDiscussion).
interpretation. Impedance data image layers, in con-trast with seismic data, which image interfaces. There-fore, interpretations can be made on lithological unitsrather than on their boundaries, and extracted prop-erties relate to rock layers rather than to interfaces. Im-pedance sections can improve layer visualization andvertical resolution. In addition, impedance can serve asan indicator of lithology (Pendrel and van Riel, 1997)and hydrocarbon occurrence (Ruijtenberg et al., 1990;Ronghe and Trung, 2000) and may also be correlatedwith other rock properties, such as porosity (Brown,1996; Burge and Neff, 1998).
This article reports on a seismic inverse modelingstudy from an oil-producing field in the Suphan Buribasin, Thailand. Exploration and field development re-lied on well information and two-dimensional (2-D)seismic data interpretation. Lithology and hydrocarbondistributions were not known in detail. Recent acqui-sition of three-dimensional (3-D) seismic data madethis inverse modeling study feasible, with the objectiveof imaging distributions of lithology and/or hydrocar-bons, depending on the data-specific discriminatory ca-pability of acoustic impedance. This article outlines theworkflow and the inferences derived at each stage,presents the seismic-derived impedance maps imagingsand distribution, and evaluates the tectonic influenceson sedimentation.
BASIN GEOLOGY
The Suphan Buri basin is an onshore Tertiary rift basinlocated about 100 km northwest of Bangkok in thesouthern Central Plain of Thailand (Figure 1). The ba-sin occurs between two parallel, northwest-southeast–trending strike-slip fault zones: theMae Ping fault zoneto the north and the Three Pagodas fault zone to thesouth (O’Leary and Hill, 1989; Morley, 2001). Thebasin is one of a string of generally north-south–trend-ing basins that run from north Thailand into the Gulfof Thailand. The Suphan Buri basin covers an area ofapproximately 970 km2 and is marked by a distincthalf-graben morphology with a north-south–trending,east-dipping border fault to the west. The study areais located along the western margin of the basin wherethe only oil production occurs. The boundary fault inthe study area is characterized by a splay that isolatesa sliver of structurally shallower formation (Figure 2).Numerous curved intrabasin faults exist. A structuralhigh adjacent to the boundary-fault splay forms athree-way dip closure penetrated by producing wells.
A smaller high occurs in the northern part of the studyarea adjacent to the boundary fault. The mapped sur-face dips toward the northeast, where unit thicknessesalso increase toward possible depocenter locations.
The nonmarine sedimentary fill of the Suphan Buribasin has been classified by Intharawijitr (K. Inthar-awijitr, 1993, personal communication) into five units(Figure 3). Unit A (lower Oligocene) represents earlyrift, basin-fill sedimentary rocks comprising conglom-erates and sandstones of alluvial origin fining-upwardinto shallow-lacustrine siltstones and mudstones. UnitsB and C (upper Oligocene–lower Miocene) are pre-dominantly lacustrine deposits at their bases but showincreasing fluvial influence higher up in the section;they form the main source rocks. Unit D (middle–upper Miocene) forms the interval of interest for ourstudy. Core analysis from unit D (Tongklang, 1995)

Ronghe and Surarat 1755
Figure 2. Time-structure map of horizon D3. Contours are inmilliseconds. Thick lines represent fault planes. Ticks markdownthrown side. Dots represent well bottom-hole locations,and associated lines mark well trajectories. Dashed lines rep-resent the likely trends of preexisting basement fabrics that haveinfluenced Tertiary fault-plane orientations (see Discussion).
revealed laminated mudstones with no evidence ofwave action (therefore, probably deposited belowwave base) that represent deep lacustrine deposits.This interpretation is substantiated also by crustaceansfound in core (K. Schofield, 1988, personal commu-nication). Sandstones in core are medium to coarsegrained and commonly contain poorly sorted conglom-erates (granule to pebble fraction) dispersed in the ma-
trix. The sandstones show normal to reverse gradingand erosional bases and containmudstone rip-up clasts,folded laminated brown silty mudstones, and coal frag-ments. The sandstones are interpreted as debris flowsand turbidites deposited as alluvial fans and lacustrinefan deltas near the western, fault-controlled margin ofthe basin (O’Leary and Hill, 1989; Tongklang, 1995).Unit E (Pliocene–Holocene) represents predominantlyalluvial and fluvial postrift deposits comprising gravels,siltstones, clays, and mudstones.
Data provided by PTT Exploration and ProductionPublic Co. Ltd., Thailand, comprised 16-fold 3-D seis-mic data acquired in 1998 (368 inlines and 640 cross-lines at 12.5 m spacing) that covered approximately 37km2 and wire-line logs from four wells, 2 vertical (K-1and K-2) and 2 deviated (K-1a and K-2b).
WIRE-L INE ANALYSIS
Wire-line log analysis aimed to (1) define the wire-linecharacteristics of the sand and shale lithologies, (2) as-sess the well to well correlatability of lithological units,and (3) study the acoustic impedance response tochanges in lithology and fluid in unit D. The wire-linegamma-ray response has been calibrated to core byTongklang (1995). Blocky low gamma-ray patternsseveral meters thick with intermittent serrated highgamma-ray spikes represent coarse-grained fan-deltadeposits separated by thin laminated mudstones. Fin-ing-upward gamma-ray patterns with abrupt basaltransitions correlate with channel fill sands, whereascoarsening-upward trends have been calibrated withprograding delta front facies in wells outside the studyarea. The lacustrine mudstone sequences feature ser-rated, moderately high to high gamma-ray signatures.
Figure 4 shows representative wire-line logs fromwell K-2. The gamma-ray log displays an overall fining-upward signature within the interval. Sandstones,characterized by low gamma-ray values (�80 API),show high values for velocity and density and, there-fore, for acoustic impedance, whereas mudstones,characterized by high gamma-ray values (�120 API),show comparatively lower acoustic impedances. Sixgeological markers (D1–D6) provided by PTT Explo-ration and Production Public Co. Ltd. correspond gen-erally to the tops or bases of prominent mudstones. Inaddition, twomarkers, the top and base of unit D, wereidentified from seismic data and were back-correlatedto the well track using a synthetic seismogram (as dis-cussed in a following section). The markers subdivide

1756 Acoustic Impedance Interpretation, Suphan Buri Basin (Thailand)
Figure 3. Stratigraphy anddepositional environments inthe Suphan Buri basin (basedon K. Intharawijitr, 1993, per-sonal communication).
unit D into seven subunits (Figures 3, 4). Figure 5 pres-ents the well to well gamma-ray log correlation usingthe geological markers. Log trends show some similar-ity. The mudstone markers are rendered correlatableby their high gamma-ray values (for example, the D1,D2, and D4 markers). Sands appear to be intermit-tently deposited. The lower half of the unit showsmore sand.
Wire-line logs were crossplotted to study theacoustic impedance response to lithology and fluid var-iations. Figure 6 displays crossplots of gamma-ray vs.acoustic impedance data graded using water saturation(Sw) over the unit D interval from wells K-1a and K-2as representative. Exclusion of the hydrocarbon-saturated samples from consideration results in stronginverse linear relationships between gamma-ray valuesand acoustic impedance in each well. The uppergamma-ray threshold for sand lithology (80 API) cor-relates with an impedance cutoff value of about 9500g/cc m/s. Impedance values larger than the cutoff gen-erally belong to water-saturated sand because presenceof hydrocarbon lowers impedance. Hydrocarbon-sat-urated samples form low-impedance clusters that over-lap the impedance range of shaly sand and shaleimpedances.
Crossplot analysis provided the following conclu-sions: (1) acoustic impedance shows separation invalues for both lithology (shale/sand) and fluid (water-saturated sand/hydrocarbon-saturated sand) compo-nents; (2) acoustic impedance values are unique onlyfor the water-saturated sand component. Wire-linecrossplot analysis established the framework withinwhich the subsequent inverse modeling–derived im-pedance volume could be interpreted. The distributionof high values within the impedance volumewere usedto map the locations and shapes of water-filled sands.The nonunique characteristic of impedance for hydro-carbon-saturated sand meant that the impedance vol-ume could not be interpreted for hydrocarbondistribution.
L INKING WIRE-L INE TO SEISMIC DATA
The well markers were correlated with seismic eventsvia synthetic seismograms. The transformation of wire-line logs from depth into two-way traveltime wasachieved using checkshot information at each well.Optimum wavelet estimation and synthetic seismo-gram construction required a two-step iterative pro-

Ronghe and Surarat 1757
Figure 4. Wire-line logs from well K-2. Sands, characterized by low gamma-ray values (�80 API), have high values of acousticimpedance. The D1–D6 geological markers correspond to the tops or bases of prominent shales and categorize the interval into sevensubunits.
cedure. An initial zero-phase wavelet was constructedthrough Fourier synthesis of seismic trace amplitudespectra and was used to obtain a synthetic seismogramat each well. Each synthetic trace was comparedagainst adjacent seismic traces, and the time-depth re-lationship was adjusted until the best synthetic-seismicmatch was obtained. For the updated well to seismiccorrelation, the wavelet was recalculated at each welllocation as a least squares inverse filter that minimizedthe misfit function between seismic data and the syn-thetic trace. This resulted in a more accurate estimateof the wavelet and, consequently, an optimized syn-thetic to seismic trace match at each well location. Theaverage of the four wavelets (Figure 7) has peak am-plitude occurring at wavelet central location (zero
time), contains a dominant frequency of about 40 Hz,and shows phase to change linearly within the limits ofthe seismic bandwidth.
Figure 8 shows, for well K-2 as representative, thefinal wire-line to seismic match. Table 1 lists synthetic-seismic cross-correlation coefficients calculated alongeach well trajectory over the unit D interval. For thetwo vertical wells (K-1 and K-2), the synthetic-seismiccorrelations are good (coefficients of 0.74 and 0.77,respectively). Deviations of the well path away fromthe vertical cause uncertainties in matching the syn-thetic trace created along the well track with the ver-tical seismic traces. Consequently, the two deviatedwells (K-1a and K-2b) show lower cross-correlation co-efficient values, but they still represent acceptable and

1758 Acoustic Impedance Interpretation, Suphan Buri Basin (Thailand)
Figure 5. Well to well gamma-ray log correlations. Inset shows correlation trajectory based on bottom-hole locations. High gamma-ray shales are correlatable. Sands appear to be intermittently deposited.
optimum wire-line to seismic matches for use in sub-sequent inverse modeling.
The synthetic or seismic trace represents the com-posite reflection response of the propagating sourcepulse to all impedance boundaries in the formation.The resolving power of seismic data is, therefore, de-termined by the degree of interference between re-flected wavelets and by the frequency and wavelength(k) of the downward propagating pulse. Tuning occurswhen unit thickness equals k/4, and reflected waveletsfrom closely spaced boundaries interfere constructivelyto result in large seismic amplitudes. Knowledge of thewavelet peak spectral frequency and formation veloc-ity allow for the calculation of the tuning thickness. Inthis data, the dominant wavelet frequency is about 40Hz (Figure 7). The prominent, thick sands occurring
in the D6 subunit of well K-2 have an associated max-imum velocity of sonic propagation of about 4700m/s (Figure 4). Tuning thickness for sand lithology,therefore, calculates to about 30 m. The lithology ofunit D comprises intercalated units of sandstone andmudstone lithologies that have thicknesses encompass-ing the complete spectrum from a minimum of a fewcentimeters to a maximum on the order of 25 m(Tongklang, 1995). Therefore, the thickest sand unitsare susceptible to tuning and do not have their upperand lower interfaces independently resolved on theseismic data.
The well to seismic correlation of Figure 8 showsthat prominent impedance boundaries relate to peakor trough events on the synthetic and seismic data:transitions of impedance from higher to lower values

Ronghe and Surarat 1759
Figure 6. Wire-line log crossplots of gamma-ray values vs.acoustic impedance graded by water saturation (Sw) for unit Dfrom (a) well K-1a and (b) well K-2. On exclusion of the hydro-carbon-saturated samples, the gamma-ray values have stronglinear relationships with acoustic impedance. In these data, im-pedance is a unique discriminator of water-saturated sand.
Figure 7. Characteristics of the derived average wavelet.(a) Time domain representation; (b) amplitude spectrum;(c) phase spectrum. The wavelet is of mixed phase, has peakamplitude occurring at zero time, contains a dominant fre-quency of about 40 Hz, and has a linearly changing phase overthe seismic bandwidth.
(as across the D6 well marker) correlate with seismictrough events. The D2–D6 well markers were corre-lated accordingly, and seismic horizons were mappedover the data volume. In addition, the top and base ofunit D, identified from reflection characteristics onseismic data and mapped as peak event horizons overthe data volume, were back-correlated to the welltracks. Figure 9 is a seismic section view intersectingwell trajectories superimposed with synthetic seismo-grams, well tops, and interpreted horizons. Figure 9serves to display the seismic data characteristics adja-cent to well locations and presents the optimum andconsistent derived match between all well markers andseismic events.
SEISMIC INVERSE MODELING
The seismic data volume was inverted into an acousticimpedance volume using the constrained sparse spike
inversion (CSSI) algorithm (Pendrel and van Riel,1997). Theoretically, inverse modeling offers non-unique solutions: any number of geological modelsmay satisfactorily explain the features of the seismicdata. The CSSI is a trace-based iterative algorithm thatnarrows down the range of possible solutions to withinuser-defined impedance constraints. An acoustic im-pedance trend and a set of constraints were establishedfor the data from wire-line impedance logs (Figure 10).The algorithm restricts the inversion result to withinthe geologically and geophysically permissible range ofsolutions represented by the established trend and con-straints window. Additionally, the CSSI algorithm at-tempts to replace the wavelet signature with a spikereflectivity response, thereby reducing tuning effectsand broadening the frequency bandwidth of the result.Seismic data, being bandlimited, provide an impe-dance solution that is missing low and high frequencies.Whereas missing high frequencies are unrecoverable,low frequencies can be extracted from wire-line dataand merged with the sparse spike inversion result toprovide a final broadband solution. Wire-line impe-dance logs were mathematically extrapolated within a3-D model defined by interpreted horizons and faults.The model was filtered to extract the low-frequencyimpedance components (�10 Hz), and these were

1760 Acoustic Impedance Interpretation, Suphan Buri Basin (Thailand)
Figure 8. Well to seismic correlation for well K-2. The section view panel shows good agreement between seismic traces and thesuperimposed synthetic seismogram displayed in color and wiggle trace modes.
Table 1. Cross Correlation Coefficients
Wells
Parameter K-1 K-2 K-1a K-2b
Synthetic/seismic trace 0.74 0.77 0.69 0.68Impedance/pseudoimpedance log 0.78 0.80 0.80 0.77
merged on a trace by trace basis with the CSSI-derivedimpedance volume.
RESULTS AND INTERPRETATION
Figure 11 compares the results of inverse modeling atwell K-2. The section view panel displays the derivedimpedance traces in color and wiggle trace modes and,superimposed at well location, the wire-line impe-dance log. The comparison illustrates the limit of res-olution of inverse modeling: fine-scale wire-line im-pedance variations are beyond the resolution capabilityof the derived impedance traces, whereas lithologicalimpedance units of about 20 m and greater are poten-tially resolvable. In the wire-line log panels, the wire-line impedance log (red) is superimposed by the
pseudoimpedance log (black) extracted along the welltrack from the derived impedance volume. A goodgeneral agreement exists between the two, corrobo-rated by the high value of the cross-correlation coeffi-cient (0.80), shown in Table 1.
Figure 12 displays an impedance section intersect-ing well trajectories. It is superimposed, at well loca-tions, by wire-line impedance logs that have been high-

Ronghe and Surarat 1761
Figure 9. Seismic section intersecting well trajectories and superimposed at well locations by synthetic seismograms in color andwiggle trace modes. Interpreted horizons displayed as dashed lines. Inset shows section trajectory based on bottom-hole locations.The section presents the optimum and consistent derived match between all well markers and seismic events.
cut frequency–filtered to the bandwidth of the derivedimpedance traces to facilitate comparison. A good gen-eral agreement exists between impedance features ofthe wire-line logs and the adjacent derived impedancetraces. Water-saturated, high-impedance sands appearto be intermittently and locally deposited within abackground matrix of lower impedance shaly sand orshale. More sand appears to be deposited in the bottomhalf of the unit D interval, in agreement with thegamma-ray log characteristics of Figure 5.
Maximum values of impedance were extractedfrom each subunit to image the lateral distributions ofthe water-saturated sands. Figure 13 presents the mapview impedance images for subunits D7–D4, alongwith line-drawing interpretations of the recognizable,geologically meaningful patterns of sand distributionand their inferred directions of sediment transport. Theimages reveal that coarse-grained sediment is sourcedinto the rift from two locations: from the south, out-side the study area, and from the west, across theboundary fault. Sand influx into the rift from the southoccurs as lobate features (e.g., in the southern part ofsubunit D7 and adjacent to the eastern margin in sub-
units D5 and D4). These are interpreted, based ontheir location, orientation, and shape, as deltas (D inFigure 13). The D5 andD4 subunit images suggest thatthe deltas are sourced by a single channel (C in Figure13), giving the composite a tadpole-like appearance.
Sediment sourced from the west follows two stylesof deposition, lobate and linear. Lobate features, inter-preted from their core/wire-line characteristics andshape as fan deltas (FD in Figure 13), occur in twolocations: (1) in the central areas of subunits D7, D6,and D5, located in the structural high adjacent to thesplay in the boundary fault and (2) in the northern andsouthern areas adjacent to the boundary fault (e.g.,subunits D7 and D4). Sediment influx is from acrossthe boundary fault, and sediment movement is fromwest to east, perpendicular to the fault plane. The sec-ond style of sedimentation derived from the west isrepresented by lineations that originate in the struc-tural high adjacent to the boundary fault and trenddownslope to the northeast. These features are seen inthe impedance images of subunits D6 and D4 (Figure13b, d). They are interpreted from core/wire-line char-acteristics and shape as sand-filled feeder canyons (FC

1762 Acoustic Impedance Interpretation, Suphan Buri Basin (Thailand)
Figure 10. The defined impedance trend and constraintsaround the impedance log from well K-2, as representative.Inverse modeling produced a solution that honored this con-straints window.
in Figure 13) and represent northeastward downslopetransport of sediment derived from across the bound-ary fault, outside the basin. In subunit D6, the sand-filled feeder canyons culminate downslope in a distinct,ponded deposit in the structurally deeper northernpart of the study area, whereas in subunit D4, thecanyon sedimentation interfingers with the rift-floordeposits.
The sequence of images in Figure 13 recordschanges in depositional styles and locations of coarse-grained sedimentation over the study area. In thedeeper intervals (subunits D7 and D6), axial sedimen-tation is restricted to the southern half of the area.There is no axial component of sediment transport inthe northern part. In contrast, the upper subunits (D5and D4) show a northward progradation of axial sed-imentation in the form of channelized flows that cul-minate in delta deposits in the structurally deepest partof the area. Subunit D4 shows a delta lobe also in thesouthern part of the area. Axial sedimentation there-
fore occurred in pulses as it prograded northward intothe rift. The boundary fault–induced fan deltas vary inlocation and size. Additionally, the downslope-trend-ing feeder canyons are clearly visible only in subunitsD6 and D4. This suggests that boundary fault–inducedsedimentation was also sporadic. According toO’Learyand Hill’s (1989) paleogeographic reconstruction, flu-vial systems drained the western highlands and fed intothe Suphan Buri basin. The sporadicity of sedimenta-tion therefore relates to changes in fluvial systems thatmay be brought about by a host of factors that includehinterland morphology, tectonism, sediment availabil-ity, climatic conditions, and drainage pathways. Thedata for this article are insufficient to isolate the preciseinfluencing factors.
DISCUSSION
Tectonic Controls on Sedimentation
In this section we discuss basin formation and the in-fluence of rift-structure and boundary-fault evolutionon the imaged patterns of coarse-grained sedimenta-tion. The evolution of Tertiary basins in Thailand hasbeen attributed to sigmoid extension from shearingalong strike-slip faults in the early Tertiary (O’Learyand Hill, 1989; Polachan and Sattayarak, 1989; Pola-chan et al., 1991). However, Morley et al. (2001)stated that there is no indication that throughgoing,major strike-slip faults bound the basins or that thebasins evolved as pull-aparts. According to Morley(2002a), strike-slip movements along the faults oc-curred in the Eocene–Oligocene and preceded basinformation. Watcharanantakul and Morley (2000) andMorley (2001) proposed that Tertiary basin evolutionin Thailand was due to subduction rollback of the In-dian plate under the West Burma block, which causednonuniform lithospheric stretching where steepeningof the slab with time caused increased extension. Anevaluation of 2-D seismic data from the Suphan Buribasin (Buayai, 2000) concluded that there is no evi-dence of strike-slip tectonics influencing basin opening;instead, preexisting basement fabric structures trend-ing north-south, northeast-southwest, and northwest-southeast controlled basin development and fault ge-ometry. These major tectonic lineaments are easilyidentified on geological maps of Thailand and have in-fluenced the development of other Tertiary basins(Watcharanantakul and Morley, 2000; Kornsawan andMorley, 2002). The controls of basement fabric on the

Ronghe and Surarat 1763
Figure 11. Comparison of the inverse modeling result at well K-2. The section view panel shows the derived impedance tracesoverlain by the wire-line impedance log in color and wiggle trace modes. The left wire-line view panel shows the wire-line impedancelog overlain by the pseudoimpedance trace extracted from the impedance volume along the well trajectory.
location and geometry of rift basins, faults within therift, transfer zones, and rift segments have been de-tailed by McConnell (1972), Daly et al. (1989), Smithand Mosley (1994), and Morley (1999a).
The Suphan Buri basin opened in the late Oligo-cene along a series of north-south suture zones. Thebasin opened from south to north, in agreement withthe observation by Morley et al. (2001) that the Ter-tiary basins of Thailand become younger toward thenorth. Variations in displacement along the strike ofrift boundary faults can indicate joining of individualfault segments (Duval et al., 1995; Dawers and Un-
derhill, 2000). A study of displacement patterns alongthe western boundary-fault system of the Suphan Buribasin (Buayai, 2000) suggested that the boundary-faultsystem comprised several unconnected, generallynorth-south–trending en echelon segments, each defin-ing a half-graben subbasin with its own depocenter(Figure 14a). Fault tips curved where they intersectedthe northeast-southwest and northwest-southeast fab-ric trends. Displacement was maximum at the centerof each fault segment and died out at the tips.
The evolution of extensional faults through prop-agation and linkage has been studied by, among others,

1764 Acoustic Impedance Interpretation, Suphan Buri Basin (Thailand)
Figure 12. Impedance section intersecting well trajectories and superimposed at well locations by high-cut frequency-filteredimpedance logs in color and wiggle trace modes. Interpreted horizons displayed as dashed lines. Inset shows section trajectory basedon bottom-hole locations. High-impedance sands are intermittently and locally deposited within a background matrix of lower im-pedance shaly sand or shale.
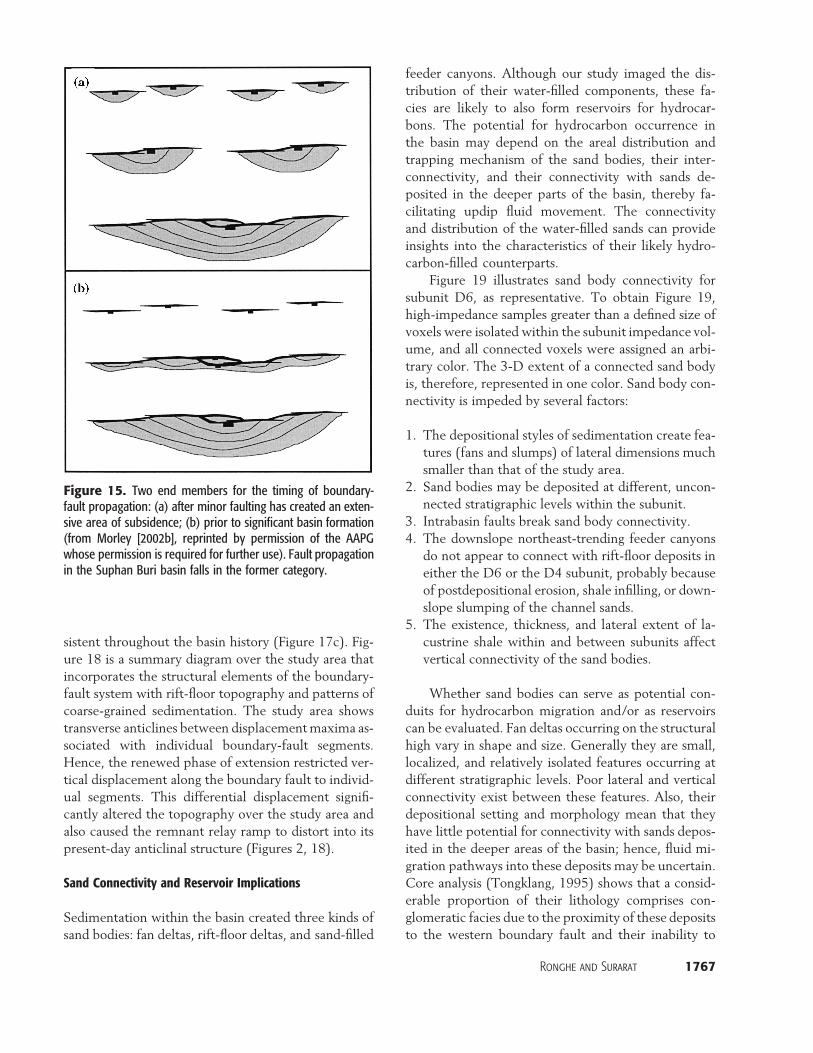
Peacock and Sanderson (1991), Schlische (1991,1995), Dawers and Anders (1995), Schlische and An-ders (1996), Morley (1999b, 2002b), and Morley andWonganan (2000). Boundary faults grow by along-strike propagation and by linkage with other faults.Displacement is transferred from one fault to anothervia an accommodation or transfer zone (Rosendahl,1987; Morley et al., 1990; Morley, 1999b). Two endmembers exist for the timing of boundary-fault prop-agation and linkage (Morley, 2002b): (1) after minorfaulting has created an extensive area of subsidence(Figure 15a) and (2) prior to significant basin formation(Figure 15b). Displacement patterns along the bound-ary-fault system (see also Buayai, 2000) suggest thatfault propagation in the Suphan Buri basin falls in theformer category. Fault linkages may be soft or hard(Walsh and Waterson, 1988). In soft fault linkages,faults appear to be isolated from one another, whereasin hard fault linkages, fault surfaces are linked by otherfaults. Soft linkage of the Suphan Buri basin boundary-fault segments began in the late Miocene (Buayai,2000). Several fault segments still separated individual
depocenters throughout most of the Miocene. In thecenter of the study area, a northeast-trending relayramp occurred between adjacent half grabens and con-nected the footwall region with the rift floor (Figure14b). This structural configuration is in agreementwith rift systems described by Leeder and Gawthorpe(1987), Lambiase (1990), Lambiase and Bosworth(1995), and Morley (1995, 1999c). Figure 16 concep-tualizes the rift structure and sedimentation patternsaround the study area.
Sedimentation occurred in response to rift mor-phology and evolution. Initial rifting in the early Oli-gocene intercalated very coarse grained alluvial fan de-posits with shallow-lacustrine muds of unit A in thestudy area (K. Intharawijitr, 1993, personal commu-nication; Tongklang, 1995). Increased intensity of rift-ing and basin development through the Oligocene cre-ated deep lacustrine conditions in which themudstones of unit B accumulated. The Miocene (unitsC and D) was characterized by an interplay betweenintermittent coarse-grained sedimentation and mud-stone deposition in response to lake level fluctuations.

Ronghe and Surarat 1765
Figure 13. Map-view images of maximum impedance extracted from each subunit and line-drawing interpretations of the recog-nizable, geologically meaningful patterns of sand distribution and their inferred directions of sediment transport (red arrows).(a) Subunit D7; (b) subunit D6; (c) subunit D5; (d) subunit D4. C � channel; D � delta; F � fault plane; FC � sand-filled feedercanyon; FD � fan delta.

1766 Acoustic Impedance Interpretation, Suphan Buri Basin (Thailand)
Figure 14. Schematic illustration of boundary-fault and basin evolution over the study area. Dashed lines represent the likely trendsof preexisting basement fabrics that have influenced Tertiary fault-plane orientations (see Discussion). (a) In the late Oligocene, thebasin opened along a series of north-south suture zones as en echelon fault segments, each with an associated depocenter. (b) Inthe early–late Miocene, fault propagation and linkage created an extensive area of subsidence. A northeast-trending relay rampoccurred between adjacent boundary-fault segments. (c) In the late Miocene–Pliocene, a renewed phase of extension linked boundary-fault segments, significantly altered topography, distorted the relay ramp, and created intrabasin faults.
Episodic axial sedimentation entered the study area inthe southern updip location as delta lobes, progradeddown plunge as channels, and culminated in rift-floordeltas in the northern, structurally deepest but flattestpart of the study area. The northeast-trending relayramp between the en echelon faults created a topo-graphic low in the footwall region for episodic fluvialsystems draining the western highlands to enter theboundary-fault margin. These formed fan-delta depos-its on the adjacent, elevated rift floor. Feeder canyonstransported coarse-grained sediments down the relayramp slope into the rift floor. Erosion of the boundary-fault escarpments also contributed sediment as alluvialfans or fan deltas that ponded in the structural lowsformed by areas of maximum displacement along thefault planes. These patterns of sedimentation havebeen well documented in rifts (Leeder andGawthorpe,1987; Gawthorpe and Colella, 1990; Lambiase, 1990;Lambiase and Bosworth, 1995).
The Suphan Buri basin underwent a phase of re-newed extension in the late Miocene (O’Leary andHill, 1989) that persisted into the Pliocene (Morley etal., 2001). This extensional phase coincides with anabrupt change to deep lacustrine mudstone facies oncore and wire-line log signatures (Tongklang, 1995) at
the base of the D2 subunit. The renewed extension hadnumerous effects on rift structure. It caused hard link-age of the boundary-fault segments through fault prop-agation, the directions of propagation being influencedby the preexisting fabric trends. Hence, the boundary-fault segment annotated “A” in Figure 14b propagatednorthward, whereas southward propagation of the Bfault segment followed a curved trajectory defining anintersection of the northeast-southwest and northwest-southeast fabric trends until it linked with the A seg-ment. This propagation cut off the relay ramp and cre-ated the fault splay in the newly amalgamatedboundary fault (Figure 14c). The tectonic activity alsocreated the intrabasin faults, their orientations influ-enced by preexisting basement fabric trends. Such con-trols of preexisting basement fabrics on fault develop-ment and reactivation have been recorded in the Gulfof Thailand by Duval et al. (1995) and Kornsawan andMorley (2002).
Newly amalgamated faults may show either of twopatterns of displacement (Morley, 2002b): the originaldisplacements may be altered so that the maxima lieat the center of the joined segments (Figure 17b), ororiginal displacement patterns may remain, leading tothe development of a transverse anticline that is per-
Ronghe and Surarat 1767
Figure 15. Two end members for the timing of boundary-fault propagation: (a) after minor faulting has created an exten-sive area of subsidence; (b) prior to significant basin formation(from Morley [2002b], reprinted by permission of the AAPGwhose permission is required for further use). Fault propagationin the Suphan Buri basin falls in the former category.
sistent throughout the basin history (Figure 17c). Fig-ure 18 is a summary diagram over the study area thatincorporates the structural elements of the boundary-fault system with rift-floor topography and patterns ofcoarse-grained sedimentation. The study area showstransverse anticlines between displacementmaxima as-sociated with individual boundary-fault segments.Hence, the renewed phase of extension restricted ver-tical displacement along the boundary fault to individ-ual segments. This differential displacement signifi-cantly altered the topography over the study area andalso caused the remnant relay ramp to distort into itspresent-day anticlinal structure (Figures 2, 18).
Sand Connectivity and Reservoir Implications
Sedimentation within the basin created three kinds ofsand bodies: fan deltas, rift-floor deltas, and sand-filled
feeder canyons. Although our study imaged the dis-tribution of their water-filled components, these fa-cies are likely to also form reservoirs for hydrocar-bons. The potential for hydrocarbon occurrence inthe basin may depend on the areal distribution andtrapping mechanism of the sand bodies, their inter-connectivity, and their connectivity with sands de-posited in the deeper parts of the basin, thereby fa-cilitating updip fluid movement. The connectivityand distribution of the water-filled sands can provideinsights into the characteristics of their likely hydro-carbon-filled counterparts.
Figure 19 illustrates sand body connectivity forsubunit D6, as representative. To obtain Figure 19,high-impedance samples greater than a defined size ofvoxels were isolated within the subunit impedance vol-ume, and all connected voxels were assigned an arbi-trary color. The 3-D extent of a connected sand bodyis, therefore, represented in one color. Sand body con-nectivity is impeded by several factors:
1. The depositional styles of sedimentation create fea-tures (fans and slumps) of lateral dimensions muchsmaller than that of the study area.
2. Sand bodies may be deposited at different, uncon-nected stratigraphic levels within the subunit.
3. Intrabasin faults break sand body connectivity.4. The downslope northeast-trending feeder canyons
do not appear to connect with rift-floor deposits ineither the D6 or the D4 subunit, probably becauseof postdepositional erosion, shale infilling, or down-slope slumping of the channel sands.
5. The existence, thickness, and lateral extent of la-custrine shale within and between subunits affectvertical connectivity of the sand bodies.
Whether sand bodies can serve as potential con-duits for hydrocarbon migration and/or as reservoirscan be evaluated. Fan deltas occurring on the structuralhigh vary in shape and size. Generally they are small,localized, and relatively isolated features occurring atdifferent stratigraphic levels. Poor lateral and verticalconnectivity exist between these features. Also, theirdepositional setting and morphology mean that theyhave little potential for connectivity with sands depos-ited in the deeper areas of the basin; hence, fluid mi-gration pathways into these deposits may be uncertain.Core analysis (Tongklang, 1995) shows that a consid-erable proportion of their lithology comprises con-glomeratic facies due to the proximity of these depositsto the western boundary fault and their inability to

1768 Acoustic Impedance Interpretation, Suphan Buri Basin (Thailand)
Figure 16. Conceptual illus-tration of the rift structure andsedimentation patterns aroundthe study area (modified fromGawthorpe and Colella, 1990).Arrows show directions ofcoarse-grained sediment trans-port. Not to scale.
traverse large distances. This makes for poor reservoirrock. Exploration in this facies may require a drillingstrategy that penetrates individual fans and slumps toovercome the limitations in connectivity.
Rift-floor deltas representing down-plunge, pro-grading axial sedimentation have the potential for con-nectivity with the deeper, producing regions of the ba-sin. Whether these deposits act as conduits or asreservoirs depends on their vertical and lateral connec-tivity, stratigraphic or fault-bound trapping configura-tions, or updip connectivity to structural highs withinand outside the study area.
The northeast-trending sand-filled feeder canyonsmerging into the rift-floor fan deltas form the bestmeans of linking deposits in the deeper part of the ba-sin to those in the central structural high, although theconnectivity of their clean, water-bearing componentsis seen to be impeded in this data set. The channelsands may show considerable heterogeneity in size andposition and offer potential for interconnectivity.These sands may not only form good conduits for hy-drocarbon transport but also be excellent reservoirsthemselves (Tongklang, 1995), providing structuraland stratigraphic traps, and theymay comprise suitableexploration targets within this basin in the future.
CONCLUSIONS
Our study utilized seismic inverse modeling to imagethe distribution of water-filled sands within the unit D
interval of an oil-producing field along the westernmargin of the Suphan Buri basin. Extractions of max-imum impedance values within each subunit imagedtwo styles of sand distribution: axial deposits compris-ing channel sourced deltas and boundary fault–induceddeposits comprising fan deltas and sand-filled feedercanyons. The axial deposits prograded from south tonorth, down plunge into the basin. The boundaryfault–induced deposits showed two sediment path-ways: in the central regions of the study area, sedimenttransport perpendicular to the fault created fan deltason the structural high, whereas feeder canyons trans-ported sediment northeastward downslope to mergewith the rift-floor fan-delta deposits. Rift and bound-ary-fault evolution exerted a considerable influence onthe styles of coarse-grained sedimentation. The sedi-mentation patterns and structural characteristics of thestudy area are similar to publishedmodels investigatingthe links between fault propagation and synkinematicsedimentation. These published models have beenbased on either well-exposed outcrop data or interpre-tation of reflection packages from seismic data. Ourstudy is an example of how lithology distributions alsocan be obtained from seismic data through inversemodeling and can be integrated with core, wire-line,and boundary-fault structural information to providean understanding of synkinematic sedimentation alongwith the geological characteristics of the formation.
Interpretation of the acoustic impedance volumehas imaged the precise locations, shapes, and deposi-tional patterns of sands that were previously only

Ronghe and Surarat 1769
Figure 17. Two patterns of displacements along faults following linkage (from Morley [2002b], reprinted by permission of the AAPGwhose permission is required for further use). (a) Soft fault linkage across a transfer zone. (b) Displacement patterns may be alteredso that the maxima lie at the center of the joined segments. (c) Original displacement patterns remain, and a transverse anticline isformed. Development of the study area followed the latter category.
Figure 18. Summary geologi-cal model of the study area in-corporating the structural ele-ments of the boundary-faultsystem, rift-floor topography,and patterns of coarse-grainedsedimentation. Block arrowsrepresent sedimentation path-ways. Vertical scale is about400 ms.

1770 Acoustic Impedance Interpretation, Suphan Buri Basin (Thailand)
Figure 19. A 3-D display of the connectivity of high-impedance voxels in subunit D6. A single, colored shape represents the 3-Dextent of a connected sand body. The voxels are underlain by the time surface of horizon D6.
inferred to exist in this area. The derived impedancevolume may find further uses: the voxel-based sandconnectivity investigated in our studymay be extendedto calculation of volumetrics, and petrophysical prop-erties may be extracted from the impedance volumeusing linear regression or geostatistical techniques. Thelack of acoustic impedance contrast between shales andhydrocarbon-saturated sands prevents mapping of hy-drocarbon distribution on this full-stack, compres-sional (P) wave seismic data. Clearly, other data typesand/or techniques are required to delineate hydrocar-bon extents. These include comparison with full-stack,shear-wave seismic data, amplitude vs. offset analysis,and comparative interpretation of the derivatives of an-gle-stacked data inversion. Such investigations will as-sist in making informed field development decisions.
REFERENCES CITED
Brown, A. R., 1996, Interpretation of three-dimensional seismicdata, 4th ed.: AAPG Memoir 42, 424 p.
Buayai, S., 2000, Structural geometry and evolution of the majorfault systems in the Suphan Buri basin, Thailand: M.Sc. thesis,University Brunei Darussalam, 130 p.
Burge, D. W., and D. B. Neff, 1998, Well based seismic lithologyinversion for porosity and pay-thickness mapping: The LeadingEdge, v. 17, no. 2, p. 166–171.
Daly, M. C., J. Chorowicz, and D. Fairhead, 1989, Rift basin evo-lution in Africa: the influence of reactivated steep basementshear zone: inversion tectonics: Geological Society Special Pub-lication 44, p. 309–334.
Dawers, N. H., and M. H. Anders, 1995, Displacement-length scal-ing and fault linkage: Journal of Structural Geology, v. 17,p. 607–614.
Dawers, N. H., and J. R. Underhill, 2000, The role of fault interac-tion and linkage in controlling synrift stratigraphic sequences:

Ronghe and Surarat 1771
Late Jurassic, Statfjord East area, northern North Sea: AAPGBulletin, v. 84, p. 45–64.
Duboz, P., Y. Lafet, and D. Mougenot, 1998, Moving to a layeredimpedance cube: advantages of 3D stratigraphic inversion: FirstBreak, v. 16, no. 9, p. 311–318.
Duval, B. C., G. Allen, K. Hadaoui, J. Gouadain, and Y. Kremer,1995, Applications of exploration technologies to reservoir pre-diction and management: field examples of S.E. Asia: Asia Pa-cific Oil and Gas Conference, p. 9–19.
Gawthorpe, R. L., and A. Colella, 1990, Tectonic controls on coarse-grained deltas in rift basins, in A. Colella and D. B. Prior, eds.,Coarse-grained deltas: Blackwell Scientific Publications, SpecialPublication of the International Association of Sedimentologists10, p. 113–127.
Kornsawan, A., and C. K. Morley, 2002, The origin and evolutionof complex transfer zones (graben shifts) in conjugate fault sys-tems around the Funan field, Pattani Basin, Gulf of Thailand:Journal of Structural Geology, v. 24, p. 435–449.
Lambiase, J. J., 1990, A model for tectonic control of lacustrinestratigraphic sequences in continental rift basins, in B. Katz, ed.,Lacustrine exploration: case studies and modern analogues:AAPG Memoir 50, p. 265–276.
Lambiase, J. J., and W. Bosworth, 1995, Structural controls on sed-imentation in continental rifts, in J. J. Lambiase, ed., Hydro-carbon habitat in rift basins: Geological Society Special Publi-cation 80, p. 117–144.
Latimer, R. B., R. Davison, and P. van Riel, 2000, An interpreter’sguide to understanding and working with seismic-derivedacoustic impedance data: The Leading Edge, v. 19, no. 3,p. 242–256.
Lavergne, M., and C. Willm, 1977, Inversion of seismograms andpseudo velocity logs: Geophysical Prospecting, v. 25, no. 2,p. 231–250.
Leeder, M. R., and R. L. Gawthorpe, 1987, Sedimentary models forextensional tilt-block/half-graben basins, in M. P. Coward, J. F.Dewey, and P. L. Hancock, eds., Continental extensional tec-tonics: Geological Society Special Publication 28, p. 139–152.
Lindseth, R. O., 1979, Synthetic sonic logs, a process for strati-graphic interpretation: Geophysics, v. 44, no. 1, p. 3–26.
McConnell, R. B., 1972, Geological development of the rift systemof eastern Africa: Geological Society of America Bulletin, v. 83,p. 2549–2572.
Morley, C. K., 1995, Developments in the structural geology of riftsover the last decade and their impact on hydrocarbon explo-ration, in J. J. Lambiase, ed., Hydrocarbon habitat in rift basins:Geological Society Special Publication 80, p. 1–32.
Morley, C. K., 1999a, How successful are analogue models in ad-dressing the influence of pre existing fabrics on rift structure?:Journal of Structural Geology, v. 4–5, no. 2, p. 1–8.
Morley, C. K., 1999b, Patterns of displacement along large normalfaults: implications for basin evolution and fault propagation,based on examples from East Africa: AAPG Bulletin, v. 83,no. 4, p. 613–634.
Morley, C. K., 1999c, Aspects of transfer zone geometry and evo-lution in East African rifts, in C. K. Morley, ed., Geoscience ofrift systems—evolution of East Africa: AAPG Studies in Ge-ology 44, p. 161–171.
Morley, C. K., 2001, Combined escape tectonics and subductionrollback–back arc extension: a model for the evolution of Ter-tiary rift basins in Thailand, Malaysia and Laos: Journal of theGeological Society, v. 158, p. 461–474.
Morley, C. K., 2002a, A tectonic model for the Tertiary evolutionof strike-slip faults and rift basins in SE Asia: Tectonophysics,v. 347, p. 189–215.
Morley, C. K., 2002b, Evolution of large normal faults: evidencefrom seismic reflection data: AAPG Bulletin, v. 86, p. 961–978.
Morley, C. K., and N. Wonganan, 2000, Normal fault displacementcharacteristics, with particular reference to synthetic transferzones, Mae Moh mine, northern Thailand: Basin Research,v. 12, p. 307–327.
Morley, C. K., R. A. Nelson, N. L. Patton, and S. G. Munn, 1990,Transfer zones in the East African rift systems and their rele-vance to hydrocarbon exploration in rifts: AAPG Bulletin,v. 74, p. 1234–1254.
Morley, C. K., N. Wonganan, N. Sankumarn, T. B. Hoon, A. Alief,and M. Simmons, 2001, Late Oligocene–Recent stress evolu-tion in northern and central Thailand: implications for escapetectonics: Tectonophysics, v. 334, p. 115–150.
O’Leary, J., and G. S. Hill, 1989, Tertiary basin development in thesouthern Central Plains, Thailand: Proceedings of the Interna-tional Symposium on Intermontane Basins, p.254–264.
Peacock, D. C. P., and D. J. Sanderson, 1991, Displacements, seg-ment linkage and relay ramps in normal fault zones: Journal ofStructural Geology, v. 13, p. 721–733.
Pendrel, J. V., and P. van Riel, 1997, Methodology for seismic in-version, a western Canadian reef example: Canadian Society ofExploration Geophysicists Recorder, v. 22, no. 5.
Polachan, S., and N. Sattayarak, 1989, Strike-slip tectonics and thedevelopment of Tertiary basins in Thailand: Proceedings of theInternational Symposium on Intermontane Basins, p. 243–253.
Polachan, P., S. Pradidtan, C. Tongtaow, S. Janmaha, K. Intharawi-jitr, and C. Sangsuwan, 1991, Development of Cenozoic inThailand: Marine and Petroleum Geology, v. 8, p. 33–97.
Ronghe, S., and P. V. Trung, 2000, Acoustic impedance interpreta-tion for hydrocarbon extent, offshore Brunei Darussalam: FirstBreak, v. 18, no. 10, p. 421–429.
Rosendahl, B. R., 1987, Architecture of continental rifts with specialreference to East Africa: Annual Reviews of Earth and PlanetaryScience, v. 15, p. 445–503.
Ruijtenberg, P. A., R. Buchanan, and P. Marke, 1990, Three-dimen-sional data improve reservoir mapping: Journal of PetroleumTechnology, v. 42, no. 4, p. 22–25, 59–61.
Schlische, R. W., 1991, Half-graben basin filling models: new con-straints on continental extensional basin development: BasinResearch, v. 3, p. 123–141.
Schlische, R. W., 1995, Geometry and origin of fault-related foldsin extensional settings: AAPG Bulletin, v. 79, p. 1661–1678.
Schlische, R. W., and M. H. Anders, 1996, Stratigraphic effects andtectonic implications of the growth of normal faults and exten-sional basins, in K. K. Beratan, ed., Reconstructing the historyof Basin and Range extension using sedimentology and stratig-raphy: Geological Society of America Special Publication 303,p. 183–203.
Smith, M., and P. Mosley, 1994, Crustal heterogeneity andbasementinfluence on the development of the Kenya rift, East Africa:Tectonics, v. 12, p. 591–606.
Tongklang, S., 1995, Reservoirs in Suphan Buri basin, southernCen-tral Plain, Thailand: M.Sc. thesis, University Brunei Darussa-lam, 53 p.
Walsh, J. J., and J. Watterson, 1988, Analysis of the relationshipbetween displacements and dimensions of faults: Journal ofStructural Geology, v. 10, p. 239–247.
Watcharanantakul, R, and C. K. Morley, 2000, Syn-rift and post-riftmodeling of the Pattani Basin, Thailand: evidence for a ramp-flat detachment: Marine and PetroleumGeology, v. 17, p. 937–958.