acoustic emission monitoring of bridge structures in the ... · acoustic emission monitoring of...
TRANSCRIPT

J. Acoustic Emission, 26 (2008) 172 © 2008 Acoustic Emission Group
ACOUSTIC EMISSION MONITORING OF BRIDGE STRUCTURES IN THE FIELD AND LABORATORY
RHYS PULLIN, KAREN M. HOLFORD, ROBERT J. LARK and MARK J. EATON
Cardiff School of Engineering, The Parade, Newport Road, Cardiff, CF24 3AA, UK
Keywords: Bridge inspection, laboratory and field investigations
Abstract
Cardiff University, in association with Physical Acoustics Limited, has been actively promot-ing the use of acoustic emission (AE) to monitor bridge structures as part of any bridge mainte-nance procedure since the early 1990’s, both in concrete and steel bridge structures. Scepticism of the capabilities of AE by bridge authorities has led to a large number of laboratory research projects being completed to demonstrate and validate the technique and support field results.
This paper presents the findings of two field investigations with extensive laboratory support.
One is a box-girder bridge structure where a fatigue fracture was located on an internal dia-phragm both on a real structure and a scale model and of the second is a steel-reinforced concrete structure where regions of possible concrete micro-fracture around steel reinforcing bars was de-tected. Both investigations demonstrate the capabilities of AE as a diagnostic tool as part of any bridge maintenance programme. Introduction
Bridge structures throughout the UK are being used past their life expectancy and well be-yond their original design loads. Furthermore, there is an increasing monetary pressure on bridge authorities to extend the life whilst ensuring public safety. A large aspect of increasing life ex-pectancy is completed by periodic visual inspection and based on findings appropriate repairs or maintenance can be completed. However, visual inspection can be exceedingly difficult; in the case of steel box girder bridges special breathing apparatus and lighting equipment is required and in steel-reinforced concrete structures internal corrosion cannot, in many examples, be visu-alised externally.
AE monitoring offers a real and practical alternative to visual inspection with the monitoring
of steel box-girder structures becoming increasingly accepted [1 - 4] but scepticism still exists across a large number of bridge authorities even though the UK Highways Agency has produced an advice note on testing structures with AE [5].
The case of steel-reinforced concrete structures is even more problematic. Fractures identi-
fied in box girders can be verified through other NDT techniques but verification of fractures in steel reinforcement is more complex and can require the removal of structural concrete, which naturally is undesirable. Examples of monitoring steel-reinforced concrete structures can be found in [6 - 9].
One method of promoting AE and demonstrating its capabilities is through laboratory testing.
Verification of results is far less problematic and a greater level of confidence in field results can be gained. This paper presents the findings of two field investigations, one on a steel box girder and the other on a steel-reinforced concrete bridge - both tests had extensive laboratory support.

173
Experimental Procedure Box-Girder Bridge: Cardiff University was appointed to monitor a box-girder bridge in South Wales. It has a total span of approximately 300 m and is of composite construction, with a con-crete road deck supported by four steel box-girder beams. Each box-girder is approximately 1.2 m square and has a maximum span of 31 m. Welded inside the girder at various positions are 10-mm thick steel diaphragms of two types. One type provides cross sectional stiffness and main-tains torsional rigidity, while the second type also transfers the shear forces carried by the girders through to the support bearings; it is the former that this study focuses on.
Initially a global approach to AE monitoring of the bridge was completed and several dia-phragms emitting high activity were identified. A more detailed description of the global ap-proach can be found in [2]; subsequently a local approach of the most emissive diaphragms was then completed [3].
Four PAC WDI sensors were mounted around the outside perimeter of the diaphragm (Fig.
1) so that the sensor face was aligned with the internal edge of the diaphragm. The painted sur-face was lightly sanded to remove any peaks. Sensors were mounted into position using mag-netic clamps. Grease was used as an acoustic couplant. The installed sensitivity of the system was then verified using the H-N source. AE feature data was recorded for a period of 90 minutes under service loading at an acquisition threshold of 30 dB.
Fig. 1 Box Girder beam showing sensor attachment and internal diaphragm.
Steel-Reinforced Concrete Bridges : Cardiff University was given the opportunity to demonstrate the AE technique on a steel-reinforced concrete hinge joints (Fig. 2). Concrete hinge joints are present in over 100 bridges in England and a further 12 over-bridges, each containing two hinge joints, in Wales. They were introduced into bridge decks as a means of simplifying the design, and standardising details on bridges having a range of span and functional requirements. It is thought that the hinge joints transfer shear and accommodate small angular movements but re-strict longitudinal movement [10]. It was also assumed the hinges were provided to enable the bridges to cope with possible differential settlement. The disadvantages with hinged joints are that they are not easily accessible for inspection or maintenance due to their form, and their lo-cation over or under live traffic lanes.

174
Previous attempts to investigate the deterioration of hinge joints by visual inspection, which involves the removal of structural concrete around the joint to expose the reinforcement bars, have noted particular defects; the majority have cracks running through the throat and a loss of waterproofing. Waterproofing failure can lead to chloride rich seepage through the joint that can cause reinforcement bar corrosion leading to eventual failure by yielding.
The joint monitored was of joint was of slab construction. The bridge is an over-bridge on the
M4 in South Wales. The exact positioning of the internal reinforcement bars across the joint was unknown; however, they were believed to be at 308-mm centres. Grease was used as an acoustic couplant. An H-N source was used as a source to assess the sensitivity of the sensors.
Fig. 2: Section of a typical hinge-joint assembly, sensor attachment and installed system.
Monitoring was completed for a period of 12hours (7am-7pm) for three days. Heavy vehicles crossing the joint were logged using time marks for a period of five hours during the initial day of monitoring. AE feature data was recorded at a threshold of 35 dB.
175
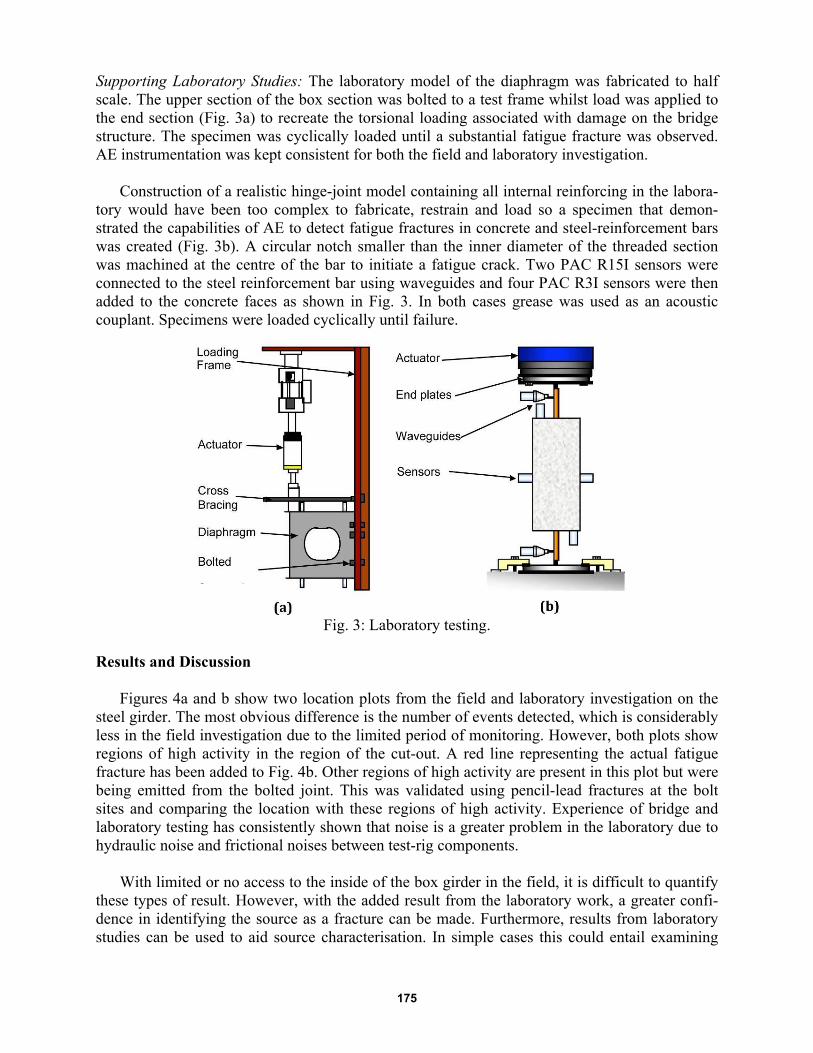
Supporting Laboratory Studies: The laboratory model of the diaphragm was fabricated to half scale. The upper section of the box section was bolted to a test frame whilst load was applied to the end section (Fig. 3a) to recreate the torsional loading associated with damage on the bridge structure. The specimen was cyclically loaded until a substantial fatigue fracture was observed. AE instrumentation was kept consistent for both the field and laboratory investigation.
Construction of a realistic hinge-joint model containing all internal reinforcing in the labora-
tory would have been too complex to fabricate, restrain and load so a specimen that demon-strated the capabilities of AE to detect fatigue fractures in concrete and steel-reinforcement bars was created (Fig. 3b). A circular notch smaller than the inner diameter of the threaded section was machined at the centre of the bar to initiate a fatigue crack. Two PAC R15I sensors were connected to the steel reinforcement bar using waveguides and four PAC R3I sensors were then added to the concrete faces as shown in Fig. 3. In both cases grease was used as an acoustic couplant. Specimens were loaded cyclically until failure.
Fig. 3: Laboratory testing.
Results and Discussion
Figures 4a and b show two location plots from the field and laboratory investigation on the steel girder. The most obvious difference is the number of events detected, which is considerably less in the field investigation due to the limited period of monitoring. However, both plots show regions of high activity in the region of the cut-out. A red line representing the actual fatigue fracture has been added to Fig. 4b. Other regions of high activity are present in this plot but were being emitted from the bolted joint. This was validated using pencil-lead fractures at the bolt sites and comparing the location with these regions of high activity. Experience of bridge and laboratory testing has consistently shown that noise is a greater problem in the laboratory due to hydraulic noise and frictional noises between test-rig components.
With limited or no access to the inside of the box girder in the field, it is difficult to quantify
these types of result. However, with the added result from the laboratory work, a greater confi-dence in identifying the source as a fracture can be made. Furthermore, results from laboratory studies can be used to aid source characterisation. In simple cases this could entail examining

176
(a) field investigation (b) laboratory study
Fig. 4: Comparison of field and laboratory results from box-girder testing.
amplitude and energy trends, sometimes a more advanced technique such as neural networks may be appropriate.
The case of box girders is relatively simple, with plate geometries and non-complex propaga-
tion paths, a greater level of complexity occurs in steel-reinforced concrete bridge structures. Varying wave speeds, due to multiple materials, complex propagation paths due to aggregate and multiple damage mechanisms such as steel fatigue fracture, concrete fracture and corrosion make monitoring reinforced concrete structures difficult and the collected data difficult to interpret.
Table 1 presents the number of hits within specific amplitude ranges from each day of moni-
toring the slab hinge joint. The results indicate that there is not a significant difference between the number of hits on each day of monitoring suggesting that at this site one day of monitoring is sufficient to provide the necessary data.
Table 1: Summary of monitoring results.
Amplitude of Hits (dB)
No. of Hits Day 1 (x 103)
No. of Hits Day 2 (x 103)
No. of Hits Day 3 (x 103)
35-45 1500 1500 1200
45-55 226 187 152 55-65 58.8 40.2 37.3 65-75 12.9 8.4 7.3 75-85 2.09 1.28 1.09 85-100 0.23 0.16 0.15
Figure 5 shows the period of logging heavy vehicles, the highest energy emissions from the
joint can be associated with heavy vehicles crossing the joint, however not all heavy vehicles produced large energy emissions. During monitoring it was visually observed that all vehicles caused some emissions, these however may be associated with the normal stress loading of the joint and that vehicles travelling at higher speeds across the joint produced greater energy emis-sions.

177
Fig. 5: Activity of joint with logged vehicles.
Figure 6 shows a planar location plot from three days of monitoring the steel-reinforced con-
crete hinge joint. The numbered circles represent sensor positions whilst a dashed line shows the hinge position. The plot shows several bands of emission located to the south of the joint and in-dicate regions of possible damage, likely to be centred around reinforcing bars. These bands oc-cur at larger intervals than the 308-mm spacing of the bars. This implies that the AE is detecting sources at some bars but not every bar.
Fig. 6: Field testing location results.
After the test data was collected, three new methods of data interpretation were developed. A method utilising the kernel probability density estimation (KPDE) function [11] was created that enabled not only the density of signals, but the density of the energy of the signals to be visu-alised. This is currently not possible using commercial software.
Another technique was developed that expanded on the commercial technique of location cluster analysis and employed k-means analysis [12] to aid source characterisation, a summary of which is shown in Fig. 7.
The purpose of source location clustering is to automatically identify and associate groups of
events, based on user controlled spatial criteria and a number of signal threshold. In commercial software, clusters can be organised in terms of their total energy, but there is a limit imposed on the total number of clusters (100), which was removed in the developed script. A k-means

178
Fig. 7: Flow chart of designed script used to further analyse the recorded data.
analysis of the feature data from the location clusters can then be completed. A k-means analysis assigns a set of data points to k-centres, or means. The algorithm is popular due to its fast con-vergence and simplicity. The algorithm is initiated in a random state: each data point is assigned as a member of one of the k-groups. The set of centres is calculated by taking the mean of the members of each group, then each data point is re-assigned to a new group according to its near-est center. The process is repeated until no points change groups. The algorithm works excep-tionally well on well-spaced groups of Gaussian-distributed data points. In order to make the AE feature data resemble this, the data is normalised, such as to have unit variance in each feature. The variance of each group in the feature space, compared with the entire data set can then be calculated. In theory any regions of high activity that are identified via source location clustering and have very similar signals, as identified via the level of variance in the feature space, are likely to be from a repetitive damage mechanism such as fatigue fracture or concrete microcrack-ing.
The resulting plots of the KPDE analysis are presented in Figs. 8a and b. The region of high
activity at approximately (5.5 m, 0.6 m) is clearly visible in Fig. 8a, whilst the remaining bands that are associated with the internal reinforcing bar are clearly visible. However of more interest is the region of densely populated energy in Fig. 8b, which using the commercial software could not be visualised. This is a region of low density in terms of events but high energy and it is very close to the centre line of the hinge section. This suggests that this region is made up of a small number of high-energy events that could be attributed to concrete fractures. Fatigue fractures of the reinforcing bar would be likely to occur more frequently and with greater consistency in

179
energy release under normal traffic loading. Therefore the region is attributed to concrete frac-tures near to the throat of the hinge.
Fig. 8: Kernel probability density estimation plot (a) hits (b) energy.
To further analyse the regions of high event density on the south side of the joint in Fig. 6, feature data, including location, from channels 3, 4, 5 and 6 was processed by the developed k-means analysis based script (Fig. 9). A source cluster area, based on a circle with diameter of 30 mm, and threshold of 30 events, was used to analyse the data. A graphical representation of the script results is shown in Fig. 9, together with a key to the level of variance of the feature data. Three regions of grouped, low variance clusters are clearly visible and are in close proximity to the joint. Although the definite position of the reinforcing bars is unknown the distance between the bars is believed to be 308 mm, and the possible positions of the bars based on the lowest variance clusters are superimposed. It can be seen that the other grouped regions would also ap-pear to be in close proximity to reinforcing bars, whilst several bars appear to have no active damage in their vicinity.
Feature data of the cluster with the highest number of events (242) in the low variance group, which is centred on a reinforcing bar, were compared with that of regions at a similar distance from the same sensor, that were not associated with a reinforcing bar position; this revealed little difference in features. This suggests that the detected signals are associated with damage in the concrete structure rather than the steel reinforcing bar, which would have distinctly different fea-tures. This suggests that the regions detected are due to microcracking of the concrete.
However, further evidence was needed to show that AE was capable of detecting damage in these complex structures, and thus a laboratory model was fabricated and tested. Figures 10a, b and c show the results of the laboratory testing of the steel-reinforced concrete specimen. Under the initial loading, a small amount of concrete fracture occurred around the region of the rebar notch, and these fractures increased through the duration of its life and further emissions are caused by localised crushing of loose aggregate. This is evident in Fig. 10a, which shows all lo-cated signals using the surface-mounted concrete sensors from the duration of the whole test.

180
Fig. 9: Graphical display of results from k-means analysis based script.
(a) (b) (c)
Fig. 10: Laboratory testing of concrete encased steel reinforcement bar.
Figure 10b shows the location of signals from the final 7000 cycles. It was known, based on load history, that this is when the rebar started to fatigue. The plot clearly shows that AE can de-tect and locate steel fatigue fractures from surface-mounted sensors, again providing confidence to bridge authorities of the capability of AE. Figure 6c shows a linear location plot against time using the sensors attached to the waveguides. The plot clearly demonstrates that the sensors de-tected the concrete fractures early in the investigation and detected the steel fatigue fractures at the end of the investigation. Furthermore, results of the laboratory investigations could be used to help identify fracture sources or train neural networks.
As discussed previously, monitoring of steel box-girder bridges by AE is less complex than
monitoring concrete reinforced joints. Current techniques for locating and identifying damage in box girders are sufficient. However, further validation of field results, using visual inspection or

181
other NDT techniques, is required to convince bridge authorities of the capabilities of AE. It is more difficult to promote the use of AE in steel-reinforced concrete structures. AE has been used previously, but validation of results is often impossible as other NDT techniques cannot be used and visual inspection requires the removal of structural concrete, which is undesirable as it can cause extensive damage to the structure. Conclusions
Results presented in this paper have demonstrated the capabilities of AE to detect damage in bridge structures. Results have been complemented by laboratory testing that has been required to support and demonstrate findings to bridge authorities.
References [1] D. C. Carter, R. Pullin and K. M. Holford, Acoustic Emission Studies of a Steel Box Girder Bridge, 23rd European Conference on Acoustic Emission Testing, (1998) pp. 225-229. [2] K. M. Holford, D. C. Carter, R. Pullin and A. W. Davies, Bridge Integrity Assessment by Acoustic Emission – Global Monitoring, 2nd International Conference on Identification in Engi-neering Systems, (1999) pp. 392-400. [3] R. Pullin, D. C. Carter, K. M. Holford and A. W. Davies, Bridge Integrity Assessment by Acoustic Emission – Local Monitoring, 2nd International Conference on Identification in Engi-neering Systems, (1999) pp. 400-405 [4] A. W. Davies, K. M. Holford, R. Pullin, J. Watson., P. T. Cole and S. N. Gautney, Acoustic emission monitoring trial, Report for The Highways Agency: Maintenance Agency Area 12: Midlands Links Motorway Viaducts, Cardiff University and Physical Acoustics Ltd. (1999). [5] Highways Agency Advice Note on NDT (BA86) (2005). [6] J. R. Watson, S. Yuyama, R. Pullin and M. Ing, Acoustic Emission Monitoring Applications for Civil Structures, Surrey University’s International Bridge Management Conference (2005). [7] M. Ohtsu, A Review of AE in Civil Engineering with Emphasis on Concrete, Journal of Acoustic Emission, 8, No. 4, (1989) 93-98. [8] M. Ohtsu, The History and Development of Acoustic Emission in Concrete Engineering, Magazine of Concrete Research, 48, No. 177 (1996) 321-330. [9] M. J. Ing, R. Lyons and S. A. Austin, Risk-Based Investigation of Steel Reinforcement Cor-rosion Using the AeCorr Technique, Proceedings of 3rd International Conference on Emerging Technologies in Non Destructive Testing, Thessaloniki, Greece (2003), pp. 410-418. [10] J. R. Watson, P. T. Cole, I. Kennedy-Reid and J. Halliday, Condition Assessment of Con-crete Half Joints, First International Conference on Bridge Maintenance, Safety and Manage-ment, Barcelona, July 14-17, 2002. [11] C. B. Wilson, Assessment of the reinforced concrete hinges on five M6 overbridges in Staf-fordshire, Proceedings Institution Civil Engineers, 110, (1995) 4-10. [12] B. W. Silverman and B. S. Silverman, Density Estimation for Statistics and Data Analysis, CRC Press (1986). [13] C. M. Bishop, Pattern Recognition and Machine Learning, Springer, ISBN-10: 0387310738, (2006).