achieving success together · european and baltic markets. more than 12,000 pharmacy employees have...
TRANSCRIPT

Annual Report 2014/15
Ann
ual R
epor
t 201
4/15
Achieving success together
PHOENIX groupPhoenix Annual Report 2014/15

PHOENIX group in figures
Key figures of the PHOENIX group 2010/11 2011/12 2012/13 2013/14 7) 2014/15
Revenue in EUR k 21,737,772 21,660,649 21,218,687 21,791,268 22,567,998
Total operating performance 1) in EUR k 25,062,613 25,479,749 25,251,336 25,916,290 27,278,243
Total income 2) in EUR k 2,078,580 2,249,687 2,319,147 2,217,379 2,277,295
Profit before tax 3) in EUR k 270,060 3) 294,775 3) 230,723 3) 143,092 361,278
Adjusted profit before tax 4) in EUR k 324,038 294,775 329,156 253,094 292,742
Equity in EUR k 1,772,409 5) 1,935,623 2,103,800 2,161,841 2,481,491
Equity ratio in % 23.4 26.1 28.7 29.4 32.1
Net debt in EUR k 2,176,588 1,855,743 1,611,518 1,330,855 1,068,749
Company rating (Standard & Poor’s) B+ BB− BB BB BB
Employees (total) 27,873 6) 29,038 6) 28,698 28,555 28,922
Employees (full-time) 23,206 23,850 23,932 23,850 24,153
1) Total operating performance = revenue + handled volume (handling for service charge).2) Total income = gross income + other operating income (previous years 2010/11 up to 2012/13 adjusted due to changes in reporting).3) Previous years adjusted due to the application of IAS 19R.4) Adjusted for impairment losses on goodwill, effects resulting from the sale of financial assets, one-off effects in connection with the financial
restructuring, one-off effects related to the refinancing measures, expenditures associated with the PHOENIX FORWARD optimisation programme, as well as changes in pension schemes 2014/15.
5) Previous years adjusted due to the application of IAS 19R and other reclassifications.6) Adjusted due to the change in reporting standards.7) Adjusted due to the first-time application of IFRS 11.
> Increase in total operating performance compared with 2013/14 of
5.3 % > Improvement in profi t for the period compared with 2013/14 of
EUR 188 million> Increase in equity ratio to
32.1 %> Reduction in net debt compared with 2013/14 by
EUR 262.1 million> Net debt/adjusted EBITDA ratio stable under 3.0 with
1.88
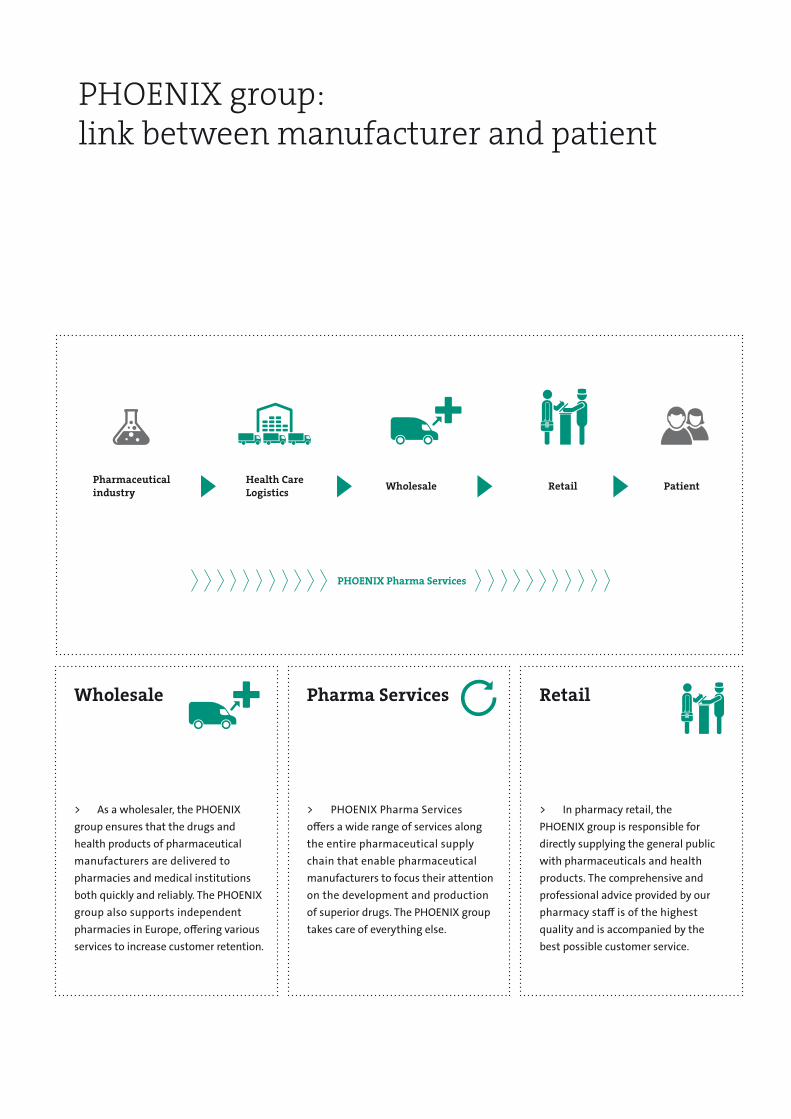
PHOENIX group: link between manufacturer and patient
PHOENIX Pharma Services
Health Care Logistics
Pharmaceutical industry Wholesale Retail Patient
Pharma Services
> PHOENIX Pharma Services off ers a wide range of services along the entire pharmaceutical supply chain that enable pharmaceutical manufacturers to focus their attention on the development and production of superior drugs. The PHOENIX group takes care of everything else.
> In pharmacy retail, the PHOENIX group is responsible for directly supplying the general public with pharmaceuticals and health products. The comprehensive and professional advice provided by our pharmacy staff is of the highest quality and is accompanied by the best possible customer service.
RetailWholesale
> As a wholesaler, the PHOENIX group ensures that the drugs and health products of pharmaceutical manufacturers are delivered to pharmacies and medical institutions both quickly and reliably. The PHOENIX group also supports independent pharmacies in Europe, off ering various services to increase customer retention.
> The PHOENIX group is a leading pharmaceutical trader in Europe, reliably supplying people with drugs and medical products every day. The PHOENIX group originated from the merger of five regionally active pharmaceutical wholesale businesses in Germany in 1994. Today, the company offers unique geographical coverage throughout Europe, making a vital contribution to comprehensive healthcare with around 29,000 employees. The PHOENIX group’s vision is to be the best integrated healthcare provider – wherever it is active. This means that each customer group is provided with the best possible services and products along the entire pharmaceutical supply chain.
> In pharmaceutical wholesale, the PHOENIX group is active with 153 distribution centres in 25 European countries and supplies pharmacies and medical institutions with drugs and other health products. Numerous other products and services for pharmacy customers complete the portfolio – from support with patient advice to modern goods management systems to cooperation programmes.
> In pharmacy retail, the PHOENIX group operates more than 1,600 of its own pharmacies in 12 countries – of which around 800 operate under the corporate brand BENU. In addition to Norway, the United Kingdom, the Netherlands, and Switzerland, the company is also represented in the Eastern European and Baltic markets. More than 12,000 pharmacy employees have 113 million customer contacts each year. They dispense around 250 million drug packages to patients and advise them on issues concerning pharmaceuticals and general health.
> Pharma Services provides services across the whole supply chain. The “All-in-One” concept stands for a comprehensive range of services that benefits drug manufacturers, pharmacies, and patients. We take on the entire distribution process for the pharmaceutical industry as desired, which includes storage, transportation, and goods management.
We deliver health. Each and every day. Across Europe.
1
Leadership and responsibility 2 Letter from the Chief Executive Offi cer 2 Executive Board of the PHOENIX group 4 Report of the Advisory Board 6 Corporate Mission Statement
of the PHOENIX group 8 Highlights of the fi scal year 2014/15 10 Sustainability 12 PHOENIX group in the capital market 14
Achieving success together 16 Group management report 32 Background of the Group 33 Business and economic environment 37 Subsequent events 46 Risks and opportunities 47 Forecast 50
Contents
Consolidated fi nancial statements 51 Consolidated income statement 52 Consolidated statement of
comprehensive income 53 Consolidated statement of fi nancial position 54 Consolidated statement of cash fl ows 56 Consolidated statement of changes in equity 58 Notes to the consolidated fi nancial statements 60 Audit opinion 120
Further information 121 Foreign shareholdings and domestic subsidiaries 122 Financial calendar 2015 124 Imprint
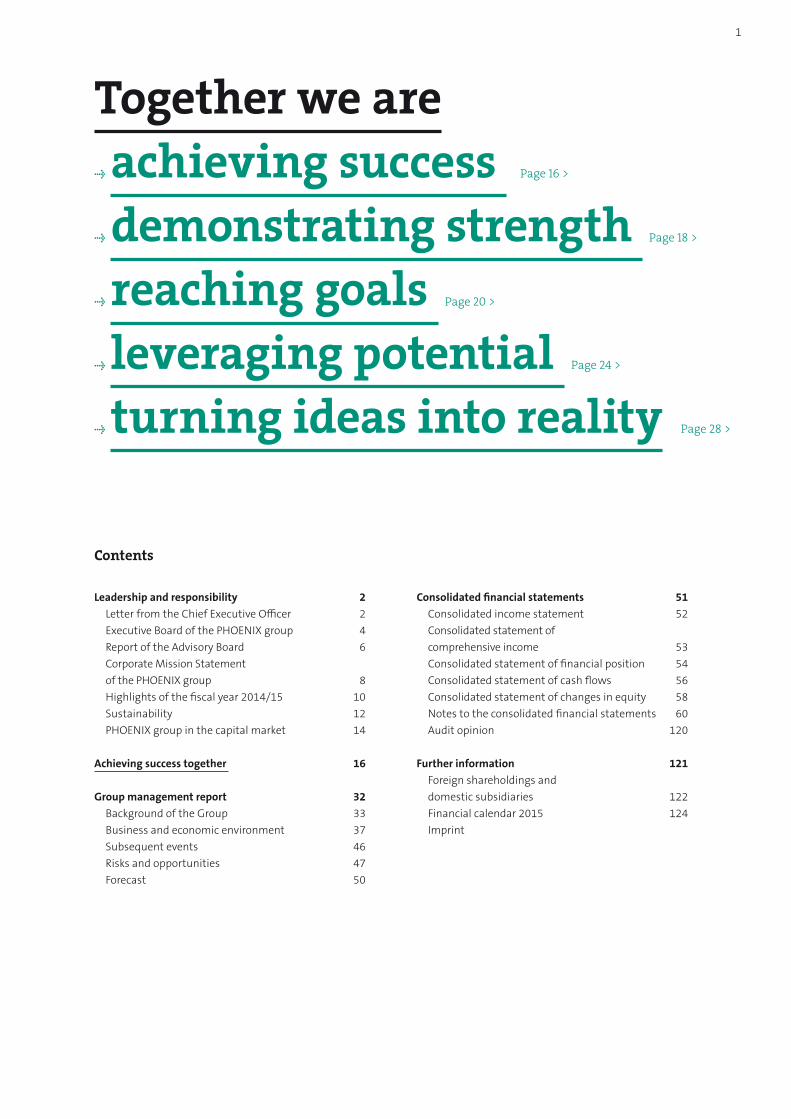
Together we are• achieving success • demonstrating strength • reaching goals • leveraging potential • turning ideas into reality
Page 20 >
Page 18 >
Page 16 >
Page 24 >
Page 28 >
2
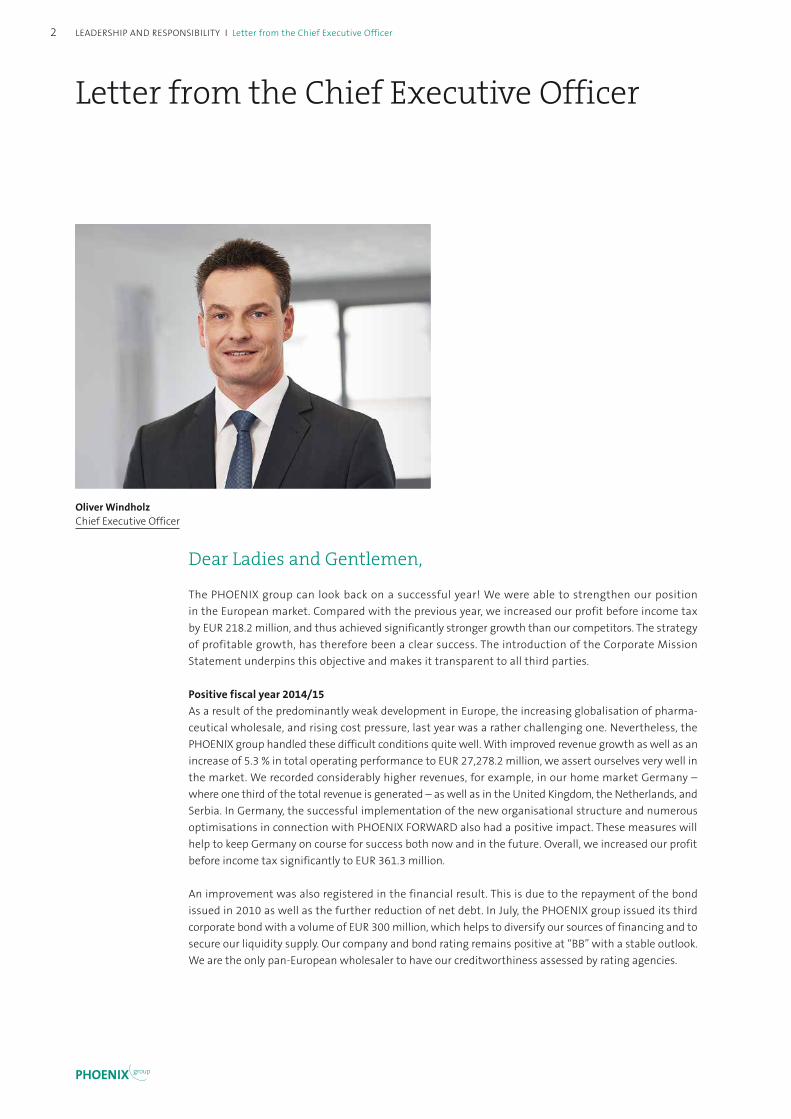
Letter from the Chief Executive Officer
Oliver Windholz Chief Executive Officer
Dear Ladies and Gentlemen,
The PHOENIX group can look back on a successful year! We were able to strengthen our position in the European market. Compared with the previous year, we increased our profit before income tax by EUR 218.2 million, and thus achieved significantly stronger growth than our competitors. The strategy of profitable growth, has therefore been a clear success. The introduction of the Corporate Mission Statement underpins this objective and makes it transparent to all third parties.
Positive fiscal year 2014/15As a result of the predominantly weak development in Europe, the increasing globalisation of pharma-ceutical wholesale, and rising cost pressure, last year was a rather challenging one. Nevertheless, the PHOENIX group handled these difficult conditions quite well. With improved revenue growth as well as an increase of 5.3 % in total operating performance to EUR 27,278.2 million, we assert ourselves very well in the market. We recorded considerably higher revenues, for example, in our home market Germany – where one third of the total revenue is generated – as well as in the United Kingdom, the Netherlands, and Serbia. In Germany, the successful implementation of the new organisational structure and numerous optimisations in connection with PHOENIX FORWARD also had a positive impact. These measures will help to keep Germany on course for success both now and in the future. Overall, we increased our profit before income tax significantly to EUR 361.3 million.
An improvement was also registered in the financial result. This is due to the repayment of the bond issued in 2010 as well as the further reduction of net debt. In July, the PHOENIX group issued its third corporate bond with a volume of EUR 300 million, which helps to diversify our sources of financing and to secure our liquidity supply. Our company and bond rating remains positive at “BB” with a stable outlook. We are the only pan-European wholesaler to have our creditworthiness assessed by rating agencies.
LEADERSHIP AND RESPONSIBILITY | Letter from the Chief Executive Officer
PHOENIX group
Leadership and responsibility
Letter from the Chief Executive Officer
Clear targets on the road to successThe Executive Board will continue to pursue a clear strategy of growth and cost efficiency in order to create value for us and for our customers in the long term. And we are in a very good position to make good on this promise, with our unique geographic coverage, our steadily growing pharmacy network, the ongoing expansion of our services, and continuous enhancement of our logistics services, which – alongside our highly qualified, motivated, and loyal employees – are the key to our success. We face the challenges with vigour and commitment!
Think together global – act local!Measures to promote the exchange of best practice between countries and group-wide cooperation also play a significant role. The implementation of our European initiatives in the areas of indirect purchasing and warehouse excellence in line with PHOENIX FORWARD is showing impressive optimisation results. We support efficient communication throughout the group by providing suitable online platforms, such as the corporate intranet, the Sales & Marketing Excellence platform as well as the Warehouse Excellence Portal. This produces synergy effects that additionally benefit our customers. At the same time, we keep an eye on the local market, adapting our range in a demand-specific and proactive way.
Our vision: the best integrated healthcare providerWe want to be the best integrated healthcare provider – wherever we are. With this goal in mind, we focus on offering our customers the right services and products across the entire supply chain. We network our business units Wholesale and Retail, as well as Pharma Services and act as a link between pharmaceutical manufacturer and patient.
To strengthen and expand our market position, we strive for organic growth and targeted acquisitions. In doing so, we benefit from our stable shareholder structure, which supports sustainable expansion. In the Netherlands, the Czech Republic, and Slovakia, the next takeovers in wholesale and retail are imminent – subject to the approval of the relevant competition authorities. Furthermore, we are continuing our constructive cooperation with pharmaceutical manufacturers with the “All-in-One” concept, providing individual and high-quality solutions. For example, we will offer a further optimised infrastructure for the reliable supply of pharmaceuticals in Central and Eastern Europe from 2016.
Transparent Corporate Mission StatementOur Corporate Mission Statement, which makes our corporate philosophy, vision, mission, strategy, and values transparent, provides the framework within which we act. As a family business, we are independent in our decision making and pursue a long-term strategy. In the past year, we have put ourselves in a good position and achieved a great deal, allowing us to look confidently ahead to the coming fiscal year. At this point, I would like to offer my heartfelt thanks to all our employees for their excellent work, and to our customers for their partnership!
Mannheim, May 2015
Yours
Oliver Windholz Chief Executive Officer
3Letter from the Chief Executive Officer I LEADERSHIP AND RESPONSIBILITY

“ Together with our employees, we have been a reliable partner to our customers for over 20 years. We want to continue shaping the future together and be the best integrated healthcare provider – wherever we are.”
Executive Board of the PHOENIX group
4 LEADERSHIP AND RESPONSIBILITY | Executive Board of the PHOENIX group
PHOENIX group

Oliver Windholz Chief Executive Officer
“ We want to be the best integrated healthcare provider. In order to achieve this goal, the Corporate Mission Statement serves as the supreme guideline for our day-to-day work.”
Helmut Fischer Finance
“ To strengthen and further expand our market position, we aim for targeted acquisitions. Thereby, the quality of the cooperation between the units involved is crucial for success.”
Stefan Herfeld Retail
“ We enhance the range of diverse services in our pharmacies on an ongoing basis. Our pharmacies are thus making an important contribution to healthcare.”
Frank Große-Natrop Operations/Logistics
“ Our qualified and motivated employees guarantee outstanding performance along the entire pharmaceutical supply chain.”
5Executive Board of the PHOENIX group I LEADERSHIP AND RESPONSIBILITY

Report of the Advisory Board
Dr. Bernd ScheifeleChairman of the Advisory Board, Chairman of the Managing Board of HeidelbergCement AG, Heidelberg, Germany
Dr. Wolfram FreudenbergFormer Chairman of the Board of Partners of Freudenberg & Co. KG, Weinheim, Germany
Dr. Peter MaagPresident & CEO, CareDx, Inc., California, USA
Ludwig MerckleCompany Shareholder,Director of Merckle Service GmbH, Ulm, Germany
Dr. Lorenz NägerMember of the Managing Board of HeidelbergCement AG, Heidelberg, Germany
Members of the Advisory Board
Dr. Bernd Scheifele Chairman of the Advisory Board
Dear Ladies and Gentlemen,
Once again, the PHOENIX group performed succesfully in the market during this fiscal year. The long-term corporate strategy, with its focus on the core businesses, was consistently pursued. Alongside the continuous improvement of the financial structure, the stable shareholder structure – with the Merckle family as the sole owner – provides a great deal of planning security. Furthermore, the value-oriented management approach of the PHOENIX group supports sustainable growth. Through the PHOENIX FORWARD programme, which was launched in 2013/14 and is already showing positive effects, the structures in the PHOENIX group are being updated to allow the group to further strengthen its leading position in Europe. The continuation of this strategy and PHOENIX FORWARD is endorsed 100 per cent by the Advisory Board.
Areas of activity of the Advisory BoardThe Advisory Board’s tasks include the appointment of the Executive Board as well as the discussion of strategic guidelines with the management. The Advisory Board assists the Executive Board of the PHOENIX group in an advi-sory capacity with decisions that extend beyond the usual business activities in terms of their volume, duration, or significance. Its remit also includes the selection of the auditor and the approval of the group budget. Throughout the fiscal year, the Advisory Board was informed regularly – both verbally and in writing – about the business activities. It held discussions with the management regarding matters of financial, investment, and personnel planning, as well as profitability. Potential deviations in business performance were addressed in the same way. The Advisory Board was also involved in relevant personnel decisions and changes. In addition to the regular exchange of information, a total of four scheduled meetings with the Executive Board took place in the fiscal year 2014/15.
Focal points of activity In the past fiscal year, the Advisory Board was informed about all major developments and involved in all crucial decisions. This included transactions such as the acquisitions in the retail segment in Slovakia and Serbia, or the acquisition of Mediq in the Netherlands, which represents the biggest acquisition in the history of the PHOENIX group. In addition, the response to current market situations and the reorganisation – especially in Germany and France – were discussed with the Advisory Board.
6 LEADERSHIP AND RESPONSIBILITY | Report of the Advisory Board
PHOENIX group

In the past fiscal year, the following developments, in particular, were monitored by and discussed with the Advisory Board: • In July 2014, the PHOENIX group placed its third bond. This strengthened its access to the capital market and
further optimised the capital structure.• To improve its portfolio in the Wholesale business, the group invested in logistics, technology, and quality
management. • Services for pharmacy customers in numerous countries were extended. In the Retail business, the three brands
BENU, Apotek 1, and rowlands pharmacy were progressively expanded. • In Pharma Services, the PHOENIX group is continuously developing its services across the entire supply chain and
widening them out in accordance with the needs of its customers. • Overall, the outlook is very positive, with the purchase of the Dutch Mediq pharmacies and the Slovakian
pharmacy chain SUNPHARMA – both acquisitions being subject to the approval of the relevant competition authorities. In Wholesale and Retail, the signs point towards continued growth.
• The PHOENIX FORWARD programme, which was introduced in the fiscal year 2013/14, will be continued until 2015/16 as planned and closely followed by the Advisory Board.
The Advisory Board has monitored the risk management on an ongoing basis and has ensured that the management has done everything possible to identify any critical events at an early stage and to introduce possible countermeasures to ensure that neither the operating results nor the company itself are jeopardised.
Audit and approval of the annual financial statementsErnst & Young GmbH, Wirtschaftsprüfungsgesellschaft, Stuttgart, was once again awarded the audit assignment for 2014/15 by the Advisory Board. The focal points of the audit were established during a joint discussion. The Executive Board presented the provisional, unaudited key figures for the fiscal year and the status of preparations for the final report to the Advisory Board in advance. Following the audit of the annual financial statements and the management report of the company and the group by the auditor, the documents were certified without qualification. The Advisory Board received all accounting records and discussed them in detail in the presence of the auditor. No objections were raised to the results of the audit. The Advisory Board therefore approved the annual financial statements and the consolidated financial statements. The Advisory Board consented to the management’s proposal regarding the appropriation of the retained earnings.
Establishing the Corporate Mission StatementAll members of the Advisory Board welcome and support the group-wide establishment of the Corporate Mission Statement of the PHOENIX group, which is based on the creation of value through sustainable growth. I am very confident that we will continue to succeed in reaching this aim in the future.
Trusting and cooperative partnershipThe Advisory Board and the Executive Board have a trusting and cooperative relationship that is also reflected in day-to-day work. Together we strive to reach the defined objectives in the short, medium, and long-term.
The PHOENIX group will continue searching for the best solution for its customers and exploiting the existing potential for optimisation. By doing so, we aim to secure a leading position in the market both now and in the future as well as to strengthen that position sustainably. With our competent and committed employees and proactive management, we can look forward to a successful future.
On behalf of the Advisory Board,Mannheim, May 2015
Dr. Bernd ScheifeleChairman of the Advisory Board
7Report of the Advisory Board I LEADERSHIP AND RESPONSIBILITY
Our vision
Our vision is to be the best integrated healthcare provider – wherever we are. For us, this means providing each customer group with the best possible services and products along the entire pharmaceutical supply chain. Pharmaceutical manufacturers, pharmacies, doctors, hospitals, health insurance funds, and patients alike can benefit from our comprehensive service offering. We achieve this by focusing on integrated structures between our Wholesale, Retail, and Pharma Services segments. We are the optimal link between pharmaceutical manufacturer and patient. Together with our employees, we shape our future and pursue sustainable and fair company management for long-term success.
Our mission
We deliver health across Europe. As the leading European pharmaceutical distributor, we ensure that with Wholesale, Retail, and Pharma Services, drugs get to the right place at the right time in 25 countries. We are thus making an important daily contribution to comprehensive and safe healthcare in Europe: this includes Health Care Logistics for manufacturers across Europe, support for pharmacies through a variety of services and reliable logistics, expert advice in our pharmacies, and the overall optimisation of patient care. Our customers are almost 100,000 pharmacies, millions of patients and consumers, and numerous companies in the pharmaceutical industry.
Our strategy
We align our actions to customer needs. Because the success of our customers also benefits us. Excellent performance is our success factor. On the one hand, this means striving for the highest possible quality in our daily work, and on the other hand, being guided by a high level of cost awareness. In addition to that, we take our environmental and social responsibility very seriously.
Our corporate culture
Think together global – act local! We advance our progress by employing successful concepts across borders. Because constructive cooperation beyond national borders is crucial to staying ahead of the competition. We learn from each other on a daily basis throughout Europe by further expanding our “Best practice sharing” and promoting interdisciplinary thinking. At the same time, we stand out thanks to our great proximity to the market. We can therefore respond flexibly and quickly to specific local requirements.
Our values
Everything we do is always centred on the applicable group-wide values. They are the foundation for the daily fulfilment of our mission: “We deliver health across Europe”.
ReliableWe do what we say. You can rely on our services and the best possible standards of quality. This is a result of promoting the individual abilities, potential, and motivation of our employees, which enables us to further improve the services for our customers. Constructive cooperation across national borders and commitment to successful concepts – this is the key to our decisive competitive edge. Across Europe, we are a reliable contact in all topics relating to health and well-being. A cooperative and open partnership among ourselves, as well as with customers and suppliers, is of great importance to us. We are
Corporate Mission Statement of the PHOENIX group
8 LEADERSHIP AND RESPONSIBILITY | Corporate Mission Statement of the PHOENIX group
PHOENIX group

constantly undergoing further development – while remaining true to ourselves at the same time. Based on our stable shareholder structure, we can pursue a sustainable corporate strategy.
ProactiveActing instead of reacting: we stand for clear and forward-looking objectives, quick and results-oriented decisions, and structured cooperation. We know the pharmaceutical markets in Europe and the challenges they present. Due to the continuous exchange among ourselves, as well as with our customers and business partners, we are in tune with the market. This allows us to identify the respective expectations and respond flexibly to changes. We constantly provide our customers with the appropriate support.
RespectfulHealth is a most valuable asset. Our awareness of this fact determines our actions. We are committed to the sustainable development of our organisation above and beyond the regulatory standards. Our success strategy is based on the efficient use of resources to achieve the greatest possible profitability. An ethically correct and fair interaction with business partners, competitors, and our employees is a matter of course at all times.
VISIONBe the best integrated healthcare provider –
wherever we are
MISSIONWe deliver
health across Europe
STRATEGYDedicated to our customers’ needs
Committed to excellence
CORPORATE PHILOSOPHY
Sustainable growth for value creation Committed employees for outstanding performance
Reliable Proactive RespectfulVALUES
9Corporate Mission Statement of the PHOENIX group I LEADERSHIP AND RESPONSIBILITY
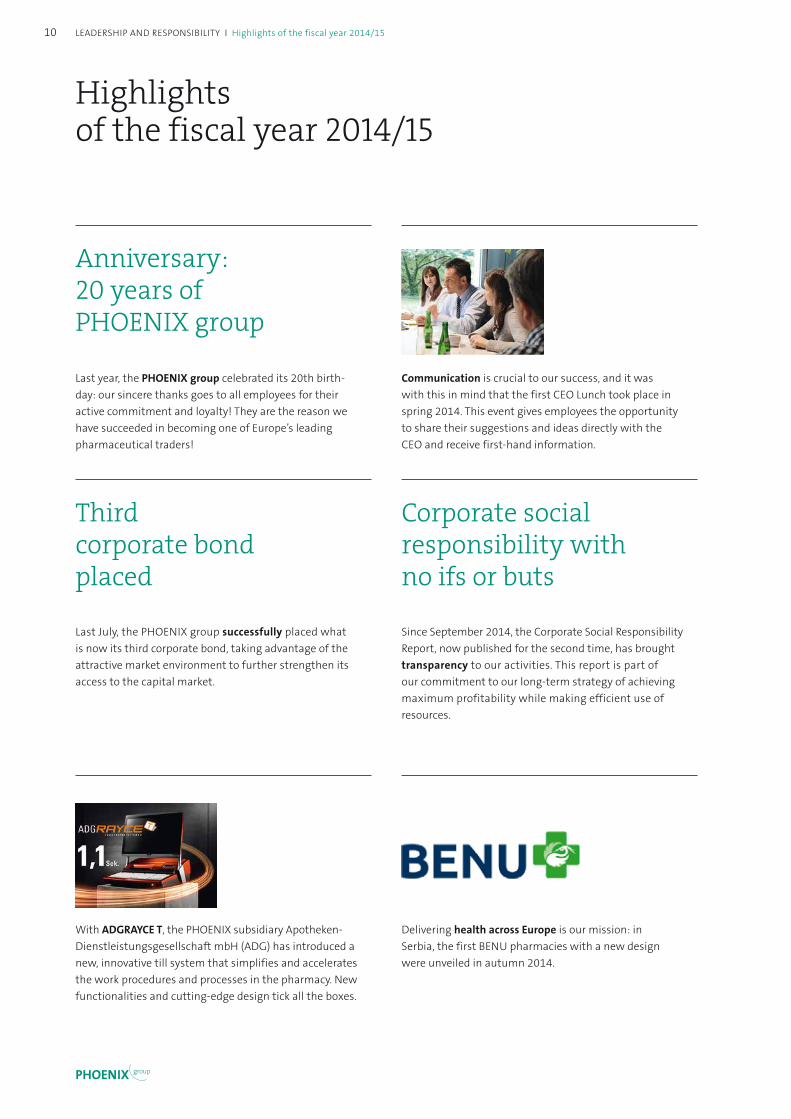
Last July, the PHOENIX group successfully placed what is now its third corporate bond, taking advantage of the attractive market environment to further strengthen its access to the capital market.
Communication is crucial to our success, and it was with this in mind that the first CEO Lunch took place in spring 2014. This event gives employees the opportunity to share their suggestions and ideas directly with the CEO and receive first-hand information.
Last year, the PHOENIX group celebrated its 20th birth-day: our sincere thanks goes to all employees for their active commitment and loyalty! They are the reason we have succeeded in becoming one of Europe’s leading pharmaceutical traders!
Third corporate bond placed
Corporate social responsibility with no ifs or buts
Anniversary: 20 years of PHOENIX group
Since September 2014, the Corporate Social Responsibility Report, now published for the second time, has brought transparency to our activities. This report is part of our commitment to our long-term strategy of achieving maximum profitability while making efficient use of resources.
Delivering health across Europe is our mission: in Serbia, the first BENU pharmacies with a new design were unveiled in autumn 2014.
With ADGRAYCE T, the PHOENIX subsidiary Apotheken- Dienstleistungsgesellschaft mbH (ADG) has introduced a new, innovative till system that simplifies and accelerates the work procedures and processes in the pharmacy. New functionalities and cutting-edge design tick all the boxes.
Highlights of the fiscal year 2014/15
10 LEADERSHIP AND RESPONSIBILITY | Highlights of the fiscal year 2014/15
PHOENIX group
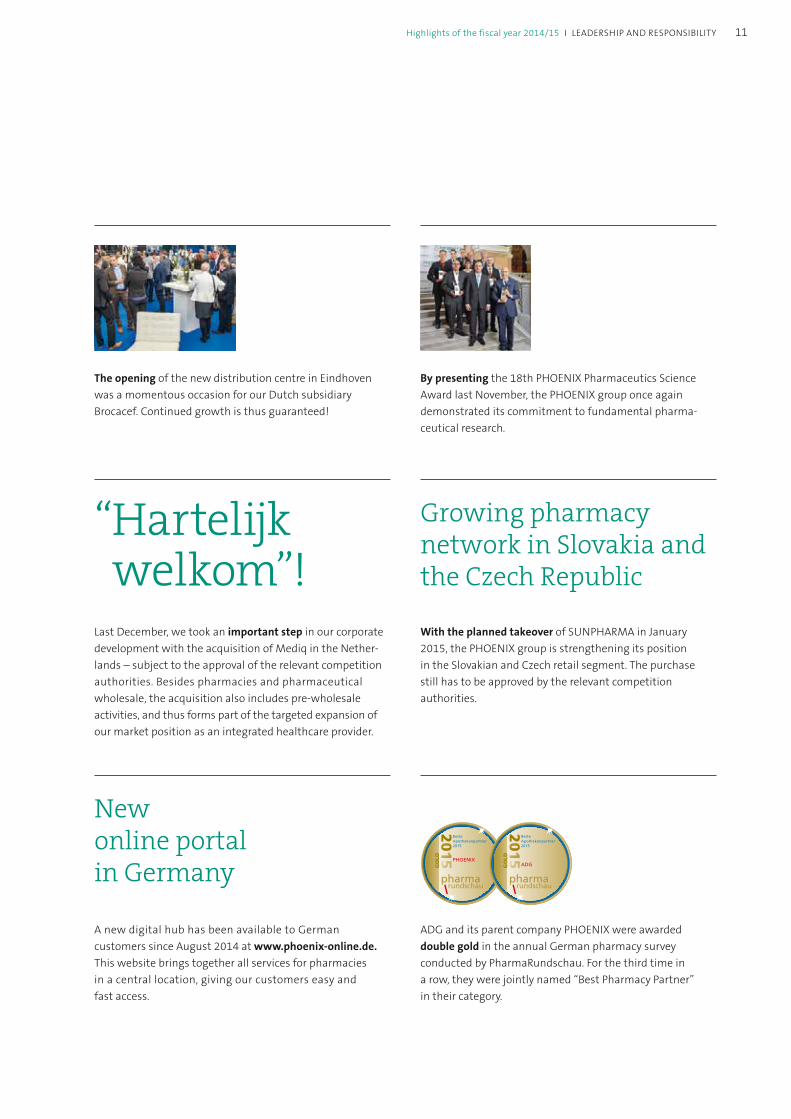
Last December, we took an important step in our corporate development with the acquisition of Mediq in the Nether-lands – subject to the approval of the relevant competition authorities. Besides pharmacies and pharmaceutical wholesale, the acquisition also includes pre-wholesale activities, and thus forms part of the targeted expansion of our market position as an integrated healthcare provider.
With the planned takeover of SUNPHARMA in January 2015, the PHOENIX group is strengthening its position in the Slovakian and Czech retail segment. The purchase still has to be approved by the relevant competition authorities.
By presenting the 18th PHOENIX Pharmaceutics Science Award last November, the PHOENIX group once again demonstrated its commitment to fundamental pharma-ceutical research.
The opening of the new distribution centre in Eindhoven was a momentous occasion for our Dutch subsidiary Brocacef. Continued growth is thus guaranteed!
New online portal in Germany
Growing pharmacy network in Slovakia and the Czech Republic
“ Hartelijk welkom”!
ADG and its parent company PHOENIX were awarded double gold in the annual German pharmacy survey conducted by PharmaRundschau. For the third time in a row, they were jointly named “Best Pharmacy Partner” in their category.
A new digital hub has been available to German customers since August 2014 at www.phoenix-online.de. This website brings together all services for pharmacies in a central location, giving our customers easy and fast access.
Beste Apothekenpartner2015
PHOENIX
2015
pharmarundschau
GOLD
Beste Apothekenpartner2015
ADG
2015
pharmarundschau
GOLD
11Highlights of the fiscal year 2014/15 I LEADERSHIP AND RESPONSIBILITY

Sustainability
Second CSR Report published. // Sustainable action for long-term success. // Specific training on the anti-corruption and competition compliance policy and code of conduct. // Improvement in environ-mentally responsible behaviour. // Top-quality supply of pharmaceuti-cals. // Targeted personnel development. // Commitment to charitable causes. // PHOENIX Pharmaceutics Science Award presented.
Last September, the PHOENIX group published its second Corporate Social Responsibility (CSR) Report. This report is part of our commitment to our long-term strategy of achieving maximum profitability while making efficient use of resources.
The current report 2013/14 presents measures for sustainable economic activity from Denmark, Germany, Estonia, Finland, Italy, Latvia, Lithuania, Norway, Austria, Poland, and Sweden. Besides the business perspective, the topics covered included the opinions of the various stakeholder groups, whose priorities were identified via the first CSR survey in 11 countries. Plans have already been made to include the remaining subsidiaries in the next CSR Report.
Social responsibility Acting in an economically and socially responsible way is a top priority for the PHOENIX group. Our goal is to create added value together with our stakeholders as well as benefiting mutually from the financial results. Naturally, we maintain high ethical standards at all times in our dealings with our customers, partners, and competitors in order to achieve our operational and financial goals.
In particular, we ensure compliance with the anti-corruption and competition compliance policy and the code of conduct. The employees are made aware of and trained in these topics via e-learning courses as well as classroom training. In addition, the PHOENIX group introduced a web-based whistleblower system on 1 June 2014, which allows questions about compliance or suspected violations of guidelines to be submitted anonymously.
Careful interaction with the environment Another aspect of our responsibility is to minimise our impact on the environment. For this reason, we are continuously looking for ways to make our pharmaceutical distribution and transportation more environmentally friendly. This includes reducing waste and disposing of it in an environmentally sound manner as well as lowering our CO2 emissions. Many of our national organisations have set up their
The next CSR Report will include group-wide
reporting.
Our areas of responsibility
1 Creating added value
2 Reducing our impact on the environment
3 Promoting and developing employees
4 Safeguarding the quality of products and services
SOCIETY ENVIRONMENT
EMPLOYEES PRODUCTS AND SERVICES
12 LEADERSHIP AND RESPONSIBILITY | Sustainability
PHOENIX group
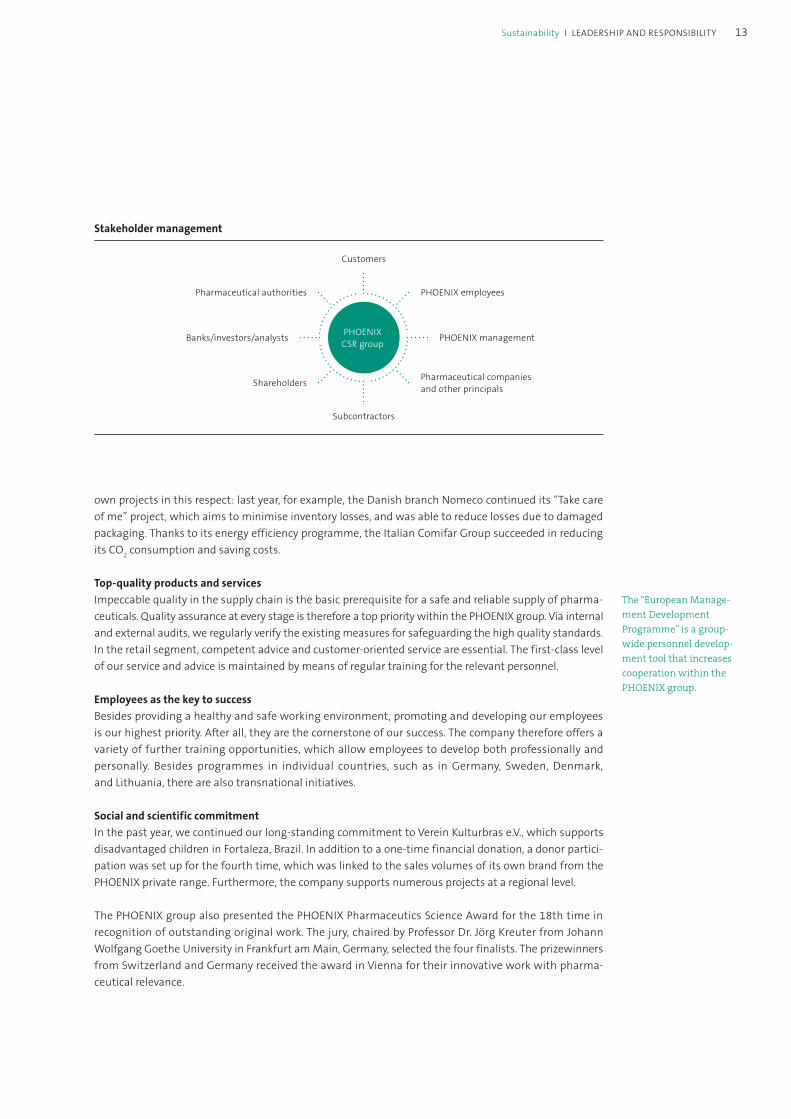
Stakeholder management
Pharmaceutical authorities
Customers
PHOENIX employees
PHOENIX management
Pharmaceutical companies and other principals
Subcontractors
Shareholders
Banks/investors/analysts PHOENIXCSR group
own projects in this respect: last year, for example, the Danish branch Nomeco continued its “Take care of me” project, which aims to minimise inventory losses, and was able to reduce losses due to damaged packaging. Thanks to its energy efficiency programme, the Italian Comifar Group succeeded in reducing its CO2 consumption and saving costs.
Top-quality products and servicesImpeccable quality in the supply chain is the basic prerequisite for a safe and reliable supply of pharma-ceuticals. Quality assurance at every stage is therefore a top priority within the PHOENIX group. Via internal and external audits, we regularly verify the existing measures for safeguarding the high quality standards. In the retail segment, competent advice and customer-oriented service are essential. The first-class level of our service and advice is maintained by means of regular training for the relevant personnel.
Employees as the key to successBesides providing a healthy and safe working environment, promoting and developing our employees is our highest priority. After all, they are the cornerstone of our success. The company therefore offers a variety of further training opportunities, which allow employees to develop both professionally and personally. Besides programmes in individual countries, such as in Germany, Sweden, Denmark, and Lithuania, there are also transnational initiatives.
Social and scientific commitmentIn the past year, we continued our long-standing commitment to Verein Kulturbras e.V., which supports disadvantaged children in Fortaleza, Brazil. In addition to a one-time financial donation, a donor partici-pation was set up for the fourth time, which was linked to the sales volumes of its own brand from the PHOENIX private range. Furthermore, the company supports numerous projects at a regional level.
The PHOENIX group also presented the PHOENIX Pharmaceutics Science Award for the 18th time in recognition of outstanding original work. The jury, chaired by Professor Dr. Jörg Kreuter from Johann Wolfgang Goethe University in Frankfurt am Main, Germany, selected the four finalists. The prizewinners from Switzerland and Germany received the award in Vienna for their innovative work with pharma-ceutical relevance.
The “European Manage-ment Development Programme” is a group-wide personnel develop-ment tool that increases cooperation within the PHOENIX group.
13Sustainability I LEADERSHIP AND RESPONSIBILITY

PHOENIX group in the capital market
Third bond successfully placed on the capital market. // The PHOENIX group has its creditworthiness assessed and published by rating agencies. // Company rating remains at “BB” with a stable outlook.
PHOENIX group with clear focus on capital marketAlthough unlisted, the PHOENIX group considers itself focused on the capital market. After the issuance of two corporate bonds in 2010 and 2013, access to the capital market was further strengthened when a third bond was successfully placed in 2014. The objective is to diversify its sources of financing and thus permanently ensure the liquidity supply. We are guided by the requirements of the capital market in relation to transparency and publicity. This includes corporate management based on value enhance-ment as well as accounting that promotes transparency and is in line with the International Financial Reporting Standards (IFRS). Ever since the first bond was issued in 2010, the PHOENIX group has been assessed by leading rating agencies.
Transparent creditor relationsThe aim of creditor relations is to provide transparent, consistent, and prompt information about devel-opments in our market environment and our company as well as inform about our objectives and increase confidence in the PHOENIX group. These activities also serve to sustainably increase the under-standing of our business. Capital market communication is oriented towards the long term and consid-ered part of the group’s sustainable strategy for value enhancement. Relevant information is made avail-able to all capital market participants on the PHOENIX group website under the Investor Relations sec-tion. Ever since the first bond was issued in 2010, the PHOENIX group has been publishing a quarterly financial report on its business performance. Personal conversations and quarterly teleconferences with representatives of the Executive Board serve as important tools for ensuring continuous and active communication with investors.
Brief overview of the currently outstanding bonds of the PHOENIX group
Issuer PHOENIX PIB Dutch Finance B.V. PHOENIX PIB Dutch Finance B.V.
Surety PHOENIX Pharmahandel GmbH & Co KG and certain subsidiaries
PHOENIX Pharmahandel GmbH & Co KG and certain subsidiaries
Bond type Unsecured eurobond Unsecured eurobond
Issue volume EUR 300,000,000 EUR 300,000,000
Coupon 3.1250 % 3.6250 %
Coupon due date Annually on 27 May Annually on 30 July
Division into shares EUR 100,000 EUR 100,000
Term 27 May 2020 30 July 2021
Stock exchange listing Luxembourg Stock Exchange Luxembourg Stock Exchange
ISIN XS0935786789 XS1091770161
Bond rating at reporting date
Standard & Poor’s: BB, outlook stable Fitch Ratings: BB, outlook stable
Standard & Poor’s: BB, outlook stable Fitch Ratings: BB, outlook stable
Company rating at reporting date
Standard & Poor’s: BB, outlook stable Fitch Ratings: BB, outlook stable
Standard & Poor’s: BB, outlook stable Fitch Ratings: BB, outlook stable
14 LEADERSHIP AND RESPONSIBILITY | PHOENIX group in the capital market
PHOENIX group
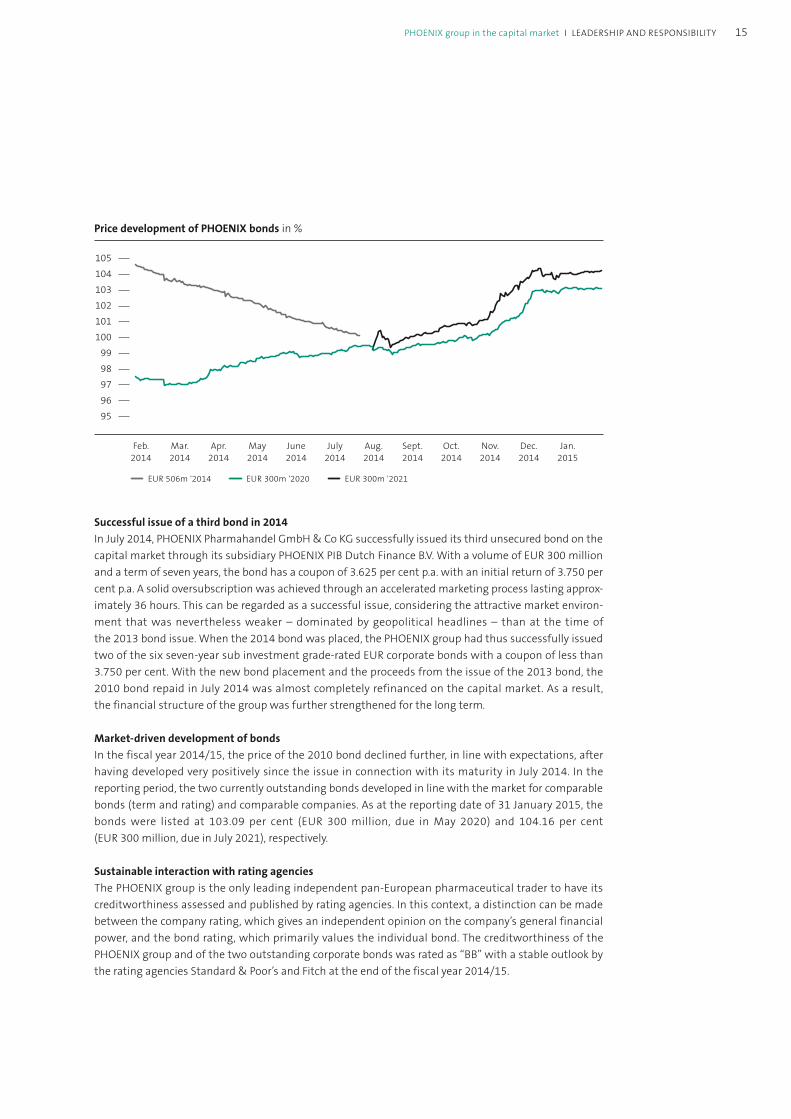
Price development of PHOENIX bonds in %
Feb.2014
Nov.2014
Dec.2014
Jan.2015
Aug.2014
Sept.2014
Oct.2014
Mar.2014
Apr.2014
May2014
June2014
July2014
9596979899
100101102103104105105
104103102101100
9998979695
EUR 506m '2014 EUR 300m '2020 EUR 300m '2021
Successful issue of a third bond in 2014In July 2014, PHOENIX Pharmahandel GmbH & Co KG successfully issued its third unsecured bond on the capital market through its subsidiary PHOENIX PIB Dutch Finance B.V. With a volume of EUR 300 million and a term of seven years, the bond has a coupon of 3.625 per cent p.a. with an initial return of 3.750 per cent p.a. A solid oversubscription was achieved through an accelerated marketing process lasting approx-imately 36 hours. This can be regarded as a successful issue, considering the attractive market environ-ment that was nevertheless weaker – dominated by geopolitical headlines – than at the time of the 2013 bond issue. When the 2014 bond was placed, the PHOENIX group had thus successfully issued two of the six seven-year sub investment grade-rated EUR corporate bonds with a coupon of less than 3.750 per cent. With the new bond placement and the proceeds from the issue of the 2013 bond, the 2010 bond repaid in July 2014 was almost completely refinanced on the capital market. As a result, the financial structure of the group was further strengthened for the long term.
Market-driven development of bondsIn the fiscal year 2014/15, the price of the 2010 bond declined further, in line with expectations, after having developed very positively since the issue in connection with its maturity in July 2014. In the reporting period, the two currently outstanding bonds developed in line with the market for comparable bonds (term and rating) and comparable companies. As at the reporting date of 31 January 2015, the bonds were listed at 103.09 per cent (EUR 300 million, due in May 2020) and 104.16 per cent (EUR 300 million, due in July 2021), respectively.
Sustainable interaction with rating agenciesThe PHOENIX group is the only leading independent pan-European pharmaceutical trader to have its creditworthiness assessed and published by rating agencies. In this context, a distinction can be made between the company rating, which gives an independent opinion on the company’s general financial power, and the bond rating, which primarily values the individual bond. The creditworthiness of the PHOENIX group and of the two outstanding corporate bonds was rated as “BB” with a stable outlook by the rating agencies Standard & Poor’s and Fitch at the end of the fiscal year 2014/15.
15PHOENIX group in the capital market I LEADERSHIP AND RESPONSIBILITY

16

Achieving success together
01Project
CEE BRIDGE – interconnects the pharmaceutical industry, wholesale, and retail in Central and Eastern Europe
Page 20 >
02Project
Optimised pharmacy services for long-term customer retention
Page 24 >
03Project
ADIVA loyalty programme – added value for pharmacies and end customers
Page 28 >
As a leading pharmaceutical trader in Europe, the PHOENIX group ensures that drugs get to the right place at the right time in 25 countries. This is what we feel strongly about. We therefore focus on integrating network structures between our three business segments Wholesale, Retail, and Pharma services. This makes us the ideal link between pharmaceutical manufacturer and patient.
Our vision is to be the best integrated healthcare provider – wherever we are. We achieve this by not just talking the talk, but by implementing our ideas, leveraging existing potential, and achieving our defined goals. Together with our employees, we are already shaping the future.
Our actions are always guided by our customers’ needs. We offer a comprehensive range of services along the entire pharmaceutical supply chain. With their outstanding performance, our dedicated employees form the basis for our success. We know that achieving success together is the way to be successful in the long term and create value through sustainable growth.
17
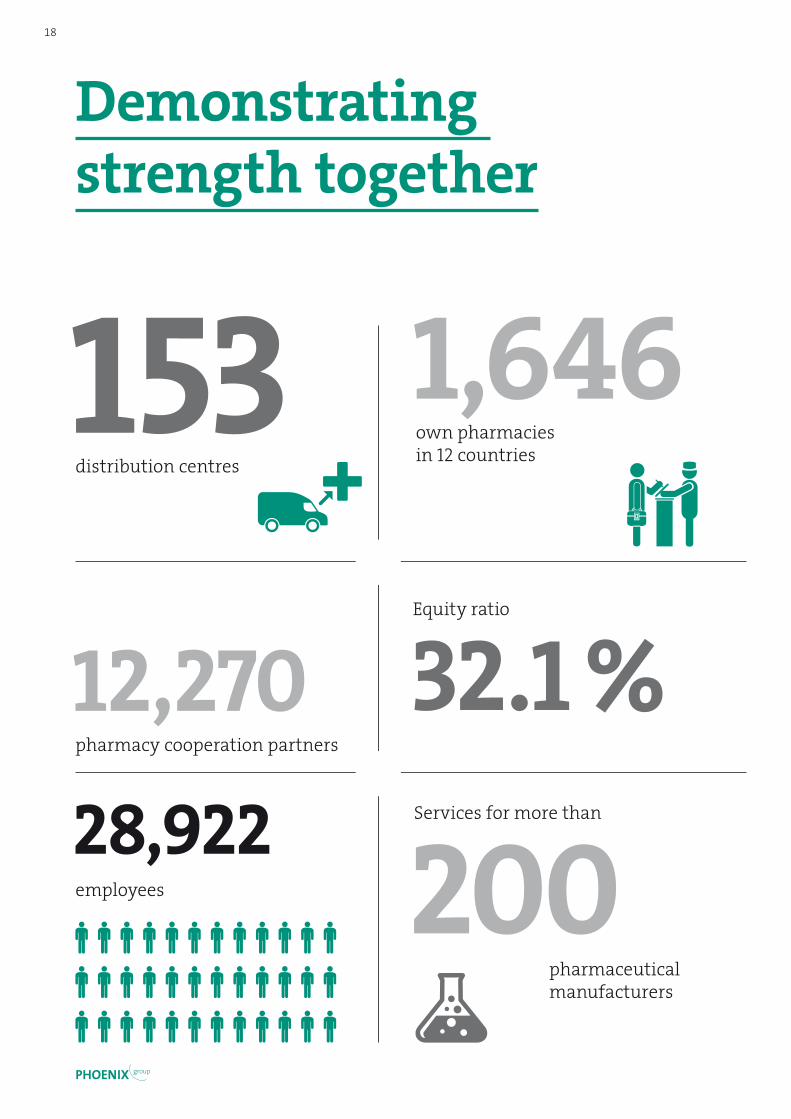
Demonstrating strength together
153distribution centres
1,646own pharmacies in 12 countries
pharmacy cooperation partners
12,270 32.1 %Equity ratio
28,922employees 200
Services for more than
pharmaceutical manufacturers
18
PHOENIX group

Poland
United Kingdom
Switzerland Austria
Estonia
Latvia
Lithuania
Norway
Sweden
Czech Republic
GermanyNetherlands
Denmark
Finland
France
Macedonia
Hungary
Slovakia
BulgariaItaly
CroatiaSerbia
Bosnia and Herzegovina
Kosovo Montenegro
25countries.
We are already operating in
Business units
Wholesale and Retail Wholesale (including Health Care Logistics)
113,000,000patient contacts in pharmacies
NO. 1 pharmaceutical wholesaler in 11 countries
EUR
27,278million
Total operating performance180,000pallet spaces
19

20
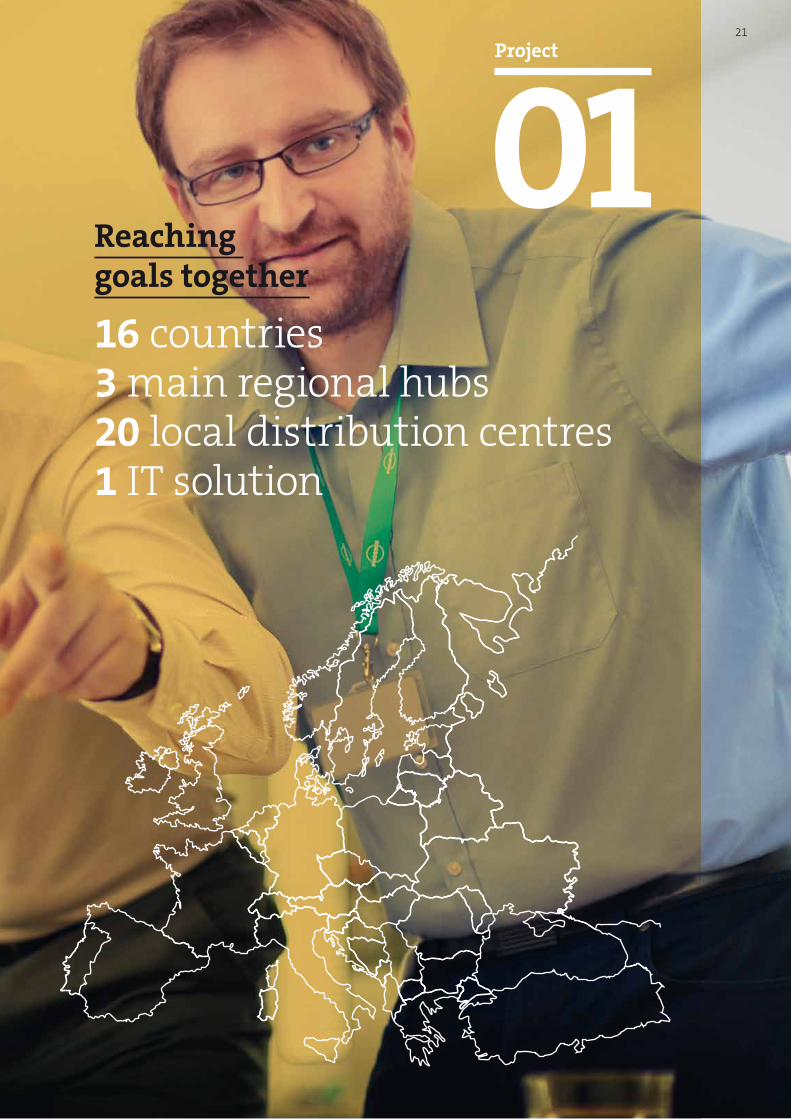
01Project
Reaching goals together
16 countries3 main regional hubs20 local distribution centres1 IT solution
21
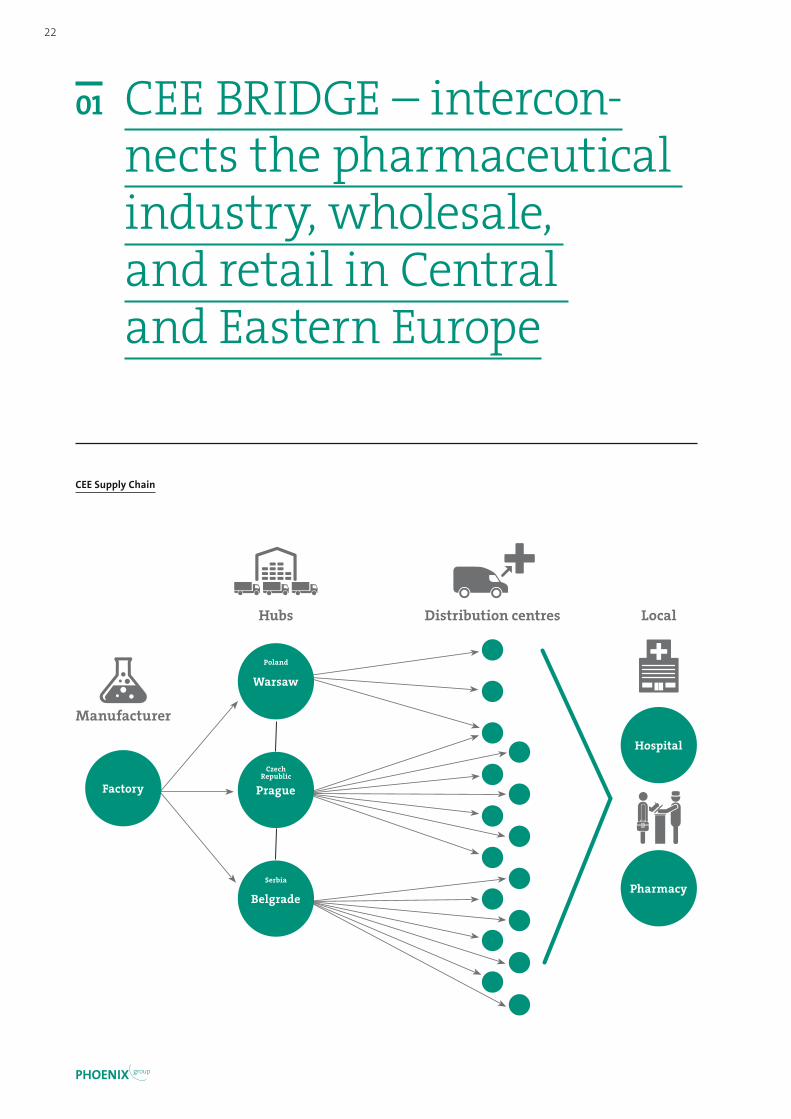
01 CEE BRIDGE – intercon-nects the pharmaceutical industry, wholesale, and retail in Central and Eastern Europe
Manufacturer
Hubs Distribution centres Local
Factory
Hospital
Pharmacy
Prague
Warsaw
Belgrade
Poland
Czech Republic
Serbia
CEE Supply Chain
22
PHOENIX group

We work across national borders to create new logistics solutions for our customers, thus contributing to a reliable healthcare supply within Europe.
With CEE (Central Eastern Europe) BRIDGE, the PHOENIX group will launch a unique logistics offering in 2016. The multinational team is currently making preparations for carrying out this transnational, cross-disciplinary pioneer project. In this region, internationally operating pharmaceutical manufacturers will soon receive individual support.
We are establishing the most efficient supply chain in Central and Eastern Europe. CEE BRIDGE will enable the PHOENIX group to act as a link between pharmaceutical manufacturers, wholesale, and (hospital) pharmacies in this region. It will take on responsibility for the storage and transportation of drugs, as well as additional services, beyond national borders. With this focus on the growing European markets, we are meeting the increasing demand from internationally active pharmaceutical companies and building strategic partnerships that will strengthen our position in the market for the long term.
The regional demand will be covered by three main hubs in Warsaw, Prague, and Belgrade, as well as 20 local distribution centres in 16 countries. CEE BRIDGE offers a high degree of flexibility to ensure that the different needs of the pharmaceutical industry in
the various locations can be met, with the customer’s business model determining our range of services. An integrated IT system connects the entire logistics network and the individual service teams, making processes efficient.
We deliver health across Europe: we will make yet another contribution to improving the supply of pharmaceuticals from 2016 with our regional logistics solution CEE BRIDGE, which will optimally connect all our customer groups.
The advantages:
• Reduced costs • Markets are supplied quickly and flexibly • Integrated distribution model • Optimised communication structures and
increased efficiency of transnational coordination• Always transparent processes that follow
compliance guidelines
23

24

02Project
Leveraging potential together
3 pharmacy brands12 countries12,442 employees113 million customer contacts 246 million products sold
25
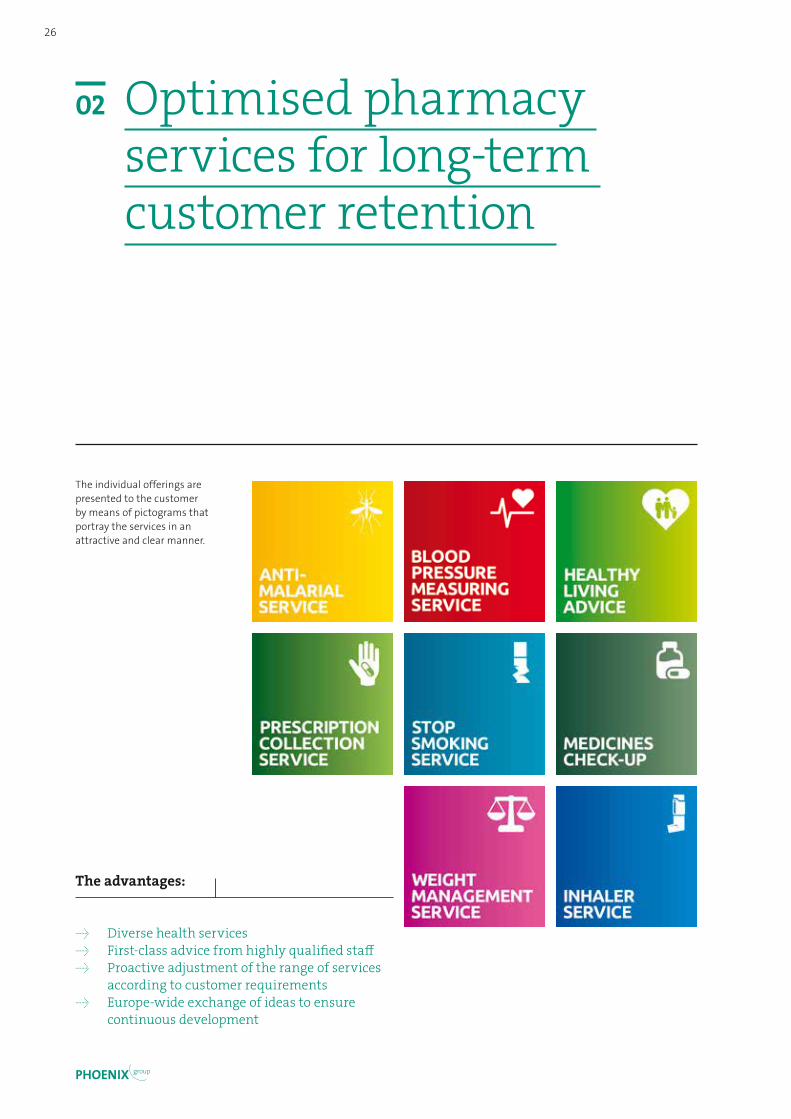
The individual offerings are presented to the customer by means of pictograms that portray the services in an attractive and clear manner.
02 Optimised pharmacy services for long-term customer retention
The advantages:
• Diverse health services• First-class advice from highly qualified staff • Proactive adjustment of the range of services
according to customer requirements• Europe-wide exchange of ideas to ensure
continuous development
26
PHOENIX group

The PHOENIX group always puts the customer first. By proactively adjusting the range of pharmacy services on a demand basis, we increase customer retention and contribute to the ongoing development of our three brands BENU, Apotek 1, and rowlands pharmacy. In the past year, the services offered by all pharmacy brands were gradually expanded. One distinctive aspect is the high-quality personal advice, which strengthens the custom-ers’ confidence in each respective brand.
Thereby, each pharmacy brand offers different services: in the United Kingdom, rowlands pharmacy has combined the presentation of its range in a separate “Healthy Living Concept”, which is explained to customers in the pharmacies by means of pictograms. The customers can use around 20 different services, some of which are reimbursable. Whether the customer needs advice on giving up smoking, wishes to discuss medicine requirements for overseas travel, or requires a medicine check – the staff are on hand to provide expert assistance. Flu vaccinations, carried out in cooperation with the UK’s National Health Service, provide extra added value. This brings the PHOENIX group closer to its customers.
The rowlands pharmacy concept is currently being implemented in the Dutch BENU pharmacies and shall be transferred to other BENU countries in the future. A project on the topic of HIV has already been launched in five Dutch BENU pharmacies. As part of the “Care
Programme HIV”, the pharmacy team received specific training to dispense competent advice to affected individuals. In Norway, patients of Apotek 1 are given assistance with their medicine intake: on demand, blister packs for individual patients are prepared for nursing homes and private households.
Learning with and from one another is of primary importance within the PHOENIX group: to guarantee an intensive exchange of ideas, best practice sharing meetings for the management of the three brands take place regularly at an international level. Existing concepts for success are shared and new ideas discussed. This allows the approximately 800 BENU pharmacies in continental Europe, the almost 300 Apotek 1 branches in Norway, and the more than 500 rowlands pharmacies in the United Kingdom to play their part in helping the PHOENIX group realise its vision of becoming the best integrated healthcare provider.
Pharmacy employees in 12 countries promote their customers’ well-being with first-class advice and customer-oriented service.
27

28

03Project
Turning ideas into reality together
1 country7 month pilot phase128 ADIVA pharmacies 3,400 customer cards
29

03 ADIVA loyalty programme – added value for pharmacies and end customers
As the leading pharmaceutical wholesaler in Europe, we offer pharmacy customers additional services within the framework of cooperation pro-grammes or partner projects. More than 12,000 independent pharmacies make use of our range of services. In Croatia, the ADIVA concept is finding wide acceptance and now has 128 participating pharmacies. In order to further increase the initiative’s added value, the ADIVA loyalty programme has now been introduced.
ADIVA stands for pooled expertise: since 2010, individual pharmacies in Croatia have been able to benefit from the programme, which puts a variety of resources at their fingertips: marketing packages for patient campaigns, sales promotions, or special training activities. For the end customer, the brand is brought to life through the customer magazine, website, and Facebook presence.
To stay attractive in the long term, the ADIVA concept is continually updated. In July 2014, the pilot phase for the implementation of the loyalty card for end customers commenced. At initially five selected ADIVA pharmacies, interested customers were able to apply for the ADIVA loyalty card up to the end of January 2015. By the end of the trial period, the number of participants was already 3,400. Since February 2015, when the programme was officially launched, all other ADVIVA pharmacies have offered the new ADIVA
loyalty programme “Faithful to Health” with a loyalty card. This represents a new opportunity to strengthen ties with the customers and generate a loyal customer base. It is expected that some 80,000 customer cards will have been issued by the end of the year.
Benefits of the ADIVA loyalty programme: holders of the loyalty card can collect points when they make purchases at their ADIVA pharmacy and exchange them for rewards or, for instance, discounts on medical treatments. Various stakeholders in the health system cooperate closely on this scheme. In turn, participating pharmacies can increase customer retention and satisfaction, as well as measuring their purchasing behaviour and loyalty. If successful, it is set to be launched in other countries in the long term. Interacting together remains crucial to establishing a competitive edge. We foster this approach with a regular exchange of knowledge.
Croatia
••
•
•
30
PHOENIX group

The advantages:
• ADIVA loyalty card with extensive rewards to provide a competitive edge
• Pharmacies supported in their role as healthcare providers
• Networking with other stakeholders facilitated• Targeted end customer retention thanks
to loyalty card with reward system
Examples of marketing services
• ADIVA: customer magazine free of charge
• ADIVA website and social media activities
• Patient campaigns und customer advertising:
posters, patient flyers, PR ads
• Top products of the month: product discounts for patients
With cooperation programmes such as the ADIVA scheme, we offer pharmacy customers a wide range of tailor-made opportunities to stand out from the competition.
31
Group management report 2014/15
Background of the Group 33 Overview of the PHOENIX group 33 The PHOENIX group 33 Activities by business unit 34 Processes and organisation 36
Business and economic environment 37 Overall situation of the economy and the industry 37 Situation of the PHOENIX group and
development of its business 37 Investments in logistics and
technology in wholesale activities 37 Acquisitions 38 Financing 38 Results of operations 38 Net assets 41 Financial position 42 Employees 43
Subsequent events 46
Risks and opportunities 47 Risks 47 Opportunities 49
Forecast 50
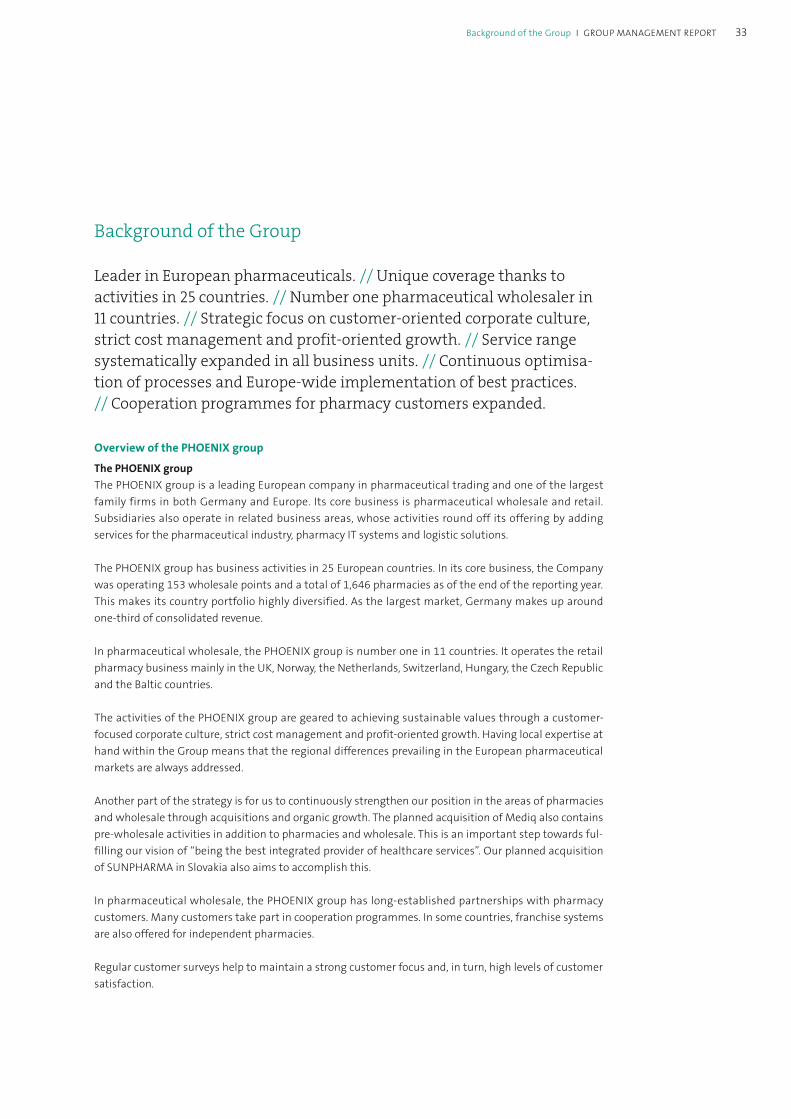
Background of the Group
Leader in European pharmaceuticals. // Unique coverage thanks to activities in 25 countries. // Number one pharmaceutical wholesaler in 11 countries. // Strategic focus on customer-oriented corporate culture, strict cost management and profit-oriented growth. // Service range systematically expanded in all business units. // Continuous optimisa-tion of processes and Europe-wide implementation of best practices. // Cooperation programmes for pharmacy customers expanded.
Overview of the PHOENIX group
The PHOENIX groupThe PHOENIX group is a leading European company in pharmaceutical trading and one of the largest family firms in both Germany and Europe. Its core business is pharmaceutical wholesale and retail. Subsidiaries also operate in related business areas, whose activities round off its offering by adding services for the pharmaceutical industry, pharmacy IT systems and logistic solutions.
The PHOENIX group has business activities in 25 European countries. In its core business, the Company was operating 153 wholesale points and a total of 1,646 pharmacies as of the end of the reporting year. This makes its country portfolio highly diversified. As the largest market, Germany makes up around one-third of consolidated revenue.
In pharmaceutical wholesale, the PHOENIX group is number one in 11 countries. It operates the retail pharmacy business mainly in the UK, Norway, the Netherlands, Switzerland, Hungary, the Czech Republic and the Baltic countries.
The activities of the PHOENIX group are geared to achieving sustainable values through a customer-focused corporate culture, strict cost management and profit-oriented growth. Having local expertise at hand within the Group means that the regional differences prevailing in the European pharmaceutical markets are always addressed.
Another part of the strategy is for us to continuously strengthen our position in the areas of pharmacies and wholesale through acquisitions and organic growth. The planned acquisition of Mediq also contains pre-wholesale activities in addition to pharmacies and wholesale. This is an important step towards ful-filling our vision of “being the best integrated provider of healthcare services”. Our planned acquisition of SUNPHARMA in Slovakia also aims to accomplish this.
In pharmaceutical wholesale, the PHOENIX group has long-established partnerships with pharmacy customers. Many customers take part in cooperation programmes. In some countries, franchise systems are also offered for independent pharmacies.
Regular customer surveys help to maintain a strong customer focus and, in turn, high levels of customer satisfaction.
33Background of the Group I GROUP MANAGEMENT REPORT

Throughout all business units, the PHOENIX group continuously implements best practices across Europe. In addition to group-wide initiatives, it mainly benefits in this regard from locally success-ful process optimisation measures, which serve as a starting point for improvement measures in other countries.
The Company is largely managed using the financial indicators of the income statement and the statement of financial position. The main income statement indicators are revenue and adjusted EBITDA.
Activities by business unitExpansion of the service portfolio for pharmacy customers The PHOENIX group offers a diverse portfolio of services for its pharmacy customers Europe-wide, comprising training, cooperation programmes and other services. More than 12,000 independent pharmacies were members of one of its attractive cooperation programmes in the past fiscal year.
In eastern Europe, the Betty programme was established in Macedonia and Bulgaria, thereby allowing the PHOENIX group to offer marketing and communication services designed to stimulate sales with the aim of creating a strong brand name and giving competitive advantages for the participating pharmacies. Betty had a total of 772 members as of the end of the fiscal year.
The PHOENIX group in Croatia also developed the ADIVA pharmacy concept further, with benefits for pharmacy customers including for example purchasing advantages or a range of high-quality seminars. The offer will be supplemented by the ADIVA Loyalty Card in 2015, which is intended to strengthen the loyalty of patients, i.e. end customers, to ADIVA pharmacies.
The German pharmacy cooperation programme MIDAS, which comprises basic services as well as optional services that can be booked on a modular basis, was successfully relaunched in the past fiscal year. In addition to existing marketing services and advertisements in pharmacy magazines, the marketing portfolio was expanded by adding additional attractive marketing services. Product ranges are subject to a MIDAS bonus. 2,200 members are already reaping the rewards of MIDAS.
Furthermore, the online portal www.phoenix-online.de was launched in Germany. Since 1 August 2014, this portal has been combining all German content and services from different websites onto one plat-form, including offerings by German subsidiaries. In this way, the PHOENIX group has provided a modern and central point of contact for the Company and all services that can help make daily work easier.
Some 11,000 PHOENIX customers in Germany are benefiting from the optimisation of processes between pharmacies and wholesale with the switch to the web-based protocol MSV3. In close consulta-tion with pharmacy customers, the PHOENIX group was able to guide a large portion of customers through the process of implementing this important measure in fiscal year 2014/15 and thereby ensur-ing improved processes for both parties. Within the German organisation, the workflow in the fields of order picking, the customer service centre and warehousing was adjusted in order to reap the full benefits of technical innovation.
34 GROUP MANAGEMENT REPORT I Background of the Group
PHOENIX group
The PHOENIX group subsidiary Apotheken-Dienstleistungsgesellschaft mbH (ADG) launched various innovative products for its customers in the past fiscal year. This included the ADGRAYCE T, a new cash system that simplifies and speeds up work steps and processes at pharmacies. The features of this system include the ability to scan prescriptions in seconds as well as two operating concepts, the traditional way or with a tablet.
The PHOENIX group is supporting pharmacies in Germany, Norway, the Netherlands and Finland in the process of individually combining medications for patients into blister packs. In this way the Group is contributing to reliable and high-quality care of patients, whose administration of medication is simplified with personal blister packaging, and which increases compliance. In Germany, the Blister-Center in Aschaffenburg, one of the largest providers in Germany, is an important service provider for pharmacies that supply care homes. In Norway too, the area of blister packaging is highly relevant for the PHOENIX group. In 2014/15, business was expanded once again.
Pharma Services offering expanded across the entire supply chainIn the area of Pharma Services, the PHOENIX group offers Europe-wide services across the entire supply chain. In addition to services for marketing/sales, the services mainly comprise distribution solutions for the pharmaceutical industry, which are adjusted to meet European, regional or local requirements.
The focus is currently on further developing the areas of preferred partnerships, health logistics, data management as well as patient services. Additional core areas include optimising the supply chain, clinical studies, supporting sales as well as specialty distribution.
Continuous expansion of retail brandsThe BENU brand, which the PHOENIX group has successfully established in the Netherlands, Switzerland, the Baltics, Hungary, the Czech Republic and Serbia, is characterised by professional consulting services and absolute customer-centricity. By the end of January 2015, 787 pharmacies already belonged to the brand.
Through acquisitions in Serbia, the Czech Republic and Switzerland, BENU’s market presence was strategically increased in these regions. In Serbia in particular, numerous greenfields and acquisitions laid the foundation for a strong future market position of the BENU brand in fiscal year 2014/15. Overall, the PHOENIX group owns 86 pharmacies in the country. With Apotek 1 in Norway and rowlands pharmacy in the UK, the PHOENIX group operates two more strong pharmacy brands in the retail seg-ment. These are firmly anchored in their respective home markets and are continuously being enhanced. Market shares and profit increased in Norway, meaning the overall performance of Norway’s leading pharmacy chain can be deemed as very positive.
At rowlands pharmacy, a new service concept was developed which, in addition to containing a comprehensive description of services for pharmacy customers, also contains both a training concept for pharmacy employees as well as a visualisation of services in the pharmacy. This realignment is set to place focus even more strongly on the health of the customer.
35Background of the Group I GROUP MANAGEMENT REPORT

In the retail segment, the three pharmacy brands BENU, Apotek 1 and rowlands pharmacy have a wide and competent range of own brands. This range already includes more than 1,000 products across all categories. The goal is to further expand this product portfolio.
The existing pharmacy portfolio is regularly analysed by the PHOENIX group and adjusted accordingly. As of the end of fiscal year 2014/15, the Group included 1,646 pharmacies and the outlook to the new fiscal year is positive, with the foundation being laid back in December 2014 for the expansion of the pharmacy network in the Netherlands. Subject to the approval of the responsible competition authorities, the Dutch Brocacef Groep, a subsidiary of the PHOENIX group, announced the acquisition of Mediq Apotheken Nederland B.V. In Slovakia, entry into the retail trade market is also imminent. With the purchase of the SUNPHARMA pharmacy chain – also subject to the approval of the competition authorities – the PHOENIX group is expanding its leading market position as an integrated provider of healthcare services.
Processes and organisationWe continuously review and improve our own processes and structures to increase efficiency and provide the flexibility needed to respond quickly to market developments and be able to ensure sustain-able growth.
Numerous measures under the PHOENIX FORWARD programme launched in January 2013 were success-fully implemented in the past fiscal year. Overall, we were able to reduce costs by EUR 88m. The full cost-savings effect of EUR 100m at least should be achieved by the end of the fiscal year 2015/16.
In order to accommodate the major significance of the German market, a German management team was implemented as of 1 February 2014 under the PHOENIX FORWARD programme. Organisational changes were also carried out so as to offer our customers the same level of service across Germany and increase process quality. The 20 distribution centres were split into eight regions with two or three distri-bution centres each and a customer service centre was set up for each region, which is managed on a national level. Administrative activities such as invoice checking and personnel administration were centralised to create synergies and streamline processes. On the whole, PHOENIX’s new structure makes it well positioned to further strengthen and safeguard its position in Germany.
Centralisation initiatives in the area of finances were also carried out in other European branches outside of Germany. Taking into account the specific needs of each country, the Accounting Controlling Excel-lence (ACE) project helped create standards, optimise processes and combine activities. In the long term, this is expected reduce costs by EUR 6.8m overall by means of finance and accounting projects: Cost sav-ings of EUR 4.6m had already been made in the prior year and further savings of EUR 2.2m are expected to be made in the coming reporting period.
In the area of finance, SAP ERP was successfully introduced for the retail segment in Serbia, thus convert-ing an additional country company. The aim is to use the joint IT platform to further raise the quality, efficiency and transparency within the accounting function, while increasing the quality of the financial reporting process at a global and local level and leveraging synergies.
36 GROUP MANAGEMENT REPORT I Background of the Group
PHOENIX group
Business and economic environment
Challenging overall economic environment with persistent fierce competition. // Sound growth in Germany. // Positive development of German pharmaceutical wholesale market. // Revenue growth also in majority of foreign markets. // Pharmaceutical industry benefits from increase in revenue from prescription drugs. // Investments in whole-sale improve logistic performance. // Refinancing continued. // Profes-sional basic and advanced training as basis for qualified employees.
Overall situation of the economy and the industry
The European economy recorded slight growth in 2014, with GDP in the eurozone increasing by 0.9 % in 2014 compared to the prior year. The German economy in particular was in good shape, where GDP (adjusted for price effects) was up by 1.5 % mainly as a result of strong domestic demand.
There were differences in the development of the European pharmaceutical markets. The German pharmaceutical wholesale market experienced pleasing growth in 2014, increasing by 5 % on the prior year. This was primarily attributable to the tangible increase in revenue from prescription drugs. Never-theless, the German market continued to be dominated by fierce competition.
Situation of the PHOENIX group and development of its business
Investments in logistics and technology in wholesale activitiesIn order to continue optimally satisfying changing market requirements, comply with Good Distribution Practice (GDP) guidelines and exploit existing savings potential, the PHOENIX group made further investments and improvements in the past fiscal year.
The Warehouse Excellence (WE) initiative commenced in the past fiscal year was implemented gradually, thus helping to bring processes at all European distribution centres in line as best as possible. Overall, this is set to constantly increase the quality and performance of the individual distributions centres by recognising and exploiting potential for improvement. The constant optimisation process is continuously supported with the help of employees on site. By the end of fiscal year 2014/15, all employees had received training and the web-based WE portal was launched. This provides a simple way for suggestions for improvement to be shared across borders.
In France, inventory availability continued to increase significantly. Increasing the size of the warehouse in Lyon boosted order picking by 100 %. Furthermore, the La Roche location was given up and replaced with a new distribution centre in Niort to improve the supply of pharmacies.
37Business and economic environment I GROUP MANAGEMENT REPORT

A distribution centre completed in September 2014 went into operation in Eindhoven, Netherlands. This is expected to streamline processes and make them more effective as well as to set the course for future growth. The new distribution centre replaces the old location in Eindhoven, where limited capacities were no longer sufficient.
In Germany, investments were made at various locations in the area of technology and premises. As a result, distribution centres have been modernised as needed and are now well prepared for the future.
The new GDP guidelines were introduced in Germany seamlessly. External audits based on GDP guide-lines and DIN EN ISO 9001:2008 confirmed the already high quality standards of the distribution centres. Compliance with the new GDP guidelines also took utmost priority in other areas of the Group, with individual countries benefiting from a mutual exchange of experience and best practices, even though not all regulations of the GDP guidelines are interpreted consistently throughout Europe (e.g. transport temperatures).
AcquisitionsThe PHOENIX group pursues a targeted acquisition strategy. In total, business combinations in the reporting year 2014/15 led to cash outflow of EUR 19.4m (prior year: EUR 21.4m). Cash received from divestitures amounted to EUR 0.9m (prior year: EUR 6.9m).
The business combinations in fiscal year 2014/15 mainly concerned pharmacies in various countries.
FinancingLoan conditions improvedIn April 2014, the PHOENIX group negotiated improvements to the loan conditions for the existing syndicated, revolving credit facility and at the same time extended the term to a new residual term of five years.
Further bond issuedIn July 2014, the PHOENIX group issued its third corporate bond with a volume of EUR 300m, a term of seven years and an interest coupon of 3.625 %.
Results of operationsTotal operating performance, which comprises revenue and handled volumes that are not reported as revenue, increased by 5.3 % to EUR 27,278.2m in fiscal year 2014/15. Adjusted for exchange rate effects, the growth amounts to 6.1 % and therefore exceeds market growth.
38 GROUP MANAGEMENT REPORT I Business and economic environment
PHOENIX group
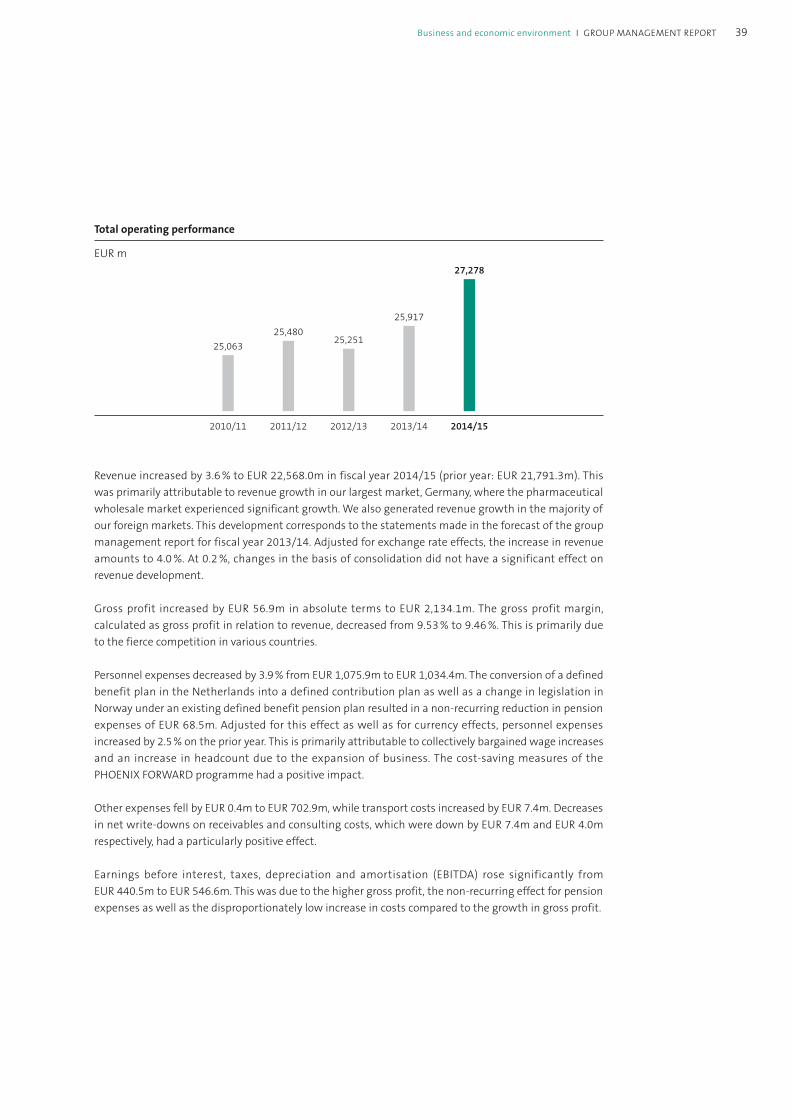
Revenue increased by 3.6 % to EUR 22,568.0m in fiscal year 2014/15 (prior year: EUR 21,791.3m). This was primarily attributable to revenue growth in our largest market, Germany, where the pharmaceutical wholesale market experienced significant growth. We also generated revenue growth in the majority of our foreign markets. This development corresponds to the statements made in the forecast of the group management report for fiscal year 2013/14. Adjusted for exchange rate effects, the increase in revenue amounts to 4.0 %. At 0.2 %, changes in the basis of consolidation did not have a significant effect on revenue development.
Gross profit increased by EUR 56.9m in absolute terms to EUR 2,134.1m. The gross profit margin, calculated as gross profit in relation to revenue, decreased from 9.53 % to 9.46 %. This is primarily due to the fierce competition in various countries.
Personnel expenses decreased by 3.9 % from EUR 1,075.9m to EUR 1,034.4m. The conversion of a defined benefit plan in the Netherlands into a defined contribution plan as well as a change in legislation in Norway under an existing defined benefit pension plan resulted in a non-recurring reduction in pension expenses of EUR 68.5m. Adjusted for this effect as well as for currency effects, personnel expenses increased by 2.5 % on the prior year. This is primarily attributable to collectively bargained wage increases and an increase in headcount due to the expansion of business. The cost-saving measures of the PHOENIX FORWARD programme had a positive impact.
Other expenses fell by EUR 0.4m to EUR 702.9m, while transport costs increased by EUR 7.4m. Decreases in net write-downs on receivables and consulting costs, which were down by EUR 7.4m and EUR 4.0m respectively, had a particularly positive effect.
Earnings before interest, taxes, depreciation and amortisation (EBITDA) rose significantly from EUR 440.5m to EUR 546.6m. This was due to the higher gross profit, the non-recurring effect for pension expenses as well as the disproportionately low increase in costs compared to the growth in gross profit.
25,06325,480
25,251
2010/11 2011/12 2012/13
Total operating performance
EUR m
25,917
27,278
2013/14 2014/15
39Business and economic environment I GROUP MANAGEMENT REPORT

At EUR 567.6m, the PHOENIX group’s EBITDA indicator (adjusted EBITDA) used for comparison with net debt was up on the prior-year figure. Adjusted for the non-recurring effect for pension expenses, adjusted EBITDA increased as forecast and is determined as follows:
EUR k FY 2013/14 FY 2014/15
EBITDA 440,476 546,606
Interest from customers 17,036 18,253
Factoring fees 3,516 2,754
Adjusted EBITDA 461,028 567,613
At EUR 111.1m, amortisation, depreciation and impairment losses were EUR 80.9m lower than in the prior year (EUR 192.0m). In the prior year, this included an impairment loss recognised on goodwill of EUR 84.9m.
The effects described led to a considerable increase in earnings before interest and taxes (EBIT) from EUR 248.4m in the prior year to EUR 435.5m. The return on sales based on EBIT amounted to 1.93 % (prior year: 1.14 %).
Financial result improvesThe financial result improved by EUR 31.1m from EUR − 105.3m to EUR − 74.2m. This improvement was mainly attributable to the repayment of the high-yield bond issued in 2010 as well as the lower average net debt.
Overall, earnings before income taxes of EUR 143.1m increased by EUR 218.2m to EUR 361.3m.
Income taxes amounted to EUR 103.3m (prior year: EUR 73.1m) and contain expenses from current taxes of EUR 61.4m (prior year: EUR 85.5m) as well as deferred tax expenses of EUR 41.9m (prior year: deferred tax income of EUR 12.4m). The tax rate dropped to 28.6 % (prior year: 51.1 %). In the prior year, the main negative effects came from amortisation of goodwill which could not be recognised for tax purposes as well as unrecognised deferred taxes on unused tax loss carryforwards.
Profit for the period came to EUR 258.0m (prior year: EUR 70.0m), of which EUR 35.1m (prior year: EUR 19.9m) was attributable to non-controlling interests. The significant increase in profit attributable to non-controlling interests is primarily due to the positive non-recurring effect in connection with the accounting method for pension obligations at our Dutch subsidiary, where the non-controlling interest is 45 %.
The profit attributable to the owners of the parent company increased from EUR 50.1m to EUR 222.9m.
40 GROUP MANAGEMENT REPORT I Business and economic environment
PHOENIX group
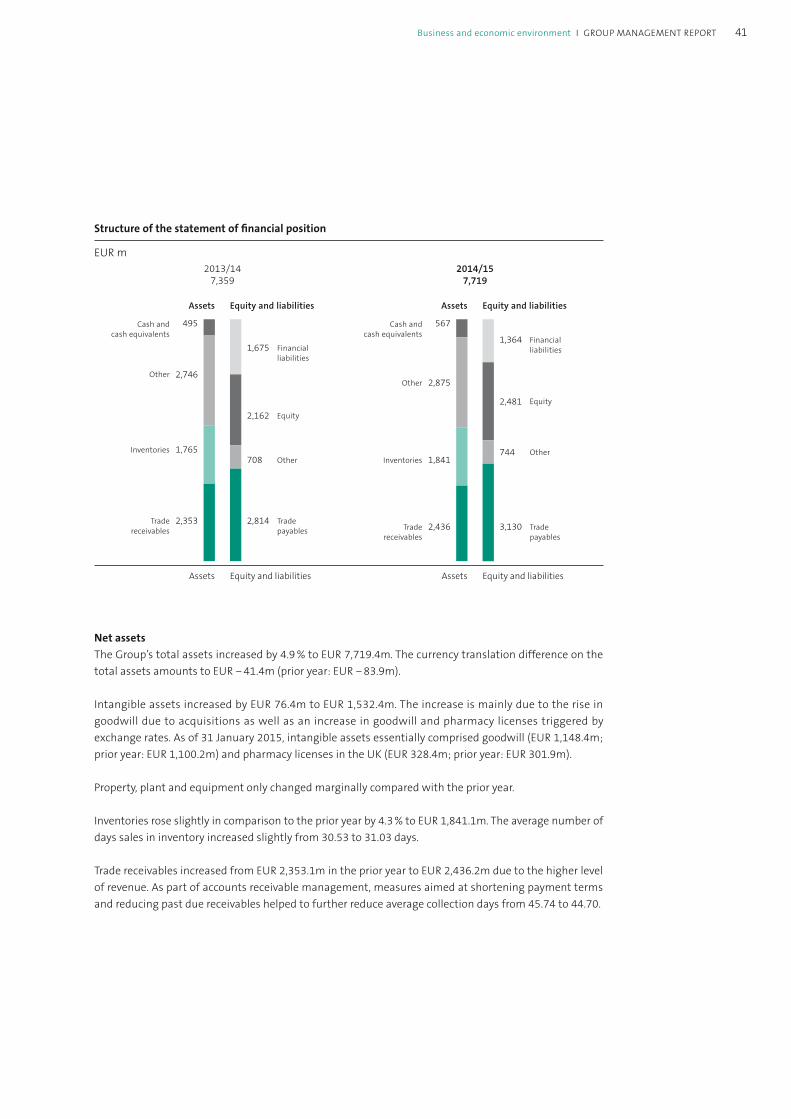
Net assetsThe Group’s total assets increased by 4.9 % to EUR 7,719.4m. The currency translation difference on the total assets amounts to EUR − 41.4m (prior year: EUR − 83.9m).
Intangible assets increased by EUR 76.4m to EUR 1,532.4m. The increase is mainly due to the rise in goodwill due to acquisitions as well as an increase in goodwill and pharmacy licenses triggered by exchange rates. As of 31 January 2015, intangible assets essentially comprised goodwill (EUR 1,148.4m; prior year: EUR 1,100.2m) and pharmacy licenses in the UK (EUR 328.4m; prior year: EUR 301.9m).
Property, plant and equipment only changed marginally compared with the prior year.
Inventories rose slightly in comparison to the prior year by 4.3 % to EUR 1,841.1m. The average number of days sales in inventory increased slightly from 30.53 to 31.03 days.
Trade receivables increased from EUR 2,353.1m in the prior year to EUR 2,436.2m due to the higher level of revenue. As part of accounts receivable management, measures aimed at shortening payment terms and reducing past due receivables helped to further reduce average collection days from 45.74 to 44.70.
Structure of the statement of financial position
EUR m2014/15
7,7192013/14
7,359
AssetsAssets Equity and liabilitiesEquity and liabilities
InventoriesInventories
Cash and cash equivalents
Cash and cash equivalents
Trade receivables
Trade receivables Trade
payables
Trade payables
OtherOther
Equity
Equity
Financial liabilitiesFinancial
liabilities
AssetsAssets Equity and liabilitiesEquity and liabilities
OtherOther
2,8752,746
567495
1,8411,765
2,4362,353
744708
3,1302,814
1,3641,675
2,4812,162
41Business and economic environment I GROUP MANAGEMENT REPORT
Receivables amounting to EUR 121.6m had been sold as of 31 January 2015 (prior year: EUR 114.2m) under ABS and factoring programmes that are not accounted for in the statement of financial position. Under ABS and factoring programmes that are accounted for only to the extent of the continuing involvement, receivables of EUR 255.3m had been sold as of 31 January 2015 (prior year: EUR 238.1m). The Group’s continuing involvement came to EUR 20.9m (prior year: EUR 14.6m).
Other receivables and other current financial assets increased by EUR 9.9m to EUR 187.1m. The increase is largely attributable to the rise in receivables from ABS/factoring programmes.
Financial positionFurther increase in equityEquity increased from EUR 2,161.8m as of 31 January 2014 to EUR 2,481.5m as of 31 January 2015. The equity ratio developed in line with the forecast made in the group management report for 2013/14 and amounts to 32.1 % (prior year: 29.4 %). The main reasons for the increase include the increase in the limited partners’ capital as well as the profit for the period of EUR 258.0m (prior year: EUR 70.0m). This was impacted by currency translation with an effect of EUR 42.5m (prior year: EUR 12.3m), the change in the reserve for available-for-sale financial assets with an effect of EUR 0.6m (prior year: EUR − 1.2m) and the change in the reserve for the remeasurement of defined benefit plans with an effect of EUR − 65.1m (prior year: EUR − 15.4m).
Cash flow from operating activities came to EUR 387.9m (prior year: EUR 417.0m), which was largely affected by a lower reduction in the working capital compared to the prior year. The cash flow from investing activities came to EUR − 146.2m (prior year: EUR − 112.9m).
The free cash flow decreased from EUR 304.0m in the prior year to EUR 241.7m. For the change in free cash flow and cash and cash equivalents, please refer to the statement of cash flows.
Provisions for pensions increased – largely due to actuarial losses on account of lower interest rates – from EUR 236.1m in the prior year to EUR 290.4m in the reporting year.
Net debt decreased Non-current financial liabilities came to EUR 603.7m. Included are bonds amounting to EUR 591.4m (31 January 2014: EUR 294.6m). At the end of July 2014, the PHOENIX group issued another corporate bond with a volume of EUR 300.0m, a term of seven years and an interest coupon of 3.625 %. The supplementary contribution of EUR 123.8m, which had previously been disclosed under non-current financial liabilities, was repaid in August 2014. At the same time, the limited partners’ capital was increased by means of cash contribution from EUR 135.0m to EUR 1,185.0m. A partial sum of EUR 10.9m was contributed by the fully consolidated entities and offset against reserves.
42 GROUP MANAGEMENT REPORT I Business and economic environment
PHOENIX group

Current financial liabilities decreased by EUR 488.6m to EUR 760.3m. The corporate bond issued in July 2010 with an outstanding nominal value of EUR 496.2m was repaid in July 2014 as scheduled.
According to the calculation below, total net debt were reduced significantly from EUR 1,330.9m to EUR 1,068.7m.
EUR k 31 Jan. 2014 31 Jan. 2015
+ Financial liabilities (non-current) 426,162 603,683
./. Supplementary partner contribution − 123,766 0
./. Derivative financial instruments (non-current) 0 − 431
+ Financial liabilities (current) 1,248,882 760,288
./. Derivative financial instruments (current) − 3,107 − 11,721
./. Cash and cash equivalents − 494,454 − 567,449
./. Held-to-maturity financial assets 0 0
./. Financial assets held for sale 0 0
+ Sold in the course of factoring and ABS transactions 337,676 356,033
./. Factoring receivables − 37,350 − 37,191
./. Receivables from ABS programmes − 23,188 − 34,463
Net debt 1,330,855 1,068,749
The objective of financial management is to ensure a sound capital structure to finance operating business. In this connection, the aim is also to further strengthen the equity ratio by retaining profits.
Trade payables increased by EUR 316.9m compared with the prior year to EUR 3,130.5m, due among other things to the rise in the business volume.
For further information on the PHOENIX group’s financial liabilities, please refer to the sections on “Financial liabilities” and “Other notes” in the notes to the consolidated financial statements.
Overall, the PHOENIX group was able to successfully further strengthen its market position in fiscal year 2014/15 as a leading pharmaceutical trader in Europe and expanded its wholesale and retail activities despite the difficult market environment.
EmployeesThe success of the PHOENIX group is again thanks to the great dedication of our employees in all busi-ness units this year. At the end of fiscal year 2014/15, there were 28,922 employees (24,153 full-time equivalents) at the PHOENIX group across a total of 25 countries in Europe.
43Business and economic environment I GROUP MANAGEMENT REPORT

Leading in dialogue with employeesGroup-wide management guidelines are a key component of our corporate culture. They provide a basis for personnel management and create a common bond throughout the Group. The guidelines contain the following topics:
Collaboration in partnership
Motivation and dedication
Information
Support and development
Assessment and feedback
Value added
The annual employee review meetings serve as an important feedback instrument and help the managers give appreciative feedback to their employees. Up to now this had been introduced at the headquarters and the subsidiaries PHOENIX Pharma-Einkauf GmbH (PPE) and IT GmbH. This is to be established across the board at the distribution centres in 2015.
Sustainable training and knowledge sharing as a foundation for successFor the PHOENIX group, providing targeted support for our employees and managers is key to the success of the Group as a whole. This is why the Company offers a wide variety of training measures to foster both professional and personal development.
In Germany, the PHOENIX Academy offers employees and managers a varied seminar programme, where they can choose from management training and collaboration, communication and work techniques through to technical seminars. The programme is continuously added to and adjusted to meet needs accordingly. The newest additions include expansions in the area of “Health” as well as the inclusion of Warehouse Excellence training sessions, which are important for implementing the PHOENIX FORWARD programme.
Employees in the pharmacy retail business also benefit from a training concept that is tailored to them. The ENGAGE programme, designed especially for BENU pharmacies, was initially launched in Switzerland and the Czech Republic. Employees at Apotek 1 and rowlands pharmacy also have the opportunity to participate in comprehensive knowledge training sessions, which were developed based on the group-wide best practice sharing.
44 GROUP MANAGEMENT REPORT I Business and economic environment
PHOENIX group

For both managers and employees aiming for a managerial position, the PHOENIX group offers special advanced training opportunities. Young employees with management potential just starting out on their professional career are taught the basics in the junior development programme, which is split into four modules. The third group took part in the junior development programme in the past fiscal year and the next will begin their training in 2015. The German management development programme for experienced employees is set to run for the sixth time in 2015. This programme aims to develop skills in the area of personnel management, change management, strategy and entrepreneurial leadership.
The convergence of the PHOENIX group at an international level is being supported with the help of the European Management Development Programme. This group-wide personnel development scheme is run in collaboration with the Mannheim Business School and Malik Management Zentrum St. Gallen. In March 2014, the second group completed the programme and received certification. Plans are for the next participants to start with the first module in 2015.
Since 2012, the PHOENIX group has given around 100 of its highest-level managers the opportunity to develop their skills in a targeted manner and to expand their network with its Top Management Education Programme. The programme was run in cooperation with the renowned IESE Business School in Barcelona under the motto “Growing Entrepreneurial Competencies” and was focused on a variety of business-related areas. Application-oriented workshops served to put the theoretical knowledge into practice. This resulted in a range of valuable project ideas, which were pursued further after consultation with management or have already been realised. The programme ended in October 2014.
In addition to providing strategic developmental support for its employees, the PHOENIX group relies on group-wide and interdisciplinary knowledge sharing, allowing profitable concepts and measures to find use across borders. The best practice sharing concept is being gradually expanded and supported.
Regular PHOENIX International Management meetings provide the platform for constructive, open com-munication between the management of foreign companies as well as between upper management with international responsibility. Employees at all levels also have the opportunity to share their sugges-tions and ideas with the chairman of the management board directly or receive information first-hand during the CEO lunch.
Adding to this, various knowledge-sharing measures were implemented at the local companies. In order to also promote this across borders, efforts included holding workshops in 17 countries each with colleagues from other distribution centres (pull forwards). Such exchanges can help recognise potential for increasing efficiency and performance which can then be implemented. The overall aim is to establish a permanent optimisation process.
Possibilities for starting a career at the PHOENIX groupFor the PHOENIX group, it is crucial to retain loyal, qualified and responsible employees in the Company in order to secure young talent in the long term. To ensure this, the Group offers a variety of possibilities for trainees and graduates to start their career at PHOENIX.
45Business and economic environment I GROUP MANAGEMENT REPORT
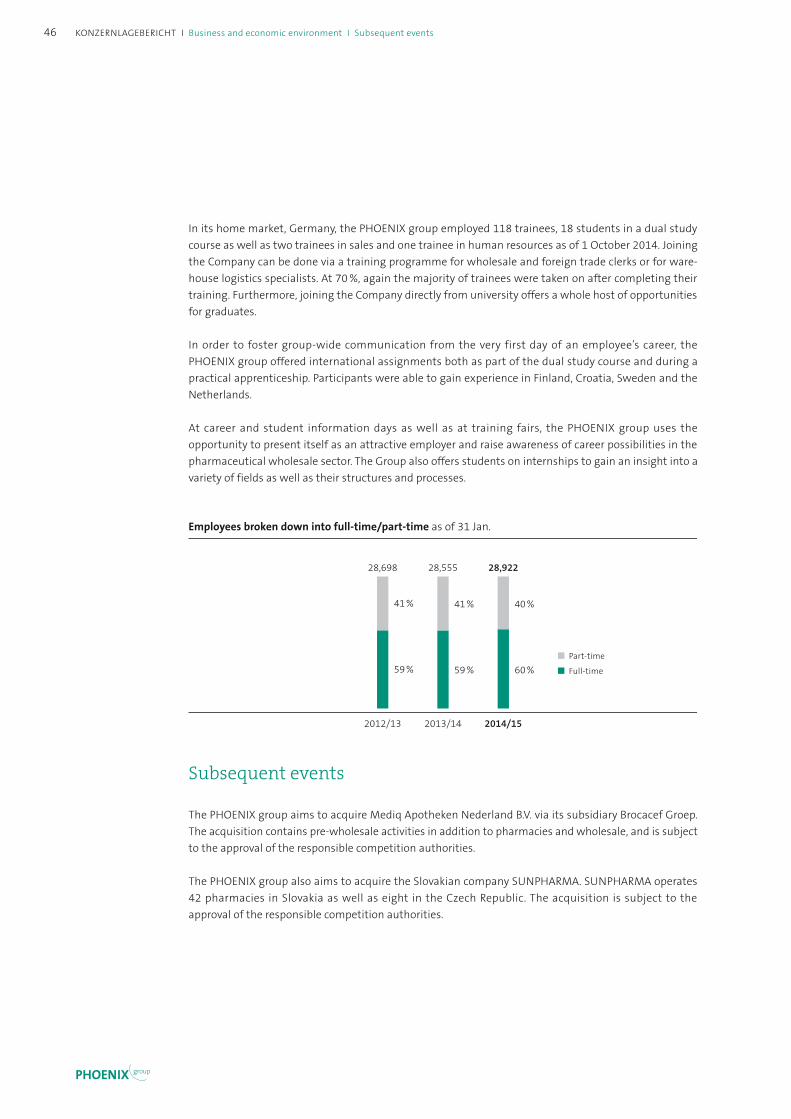
In its home market, Germany, the PHOENIX group employed 118 trainees, 18 students in a dual study course as well as two trainees in sales and one trainee in human resources as of 1 October 2014. Joining the Company can be done via a training programme for wholesale and foreign trade clerks or for ware-house logistics specialists. At 70 %, again the majority of trainees were taken on after completing their training. Furthermore, joining the Company directly from university offers a whole host of opportunities for graduates.
In order to foster group-wide communication from the very first day of an employee’s career, the PHOENIX group offered international assignments both as part of the dual study course and during a practical apprenticeship. Participants were able to gain experience in Finland, Croatia, Sweden and the Netherlands.
At career and student information days as well as at training fairs, the PHOENIX group uses the opportunity to present itself as an attractive employer and raise awareness of career possibilities in the pharmaceutical wholesale sector. The Group also offers students on internships to gain an insight into a variety of fields as well as their structures and processes.
28,698 28,555 28,922
2012/13 2013/14 2014/15
Employees broken down into full-time/part-time as of 31 Jan.
59 % 60 %59 %
41 % 40 %41 %
Part-time
Full-time
Subsequent events
The PHOENIX group aims to acquire Mediq Apotheken Nederland B.V. via its subsidiary Brocacef Groep. The acquisition contains pre-wholesale activities in addition to pharmacies and wholesale, and is subject to the approval of the responsible competition authorities.
The PHOENIX group also aims to acquire the Slovakian company SUNPHARMA. SUNPHARMA operates 42 pharmacies in Slovakia as well as eight in the Czech Republic. The acquisition is subject to the approval of the responsible competition authorities.
46
PHOENIX group
KONZERNLAGEBERICHT I Business and economic environment I Subsequent events

Risks and opportunities
Risk management system allows for swift action. // Quality and stabil-ity of operating processes as basis for operating business. // Assigning all customers a risk classification as basis for uniform and optimised accounts receivable management. // Leading market position in pharmaceutical wholesale in most European countries. // Continuous implementation of best practices in Europe.
Risks
The risk management system within the PHOENIX group consists of fully documented and comprehensive planning, approval and reporting structures and an early warning system. The internal audit department examines this system regularly for adequacy, operability and efficiency. Findings made by the internal audit department are reported to management on a regular basis.
The PHOENIX group is subject to market risks. As a rule, the pharmaceutical market is less affected by cyclical swings than other industries, but the loss of purchasing power and cost-saving measures in government spending on healthcare can have a negative impact on the market and the Group’s business.
The amended Hungarian pharmacies act that came into effect on 1 January 2012 requires pharmacists to hold an investment of at least 25 % in their pharmacies’ capital as of 1 January 2014; as of 1 January 2017, pharmacists will have to hold a majority interest in their pharmacies. In this context, the PHOENIX group had to reduce its shareholding in 126 investments in pharmacies, which it did by 31 December 2013.
The earnings situation in the wholesale pharmaceutical business is also heavily influenced by the terms and conditions granted to customers and by suppliers. These depend in particular on the intensity of competition in the individual countries, which is why they are continually monitored on the sales and purchasing side.
In the operating business, the quality and stability of the operating processes is decisive. In many areas, there are contingency plans for maintaining operations even in the event of unforeseen interruptions. The standardisation of the IT systems also helps ensure the stability of the operating processes.
Credit risk and accounts receivable managementThe credit risk at the PHOENIX group, measured in relation to total receivables, is comparatively low as healthcare institutions generally have a good credit rating. Regardless of this, payment terms in the healthcare sector tend to vary from one country to another, with customary longer payment terms in southern and eastern Europe. The risk is also usually distributed over a large number of customer relationships. In the course of liberalisation of the pharmacy markets in Europe, however, pharmacy chains and new sales channels are increasingly emerging, creating a large number of major customers with a higher level of receivables outstanding.
47Risks and opportunities I GROUP MANAGEMENT REPORT

Accounts receivables management, for which a group-wide directive is used, is constantly being refined. It standardises the allocation of all customers into risk classes. The assessment incorporates information from sales and finance, and relevant indicators are systematically taken into account. The risk assess-ment of existing and new customers is monitored on an ongoing basis using external and internal data. Based on the risk classification, clearly defined process steps and responsibilities apply for each class to enable an immediate response in the event of receivables becoming past due. This makes for standard-ised and optimised management. Particular importance is attached to the compilation of customer data with respect to pharmacy chains in order to prevent apparently independent pharmacies forming an undetected cluster risk due to the ownership structure or economic factors. The policy will be put into practice throughout the organisation through corresponding policies on the separation of functions and the definition of interfaces between sales and accounts receivable management as well as a clear defini-tion of approval requirements. Overall, the group-wide policy will improve group-wide control of the credit risk by means of standardised portfolio management adapted to local requirements and reflecting the risk-bearing capacity of each country.
Acquisition projects are continually subject to analysisThe PHOENIX group’s strategy is to acquire pharmacies and wholesale companies to expand its market position. As a result, the Group is exposed to legal, fiscal, financial and operational risks from acquisi-tions. Acquisition projects are therefore analysed and reviewed by the central mergers & acquisitions department before they are approved by management. It may, however, happen that developments anticipated at the date of acquisition differ from the reality. This can, in turn, lead to an impairment loss being recognised on goodwill in the course of impairment testing.
Legal risksThe PHOENIX group operates in 25 European countries. In light of its strong market position, there is a risk that competitive authorities will occasionally decide in a way that is unfavourable for PHOENIX. Trade with pharmaceutical products requires compliance with certain legal requirements in the different countries. Infringements of these requirements may result in corresponding sanctions by the authorities.
Financial risksIn a financing context, PHOENIX is exposed to various risks.
In the course of the refinancing concluded in June 2012, certain financial covenants were agreed, the breach of which presents a risk to financing. The development of liabilities and covenants is monitored regularly as a result. In fiscal year 2014/15, the agreed covenants were comfortably complied with.
Derivatives are used to hedge against interest rate and currency risks. Their use is monitored intensively on a timely basis. Derivative financial instruments are only used for hedging purposes; counterparty risks are minimised by the careful selection of trading partners.
The agreements underlying our corporate bonds contain restrictions and obligations for the PHOENIX group as issuer as are customary in the market. Failure to comply with these restrictions and obligations could result in the amount of the bond plus the interest accrued falling due.
As regards the currency translation risk, the exchange rates of the pound sterling and the Norwegian krone are of relevance for the PHOENIX group. Currency transaction risks are relevant in some eastern European countries where deliveries by the pharmaceutical manufacturers are sometimes invoiced in
48 GROUP MANAGEMENT REPORT I Risks and opportunities
PHOENIX group
euro and sometimes in US dollar. For the Group, however, these are not material. Fluctuations on the financial markets may also lead to deficits in the pension funds and the inherent risk of an unplanned increase in personnel expenses.
Tax risksThe companies of the PHOENIX group based in Germany are subject to tax field audits. Foreign subsidi-aries are subject to the audit requirements of their local tax authorities. Tax back payments cannot be ruled out as a result of tax audits performed at German and foreign companies.
Please also refer to the comments in the notes to the consolidated financial statements.
Opportunities
Demographic trends and medical progress are key growth drivers for the pharmaceutical markets. The broad geographic diversification of the PHOENIX group reduces the impact of changes in healthcare policy in individual markets and provides a strong basis for successfully developing activities further.
Thanks to its broad geographical coverage, for instance, the PHOENIX group can offer the pharmaceuti-cal industry Europe-wide services.
Strong market position in wholesaleThe PHOENIX group holds a leading market position in pharmaceutical wholesale in almost all countries in which the Company operates. It is market leader in a large number of countries and has a particularly strong position in northern and eastern Europe and Germany. There, no competitor has comparable country coverage or market position.
In addition, the PHOENIX group can fall back on long-established partnerships with pharmacy customers. Many customers take part in cooperation programmes. In some countries, the PHOENIX group also offers franchise systems for independent pharmacies. This can have a positive effect on revenue development, among other things. Well-positioned in a stable marketThe integration of the wholesale and retail pharmaceutical business offers opportunities, allowing cost savings in pharmaceutical sales channels.
In the logistics business unit, the PHOENIX group continuously implements best practices across Europe. Process optimisation measures that are successful in one country serve as a starting point for improve-ment measures in other countries and can help to reduce costs there.
The sound financing structure has established the financial prerequisites for the future growth of the PHOENIX group. This applies as regards both organic growth and appropriate acquisitions.
Overall, the PHOENIX group operates in a stable market with substantial opportunities and is well positioned to successfully make use of these in order to expand its strong market position in the future.
The risks and opportunities in the pharmaceutical retail business are not subject to any major changes over time.
49Risks and opportunities I GROUP MANAGEMENT REPORT
Forecast
Stable economic environment with growing GDP in Germany. // Expansion of market position through organic growth and acquisitions. // Revenue growth expected in Germany, Western and Eastern Europe. // Adjusted EBITDA for 2015/16 at the level of the prior-year value adjusted for special effects from pensions. // Further increase in efficiency for positive business development of the PHOENIX group in the long term.
We anticipate a stable economic environment in 2015, with GDP in Germany expected to grow by between 1 % and 2 %. Moderate GDP growth is also expected in the rest of Europe. We do not anticipate any noticeable increase in inflation or interest rates in 2015.
We expect the pharmaceutical markets in Europe to record market growth of around 2 % overall in 2015. In Germany, our largest market, we anticipate market growth of approximately 3 %.
For the fiscal year 2015/16, the PHOENIX group expects to further expand its market position in Europe through organic growth and acquisitions and thereby increase revenue slightly above the level of growth on the European pharmaceutical markets. We anticipate revenue growth primarily in Germany, Western Europe and Eastern Europe, while we expect revenue to remain stable in Northern Europe.
Without the non-recurring income in connection with the change in the accounting method for pension obligations, adjusted EBITDA amounted to EUR 499.1m in fiscal year 2014/15. Despite major challenges, we expect adjusted EBITDA to reach somewhere around this level in 2015/16. The consolidation of Mediq is not included in these figures. Among other factors, effects of the German minimum wage coming into effect as of January will have a negative effect.
The equity ratio is expected to again increase slightly mainly as a result of the planned earnings course.
Management is convinced that the PHOENIX group is well positioned to achieve a positive business development in the medium and long term. In addition to the organic and acquisition-related growth, increasing efficiency will also be an important contributing factor.
Mannheim, 2 April 2015
Management of the unlimited partnerPHOENIX Verwaltungs GmbH
Oliver Windholz Helmut Fischer Frank Große-Natrop Stefan Herfeld
50 GROUP MANAGEMENT REPORT I Forecast
PHOENIX group

Consolidated financial statements 2014/15
Consolidated income statement 52
Consolidated statement of comprehensive income 53
Consolidated statement of financial position 54
Consolidated statement of cash flows 56
Consolidated statement of changes in equity 58 Notes to the consolidated financial statements 60 General 60 Notes to the income statement 78 Notes to the statement of financial position 83 Other notes 104
Audit opinion 120
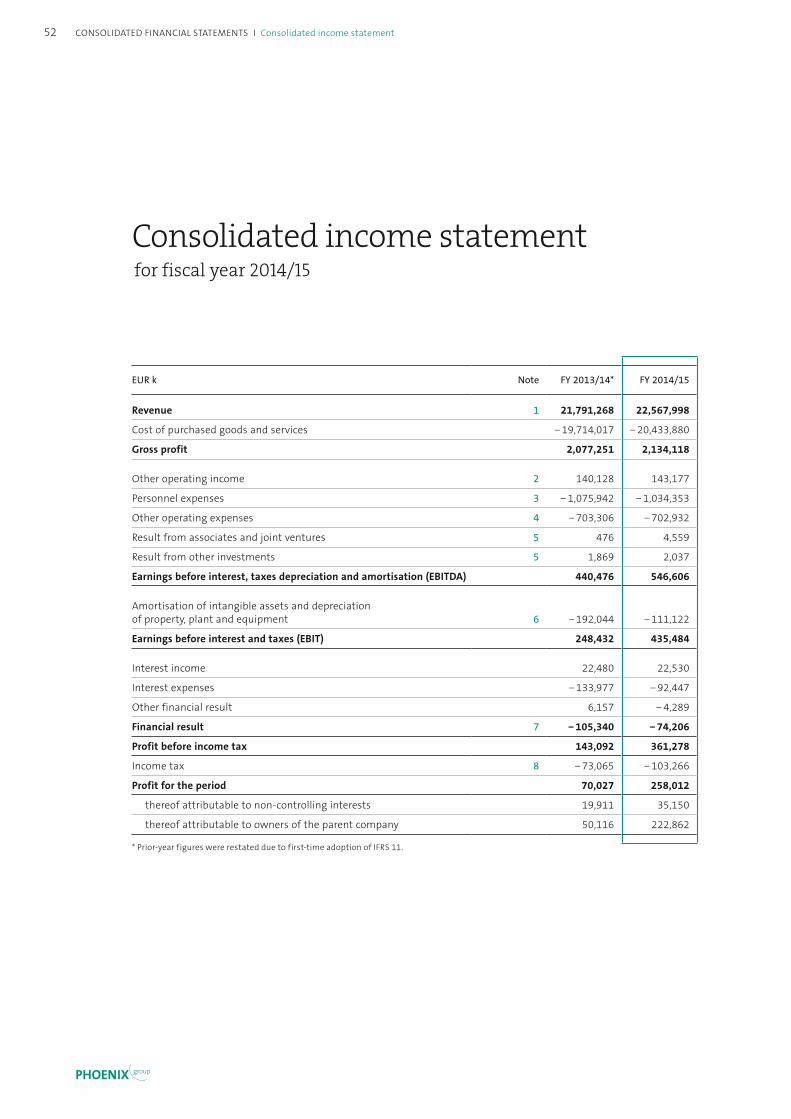
Consolidated income statement for fiscal year 2014/15
EUR k Note FY 2013/14* FY 2014/15
Revenue 1 21,791,268 22,567,998
Cost of purchased goods and services − 19,714,017 − 20,433,880
Gross profit 2,077,251 2,134,118
Other operating income 2 140,128 143,177
Personnel expenses 3 − 1,075,942 − 1,034,353
Other operating expenses 4 − 703,306 − 702,932
Result from associates and joint ventures 5 476 4,559
Result from other investments 5 1,869 2,037
Earnings before interest, taxes depreciation and amortisation (EBITDA) 440,476 546,606
Amortisation of intangible assets and depreciation of property, plant and equipment 6 − 192,044 − 111,122
Earnings before interest and taxes (EBIT) 248,432 435,484
Interest income 22,480 22,530
Interest expenses − 133,977 − 92,447
Other financial result 6,157 − 4,289
Financial result 7 − 105,340 − 74,206
Profit before income tax 143,092 361,278
Income tax 8 − 73,065 − 103,266
Profit for the period 70,027 258,012
thereof attributable to non-controlling interests 19,911 35,150
thereof attributable to owners of the parent company 50,116 222,862
* Prior-year figures were restated due to first-time adoption of IFRS 11.
52
PHOENIX group
CONSOLIDATED FINANCIAL STATEMENTS I Consolidated income statement
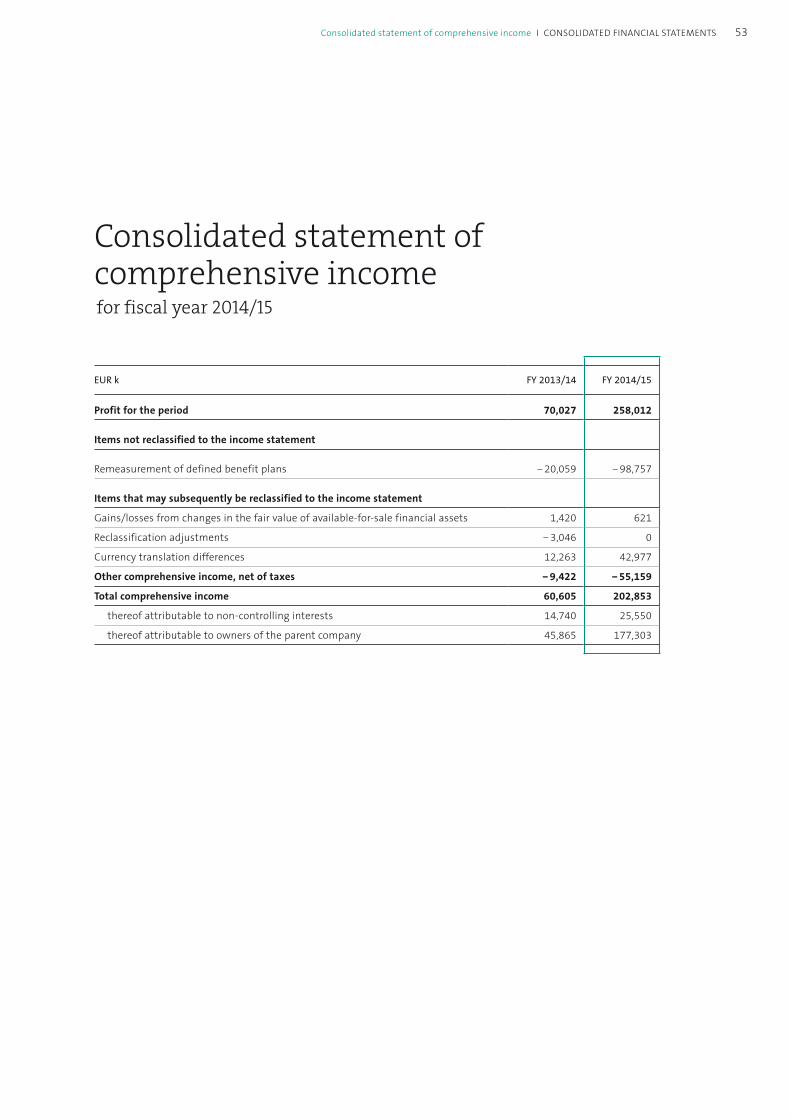
Consolidated statement of comprehensive income for fiscal year 2014/15
EUR k FY 2013/14 FY 2014/15
Profit for the period 70,027 258,012
Items not reclassified to the income statement
Remeasurement of defined benefit plans − 20,059 − 98,757
Items that may subsequently be reclassified to the income statement
Gains/losses from changes in the fair value of available-for-sale financial assets 1,420 621
Reclassification adjustments − 3,046 0
Currency translation differences 12,263 42,977
Other comprehensive income, net of taxes − 9,422 − 55,159
Total comprehensive income 60,605 202,853
thereof attributable to non-controlling interests 14,740 25,550
thereof attributable to owners of the parent company 45,865 177,303
53Consolidated statement of comprehensive income I CONSOLIDATED FINANCIAL STATEMENTS

Consolidated statement of financial position as of 31 January 2015
ASSETS
EUR k Note 31 Jan. 2014* 31 Jan. 2015
Non-current assets
Intangible assets 9 1,455,099 1,532,355
Property, plant and equipment 10 791,169 788,141
Investment property 11 2,493 7,023
Investments in associates and joint ventures 12 17,948 18,646
Trade receivables 0 1,072
Other financial assets 13 72,658 70,393
Deferred tax assets 8 118,713 118,024
Income tax receivables 4,573 4,573
2,462,653 2,540,227
Current assets
Inventories 14 1,764,494 1,841,101
Trade receivables 15 2,353,127 2,435,111
Income tax receivables 22,702 44,417
Other receivables and other current financial assets 15 177,290 187,141
Other assets 16 80,738 103,087
Cash and cash equivalents 17 494,454 567,449
4,892,805 5,178,306
Non-current assets held for sale 24 3,365 856
Total assets 7,358,823 7,719,389
* Prior-year figures were restated due to first-time adoption of IFRS 11 and the finalisation of a purchase price allocation.
54
PHOENIX group
CONSOLIDATED FINANCIAL STATEMENTS I Consolidated statement of financial position
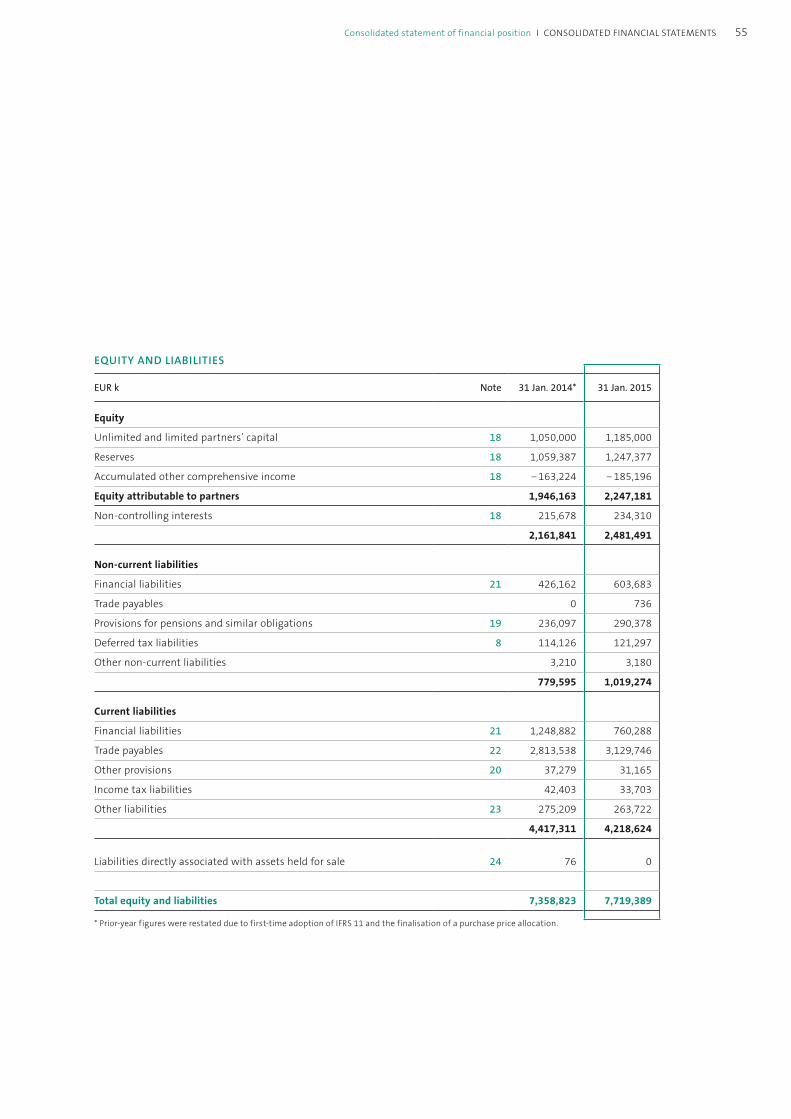
EQUITY AND LIABILITIES
EUR k Note 31 Jan. 2014* 31 Jan. 2015
Equity
Unlimited and limited partners’ capital 18 1,050,000 1,185,000
Reserves 18 1,059,387 1,247,377
Accumulated other comprehensive income 18 − 163,224 − 185,196
Equity attributable to partners 1,946,163 2,247,181
Non-controlling interests 18 215,678 234,310
2,161,841 2,481,491
Non-current liabilities
Financial liabilities 21 426,162 603,683
Trade payables 0 736
Provisions for pensions and similar obligations 19 236,097 290,378
Deferred tax liabilities 8 114,126 121,297
Other non-current liabilities 3,210 3,180
779,595 1,019,274
Current liabilities
Financial liabilities 21 1,248,882 760,288
Trade payables 22 2,813,538 3,129,746
Other provisions 20 37,279 31,165
Income tax liabilities 42,403 33,703
Other liabilities 23 275,209 263,722
4,417,311 4,218,624
Liabilities directly associated with assets held for sale
24 76 0
Total equity and liabilities 7,358,823 7,719,389
* Prior-year figures were restated due to first-time adoption of IFRS 11 and the finalisation of a purchase price allocation.
55Consolidated statement of financial position I CONSOLIDATED FINANCIAL STATEMENTS

Consolidated statement of cash flows for fiscal year 2014/15
EUR k 31 Jan. 2014* 31 Jan. 2015
Net profit/loss for the period 70,027 258,012
+/– Write-downs/write-ups of fixed assets 192,044 111,122
–/+ Gain/loss from the disposal of fixed assets 167 − 3,300
+/– Increase/decrease in non-current provisions − 1,957 − 6,496
+/– Other non-cash expenses/income 73,258 − 43,850
+ Interest result 111,497 69,917
+ Taxes 73,065 103,275
– Interest paid − 108,846 − 78,909
+ Interest received 20,784 21,655
– Income taxes paid − 80,625 − 78,646
+ Dividends received 1,938 1,241
Result before changes in working capital 351,352 354,021
Changes in working capital 65,606 33,857
Cash inflow (+)/outflow (−) from operating activities 416,958 387,878
– Cash paid for the purchase of consolidated companies and business units − 21,373 − 19,368
+ Cash received from the sale of consolidated companies and business units 6,912 898
+ Cash received from disposals of non-current assets 24,424 6,394
− Cash paid for investments in non-current assets − 122,907 − 134,149
Cash inflow (+)/outflow (–) from investing activities − 112,944 − 146,225
* Prior-year figures were restated due to first-time adoption of IFRS 11.
56
PHOENIX group
CONSOLIDATED FINANCIAL STATEMENTS I Consolidated statement of cash flows

EUR k 31 Jan. 2014* 31 Jan. 2015
Cash available for financing activities 304,014 241,653
+ Capital increase 0 124,065
+ Capital contribution from non-controlling interests 54 0
− Payments to non-controlling interests (dividends) − 3,441 − 5,955
+ Cash received from the issue of loans from related parties 45,000 0
− Repayment of borrowings from related parties − 141,000 0
− Acquisition of additional shares in already consolidated companies − 30 − 1,209
+/− Increase/decrease in ABS/factoring liabilities − 10,977 67,078
+/− Increase/decrease in loans to partners in the parent company 0 − 123,766
+ Cash received from the issue of bonds and loans 486,467 632,543
− Cash repayments of bonds and loans − 516,260 − 859,096
+/− Increase/decrease in finance lease liabilities − 1,156 − 1,446
Cash inflow (+)/outflow (–) from financing activities − 141,343 − 167,786
Change in cash and cash equivalents 162,671 73,867
Cash and cash equivalents at the beginning of the period 333,598 494,458
Exchange rate effect on cash and cash equivalents − 1,811 − 876
Cash and cash equivalents at the end of the period 494,458 567,449
* Prior-year figures were restated due to first-time adoption of IFRS 11.
57Consolidated statement of cash flows I CONSOLIDATED FINANCIAL STATEMENTS
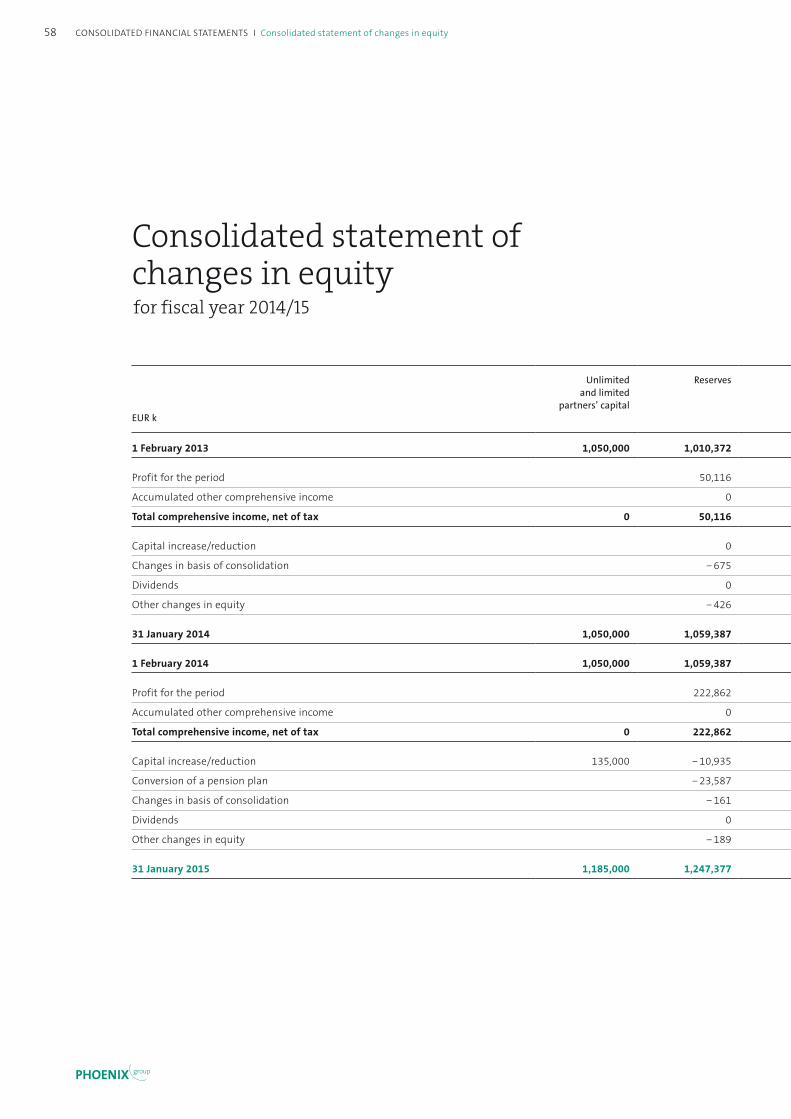
Consolidated statement of changes in equity for fiscal year 2014/15
EUR k
Unlimited and limited
partners’ capital
Reserves
Currency translation differences
IAS 39 Availableforsale
financial assets
Remeasurement of defined
benefit plans
Equity attributable to partners
Noncontrolling interests
Total equity
1 February 2013 1,050,000 1,010,372 − 96,244 9,215 − 71,944 1,901,399 202,401 2,103,800
Profit for the period 50,116 50,116 19,911 70,027
Accumulated other comprehensive income 0 12,348 − 1,232 − 15,367 − 4,251 − 5,171 − 9,422
Total comprehensive income, net of tax 0 50,116 12,348 − 1,232 − 15,367 45,865 14,740 60,605
Capital increase/reduction 0 0 249 249
Changes in basis of consolidation − 675 − 675 1,371 696
Dividends 0 0 − 3,441 − 3,441
Other changes in equity − 426 − 426 358 − 68
31 January 2014 1,050,000 1,059,387 − 83,896 7,983 − 87,311 1,946,163 215,678 2,161,841
1 February 2014 1,050,000 1,059,387 − 83,896 7,983 − 87,311 1,946,163 215,678 2,161,841
Profit for the period 222,862 222,862 35,150 258,012
Accumulated other comprehensive income 0 42,487 607 − 88,653 − 45,559 − 9,600 − 55,159
Total comprehensive income, net of tax 0 222,862 42,487 607 − 88,653 177,303 25,550 202,853
Capital increase/reduction 135,000 − 10,935 124,065 79 124,144
Conversion of a pension plan − 23,587 23,587 0 0
Changes in basis of consolidation − 161 − 161 − 260 − 421
Dividends 0 0 − 5,925 − 5,925
Other changes in equity − 189 − 189 − 812 − 1,001
31 January 2015 1,185,000 1,247,377 − 41,409 8,590 − 152,377 2,247,181 234,310 2,481,491
58
PHOENIX group
CONSOLIDATED FINANCIAL STATEMENTS I Consolidated statement of changes in equity
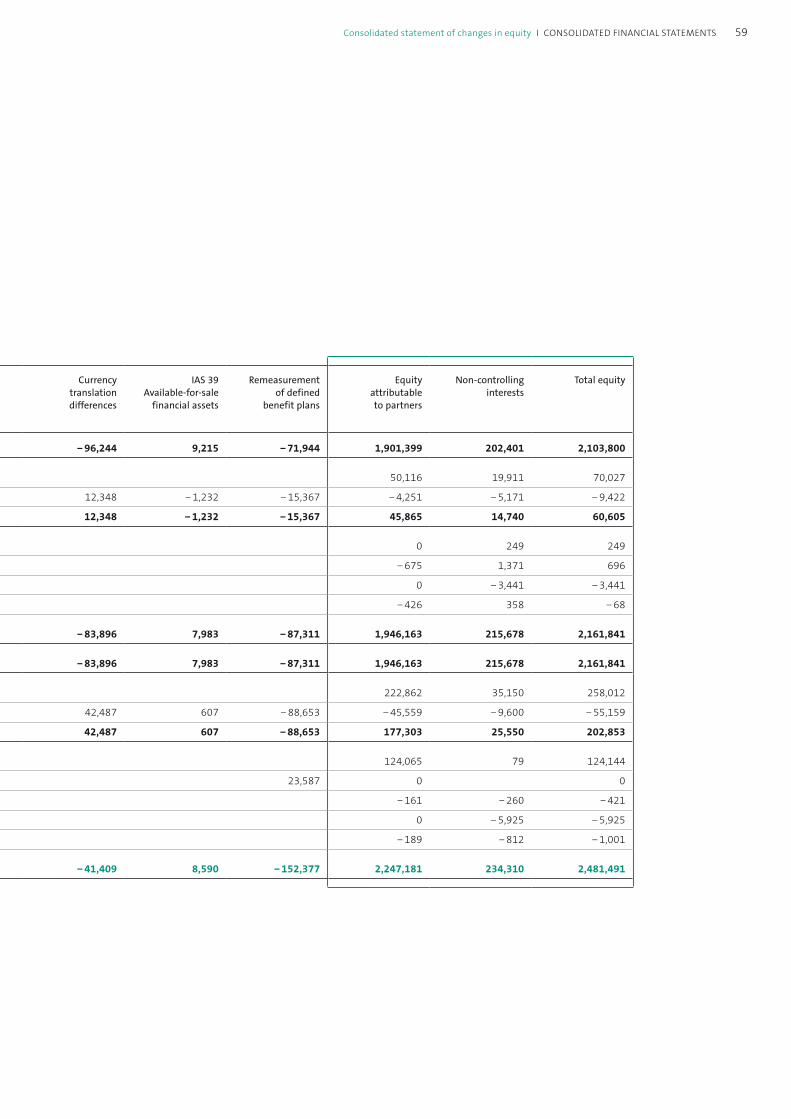
EUR k
Unlimited and limited
partners’ capital
Reserves
Currency translation differences
IAS 39 Availableforsale
financial assets
Remeasurement of defined
benefit plans
Equity attributable to partners
Noncontrolling interests
Total equity
1 February 2013 1,050,000 1,010,372 − 96,244 9,215 − 71,944 1,901,399 202,401 2,103,800
Profit for the period 50,116 50,116 19,911 70,027
Accumulated other comprehensive income 0 12,348 − 1,232 − 15,367 − 4,251 − 5,171 − 9,422
Total comprehensive income, net of tax 0 50,116 12,348 − 1,232 − 15,367 45,865 14,740 60,605
Capital increase/reduction 0 0 249 249
Changes in basis of consolidation − 675 − 675 1,371 696
Dividends 0 0 − 3,441 − 3,441
Other changes in equity − 426 − 426 358 − 68
31 January 2014 1,050,000 1,059,387 − 83,896 7,983 − 87,311 1,946,163 215,678 2,161,841
1 February 2014 1,050,000 1,059,387 − 83,896 7,983 − 87,311 1,946,163 215,678 2,161,841
Profit for the period 222,862 222,862 35,150 258,012
Accumulated other comprehensive income 0 42,487 607 − 88,653 − 45,559 − 9,600 − 55,159
Total comprehensive income, net of tax 0 222,862 42,487 607 − 88,653 177,303 25,550 202,853
Capital increase/reduction 135,000 − 10,935 124,065 79 124,144
Conversion of a pension plan − 23,587 23,587 0 0
Changes in basis of consolidation − 161 − 161 − 260 − 421
Dividends 0 0 − 5,925 − 5,925
Other changes in equity − 189 − 189 − 812 − 1,001
31 January 2015 1,185,000 1,247,377 − 41,409 8,590 − 152,377 2,247,181 234,310 2,481,491
59Consolidated statement of changes in equity I CONSOLIDATED FINANCIAL STATEMENTS
General
The Company
PHOENIX Pharmahandel GmbH & Co KG, Mannheim, Germany (“PHOENIX” or the “PHOENIX Group”) is a European pharmaceuticals distribution group. PHOENIX has business activities in 25 European countries. In several countries, PHOENIX also operates pharmacy chains of its own. The registered office is located in Mannheim, Germany.
Basis of presentation
The consolidated financial statements of the PHOENIX group have been prepared in accordance with the version of the International Financial Reporting Standards (IFRSs) as issued by the International Accounting Standards Board (IASB), London, that is valid on the reporting date and endorsed by the European Union, the interpretations of the IFRS Interpretations Committee (IFRS IC) and the additional requirements of German commercial law pursuant to Sec. 315a HGB [“Handelsgesetzbuch”: German Commercial Code].
The consolidated financial statements are presented in euros (EUR) and all values are rounded to the nearest thousand (EUR k), except when otherwise indicated.
The consolidated financial statements have been prepared on a historical cost basis. This does not apply to derivative financial instruments and available-for-sale financial assets which are measured at fair value. The income statement was prepared using the nature of expense method. The statement of financial position has been classified into current and non-current items in line with IAS 1. For the sake of clarity certain items in the statement of financial position and the income statement are summarised. Details of these items are presented in the notes to the financial statements.
The consolidated financial statements of PHOENIX as of 31 January 2015 and the year then ended were authorised for issue on 2 April 2015 by the management of PHOENIX Pharmahandel GmbH & Co KG.
Application of new accounting standards and changes in accounting policies
In fiscal year 2014/15, PHOENIX applied the following revised standards and interpretations that are mandatory for the fiscal year 2014/15 for the first time:
IFRS 10 Consolidated Financial StatementsIFRS 10 introduces a uniform consolidation model for all entities based on the concept of control. Control exists when an investor has decision-making power, is exposed, or has rights, to variable returns and has the ability to affect those returns through its power. IFRS 10 replaces the provisions of IAS 27 and SIC 12. Adoption of the new standards does not have any effect for the PHOENIX group.
IFRS 11 Joint ArrangementsIFRS 11 provides new rules for accounting for jointly controlled activities. Under joint arrangements, a distinction is made between joint ventures and joint operations. For joint ventures, only the equity method pursuant to IAS 28
Notes to the consolidated financial statements as of 31 January 2015
60
PHOENIX group
Consolidated finanCial statements i notes to the consolidated financial statements
may be used. Through the first-time adoption of this provision, two (prior year: two) previously proportionately consolidated entities were included in the consolidated financial statements using the equity method in fiscal year 2014/15. The effect on the consolidated financial statements of the PHOENIX group is immaterial. The prior-year figures have been restated accordingly.
IFRS 12 Disclosure of Interests in Other EntitiesIFRS 12 regulates disclosure requirements for subsidiaries, joint arrangements, associates as well as consolidated and non-consolidated structured entities. First-time adoption of this standard resulted in additional disclosures (see note 12).
IAS 32 Offsetting Financial Assets and Financial LiabilitiesThe amendment clarifies details related to the offsetting of financial assets and financial liabilities. Offsetting requires an unconditional right to offset in the normal course of business as well as in the event of default or insolvency of one of the counterparties. The amendment did not have any effect on the consolidated financial statements of the PHOENIX group.
IFRIC 21 LeviesIFRIC 21 deals with the issue of accounting for public levies which do not represent income taxes within the meaning of IAS 12 as well as fines or other penalties and clarifies in particular when obligations to pay such levies are recognised as liabilities or provisions in the financial statements. Adoption of IFRIC 21 did not have any effect on the consolidated financial statements of the PHOENIX group.
Standards, interpretations and amendments issued, but not yet adopted
The IASB and IFRS IC have adopted the standards and interpretations listed below, whose application is not yet mandatory for the fiscal year 2014/15 or have not yet been endorsed by the European Commission in some cases as of the reporting date.
Standard/ interpretation Effective as of the fiscal year
Endorsed by the EU
IFRS 9 Financial Instruments: Classification and Measurement 2018/19 No
IFRS 14 Regulatory Deferral Accounts 2016/17 No
IFRS 15 Revenue from Contracts with Customers 2017/18 No
IAS 1 Initiative to improve disclosure requirements 2016/17 No
Amendments to IFRS 10 and IAS 28
Sale or Contribution of Assets between an Investor and its Associate or Joint Venture
2016/17 No
Amendments to IFRS 11
Accounting for Acquisitions of Interests in Joint Operations
2016/17 No
Amendments to IAS 16 and IAS 38
Clarification of Acceptable Methods of Depreciation and Amortisation
2016/17 No
Amendments to IAS 19 Defined Benefit Plans: Employee Contributions 2015/16 Yes
IFRIC 21 Levies 2015/16 Yes
Annual IFRS Improvements
2010 to 2012 cycle 2015/16 Yes
Annual IFRS Improvements
2011 to 2013 cycle 2015/16 Yes
Annual IFRS Improvements
2012 to 2014 cycle 2016/17 No
61Notes to the consolidated financial statements i CoNsolidated fiNaNCial statemeNts
The first-time adoption of IFRS 14 will not have any effect on the consolidated financial statements as the PHOENIX group does not have any regulatory deferral accounts.
We expect the application of IAS 1 to reduce the number of disclosures in the consolidated financial statements.
The amendment to IAS 16 clarifies that a depreciation method of property, plant and equipment that is based on revenue is not appropriate. The amendment to IAS 38 introduces the rebuttable presumption that revenue is not an appropriate basis for the amortisation of intangible assets. We assume that a straight-line method of amortisation allows the most reliable measure of the decline in value of economic benefit. We are therefore not affected by the amendments to IAS 16 and IAS 38.
The amendment to IAS 19 clarifies how employee contributions or third-party contributions to defined benefit plans are accounted for, with the accounting treatment depending on whether the contributions depend on the number of years of service or not. A solution facilitating the accounting practice is also granted if the amount of the contributions is not dependent on the number of years of service. We do not currently expect that the amendments to IAS 19 will have any material effects on the consolidated financial statements.
IFRIC 21 provides guidance on when a payment of the levy, as identified by government legislation, is to be recognised. We assume that IFRIC 21 will not have any effect on the consolidated financial statements of the PHOENIX group.
We do not expect the first-time adoption of the Annual Improvements to IFRSs – 2010 to 2012 Cycle and 2011 to 2013 Cycle – to have any material effects on the consolidated financial statements of the PHOENIX group.
As regards the other standards and interpretations, we are currently examining how they might affect the consolidated financial statements of the PHOENIX group in future.
Basis of consolidation
The consolidated financial statements comprise the financial statements of PHOENIX and its subsidiaries as of 31 January 2015 and the year then ended.
Subsidiaries are fully consolidated from the date of acquisition, being the date on which the Group obtains control. Entities continue to be consolidated until the date that such control by the parent company ceases.
PHOENIX obtains control over another company when it can exercise power over the investee, is exposed, or has rights, to variable returns on its involvement with the investee and has the ability to affect the amount of those returns through its power over the investee.
The financial statements of most of the subsidiaries are prepared for the same reporting period as the parent company, using consistent accounting policies. Only the entities in Norway, Luxembourg, Bulgaria, Serbia, Bosnia and Macedonia as well as entities in Hungary have 31 December as their reporting date; one entity in Finland has 30 June as its reporting date. In general there is no material impact on the financial statements; this notwith-standing, any material impact is taken into account.
62
PHOENIX group
Consolidated finanCial statements i notes to the consolidated financial statements
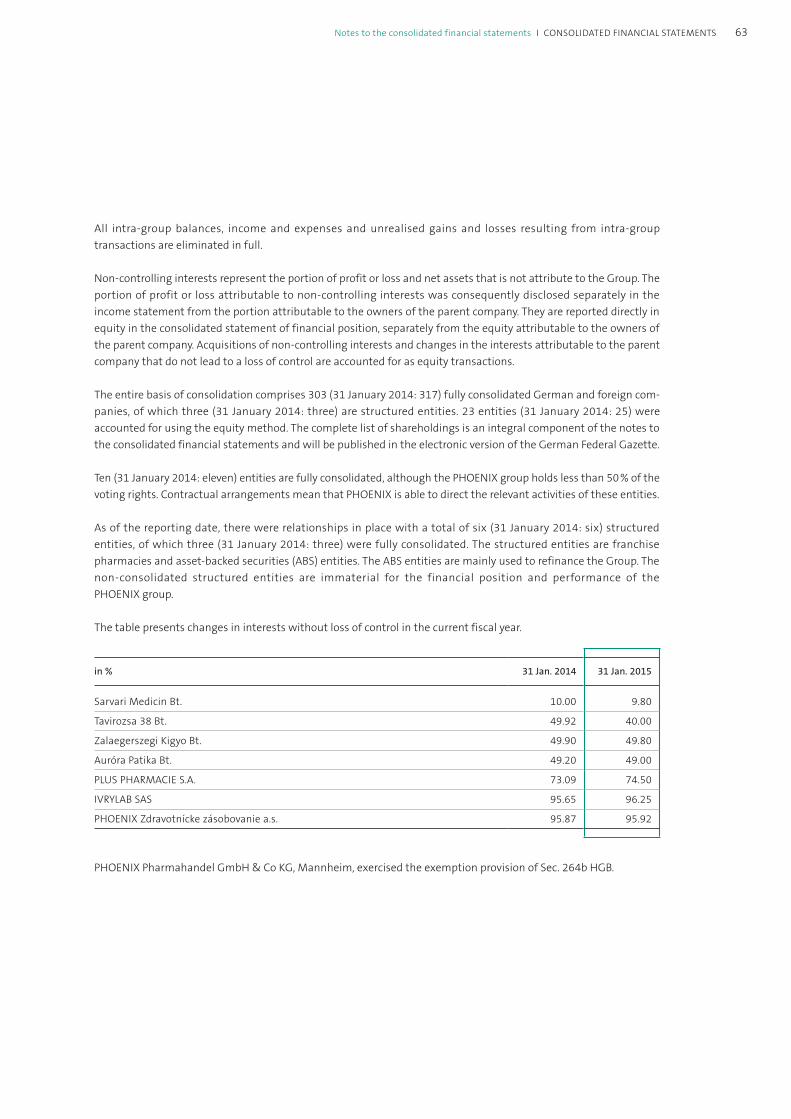
All intra-group balances, income and expenses and unrealised gains and losses resulting from intra-group transactions are eliminated in full.
Non-controlling interests represent the portion of profit or loss and net assets that is not attribute to the Group. The portion of profit or loss attributable to non-controlling interests was consequently disclosed separately in the income statement from the portion attributable to the owners of the parent company. They are reported directly in equity in the consolidated statement of financial position, separately from the equity attributable to the owners of the parent company. Acquisitions of non-controlling interests and changes in the interests attributable to the parent company that do not lead to a loss of control are accounted for as equity transactions.
The entire basis of consolidation comprises 303 (31 January 2014: 317) fully consolidated German and foreign com-panies, of which three (31 January 2014: three) are structured entities. 23 entities (31 January 2014: 25) were accounted for using the equity method. The complete list of shareholdings is an integral component of the notes to the consolidated financial statements and will be published in the electronic version of the German Federal Gazette.
Ten (31 January 2014: eleven) entities are fully consolidated, although the PHOENIX group holds less than 50 % of the voting rights. Contractual arrangements mean that PHOENIX is able to direct the relevant activities of these entities.
As of the reporting date, there were relationships in place with a total of six (31 January 2014: six) structured entities, of which three (31 January 2014: three) were fully consolidated. The structured entities are franchise pharmacies and asset-backed securities (ABS) entities. The ABS entities are mainly used to refinance the Group. The non-consolidated structured entities are immaterial for the financial position and performance of the PHOENIX group.
The table presents changes in interests without loss of control in the current fiscal year.
in % 31 Jan. 2014 31 Jan. 2015
Sarvari Medicin Bt. 10.00 9.80
Tavirozsa 38 Bt. 49.92 40.00
Zalaegerszegi Kigyo Bt. 49.90 49.80
Auróra Patika Bt. 49.20 49.00
PLUS PHARMACIE S.A. 73.09 74.50
IVRYLAB SAS 95.65 96.25
PHOENIX Zdravotnícke zásobovanie a.s. 95.87 95.92
PHOENIX Pharmahandel GmbH & Co KG, Mannheim, exercised the exemption provision of Sec. 264b HGB.
63Notes to the consolidated financial statements i CoNsolidated fiNaNCial statemeNts

Business combinations and goodwillBusiness combinations are accounted for using the acquisition method. The cost of the business combination corresponds to the fair value of the assets given, the equity instruments issued and the liabilities incurred and assumed as of the date of exchange. It also includes the fair value of any recognised asset or liability resulting from a contingent consideration arrangement. Acquisition-related costs are expensed as incurred. On initial recognition of an acquisition, all identifiable assets, liabilities and contingent liabilities are measured at acquisition-date fair value. For each business combination, the Group decides on a case-by-case basis whether the non-controlling inter-ests in the acquiree are measured at fair value or the proportionate share in the recognised amounts of the acquiree’s net identifiable assets.
Any difference between (i) the aggregate of cost of the business combination, any non-controlling interest in the acquiree and the acquisition-date fair value of any previously held equity interests; and (ii) the fair value of the net identifiable assets acquired is recognised under goodwill. Following initial recognition, goodwill is valued at cost less cumulative impairment charges and not amortised. Goodwill is subjected to an impairment test at least once annually at the reporting date or whenever there is any indication of impairment.
If the cost of acquisition is less than the fair value of the net assets of the subsidiary acquired as of the acquisition date, the difference is recognised directly in the income statement.
Currency translation
The consolidated financial statements are presented in euros, which is also the parent company’s functional currency. This is the currency of the primary economic environment in which PHOENIX operates.
Transactions in foreign currency are translated to the functional currency at the rate prevailing on the transaction date. Monetary items denominated in foreign currencies are translated at the rate of exchange prevailing at the reporting date. All exchange differences are taken to the income statement, provided they are not allocable to monetary items denominated in foreign currency which are part of a net investment in a foreign operation, in which case the exchange differences are recorded in other comprehensive income.
The assets and liabilities of group entities whose functional currency is not the euro are translated to euro at the rate of exchange prevailing as of the reporting date and their income statements are translated at average rates. The exchange differences arising on the translation are recorded in other comprehensive income until the subsidiaries are disposed of.
64
PHOENIX group
Consolidated finanCial statements i notes to the consolidated financial statements
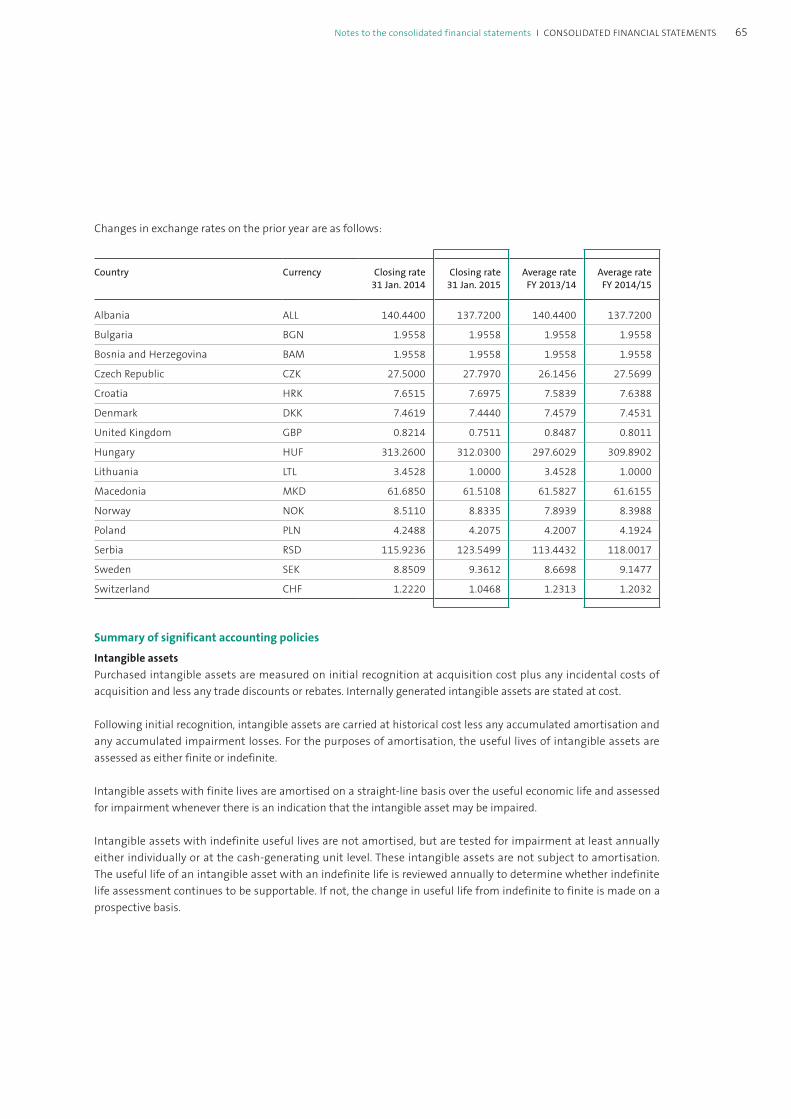
Changes in exchange rates on the prior year are as follows:
Country Currency Closing rate 31 Jan. 2014
Closing rate 31 Jan. 2015
Average rate FY 2013/14
Average rate FY 2014/15
Albania ALL 140.4400 137.7200 140.4400 137.7200
Bulgaria BGN 1.9558 1.9558 1.9558 1.9558
Bosnia and Herzegovina BAM 1.9558 1.9558 1.9558 1.9558
Czech Republic CZK 27.5000 27.7970 26.1456 27.5699
Croatia HRK 7.6515 7.6975 7.5839 7.6388
Denmark DKK 7.4619 7.4440 7.4579 7.4531
United Kingdom GBP 0.8214 0.7511 0.8487 0.8011
Hungary HUF 313.2600 312.0300 297.6029 309.8902
Lithuania LTL 3.4528 1.0000 3.4528 1.0000
Macedonia MKD 61.6850 61.5108 61.5827 61.6155
Norway NOK 8.5110 8.8335 7.8939 8.3988
Poland PLN 4.2488 4.2075 4.2007 4.1924
Serbia RSD 115.9236 123.5499 113.4432 118.0017
Sweden SEK 8.8509 9.3612 8.6698 9.1477
Switzerland CHF 1.2220 1.0468 1.2313 1.2032
Summary of significant accounting policies
Intangible assetsPurchased intangible assets are measured on initial recognition at acquisition cost plus any incidental costs of acquisition and less any trade discounts or rebates. Internally generated intangible assets are stated at cost.
Following initial recognition, intangible assets are carried at historical cost less any accumulated amortisation and any accumulated impairment losses. For the purposes of amortisation, the useful lives of intangible assets are assessed as either finite or indefinite.
Intangible assets with finite lives are amortised on a straight-line basis over the useful economic life and assessed for impairment whenever there is an indication that the intangible asset may be impaired.
Intangible assets with indefinite useful lives are not amortised, but are tested for impairment at least annually either individually or at the cash-generating unit level. These intangible assets are not subject to amortisation. The useful life of an intangible asset with an indefinite life is reviewed annually to determine whether indefinite life assessment continues to be supportable. If not, the change in useful life from indefinite to finite is made on a prospective basis.
65Notes to the consolidated financial statements i CoNsolidated fiNaNCial statemeNts

Pharmacy licenses with indefinite useful lives grant open-ended protection for the sale of drugs and other pharmaceuticals products in the related territory under public law. All other pharmacy licenses are granted for periods ranging between 3 and 30 years depending on the specific license.
The useful lives of the main types of intangible assets are as follows:
Pharmacy licenses indefinite or 3 to 30 years Software 3 to 5 years Trademarks indefinite or 18 years
Property, plant and equipmentProperty, plant and equipment are carried at historical cost less accumulated depreciation and any accumulated impairment losses. Maintenance and repair costs are expensed as incurred. Borrowing costs that are directly attributable to the acquisition, construction or production of a qualifying asset are capitalised. A qualifying asset is an asset that necessarily takes a substantial period of time to get ready for its intended use or sale.
With the exception of land, property, plant and equipment are depreciated over the expected useful life. Items of property, plant and equipment are depreciated pro rata in the year of acquisition. The residual values, useful lives and the depreciation method are reviewed at least at the end of each reporting period.
The useful lives of the main types of tangible assets are as follows:
Buildings 25 to 50 years Technical equipment and machinery 5 to 14 years Other equipment, fixtures and fittings 3 to 13 years
Investment propertyInvestment property is property held to earn rentals and/or for capital appreciation. It is recognised at cost less depreciation and any impairment losses using the cost method as for property, plant and equipment.
Investments in associatesAn associate is an entity over which the Group can exercise significant influence. Significant influence is the power to participate in the financial and operating policy decisions of the investee, where there is neither control nor joint control over the entity in decision-making processes. Investments in associates are reported using the equity method and initially measured at cost. Goodwill relating to associates is included in the carrying amount of the investment and is not amortised or tested for impairment separately.
The income statement reflects the Group’s share of the associates’ profit or loss for the period. Where there has been a change recognised directly in the equity of the associates, the Group recognises its share of any changes and discloses this, when applicable, in the statement of changes in equity. Any unrealised gains and losses resulting from transactions between the Group and the associates are eliminated to the extent of the interest in the associates.
66
PHOENIX group
Consolidated finanCial statements i notes to the consolidated financial statements
Where necessary, adjustments are made to bring the accounting policies in line with those of the Group.
After application of the equity method, the Group determines whether it is necessary to recognise an additional impairment loss on the Group’s investment in its associates. The Group determines at each reporting date whether there is any objective evidence that the investment in the associate is impaired. If this is the case the Group calculates the amount of impairment as the difference between the recoverable amount of the investment in the associate and its carrying amount and recognises the difference in the income statement.
Non-current assets held for sale Non-current assets or disposal groups are classified as held for sale if their carrying amounts will be recovered principally through a very likely sale transaction. They are measured at the lower of their carrying amount or fair value less cost to sell.
Impairment of non-financial assetsProperty, plant and equipment and intangible assets with finite useful lives are reviewed at each reporting date to determine whether there is any indication that they may be impaired. If this is the case, the recoverable amount of the asset is determined. The recoverable amount is the higher of fair value less costs to sell and value in use. If the carrying amount exceeds the recoverable amount, an impairment loss is recognised in profit or loss for the difference between the carrying amount and the recoverable amount. For the purpose of impairment testing, assets are allocated to the smallest identifiable group of assets that generates cash inflows. If the cash flows are not separately identifiable for an asset, the impairment test is performed on the basis of the cash-generating unit to which the asset belongs.
If the reasons for an impairment loss no longer apply, it is reversed up to the new recoverable amount. The upper limit for the reversal of impairment losses is the amortised cost that would have been determined if no impairment losses had been charged.
For impairment testing, goodwill is assigned to the cash-generating units. Impairment testing of cash-generating units is performed at least once a year or whenever there is any indication that the carrying amount of a cash- generating unit may exceed the recoverable amount. Where the recoverable amount of the cash-generating unit falls short of the carrying amount of its net assets, an impairment loss is recognised in accordance with the requirements of IAS 36. Impairment losses recognised on goodwill may not be reversed in subsequent periods.
The recoverable amount of the cash-generating units (or groups of cash-generating units) is determined on the basis of value in use. Free cash flows are discounted using the weighted average cost of capital. The free cash flows are based on financial budgets approved by management covering a detailed planning period of four years.
Impairment losses are recognised on intangible assets with indefinite useful lives according to the same principles. If the reasons for an impairment loss no longer apply, it is reversed up to the new recoverable amount.
67Notes to the consolidated financial statements i CoNsolidated fiNaNCial statemeNts
Financial assets and financial liabilities (financial instruments)Measurement and recognition of financial assets and financial liabilitiesFinancial instruments are recognised when PHOENIX becomes a party to the contractual provisions of the instrument. Regular way purchases are recognised on the settlement date.
Financial assets and financial liabilities are recognised initially at fair value plus, in the case of investments not at fair value through profit or loss, directly attributable transaction costs. The fair value of financial instruments that are actively traded in organised financial markets is determined by reference to quoted market prices at the close of business on the reporting date. For financial instruments where there is no active market, fair value is determined using valuation techniques. Such techniques may include using recent arm’s length market transactions; reference to the current fair value of another instrument that is substantially the same; discounted cash flow analysis or other valuation models.
At initial recognition financial assets are classified as loans and receivables, held-to-maturity investments, available-for-sale financial assets or financial assets at fair value through profit or loss. The subsequent measurement and recognition of financial assets depends on their classification.
Other financial assets classified as available-for-sale financial assets in accordance with IAS 39 are measured at fair value with unrealised gains or losses recognised in other comprehensive income. Financial assets for which no quoted market price is available, and whose fair value cannot be reliably measured, are carried at cost. When the asset is derecognised, the cumulative gain or loss recorded in equity is recognised in the income statement. If the asset is determined to be impaired, the cumulative loss recorded in equity is recognised in the income statement. Non-derivative other financial assets with fixed or determinable payments and fixed maturities are classified as held-to-maturity investments when the Group has the positive intention and ability to hold it to maturity. They are measured at amortised cost.
Trade receivables are classified as loans and receivables and are measured at amortised cost, where appropriate applying the effective interest method. All discernible specific risks and impairment losses are accounted for through the use of an allowance account. Reversals are carried out if the reasons for the impairment no longer apply. Default leads to the immediate derecognition of the receivables.
Other receivables are categorised as loans and receivables and are measured at amortised cost. Amortised cost is computed using the effective interest method less any allowance for impairment and principal repayment or reduction. Gains and losses are recognised when the loans are derecognised or impaired, as well as through the amortisation process due to the effective interest method. All discernible specific risks and impairment losses related to customer loans are accounted for through the use of an allowance account.
At initial recognition financial liabilities are classified as financial liabilities at amortised cost or as financial liabilities at fair value through profit or loss.
68
PHOENIX group
Consolidated finanCial statements i notes to the consolidated financial statements
Financial liabilities and trade payables are carried at amortised cost using the effective interest method, if appropriate. Gains and losses are recognised when the liabilities are derecognised. The gain or loss on the hedged item in a fair value hedge under IAS 39 attributable to the hedged risk leads to an adjustment of the carrying amount of the hedged item.
The Group has not designated any non-derivative financial assets or financial liabilities at fair value through profit or loss.
Financial guarantee contracts issued by the Group are those contracts that require a payment to be made to reim-burse the holder for a loss it incurs because the specified debtor fails to make a payment when due in accordance with the terms of a debt instrument. Financial guarantee contracts are recognised initially as a liability at fair value, adjusted for transaction costs that are directly attributable to the issuance of the guarantee. Subsequently, the liability is measured at the higher of the best estimate of the expenditure required to settle the present obligation at the reporting date and the amount recognised less cumulative amortisation.
The Group has not issued any financial guarantees for a consideration.
Impairment of financial assetsThe Group assesses at each reporting date whether there is objective evidence that a financial asset or a group of assets is impaired. Financial assets that are not measured at fair value through profit or loss are deemed to be impaired if there is objective evidence of impairment (e.g. debtors are experiencing significant financial difficulty, default or delinquency in interest or principal payments, the probability that they will enter bankruptcy or other financial reorganisation and where observable data indicate that there is a measurable decrease in the estimated future cash flows, such as changes in arrears or economic conditions that correlate with defaults). PHOENIX assesses individually whether objective evidence of impairment exists for financial assets. Furthermore assets are included in a group of financial assets with similar credit risk characteristics and are assessed collectively for impairment. Any impairment loss is recognised in profit or loss.
Financial assets measured at amortised cost are impaired when the present value of estimated future cash flows is lower than the carrying amount. The present value of the estimated future cash flows is discounted at the financial asset’s original effective interest rate. In case of a variable interest rate, the discount rate for measuring any impair-ment loss is the current effective interest rate.
Impairment losses of available-for-sale financial assets are measured as the difference between the acquisition cost and the current fair value, less any impairment loss previously recognised in the income statement. Any impairment loss is removed from equity and recognised in the income statement. If, in a subsequent period, the fair value increases and the increase can be objectively related to an event occurring after the impairment loss was recognised in the income statement, the impairment loss is reversed through the income statement. In the case of equity investments classified as available-for-sale, objective evidence would include a significant or prolonged decline in the fair value of the investment below its cost. Impairment losses charged on equity instruments are not reversed through the income statement, but are recognised in other comprehensive income.
69Notes to the consolidated financial statements i CoNsolidated fiNaNCial statemeNts

Derecognition of financial instrumentsA financial asset is derecognised when the rights to receive cash flows from the asset have expired. In addition a financial asset is derecognised when the Group has transferred its rights to receive cash flows from the asset or has assumed an obligation to pay the received cash flows in full without material delay to a third party under a “pass-through” arrangement; and either the Group has transferred substantially all the risks and rewards of the asset, or has neither transferred nor retained substantially all the risks and rewards of the asset, but has transferred control of the asset.
A financial liability is derecognised when the obligation under the liability is discharged or cancelled, or expires.
PHOENIX sells significant volumes of receivables through securitisation programmes or factoring transactions. When the receivables sold do not meet IAS 39 derecognition requirements the receivables are recognised in the consolidated financial statements even though they have been legally sold. A corresponding financial liability is recorded in the consolidated statement of financial position. Gains and losses related to the sale of such assets are not recognised until the assets are removed from the consolidated statement of financial position. Within certain securitisation programmes PHOENIX has neither transferred nor retained substantially all the risks and rewards of the asset nor transferred control of the asset. These transactions are recognised to the extent of the Group’s continuing involvement.
Derivative financial instruments and hedge accountingThe Group uses derivative financial instruments to hedge its exposure to interest rate and foreign currency risks. Derivatives are initially recognised at fair value on the date on which a derivative contract is entered into and are subsequently remeasured at fair value. Derivatives are carried as financial assets when the fair value is positive and as financial liabilities when the fair value is negative.
Any gains or losses arising during the period from changes in fair value of derivatives that do not qualify for hedge accounting are taken directly to the income statement.
In the case of derivatives with quoted market prices, fair value is the positive or negative fair value, if necessary after any reduction for counterparty risk. If no quoted market prices are available, fair value is estimated on the basis of the conditions obtained at the end of the reporting period, such as interest rates or exchange rates, and using recognised valuation techniques, such as discounted cash flow models or option pricing models.
PHOENIX does not use hedge accounting at present.
InventoriesInventories are initially recognised at cost based on the first in first out (FIFO) method. Costs incurred in bringing each product to its present location and condition are included in cost at initial recognition.
At each reporting date, inventories are measured at the lower of cost or net realisable value. Net realisable value is the estimated selling price in the ordinary course of business, less estimated costs of completion and the estimated costs necessary to make the sale.
70
PHOENIX group
Consolidated finanCial statements i notes to the consolidated financial statements

Cash and cash equivalentsThe item “Cash and cash equivalents” comprises cash on hand, bank balances and short-term deposits, which have a maximum term of three months from the date of acquisition. Cash and cash equivalents are measured at cost.
EquityThe components of equity are recognised in accordance with IAS 32 (rev. 2008). Financial instruments have to be classified on initial recognition as a financial liability, financial asset or an equity instrument in accordance with the substance of the contractual arrangements and the definitions of IAS 32 (2008). The capital contributions of the unlimited and limited partners of PHOENIX Pharmahandel Gesellschaft mit beschränkter Haftung & Co KG (puttable instruments) are classified as equity as all criteria of IAS 32 (2008) were satisfied. The criteria for puttable instruments that should be classified as an equity instrument are:
a) The instrument entitles the holder to a pro rata share of the entity’s net assets in the event of the entity’s liquidation.
b) The instrument is in the class of instruments that is subordinate to all other classes of instruments.
c) All financial instruments in the class of instruments that is subordinate to all other classes of instruments have identical features.
d) Apart from the contractual obligation for the issuer to repurchase or redeem the instrument for cash or another financial asset, the instrument does not include any contractual obligation to deliver cash or another financial asset to another entity, or to exchange financial assets or financial liabilities with another entity under conditions that are potentially unfavourable to the entity, and it is not a contract that will or may be settled in the entity’s own equity instruments as set out in the definitions for financial liabilities in accordance with IAS 32.
e) The total expected cash flows attributable to the instrument over the life of the instrument are based substantially on the profit or loss, the change in the recognised net assets or the change in the fair value of the recognised and unrecognised net assets of the entity over the life of the instrument (excluding any effects of the instruments).
Treasury sharesOwn equity instruments that are reacquired (treasury shares) are recognised at cost and deducted from equity. No gain or loss is recognised in the income statement on the purchase, sale or cancellation of the Group’s own equity instruments. Any difference between the carrying amount and the consideration is recognised in retained earnings.
Pensions and other post-employment benefitsObligations for defined benefit plans are determined using the projected unit credit method in accordance with IAS 19, taking into account not only the pension obligations and vested pension rights known at the reporting date, but also expected future wage and salary increases. The interest rate used to determine the net obligation was set on the basis of high-quality fixed-interest securities with a term to maturity corresponding to the duration of the pension plans in the relevant country. All actuarial gains and losses are recognised in other comprehensive income. Past service cost is expensed immediately.
71Notes to the consolidated financial statements i CoNsolidated fiNaNCial statemeNts
ProvisionsA provision is recognised when there is a present (legal or constructive) obligation towards a third party on the basis of a past event and the obligation can be reliably estimated. Provisions are stated at the amount needed to settle the obligation and are not netted against positive contributions to earnings. If the effect of the time value of money is material, provisions are discounted using a current pre-tax rate that reflects the risks specific to the liability. Where discounting is used, the increase in the provision due to the passage of time is recognised as a finance cost.
Current and deferred taxesThe tax expense of the period comprises current and deferred taxes. Taxes are recognised in the income statement, unless they relate to items recognised directly in equity or in other comprehensive income in which case the taxes are also recognised in equity or in other comprehensive income.
Current income tax chargeCurrent income tax assets and liabilities for the current and prior periods are measured at the amount expected to be recovered from or paid to the taxation authorities.
Deferred income taxesDeferred taxes are recognised for all temporary differences between the tax base of the assets/liabilities and their carrying amounts pursuant to the IFRS financial statements (liability method). Deferred tax assets are also recog-nised on unused tax losses and tax credits. Deferred taxes are measured using the tax rates and tax provisions enacted or substantively enacted by the reporting date and that are expected to apply to the period when the asset is realised or the liability is settled.
Deferred tax assets are recognised to the extent that it is probable that taxable profit will be available against which the deductible temporary differences and unused tax losses can be utilised.
Deferred tax liabilities for taxable temporary differences associated with investments in subsidiaries and associates are recognised, unless the timing of the reversal of the temporary differences can be controlled and it is probable that the temporary differences will not reverse in the foreseeable future.
LeasesLeases are classified either as finance leases or as operating leases. Leases where the Group as lessee retains substantially all the risks and rewards of ownership of the asset are classified as finance leases. In this case the Group recognises the leased asset at the lower of fair value and present value of the minimum lease payments and depreciates the leased asset over the estimated useful life of the asset or the shorter contract term. A corresponding liability is recognised at the same time, which is repaid and reduced in subsequent periods using the effective interest method. All other leases where the Group is the lessee are classified as operating leases. In this case, the lease payments are recognised as an expense on a straight-line basis.
72
PHOENIX group
Consolidated finanCial statements i notes to the consolidated financial statements

Leases where the Group is the lessor and does not transfer substantially all the risks and rewards of ownership of the asset to the lessee are classified as operating leases. Initial direct costs incurred in negotiating and concluding an operating lease are added to the carrying amount of the leased asset and recognised over the lease term on the same basis as the lease income.
Revenue recognitionPHOENIX mainly generates revenue from the sale of pharmaceuticals and related goods and – to a lesser extent – from the rendering of services.
In cases where PHOENIX acts as principal, i.e., has the exposure to the significant risks and rewards associated with the sale of goods, (gross) revenue from the sale of pharmaceuticals and related goods is recorded. Indicators for this case are contract situations in which the Group has the primary responsibility to meet the obligations towards the customer, carries the significant risks and rewards attributable to inventory, has latitude over product pricing and bears the credit risk of the sales transaction.
In cases where the Group acts as an agent revenue is recorded in the amount of the commission. This is the case where, on aggregate, the above indicators are not satisfied. This situation occurs when PHOENIX does not bear substantially all the risks and rewards of ownership of merchandise. Merchandise is then stocked on a commission basis.
Revenue from the sale of pharmaceuticals and related goods is recognised when PHOENIX has transferred to the buyer the significant risks and rewards of ownership of the goods, when it is probable that the economic benefits will flow to the Group and the revenue can be reliably measured. Revenue is measured at the fair value of the consideration received, excluding discounts, rebates, and sales taxes or duty.
Revenue from services is recognised upon performance of the related services.
Government grantsGovernment grants paid as compensation for expenses or losses already incurred are recognised in the period in the income statement in which the corresponding claim arises.
Significant accounting judgements, estimates and assumptions
The preparation of the consolidated financial statements requires management to make judgments, estimates and assumptions. Estimates are made primarily for the measurement of assets, liabilities and contingent liabilities acquired through business combinations, impairment tests according to IAS 36, measurement of provisions for pensions, other provisions as well as income taxes, particularly related to deferred tax assets on the carryforward of unused tax losses. However, uncertainty about these assumptions and estimates could result in outcomes that require a material adjustment to the carrying amount of the asset or liability affected in future periods.
73Notes to the consolidated financial statements i CoNsolidated fiNaNCial statemeNts

The key assumptions and estimates concerning the future and other key sources of estimation uncertainty at the reporting date, that have a significant risk of causing a material adjustment to the carrying amounts of assets and liabilities within the next fiscal year are discussed below.
Impairment of non-financial assetsThe Group’s impairment test for goodwill is principally based on value in use calculations that use a discounted cash flow model (weighted average cost of capital approach). The cash flows are derived from the budget for the next four years and do not include restructuring activities that the Group is not yet committed to or significant future investments that will enhance the asset base of the cash-generating unit being tested.
The recoverable amount is most sensitive to the perpetual capital expenditures and the discount rates used for the discounted cash flow model as well as the expected future cash inflows and the growth rate used for extrapolation purposes.
Intangible assets with indefinite useful lives are based on fair value less costs to sell calculations that use a relief from royalty approach or an EBITDA multiple.
Further details on impairment are disclosed in Note 9.
Deferred tax assetsDeferred tax assets are recognised for all unused tax losses to the extent that it is probable that taxable profit will be available against which the losses can be utilised. Significant management judgement is required to determine the amount of deferred tax assets that can be recognised, based upon the likely timing and the level of future taxable profits together with future tax planning strategies.
Further details on deferred taxes are disclosed in Note 8.
Bad debt allowance for trade receivables and other assetsRecording a bad debt allowance or derecognising receivables and other assets is to a large extent based on judge-ment, taking into account the ability of the debtor to pay outstanding balances.
Further details on bad debt allowances are disclosed in Note 15.
74
PHOENIX group
Consolidated finanCial statements i notes to the consolidated financial statements
Pension benefitsThe cost of defined benefit plans and the present value of the pension obligation are determined using actuarial valuations. Actuarial valuation involves making various assumptions. The actuarial valuation involves making assumptions about interest rates, future salary increases, mortality rates and future pension increases. All assump-tions are reviewed at each reporting date. In determining the appropriate discount rate management considers the interest rates of high-quality fixed-interest securities with a duration corresponding to the pension plans in the related country. The mortality rate is based on publicly available mortality tables for the specific country.
Future salary increases and pension increases are based on expected future inflation rates for the respective countries.
Further details about the assumptions used are given in Note 19.
Fair value of financial instrumentsWhere the fair value of financial assets and financial liabilities recorded in the statement of financial position can-not be derived from active markets, they are determined using valuation techniques including the discounted cash flow model. The inputs to these models are taken from observable markets where possible, but where this is not feasible, a degree of judgment is required in establishing fair values. The judgments include considerations of inputs such as liquidity risk, credit risk and volatility. Changes in assumptions about these factors could affect the reported fair value of financial instruments.
Further details on financial instruments can be found in the note “Additional information on financial instruments”.
Revenue recognitionUnder IAS 18, the gross versus net sales presentation of distribution agreements with pharmaceuticals suppliers depends on whether the Group acts as a principal or an agent. This judgement requires among others an estimation of the risks and rewards related to inventories and trade receivables incurred by PHOENIX in the context of these distribution agreements.
Further details on revenue are disclosed in Note 1.
Business combinations
The business combinations carried out in fiscal year 2014/15 and fiscal year 2013/14 are explained below. Business combinations are initially accounted for using the acquisition method pursuant to IFRS 3 “Business Combinations”.
In fiscal year 2014/15, the cumulative profit for the period of the Group’s acquirees came to EUR 147k and revenue to EUR 36,102k. Had the acquisition date coincided with the beginning of the reporting period for all business com-binations, cumulative revenue for the period would have come to EUR 54,580k. Had the acquisition date coincided with the beginning of the reporting period for all business combinations, the cumulative profit for the period would have come to EUR 1,321k.
75Notes to the consolidated financial statements i CoNsolidated fiNaNCial statemeNts

The table below shows a summary of their fair values:
Fair value recognised as of the acquisition date
EUR k Other
Cash and cash equivalents 30,582
Equity instruments 0
Acquisition-date fair value of previously held equity interests 873
Total cost 31,455
Intangible assets 7
Other non-current assets 2,772
Inventories 4,648
Trade receivables 2,485
Cash and cash equivalents 4,067
Other current assets 2,445
Non-current liabilities 2,688
Current liabilities 8,028
Net assets 5,708
Non-controlling interests − 124
Net assets acquired 5,832
Bargain purchase 0
Goodwill 25,623
Other business combinationsIn fiscal year 2014/15, the Group mainly acquired additional pharmacies in business combinations that are individually immaterial.
Other business combinations include contingent consideration of EUR 540k (maximum amount expected).
In the course of business combinations achieved in stages, a profit of EUR 483k was obtained from the remeasure-ment of the share in equity held prior to the acquisition date.
The goodwill arising on those acquisitions, which mainly results from expected synergies or location advantages, was allocated to the cash-generating units Norway (EUR 6,993k), Czech Republic (EUR 5,661k), Netherlands (EUR 4,608k), Switzerland (EUR 4,421k), Serbia (EUR 3,903k) and Germany (EUR 37k) and is managed in the local functional currencies (CZK, CHF, NOK and EUR).
Non-controlling interests were recognised at the proportionate identifiable net assets in the acquirees.
EUR 7,005k of the recognised goodwill from business combinations is expected to be tax deductible.
76
PHOENIX group
Consolidated finanCial statements i notes to the consolidated financial statements
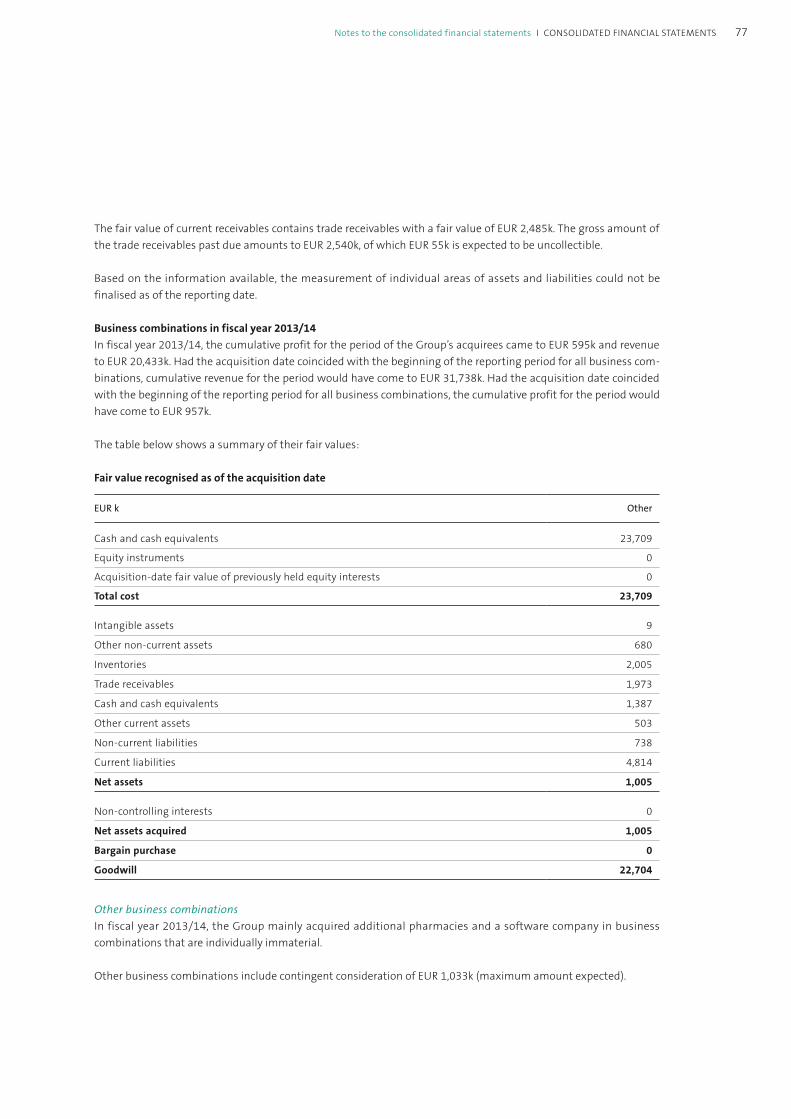
The fair value of current receivables contains trade receivables with a fair value of EUR 2,485k. The gross amount of the trade receivables past due amounts to EUR 2,540k, of which EUR 55k is expected to be uncollectible.
Based on the information available, the measurement of individual areas of assets and liabilities could not be finalised as of the reporting date.
Business combinations in fiscal year 2013/14In fiscal year 2013/14, the cumulative profit for the period of the Group’s acquirees came to EUR 595k and revenue to EUR 20,433k. Had the acquisition date coincided with the beginning of the reporting period for all business com-binations, cumulative revenue for the period would have come to EUR 31,738k. Had the acquisition date coincided with the beginning of the reporting period for all business combinations, the cumulative profit for the period would have come to EUR 957k.
The table below shows a summary of their fair values:
Fair value recognised as of the acquisition date
EUR k Other
Cash and cash equivalents 23,709
Equity instruments 0
Acquisition-date fair value of previously held equity interests 0
Total cost 23,709
Intangible assets 9
Other non-current assets 680
Inventories 2,005
Trade receivables 1,973
Cash and cash equivalents 1,387
Other current assets 503
Non-current liabilities 738
Current liabilities 4,814
Net assets 1,005
Non-controlling interests 0
Net assets acquired 1,005
Bargain purchase 0
Goodwill 22,704
Other business combinationsIn fiscal year 2013/14, the Group mainly acquired additional pharmacies and a software company in business combinations that are individually immaterial.
Other business combinations include contingent consideration of EUR 1,033k (maximum amount expected).
77Notes to the consolidated financial statements i CoNsolidated fiNaNCial statemeNts
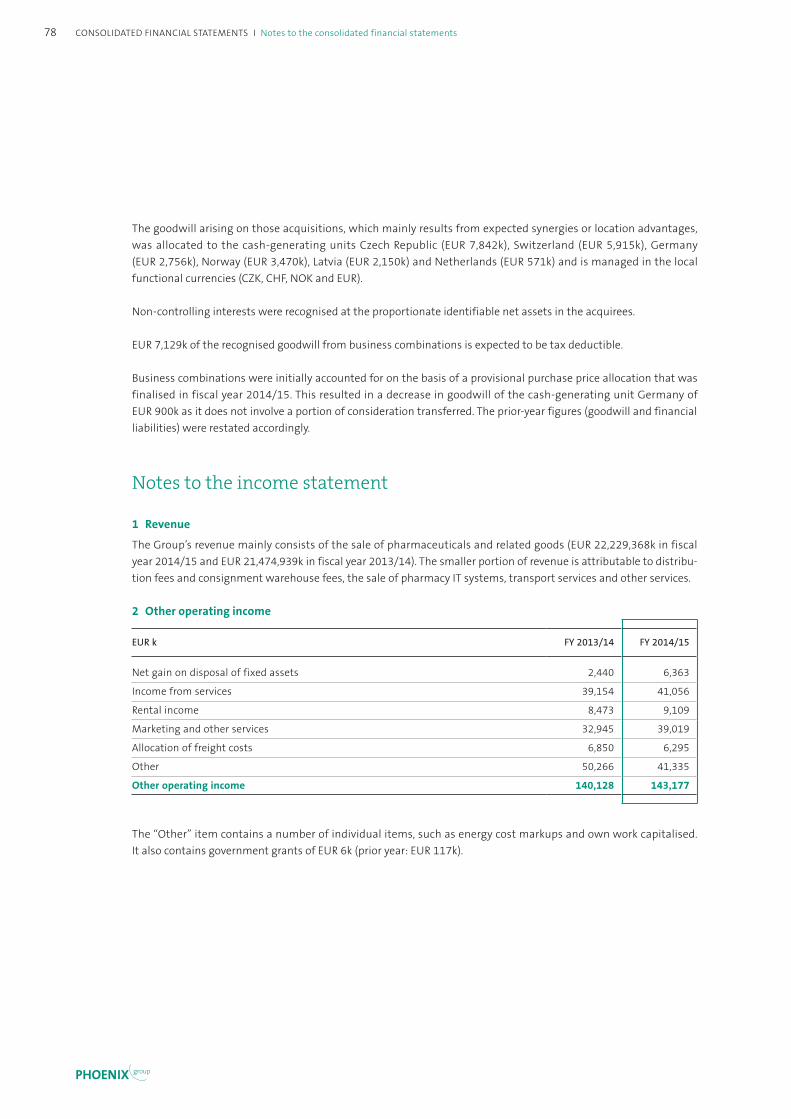
The goodwill arising on those acquisitions, which mainly results from expected synergies or location advantages, was allocated to the cash-generating units Czech Republic (EUR 7,842k), Switzerland (EUR 5,915k), Germany (EUR 2,756k), Norway (EUR 3,470k), Latvia (EUR 2,150k) and Netherlands (EUR 571k) and is managed in the local functional currencies (CZK, CHF, NOK and EUR).
Non-controlling interests were recognised at the proportionate identifiable net assets in the acquirees.
EUR 7,129k of the recognised goodwill from business combinations is expected to be tax deductible.
Business combinations were initially accounted for on the basis of a provisional purchase price allocation that was finalised in fiscal year 2014/15. This resulted in a decrease in goodwill of the cash-generating unit Germany of EUR 900k as it does not involve a portion of consideration transferred. The prior-year figures (goodwill and financial liabilities) were restated accordingly.
Notes to the income statement
1 Revenue
The Group’s revenue mainly consists of the sale of pharmaceuticals and related goods (EUR 22,229,368k in fiscal year 2014/15 and EUR 21,474,939k in fiscal year 2013/14). The smaller portion of revenue is attributable to distribu-tion fees and consignment warehouse fees, the sale of pharmacy IT systems, transport services and other services.
2 Other operating income
EUR k FY 2013/14 FY 2014/15
Net gain on disposal of fixed assets 2,440 6,363
Income from services 39,154 41,056
Rental income 8,473 9,109
Marketing and other services 32,945 39,019
Allocation of freight costs 6,850 6,295
Other 50,266 41,335
Other operating income 140,128 143,177
The “Other” item contains a number of individual items, such as energy cost markups and own work capitalised. It also contains government grants of EUR 6k (prior year: EUR 117k).
78
PHOENIX group
Consolidated finanCial statements i notes to the consolidated financial statements
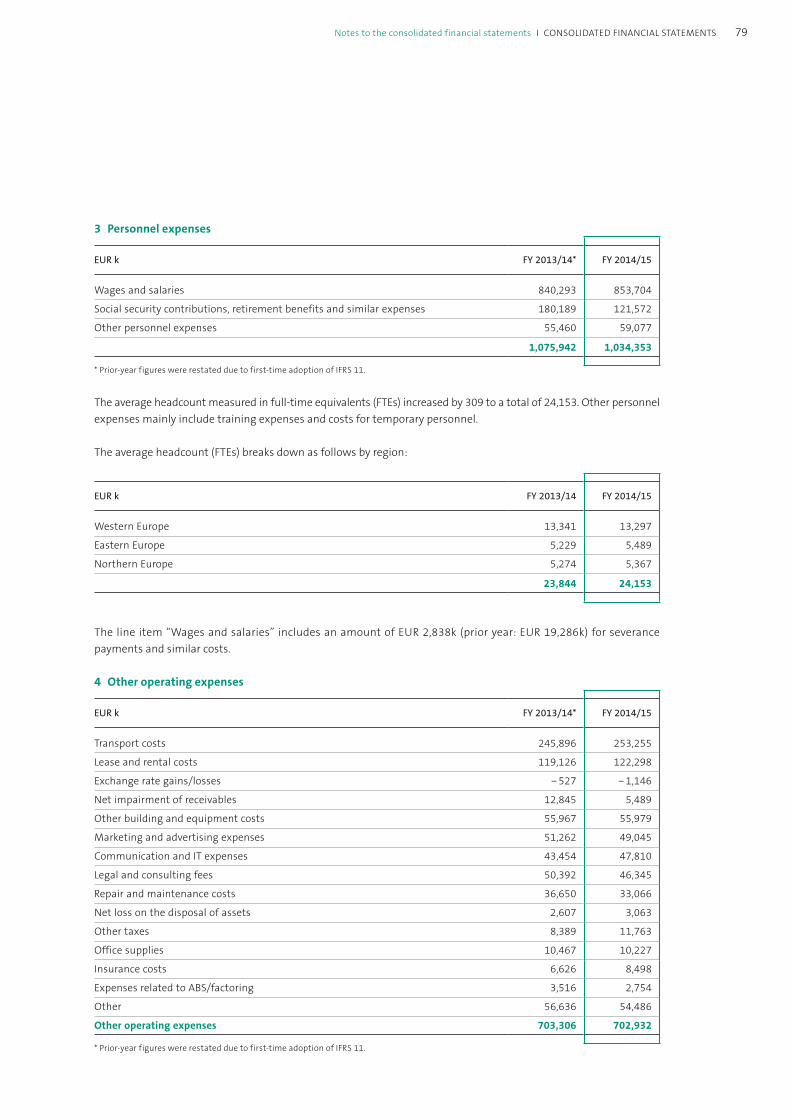
3 Personnel expenses
EUR k FY 2013/14* FY 2014/15
Wages and salaries 840,293 853,704
Social security contributions, retirement benefits and similar expenses 180,189 121,572
Other personnel expenses 55,460 59,077
1,075,942 1,034,353
* Prior-year figures were restated due to first-time adoption of IFRS 11.
The average headcount measured in full-time equivalents (FTEs) increased by 309 to a total of 24,153. Other personnel expenses mainly include training expenses and costs for temporary personnel.
The average headcount (FTEs) breaks down as follows by region:
EUR k FY 2013/14 FY 2014/15
Western Europe 13,341 13,297
Eastern Europe 5,229 5,489
Northern Europe 5,274 5,367
23,844 24,153
The line item “Wages and salaries” includes an amount of EUR 2,838k (prior year: EUR 19,286k) for severance payments and similar costs.
4 Other operating expenses
EUR k FY 2013/14* FY 2014/15
Transport costs 245,896 253,255
Lease and rental costs 119,126 122,298
Exchange rate gains/losses − 527 − 1,146
Net impairment of receivables 12,845 5,489
Other building and equipment costs 55,967 55,979
Marketing and advertising expenses 51,262 49,045
Communication and IT expenses 43,454 47,810
Legal and consulting fees 50,392 46,345
Repair and maintenance costs 36,650 33,066
Net loss on the disposal of assets 2,607 3,063
Other taxes 8,389 11,763
Office supplies 10,467 10,227
Insurance costs 6,626 8,498
Expenses related to ABS/factoring 3,516 2,754
Other 56,636 54,486
Other operating expenses 703,306 702,932
* Prior-year figures were restated due to first-time adoption of IFRS 11.
79Notes to the consolidated financial statements i CoNsolidated fiNaNCial statemeNts
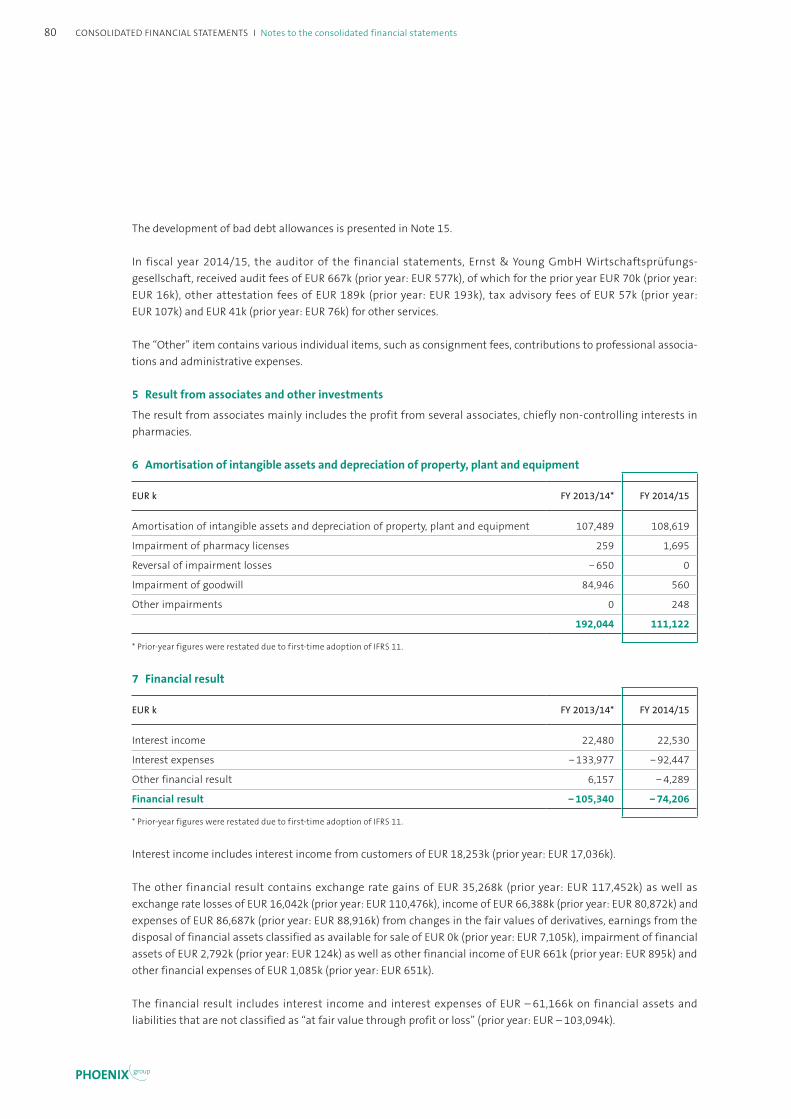
The development of bad debt allowances is presented in Note 15.
In fiscal year 2014/15, the auditor of the financial statements, Ernst & Young GmbH Wirtschaftsprüfungs-gesellschaft, received audit fees of EUR 667k (prior year: EUR 577k), of which for the prior year EUR 70k (prior year: EUR 16k), other attestation fees of EUR 189k (prior year: EUR 193k), tax advisory fees of EUR 57k (prior year: EUR 107k) and EUR 41k (prior year: EUR 76k) for other services.
The “Other” item contains various individual items, such as consignment fees, contributions to professional associa-tions and administrative expenses.
5 Result from associates and other investments
The result from associates mainly includes the profit from several associates, chiefly non-controlling interests in pharmacies.
6 Amortisation of intangible assets and depreciation of property, plant and equipment
EUR k FY 2013/14* FY 2014/15
Amortisation of intangible assets and depreciation of property, plant and equipment 107,489 108,619
Impairment of pharmacy licenses 259 1,695
Reversal of impairment losses − 650 0
Impairment of goodwill 84,946 560
Other impairments 0 248
192,044 111,122
* Prior-year figures were restated due to first-time adoption of IFRS 11.
7 Financial result
EUR k FY 2013/14* FY 2014/15
Interest income 22,480 22,530
Interest expenses − 133,977 − 92,447
Other financial result 6,157 − 4,289
Financial result − 105,340 − 74,206
* Prior-year figures were restated due to first-time adoption of IFRS 11.
Interest income includes interest income from customers of EUR 18,253k (prior year: EUR 17,036k).
The other financial result contains exchange rate gains of EUR 35,268k (prior year: EUR 117,452k) as well as exchange rate losses of EUR 16,042k (prior year: EUR 110,476k), income of EUR 66,388k (prior year: EUR 80,872k) and expenses of EUR 86,687k (prior year: EUR 88,916k) from changes in the fair values of derivatives, earnings from the disposal of financial assets classified as available for sale of EUR 0k (prior year: EUR 7,105k), impairment of financial assets of EUR 2,792k (prior year: EUR 124k) as well as other financial income of EUR 661k (prior year: EUR 895k) and other financial expenses of EUR 1,085k (prior year: EUR 651k).
The financial result includes interest income and interest expenses of EUR – 61,166k on financial assets and liabilities that are not classified as “at fair value through profit or loss” (prior year: EUR – 103,094k).
80
PHOENIX group
Consolidated finanCial statements i notes to the consolidated financial statements

8 Income tax
The major components of tax expense are summarised in the following table:
EUR k FY 2013/14* FY 2014/15
Current taxes 85,492 61,358
Deferred taxes − 12,427 41,908
73,065 103,266
* Prior-year figures were restated due to first-time adoption of IFRS 11.
Current taxes include income for prior periods of EUR 14,493k (prior year: EUR 3,708k) and expenses of EUR 1,560k (prior year: EUR 1,930k). Deferred taxes contain income of EUR 4,603k (prior year: EUR 0k) from previously unrecog-nised temporary differences from prior years.
In fiscal year 2014/15, net tax income (after non-controlling interests) of EUR 36,423k was recognised outside profit or loss (prior year: tax income of EUR 27,490k). This amount results from actuarial gains and losses from pension obligations (EUR 30,135k; prior year: EUR 4,270k); net investments in foreign operations (EUR 6,491k; prior year: EUR 22,894k) and changes in the fair value of financial assets classified as available for sale (EUR – 203k; prior year: EUR 326k), which are recognised in other comprehensive income. EUR 0k (prior year: EUR 377k) related to reclas-sification adjustments.
The deferred taxes at year end were calculated using the tax rates applicable for the respective entities in their respective countries.
In the current fiscal year, the tax rate applicable in the UK decreased by 1.8 percentage points, in Denmark by 0.5 percentage points and in Norway by one percentage point.
A reconciliation of the expected income tax expense to actual income tax expense using the average tax rate of the Group is presented in the table below:
FY 2013/14* FY 2014/15
EUR k in % EUR k in %
Profit before tax 143,097 100.0 361,278 100.0
Expected income tax expense 37,205 26.0 96,822 26.8
Impact of changes to tax rates on deferred taxes − 8,030 − 5.6 − 496 − 0.1
Tax effect of non-deductible expenses and tax-exempt income 4,062 2.8 7,540 2.1
Effect of taxes relating to prior years recognised in the fiscal year 57 0.0 − 5,420 − 1.5
Effect of differing national tax rates − 4,569 − 3.2 − 5,850 − 1.6
Effect of impairments/adjustments to carrying amounts 22,193 15.5 12,412 3.4
Effect of impairment on goodwill 25,015 17.5 0 0
Other effects − 2,868 − 2.0 − 1,743 − 0.5
Income taxes 73,065 51.1 103,266 28.6
* Prior-year figures were restated due to first-time adoption of IFRS 11.
81Notes to the consolidated financial statements i CoNsolidated fiNaNCial statemeNts

Other effects comprise a deferred tax income of EUR 1,119k (prior year: deferred tax income EUR 3,337k) relating to temporary differences associated with investments in subsidiaries.
The deferred tax assets and the deferred tax liabilities are summarised in the following table:
31 Jan. 2014 31 Jan. 2015
EUR kDeferred tax
assetsDeferred tax
liabilitiesDeferred tax
assetsDeferred tax
liabilities
Intangible assets 8,266 73,208 6,025 82,768
Property, plant and equipment 3,813 39,971 4,059 38,947
Financial and other assets 7,898 11,097 9,039 16,931
Inventories 6,573 4,101 6,800 4,746
Assets classified as held for sale 0 484 0 5
Provisions 48,130 949 61,701 1,473
Liabilities 7,834 11,076 13,486 9,191
Deferred taxes on temporary differences 82,514 140,886 101,110 154,061
Deferred taxes on unused tax losses 62,959 0 49,678 0
Netting − 26,760 − 26,760 − 32,764 − 32,764
Total deferred taxes 118,713 114,126 118,024 121,297
Deferred tax assets are recognised on unused tax losses at the amount at which the associated tax benefits are likely to be realised through future taxable profit. The Group has not recognised deferred tax assets on unused tax losses and future interest benefits of EUR 249,326k (prior year: EUR 222,409k). Deferred taxes include income from previously unused tax losses of EUR 3,391k (prior year: EUR 489k). The unused tax losses and interest carryforwards can be carried forward indefinitely.
No deferred tax liabilities were recognised on distributable reserves of subsidiaries amounting to EUR 2,785,854k (prior year: EUR 2,434,655k) because these reserves are intended to be indefinitely reinvested in the operations of subsidiaries.
82
PHOENIX group
Consolidated finanCial statements i notes to the consolidated financial statements
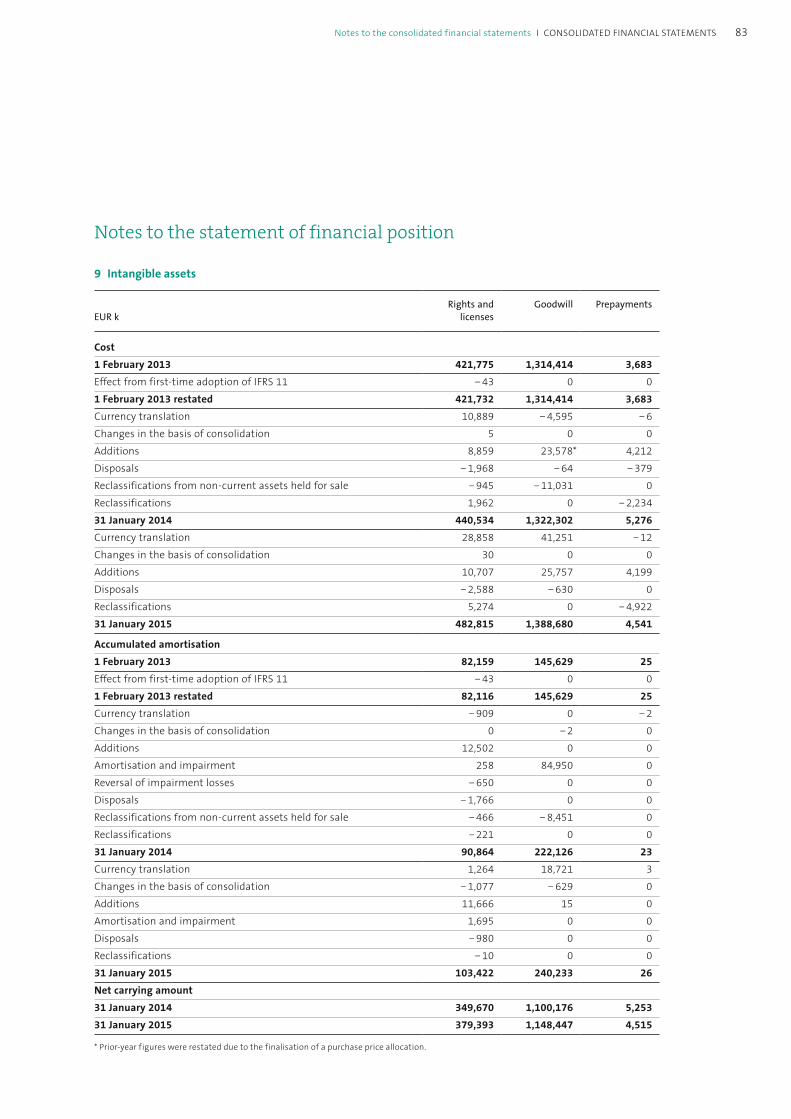
Notes to the statement of financial position
9 Intangible assets
EUR k
Rights and licenses
Goodwill Prepayments
Cost
1 February 2013 421,775 1,314,414 3,683
Effect from first-time adoption of IFRS 11 − 43 0 0
1 February 2013 restated 421,732 1,314,414 3,683
Currency translation 10,889 − 4,595 − 6
Changes in the basis of consolidation 5 0 0
Additions 8,859 23,578* 4,212
Disposals − 1,968 − 64 − 379
Reclassifications from non-current assets held for sale − 945 − 11,031 0
Reclassifications 1,962 0 − 2,234
31 January 2014 440,534 1,322,302 5,276
Currency translation 28,858 41,251 − 12
Changes in the basis of consolidation 30 0 0
Additions 10,707 25,757 4,199
Disposals − 2,588 − 630 0
Reclassifications 5,274 0 − 4,922
31 January 2015 482,815 1,388,680 4,541
Accumulated amortisation
1 February 2013 82,159 145,629 25
Effect from first-time adoption of IFRS 11 − 43 0 0
1 February 2013 restated 82,116 145,629 25
Currency translation − 909 0 − 2
Changes in the basis of consolidation 0 − 2 0
Additions 12,502 0 0
Amortisation and impairment 258 84,950 0
Reversal of impairment losses − 650 0 0
Disposals − 1,766 0 0
Reclassifications from non-current assets held for sale − 466 − 8,451 0
Reclassifications − 221 0 0
31 January 2014 90,864 222,126 23
Currency translation 1,264 18,721 3
Changes in the basis of consolidation − 1,077 − 629 0
Additions 11,666 15 0
Amortisation and impairment 1,695 0 0
Disposals − 980 0 0
Reclassifications − 10 0 0
31 January 2015 103,422 240,233 26
Net carrying amount
31 January 2014 349,670 1,100,176 5,253
31 January 2015 379,393 1,148,447 4,515
* Prior-year figures were restated due to the finalisation of a purchase price allocation.
83Notes to the consolidated financial statements i CoNsolidated fiNaNCial statemeNts
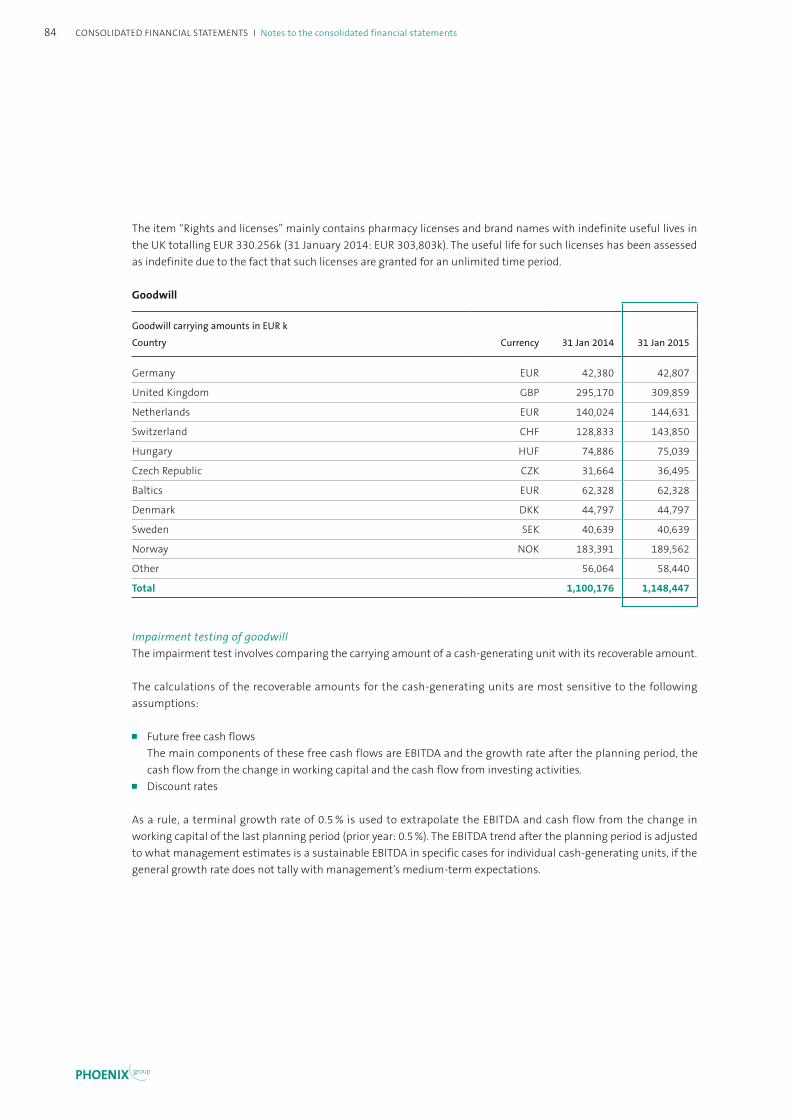
The item “Rights and licenses” mainly contains pharmacy licenses and brand names with indefinite useful lives in the UK totalling EUR 330.256k (31 January 2014: EUR 303,803k). The useful life for such licenses has been assessed as indefinite due to the fact that such licenses are granted for an unlimited time period.
Goodwill
Goodwill carrying amounts in EUR k
Country Currency 31 Jan 2014 31 Jan 2015
Germany EUR 42,380 42,807
United Kingdom GBP 295,170 309,859
Netherlands EUR 140,024 144,631
Switzerland CHF 128,833 143,850
Hungary HUF 74,886 75,039
Czech Republic CZK 31,664 36,495
Baltics EUR 62,328 62,328
Denmark DKK 44,797 44,797
Sweden SEK 40,639 40,639
Norway NOK 183,391 189,562
Other 56,064 58,440
Total 1,100,176 1,148,447
Impairment testing of goodwillThe impairment test involves comparing the carrying amount of a cash-generating unit with its recoverable amount.
The calculations of the recoverable amounts for the cash-generating units are most sensitive to the following assumptions:
Future free cash flows The main components of these free cash flows are EBITDA and the growth rate after the planning period, the
cash flow from the change in working capital and the cash flow from investing activities. Discount rates
As a rule, a terminal growth rate of 0.5 % is used to extrapolate the EBITDA and cash flow from the change in working capital of the last planning period (prior year: 0.5 %). The EBITDA trend after the planning period is adjusted to what management estimates is a sustainable EBITDA in specific cases for individual cash-generating units, if the general growth rate does not tally with management’s medium-term expectations.
84
PHOENIX group
Consolidated finanCial statements i notes to the consolidated financial statements

The perpetual cash flow from investing activities is calculated using historical data. This averages 0.5 % of revenue (prior year: 0.5 %).
Discount rates reflect the current market assessment of the risks specific to each cash-generating unit. The discount rates are derived on the basis of the capital asset pricing model. The discount rates are generally adjusted to reflect the market assessment of country-specific risks for which future estimates of cash flows have not been adjusted.
The discount rate is determined using a two-phase approach. The phase one discount rate is used to discount the future cash flows in the planning period and the second phase discount rate is used to calculate the terminal value. The difference between the discount rates used in phases one and two corresponds to a growth mark-down and stands at 0.5 % (prior year: 0.5 %).
The following table shows the phase one pre-tax discount rates (WACC) for material cash-generating units:
in % 31 Jan. 2014 31 Jan. 2015
Discount rate (WACC before tax)
Germany 9.10 9.20
United Kingdom 10.15 9.31
Netherlands 8.76 8.58
Switzerland 7.36 7.13
Hungary 13.56 11.77
Czech Republic 10.15 9.90
Baltics 10.24 9.28
Denmark 9.24 8.19
Sweden 8.81 9.06
Norway 9.52 10.06
Other 8.84 – 14.66 8.19 – 13.35
A marginal change in the future cash flows or in the discount rate of the material UK cash-generating unit would lead to the carrying amounts exceeding the value in use.
The UK cash-generating unit’s value in use exceeds its carrying amount by EUR 84,202k. A 9.7 % increase in the discount rate or a 9.6 % decrease in future free cash flow would eliminate this gap.
85Notes to the consolidated financial statements i CoNsolidated fiNaNCial statemeNts
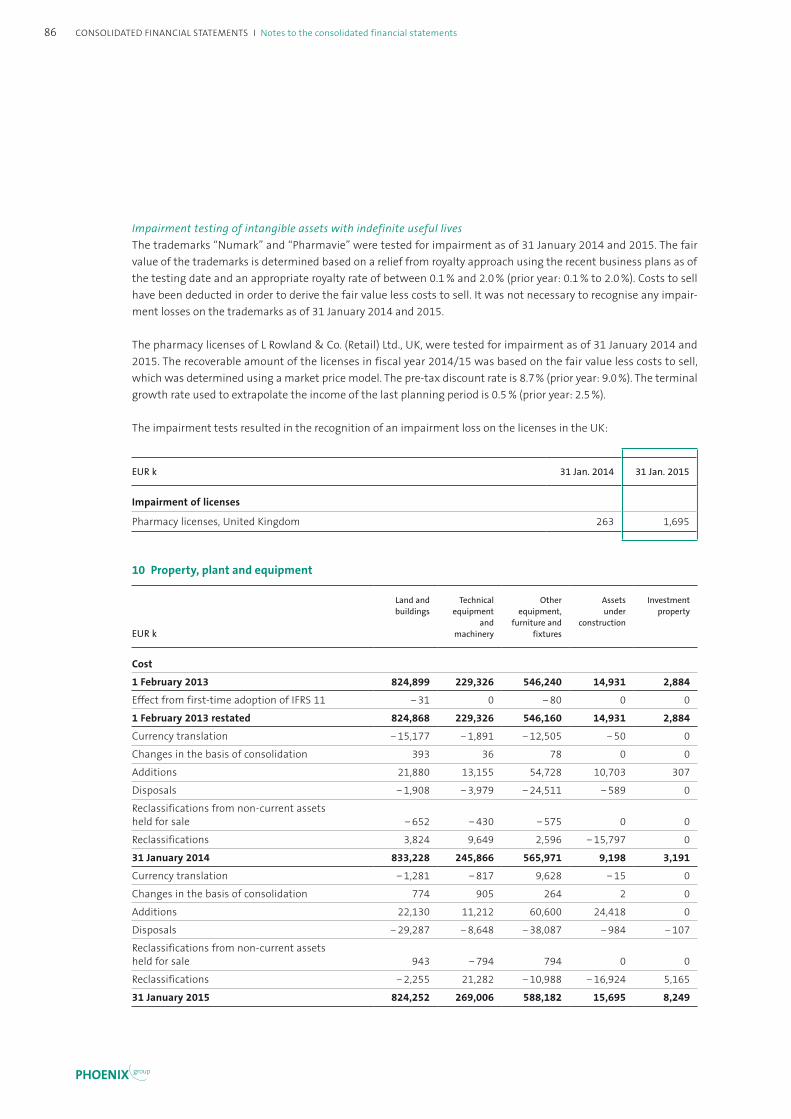
Impairment testing of intangible assets with indefinite useful livesThe trademarks “Numark” and “Pharmavie” were tested for impairment as of 31 January 2014 and 2015. The fair value of the trademarks is determined based on a relief from royalty approach using the recent business plans as of the testing date and an appropriate royalty rate of between 0.1 % and 2.0 % (prior year: 0.1 % to 2.0 %). Costs to sell have been deducted in order to derive the fair value less costs to sell. It was not necessary to recognise any impair-ment losses on the trademarks as of 31 January 2014 and 2015.
The pharmacy licenses of L Rowland & Co. (Retail) Ltd., UK, were tested for impairment as of 31 January 2014 and 2015. The recoverable amount of the licenses in fiscal year 2014/15 was based on the fair value less costs to sell, which was determined using a market price model. The pre-tax discount rate is 8.7 % (prior year: 9.0 %). The terminal growth rate used to extrapolate the income of the last planning period is 0.5 % (prior year: 2.5 %).
The impairment tests resulted in the recognition of an impairment loss on the licenses in the UK:
EUR k 31 Jan. 2014 31 Jan. 2015
Impairment of licenses
Pharmacy licenses, United Kingdom 263 1,695
10 Property, plant and equipment
EUR k
Land and buildings
Technical equipment
and machinery
Other equipment,
furniture and fixtures
Assets under
construction
Investment property
Cost
1 February 2013 824,899 229,326 546,240 14,931 2,884
Effect from first-time adoption of IFRS 11 − 31 0 − 80 0 0
1 February 2013 restated 824,868 229,326 546,160 14,931 2,884
Currency translation − 15,177 − 1,891 − 12,505 − 50 0
Changes in the basis of consolidation 393 36 78 0 0
Additions 21,880 13,155 54,728 10,703 307
Disposals − 1,908 − 3,979 − 24,511 − 589 0
Reclassifications from non-current assets held for sale − 652 − 430 − 575 0 0
Reclassifications 3,824 9,649 2,596 − 15,797 0
31 January 2014 833,228 245,866 565,971 9,198 3,191
Currency translation − 1,281 − 817 9,628 − 15 0
Changes in the basis of consolidation 774 905 264 2 0
Additions 22,130 11,212 60,600 24,418 0
Disposals − 29,287 − 8,648 − 38,087 − 984 − 107
Reclassifications from non-current assets held for sale 943 − 794 794 0 0
Reclassifications − 2,255 21,282 − 10,988 − 16,924 5,165
31 January 2015 824,252 269,006 588,182 15,695 8,249
86
PHOENIX group
Consolidated finanCial statements i notes to the consolidated financial statements

EUR k
Land and buildings
Technical equipment
and machinery
Other equipment,
furniture and fixtures
Assets under
construction
Investment property
Accumulated depreciation
1 February 2013 279,287 162,681 371,729 0 618
Effect from first-time adoption of IFRS 11 − 21 0 − 27 0 0
1 February 2013 restated 279,266 162,681 371,702 0 618
Currency translation − 7,883 − 1,392 − 10,191 0 0
Changes in the basis of consolidation 0 − 21 0 0 0
Additions 29,219 15,002 50,140 0 80
Depreciation and impairment 548 0 0 0 0
Disposals − 945 − 2,575 − 21,327 0 0
Reclassifications from non-current assets held for sale − 388 − 389 − 574 0 0
Reclassifications − 100 149 172 0 0
31 January 2014 299,717 173,455 389,922 0 698
Currency translation − 1,029 − 398 6,181 0 0
Changes in the basis of consolidation 0 0 0 0 0
Additions 29,492 17,203 50,098 0 145
Depreciation and impairment 229 0 19 0 0
Disposals − 11,810 − 5,625 − 34,419 0 0
Reclassifications from non-current assets held for sale − 231 0 0 0 0
Reclassifications − 4,134 − 1 325 0 383
31 January 2015 312,234 184,634 412,126 0 1,226
Net carrying amount 31 January 2014 533,511 72,411 176,049 9,198 2,493
Net carrying amount 31 January 2015 512,018 84,372 176,056 15,695 7,023
Items of property, plant and equipment with a carrying amount of EUR 9,265k (prior year: EUR 16,107k) have been pledged as collateral for liabilities. The collateral mainly relates to charges on land and buildings in Italy and Germany.
There are contractual commitments to acquire property, plant and equipment of EUR 6,966k (31 January 2014: EUR 12,257k).
87Notes to the consolidated financial statements i CoNsolidated fiNaNCial statemeNts
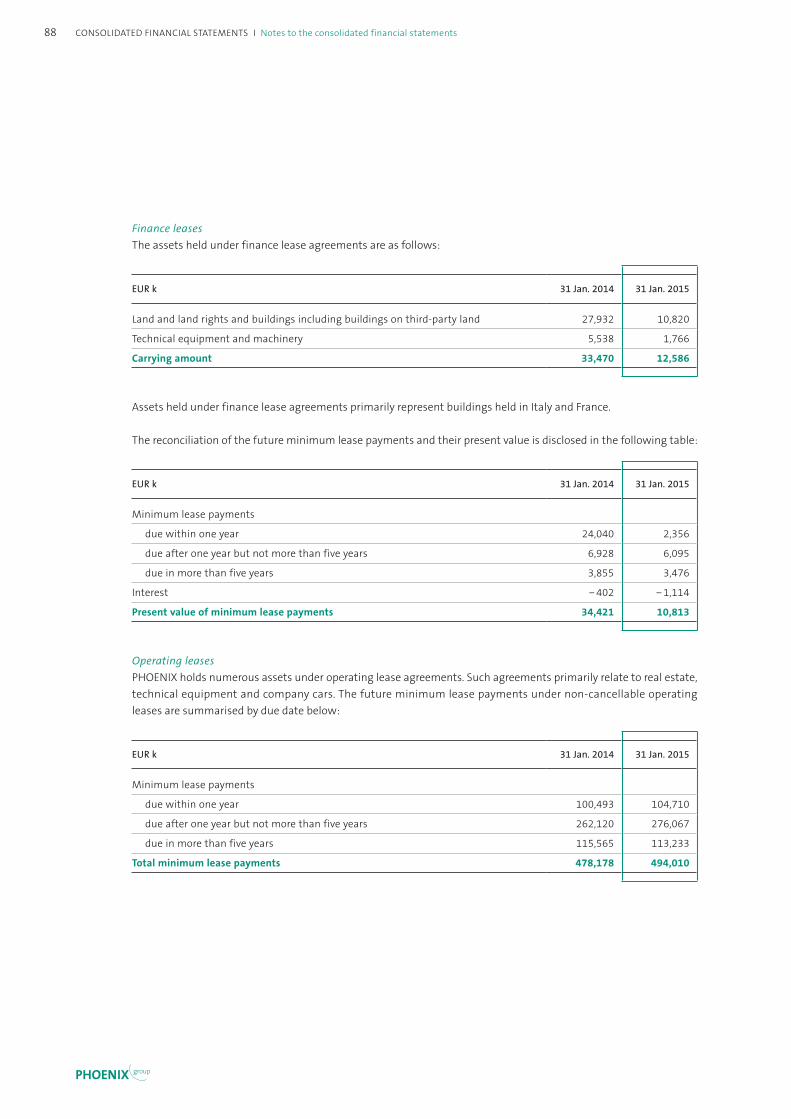
Finance leasesThe assets held under finance lease agreements are as follows:
EUR k 31 Jan. 2014 31 Jan. 2015
Land and land rights and buildings including buildings on third-party land 27,932 10,820
Technical equipment and machinery 5,538 1,766
Carrying amount 33,470 12,586
Assets held under finance lease agreements primarily represent buildings held in Italy and France.
The reconciliation of the future minimum lease payments and their present value is disclosed in the following table:
EUR k 31 Jan. 2014 31 Jan. 2015
Minimum lease payments
due within one year 24,040 2,356
due after one year but not more than five years 6,928 6,095
due in more than five years 3,855 3,476
Interest − 402 − 1,114
Present value of minimum lease payments 34,421 10,813
Operating leasesPHOENIX holds numerous assets under operating lease agreements. Such agreements primarily relate to real estate, technical equipment and company cars. The future minimum lease payments under non-cancellable operating leases are summarised by due date below:
EUR k 31 Jan. 2014 31 Jan. 2015
Minimum lease payments
due within one year 100,493 104,710
due after one year but not more than five years 262,120 276,067
due in more than five years 115,565 113,233
Total minimum lease payments 478,178 494,010
88
PHOENIX group
Consolidated finanCial statements i notes to the consolidated financial statements
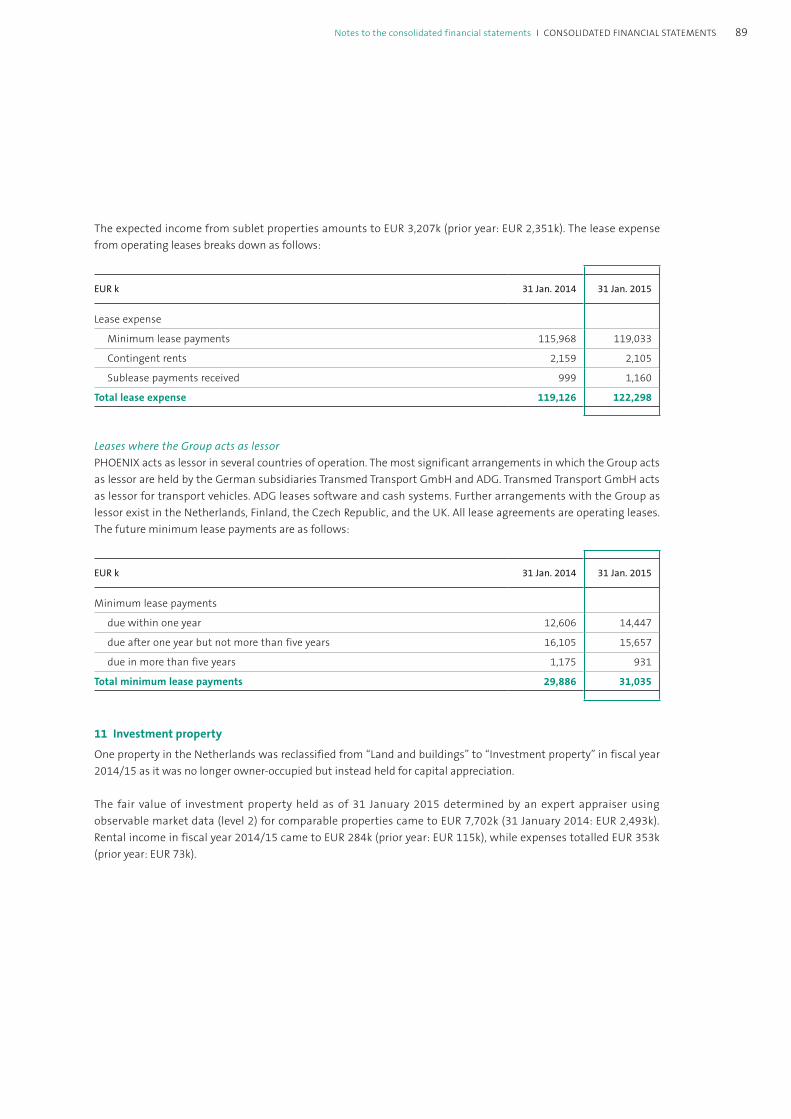
The expected income from sublet properties amounts to EUR 3,207k (prior year: EUR 2,351k). The lease expense from operating leases breaks down as follows:
EUR k 31 Jan. 2014 31 Jan. 2015
Lease expense
Minimum lease payments 115,968 119,033
Contingent rents 2,159 2,105
Sublease payments received 999 1,160
Total lease expense 119,126 122,298
Leases where the Group acts as lessorPHOENIX acts as lessor in several countries of operation. The most significant arrangements in which the Group acts as lessor are held by the German subsidiaries Transmed Transport GmbH and ADG. Transmed Transport GmbH acts as lessor for transport vehicles. ADG leases software and cash systems. Further arrangements with the Group as lessor exist in the Netherlands, Finland, the Czech Republic, and the UK. All lease agreements are operating leases. The future minimum lease payments are as follows:
EUR k 31 Jan. 2014 31 Jan. 2015
Minimum lease payments
due within one year 12,606 14,447
due after one year but not more than five years 16,105 15,657
due in more than five years 1,175 931
Total minimum lease payments 29,886 31,035
11 Investment property
One property in the Netherlands was reclassified from “Land and buildings” to “Investment property” in fiscal year 2014/15 as it was no longer owner-occupied but instead held for capital appreciation.
The fair value of investment property held as of 31 January 2015 determined by an expert appraiser using observable market data (level 2) for comparable properties came to EUR 7,702k (31 January 2014: EUR 2,493k). Rental income in fiscal year 2014/15 came to EUR 284k (prior year: EUR 115k), while expenses totalled EUR 353k (prior year: EUR 73k).
89Notes to the consolidated financial statements i CoNsolidated fiNaNCial statemeNts

12 Interests in other entities
Significant non-controlling interests were held in the following entities. The complete list of shareholdings is an integral component of the notes to the consolidated financial statements and will be published in the electronic version of the German Federal Gazette.
FY 2013/14 FY 2014/15
EUR k
Brocacef Group
Comifar Group
PHOENIX Int. Beteiligungs
GmbH
Brocacef Group
Comifar Group
PHOENIX Int. Beteiligungs
GmbH
Current assets 221,083 778,789 1,119,933 211,219 776,458 983,744
Non-current assets 223,374 165,103 2,625,255 226,370 136,090 2,697,644
Current liabilities 135,791 620,278 2,397,266 156,859 582,792 2,290,960
Non-current liabilities 98,143 34,319 1,611 45,682 31,301 1,940
Revenue 1,126,783 2,276,154 0 1,184,596 2,254,307 0
Gain/loss from continuing operations 16,065 15,704 34,666 48,592 16,437 42,177
Gain/loss after taxes from discontinued operations 0 0 0 0 0 0
Total comprehensive income 8,921 15,091 33,992 30,768 15,924 42,177
Cash inflow (+)/outflow (–) from:
– operating activities 38,723 43,347 1,193 43,014 67,860 50,715
– investing activities − 5,803 − 6,468 3,091 − 16,712 − 5,405 − 145,275
– financing activities − 14,177 − 37,195 245,043 − 45,262 − 63,048 9,445
Gain/loss attributable to non-controlling interests 7,229 1,647 4,119 21,867 1,456 7,439
Accumulated non-controlling interests at the end of the reporting period 90,757 25,337 80,895 101,795 25,088 87,491
Dividends paid to non-controlling interests
981 541 0 2,891 513 0
As an intermediate holding company, PHOENIX International Beteiligungs GmbH holds the interests in foreign subsidiaries. Of the interests in PHOENIX International Beteiligungs GmbH, 2.33 % are non-controlling interests. The non-controlling interests disclosed in the consolidated financial statements are as follows:
EUR k 31 Jan. 2014 31 Jan. 2015
Brocacef Group 90,757 101,795
Comifar Group 25,337 25,088
PHOENIX Int. Beteiligungs GmbH 80,895 87,491
Other 18,689 19,936
215,678 234,310
90
PHOENIX group
Consolidated finanCial statements i notes to the consolidated financial statements
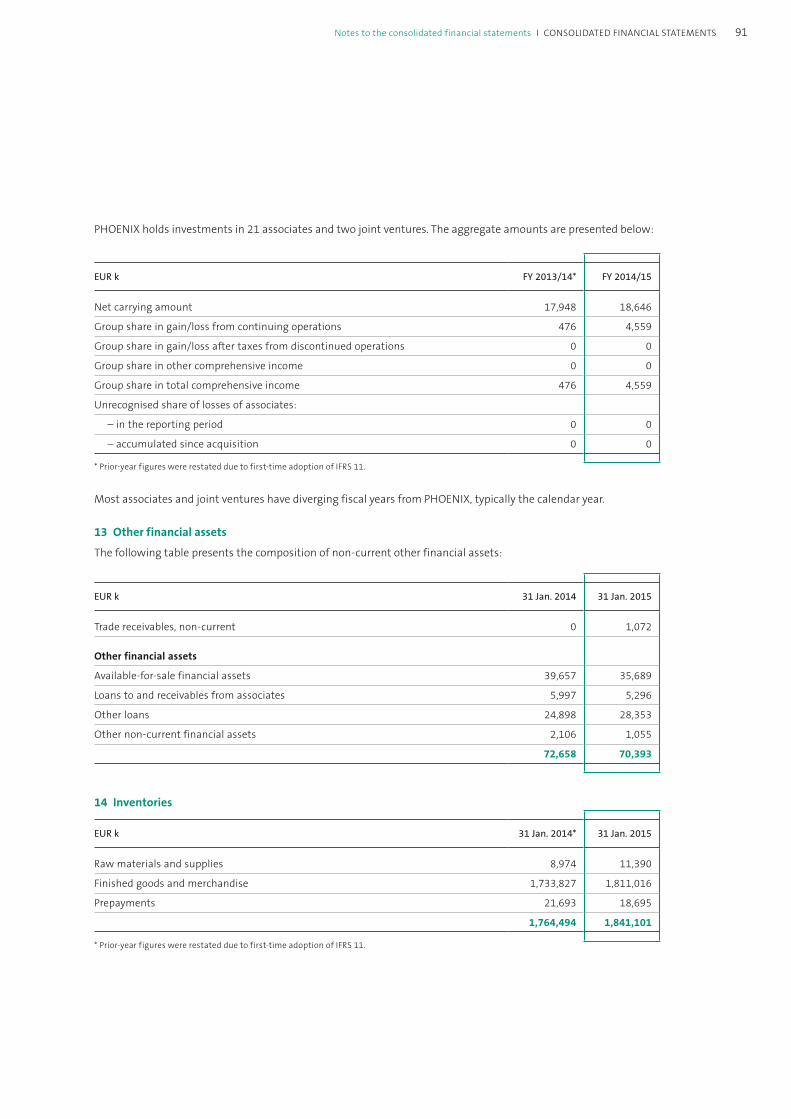
PHOENIX holds investments in 21 associates and two joint ventures. The aggregate amounts are presented below:
EUR k FY 2013/14* FY 2014/15
Net carrying amount 17,948 18,646
Group share in gain/loss from continuing operations 476 4,559
Group share in gain/loss after taxes from discontinued operations 0 0
Group share in other comprehensive income 0 0
Group share in total comprehensive income 476 4,559
Unrecognised share of losses of associates:
– in the reporting period 0 0
– accumulated since acquisition 0 0
* Prior-year figures were restated due to first-time adoption of IFRS 11.
Most associates and joint ventures have diverging fiscal years from PHOENIX, typically the calendar year.
13 Other financial assets
The following table presents the composition of non-current other financial assets:
EUR k 31 Jan. 2014 31 Jan. 2015
Trade receivables, non-current 0 1,072
Other financial assets
Available-for-sale financial assets 39,657 35,689
Loans to and receivables from associates 5,997 5,296
Other loans 24,898 28,353
Other non-current financial assets 2,106 1,055
72,658 70,393
14 Inventories
EUR k 31 Jan. 2014* 31 Jan. 2015
Raw materials and supplies 8,974 11,390
Finished goods and merchandise 1,733,827 1,811,016
Prepayments 21,693 18,695
1,764,494 1,841,101
* Prior-year figures were restated due to first-time adoption of IFRS 11.
91Notes to the consolidated financial statements i CoNsolidated fiNaNCial statemeNts
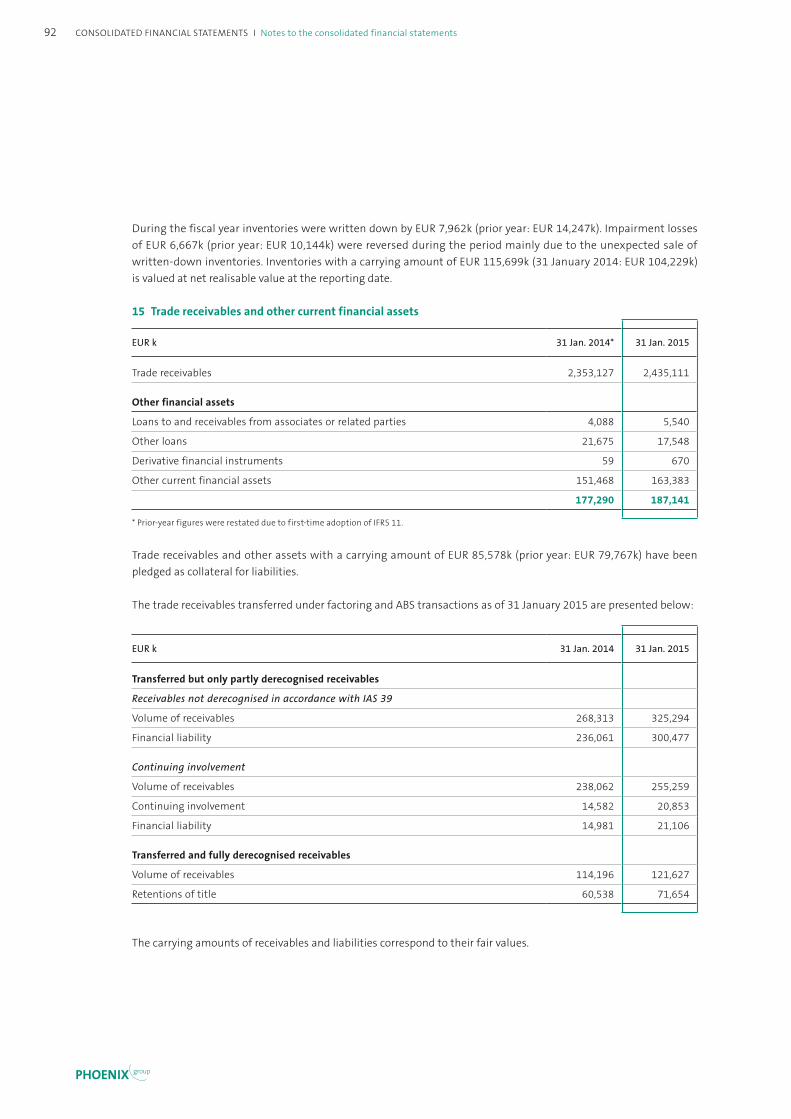
During the fiscal year inventories were written down by EUR 7,962k (prior year: EUR 14,247k). Impairment losses of EUR 6,667k (prior year: EUR 10,144k) were reversed during the period mainly due to the unexpected sale of written-down inventories. Inventories with a carrying amount of EUR 115,699k (31 January 2014: EUR 104,229k) is valued at net realisable value at the reporting date.
15 Trade receivables and other current financial assets
EUR k 31 Jan. 2014* 31 Jan. 2015
Trade receivables 2,353,127 2,435,111
Other financial assets
Loans to and receivables from associates or related parties 4,088 5,540
Other loans 21,675 17,548
Derivative financial instruments 59 670
Other current financial assets 151,468 163,383
177,290 187,141
* Prior-year figures were restated due to first-time adoption of IFRS 11.
Trade receivables and other assets with a carrying amount of EUR 85,578k (prior year: EUR 79,767k) have been pledged as collateral for liabilities.
The trade receivables transferred under factoring and ABS transactions as of 31 January 2015 are presented below:
EUR k 31 Jan. 2014 31 Jan. 2015
Transferred but only partly derecognised receivables
Receivables not derecognised in accordance with IAS 39
Volume of receivables 268,313 325,294
Financial liability 236,061 300,477
Continuing involvement
Volume of receivables 238,062 255,259
Continuing involvement 14,582 20,853
Financial liability 14,981 21,106
Transferred and fully derecognised receivables
Volume of receivables 114,196 121,627
Retentions of title 60,538 71,654
The carrying amounts of receivables and liabilities correspond to their fair values.
92
PHOENIX group
Consolidated finanCial statements i notes to the consolidated financial statements

In the case of the transferred but only partly derecognised receivables, PHOENIX has either fully or partly retained the risk of default as well as the risk of late payment attaching to the transferred receivables. The transferred receivables serve as collateral for the purchase price received for them. The amount received for selling these receivables is recognised as a liability. Cash receipts from these receivables have to be transferred to the factor, thus settling the liability.
Other current financial assets mainly include receivables from bonuses, ABS and factoring programmes and other current receivables.
The valuation allowances on trade receivables and customer loans, which are included in other loans, have developed as follows:
EUR k
Trade receivables
Other loans
Allowances as of 1 February 2013 117,571 9,920
Additions 20,005 1,870
Utilisation − 36,649 − 874
Reversal − 7,881 − 500
Currency and other changes − 676 − 317
Allowances as of 31 January 2014 92,370 10,099
Additions 10,261 3,115
Utilisation − 30,261 − 950
Reversal − 6,621 − 860
Currency and other changes 410 131
Allowances as of 31 January 2015 66,159 11,535
93Notes to the consolidated financial statements i CoNsolidated fiNaNCial statemeNts
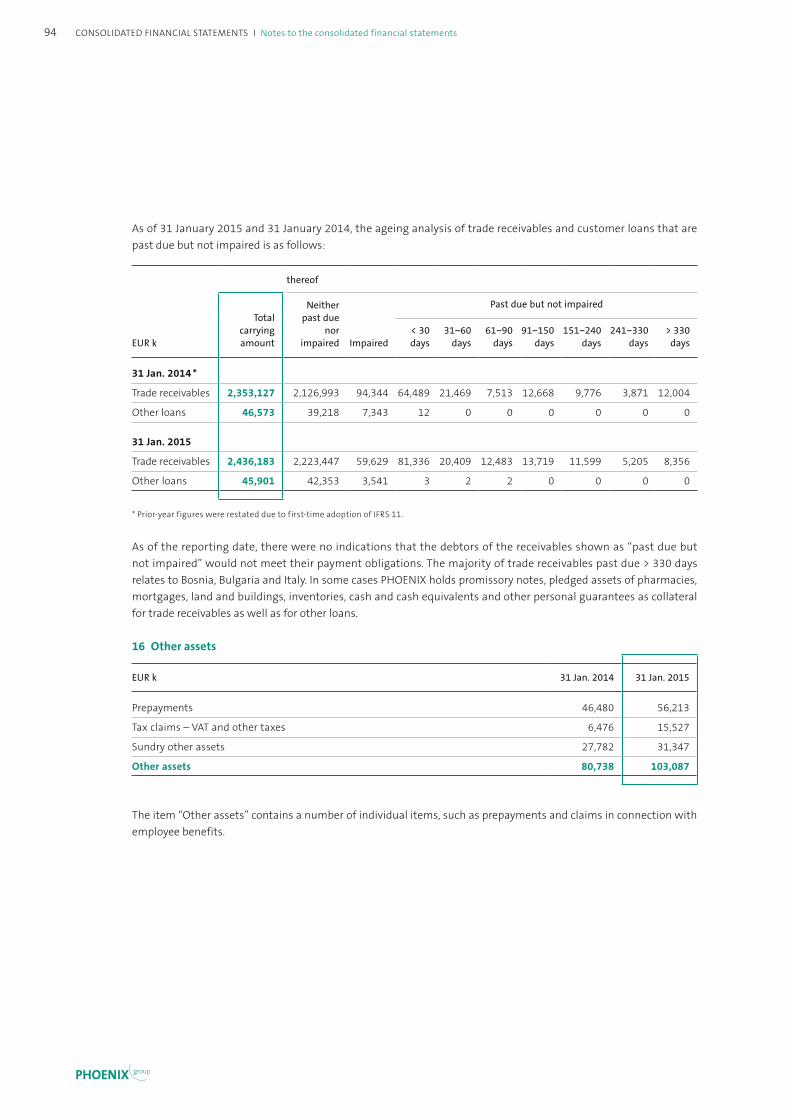
As of 31 January 2015 and 31 January 2014, the ageing analysis of trade receivables and customer loans that are past due but not impaired is as follows:
thereof
EUR k
Total carrying amount
Neither past due
nor impaired Impaired
Past due but not impaired
< 30 days
31−60 days
61−90 days
91−150 days
151−240 days
241−330 days
> 330 days
31 Jan. 2014 *
Trade receivables 2,353,127 2,126,993 94,344 64,489 21,469 7,513 12,668 9,776 3,871 12,004
Other loans 46,573 39,218 7,343 12 0 0 0 0 0 0
31 Jan. 2015
Trade receivables 2,436,183 2,223,447 59,629 81,336 20,409 12,483 13,719 11,599 5,205 8,356
Other loans 45,901 42,353 3,541 3 2 2 0 0 0 0
* Prior-year figures were restated due to first-time adoption of IFRS 11.
As of the reporting date, there were no indications that the debtors of the receivables shown as “past due but not impaired” would not meet their payment obligations. The majority of trade receivables past due > 330 days relates to Bosnia, Bulgaria and Italy. In some cases PHOENIX holds promissory notes, pledged assets of pharmacies, mortgages, land and buildings, inventories, cash and cash equivalents and other personal guarantees as collateral for trade receivables as well as for other loans.
16 Other assets
EUR k 31 Jan. 2014 31 Jan. 2015
Prepayments 46,480 56,213
Tax claims – VAT and other taxes 6,476 15,527
Sundry other assets 27,782 31,347
Other assets 80,738 103,087
The item “Other assets” contains a number of individual items, such as prepayments and claims in connection with employee benefits.
94
PHOENIX group
Consolidated finanCial statements i notes to the consolidated financial statements
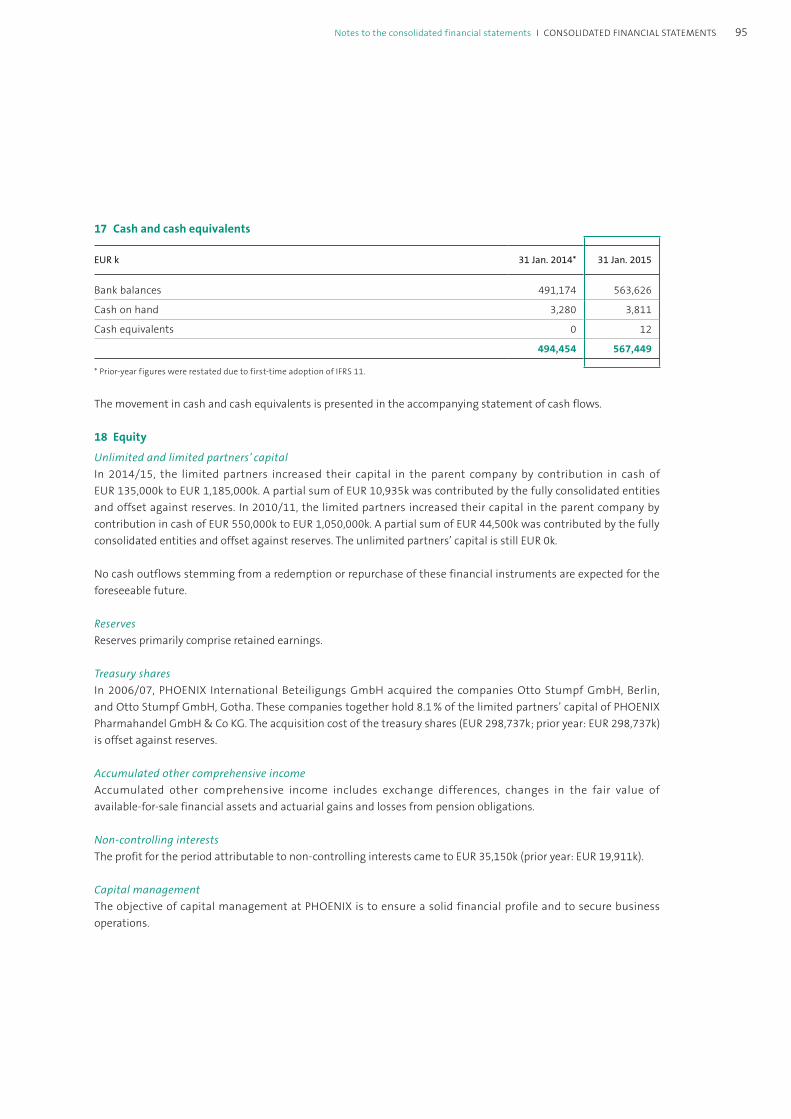
17 Cash and cash equivalents
EUR k 31 Jan. 2014* 31 Jan. 2015
Bank balances 491,174 563,626
Cash on hand 3,280 3,811
Cash equivalents 0 12
494,454 567,449
* Prior-year figures were restated due to first-time adoption of IFRS 11.
The movement in cash and cash equivalents is presented in the accompanying statement of cash flows.
18 Equity
Unlimited and limited partners’ capitalIn 2014/15, the limited partners increased their capital in the parent company by contribution in cash of EUR 135,000k to EUR 1,185,000k. A partial sum of EUR 10,935k was contributed by the fully consolidated entities and offset against reserves. In 2010/11, the limited partners increased their capital in the parent company by contribution in cash of EUR 550,000k to EUR 1,050,000k. A partial sum of EUR 44,500k was contributed by the fully consolidated entities and offset against reserves. The unlimited partners’ capital is still EUR 0k.
No cash outflows stemming from a redemption or repurchase of these financial instruments are expected for the foreseeable future.
ReservesReserves primarily comprise retained earnings.
Treasury sharesIn 2006/07, PHOENIX International Beteiligungs GmbH acquired the companies Otto Stumpf GmbH, Berlin, and Otto Stumpf GmbH, Gotha. These companies together hold 8.1 % of the limited partners’ capital of PHOENIX Pharmahandel GmbH & Co KG. The acquisition cost of the treasury shares (EUR 298,737k; prior year: EUR 298,737k) is offset against reserves.
Accumulated other comprehensive incomeAccumulated other comprehensive income includes exchange differences, changes in the fair value of available-for-sale financial assets and actuarial gains and losses from pension obligations.
Non-controlling interestsThe profit for the period attributable to non-controlling interests came to EUR 35,150k (prior year: EUR 19,911k).
Capital managementThe objective of capital management at PHOENIX is to ensure a solid financial profile and to secure business operations.
95Notes to the consolidated financial statements i CoNsolidated fiNaNCial statemeNts
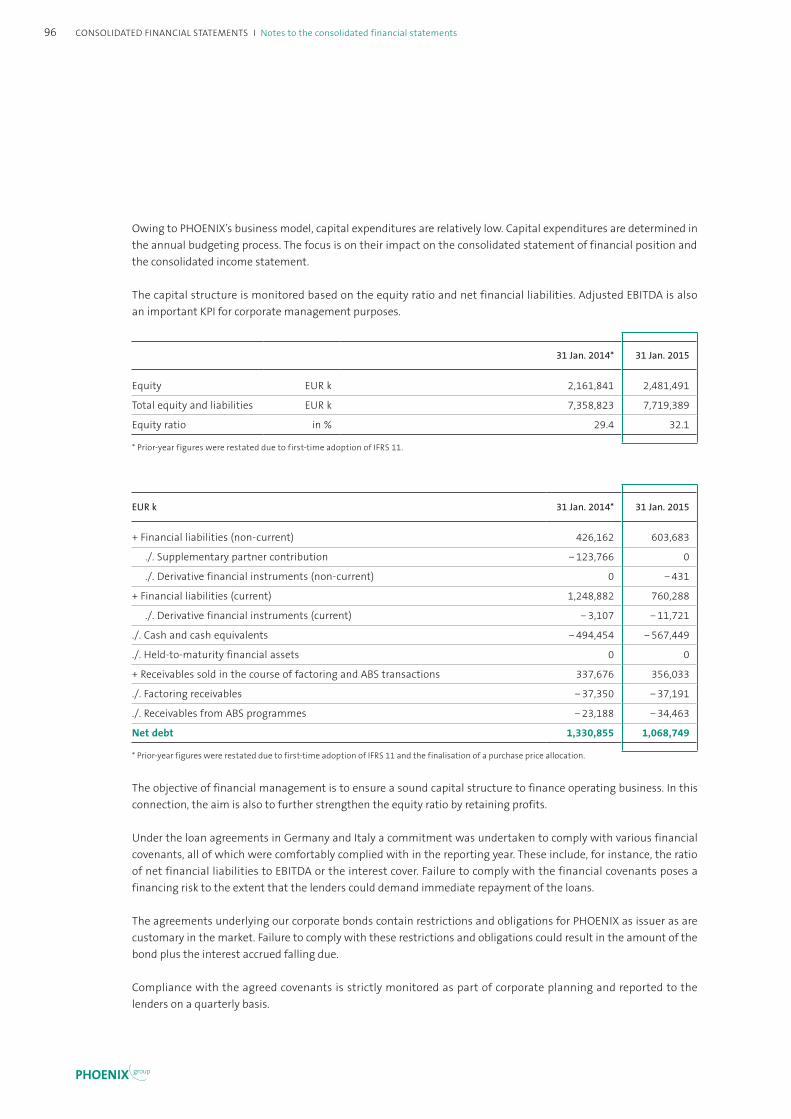
Owing to PHOENIX’s business model, capital expenditures are relatively low. Capital expenditures are determined in the annual budgeting process. The focus is on their impact on the consolidated statement of financial position and the consolidated income statement.
The capital structure is monitored based on the equity ratio and net financial liabilities. Adjusted EBITDA is also an important KPI for corporate management purposes.
31 Jan. 2014* 31 Jan. 2015
Equity EUR k 2,161,841 2,481,491
Total equity and liabilities EUR k 7,358,823 7,719,389
Equity ratio in % 29.4 32.1
* Prior-year figures were restated due to first-time adoption of IFRS 11.
EUR k 31 Jan. 2014* 31 Jan. 2015
+ Financial liabilities (non-current) 426,162 603,683
./. Supplementary partner contribution − 123,766 0
./. Derivative financial instruments (non-current) 0 − 431
+ Financial liabilities (current) 1,248,882 760,288
./. Derivative financial instruments (current) − 3,107 − 11,721
./. Cash and cash equivalents − 494,454 − 567,449
./. Held-to-maturity financial assets 0 0
+ Receivables sold in the course of factoring and ABS transactions 337,676 356,033
./. Factoring receivables − 37,350 − 37,191
./. Receivables from ABS programmes − 23,188 − 34,463
Net debt 1,330,855 1,068,749
* Prior-year figures were restated due to first-time adoption of IFRS 11 and the finalisation of a purchase price allocation.
The objective of financial management is to ensure a sound capital structure to finance operating business. In this connection, the aim is also to further strengthen the equity ratio by retaining profits.
Under the loan agreements in Germany and Italy a commitment was undertaken to comply with various financial covenants, all of which were comfortably complied with in the reporting year. These include, for instance, the ratio of net financial liabilities to EBITDA or the interest cover. Failure to comply with the financial covenants poses a financing risk to the extent that the lenders could demand immediate repayment of the loans.
The agreements underlying our corporate bonds contain restrictions and obligations for PHOENIX as issuer as are customary in the market. Failure to comply with these restrictions and obligations could result in the amount of the bond plus the interest accrued falling due.
Compliance with the agreed covenants is strictly monitored as part of corporate planning and reported to the lenders on a quarterly basis.
96
PHOENIX group
Consolidated finanCial statements i notes to the consolidated financial statements
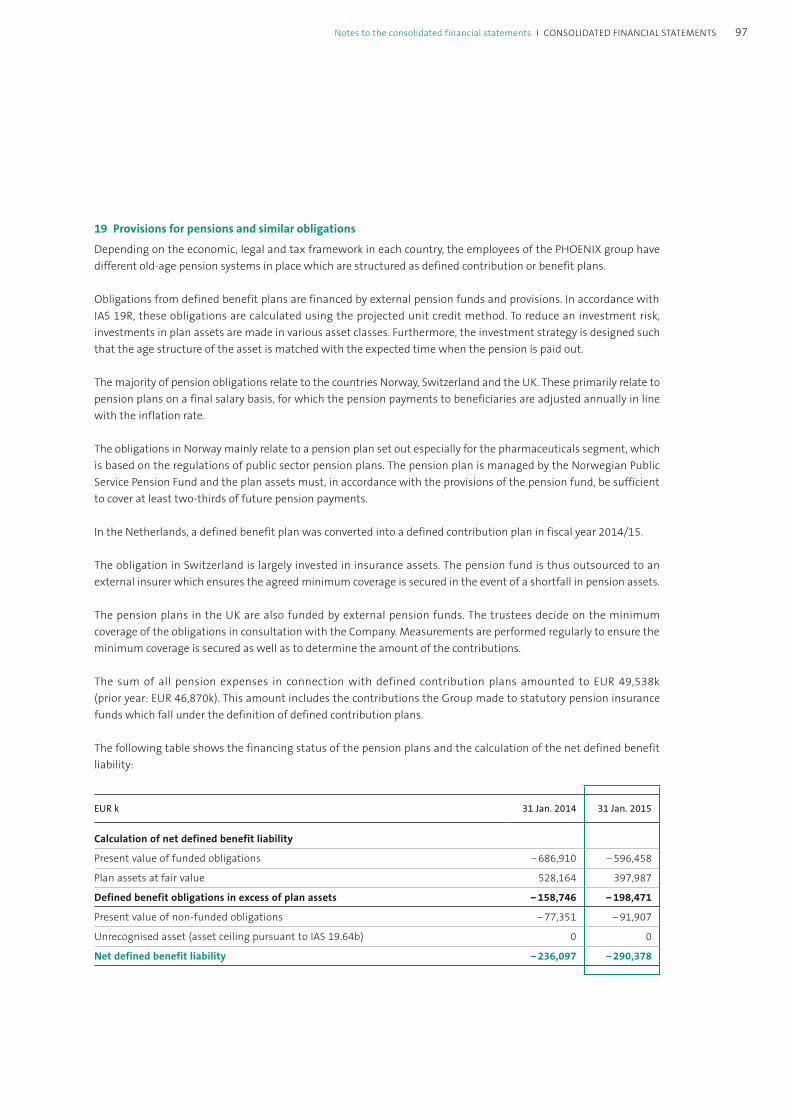
19 Provisions for pensions and similar obligations
Depending on the economic, legal and tax framework in each country, the employees of the PHOENIX group have different old-age pension systems in place which are structured as defined contribution or benefit plans.
Obligations from defined benefit plans are financed by external pension funds and provisions. In accordance with IAS 19R, these obligations are calculated using the projected unit credit method. To reduce an investment risk, investments in plan assets are made in various asset classes. Furthermore, the investment strategy is designed such that the age structure of the asset is matched with the expected time when the pension is paid out.
The majority of pension obligations relate to the countries Norway, Switzerland and the UK. These primarily relate to pension plans on a final salary basis, for which the pension payments to beneficiaries are adjusted annually in line with the inflation rate.
The obligations in Norway mainly relate to a pension plan set out especially for the pharmaceuticals segment, which is based on the regulations of public sector pension plans. The pension plan is managed by the Norwegian Public Service Pension Fund and the plan assets must, in accordance with the provisions of the pension fund, be sufficient to cover at least two-thirds of future pension payments.
In the Netherlands, a defined benefit plan was converted into a defined contribution plan in fiscal year 2014/15.
The obligation in Switzerland is largely invested in insurance assets. The pension fund is thus outsourced to an external insurer which ensures the agreed minimum coverage is secured in the event of a shortfall in pension assets.
The pension plans in the UK are also funded by external pension funds. The trustees decide on the minimum coverage of the obligations in consultation with the Company. Measurements are performed regularly to ensure the minimum coverage is secured as well as to determine the amount of the contributions.
The sum of all pension expenses in connection with defined contribution plans amounted to EUR 49,538k (prior year: EUR 46,870k). This amount includes the contributions the Group made to statutory pension insurance funds which fall under the definition of defined contribution plans.
The following table shows the financing status of the pension plans and the calculation of the net defined benefit liability:
EUR k 31 Jan. 2014 31 Jan. 2015
Calculation of net defined benefit liability
Present value of funded obligations − 686,910 − 596,458
Plan assets at fair value 528,164 397,987
Defined benefit obligations in excess of plan assets − 158,746 − 198,471
Present value of non-funded obligations − 77,351 − 91,907
Unrecognised asset (asset ceiling pursuant to IAS 19.64b) 0 0
Net defined benefit liability − 236,097 − 290,378
97Notes to the consolidated financial statements i CoNsolidated fiNaNCial statemeNts

The defined benefit obligations contain the following amounts included in the consolidated financial statements:
Defined benefit obligation
Fair value of plan assets Effect of the asset ceiling Net carrying amount from defined benefit plans
EUR k 31 Jan.
2014 31 Jan.
2015 31 Jan.
2014 31 Jan.
2015 31 Jan.
2014 31 Jan.
2015 31 Jan.
2014 31 Jan.
2015
Norway 389,307 459,812 260,975 289,231 − 128,332 − 170,581
Netherlands 193,578 0 179,815 0 − 13,763 0
Switzerland 59,881 77,190 52,481 62,028 − 7,400 − 15,162
United Kingdom 42,868 58,134 33,725 45,667 − 9,143 − 12,467
Other 78,627 93,229 1,168 1,061 − 77,459 − 92,168
Total 764,261 688,365 528,164 397,987 0 0 − 236,097 − 290,378
The net defined benefit liability developed as follows:
EUR k
Present value of the defined
benefit obligation
Fair value of plan assets
Total
Asset ceiling pursuant to
IAS 19.64
Total
1 February 2013 745,490 − 509,363 236,127 314 236,441
Service cost 25,451 25,451 25,451
Interest expenses/income 26,432 − 18,418 8,014 8,014
Other − 380 1,411 1,031 1,031
51,503 − 17,007 34,496 34,496
Remeasurements
Return on plan assets excluding amounts contained in interest expenses/income − 15,298 − 15,298 − 15,298
Gain/loss from changes in demographic assumptions 37,285 37,285 37,285
Gain/loss from changes in financial assumptions 4,620 4,620 4,620
Change in the effect of the asset ceiling pursuant to IAS 19.64 − 314 − 314
41,905 − 15,298 26,607 − 314 26,293
Employer contributions − 35,823 − 35,823 − 35,823
Employee contributions 2,913 − 2,913 0 0
Benefits paid − 28,401 21,319 − 7,082 − 7,082
Plan settlements − 900 − 900 − 900
Other changes recognised in equity 3,249 − 2,817 432 432
Exchange differences − 51,498 33,738 − 17,760 − 17,760
31 January 2014 764,261 − 528,164 236,097 0 236,097
98
PHOENIX group
Consolidated finanCial statements i notes to the consolidated financial statements
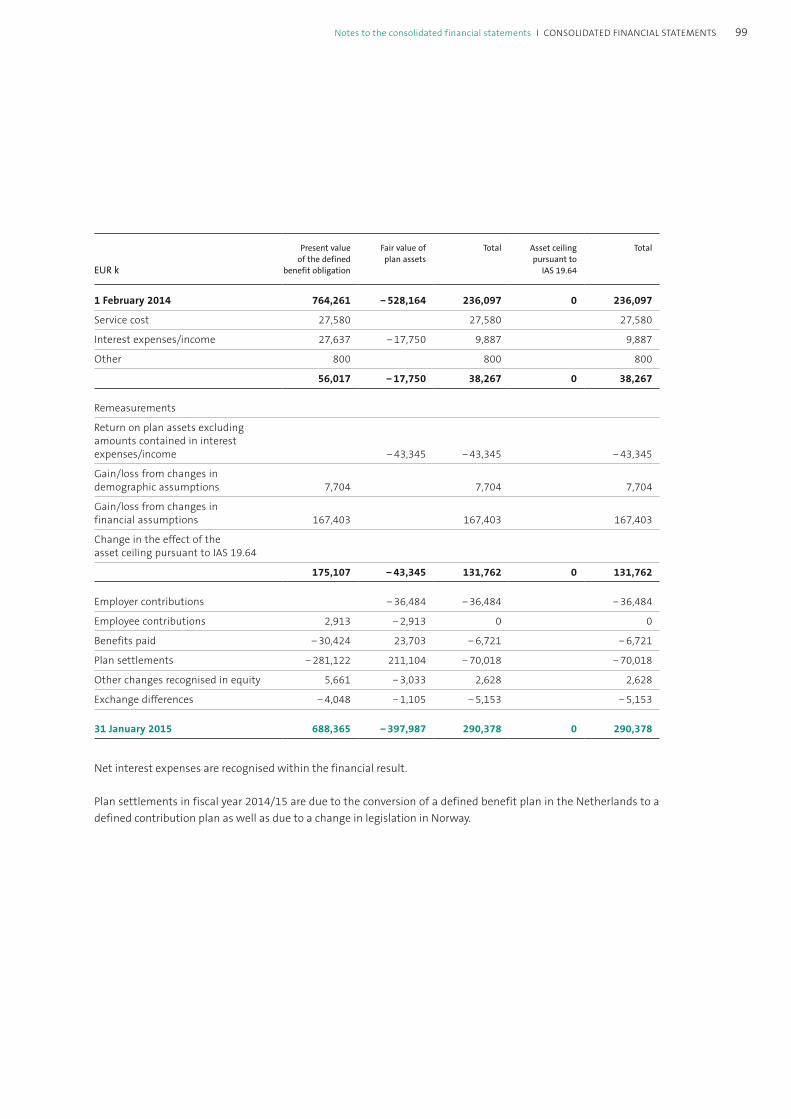
EUR k
Present value of the defined
benefit obligation
Fair value of plan assets
Total
Asset ceiling pursuant to
IAS 19.64
Total
1 February 2014 764,261 − 528,164 236,097 0 236,097
Service cost 27,580 27,580 27,580
Interest expenses/income 27,637 − 17,750 9,887 9,887
Other 800 800 800
56,017 − 17,750 38,267 0 38,267
Remeasurements
Return on plan assets excluding amounts contained in interest expenses/income − 43,345 − 43,345 − 43,345
Gain/loss from changes in demographic assumptions 7,704 7,704 7,704
Gain/loss from changes in financial assumptions 167,403 167,403 167,403
Change in the effect of the asset ceiling pursuant to IAS 19.64
175,107 − 43,345 131,762 0 131,762
Employer contributions − 36,484 − 36,484 − 36,484
Employee contributions 2,913 − 2,913 0 0
Benefits paid − 30,424 23,703 − 6,721 − 6,721
Plan settlements − 281,122 211,104 − 70,018 − 70,018
Other changes recognised in equity 5,661 − 3,033 2,628 2,628
Exchange differences − 4,048 − 1,105 − 5,153 − 5,153
31 January 2015 688,365 − 397,987 290,378 0 290,378
Net interest expenses are recognised within the financial result.
Plan settlements in fiscal year 2014/15 are due to the conversion of a defined benefit plan in the Netherlands to a defined contribution plan as well as due to a change in legislation in Norway.
99Notes to the consolidated financial statements i CoNsolidated fiNaNCial statemeNts
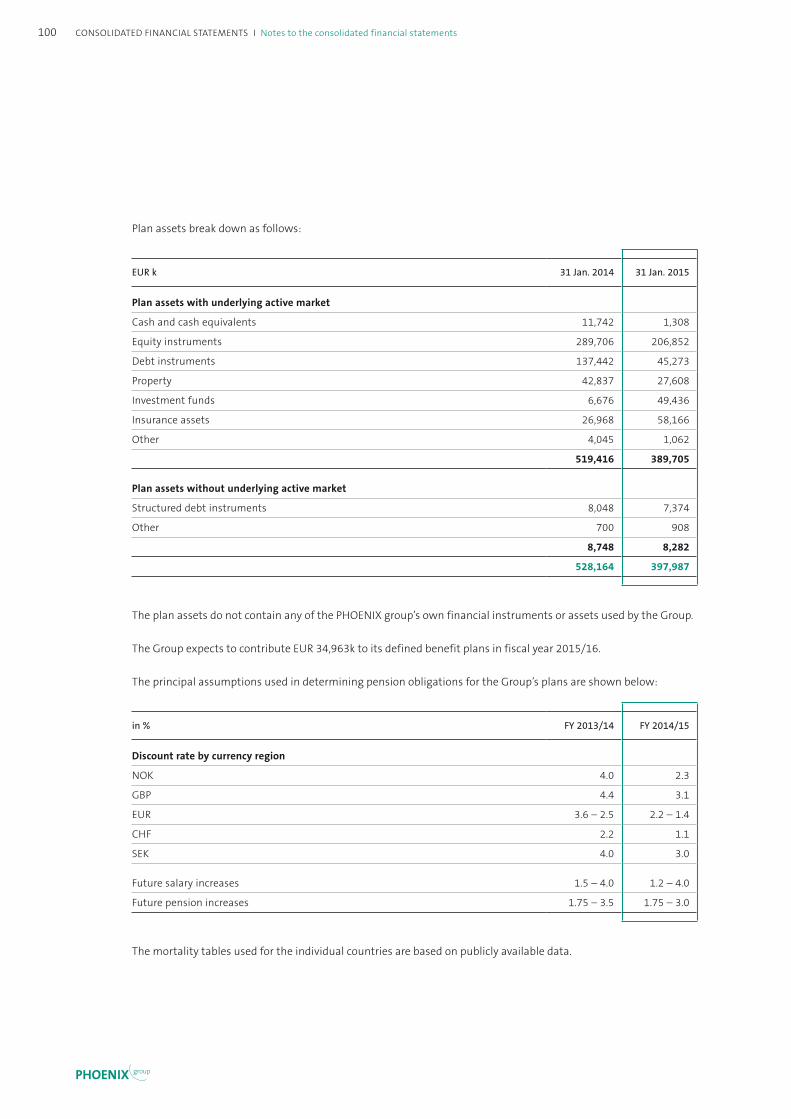
Plan assets break down as follows:
EUR k 31 Jan. 2014 31 Jan. 2015
Plan assets with underlying active market
Cash and cash equivalents 11,742 1,308
Equity instruments 289,706 206,852
Debt instruments 137,442 45,273
Property 42,837 27,608
Investment funds 6,676 49,436
Insurance assets 26,968 58,166
Other 4,045 1,062
519,416 389,705
Plan assets without underlying active market
Structured debt instruments 8,048 7,374
Other 700 908
8,748 8,282
528,164 397,987
The plan assets do not contain any of the PHOENIX group’s own financial instruments or assets used by the Group.
The Group expects to contribute EUR 34,963k to its defined benefit plans in fiscal year 2015/16.
The principal assumptions used in determining pension obligations for the Group’s plans are shown below:
in % FY 2013/14 FY 2014/15
Discount rate by currency region
NOK 4.0 2.3
GBP 4.4 3.1
EUR 3.6 – 2.5 2.2 – 1.4
CHF 2.2 1.1
SEK 4.0 3.0
Future salary increases 1.5 – 4.0 1.2 – 4.0
Future pension increases 1.75 – 3.5 1.75 – 3.0
The mortality tables used for the individual countries are based on publicly available data.
100
PHOENIX group
Consolidated finanCial statements i notes to the consolidated financial statements
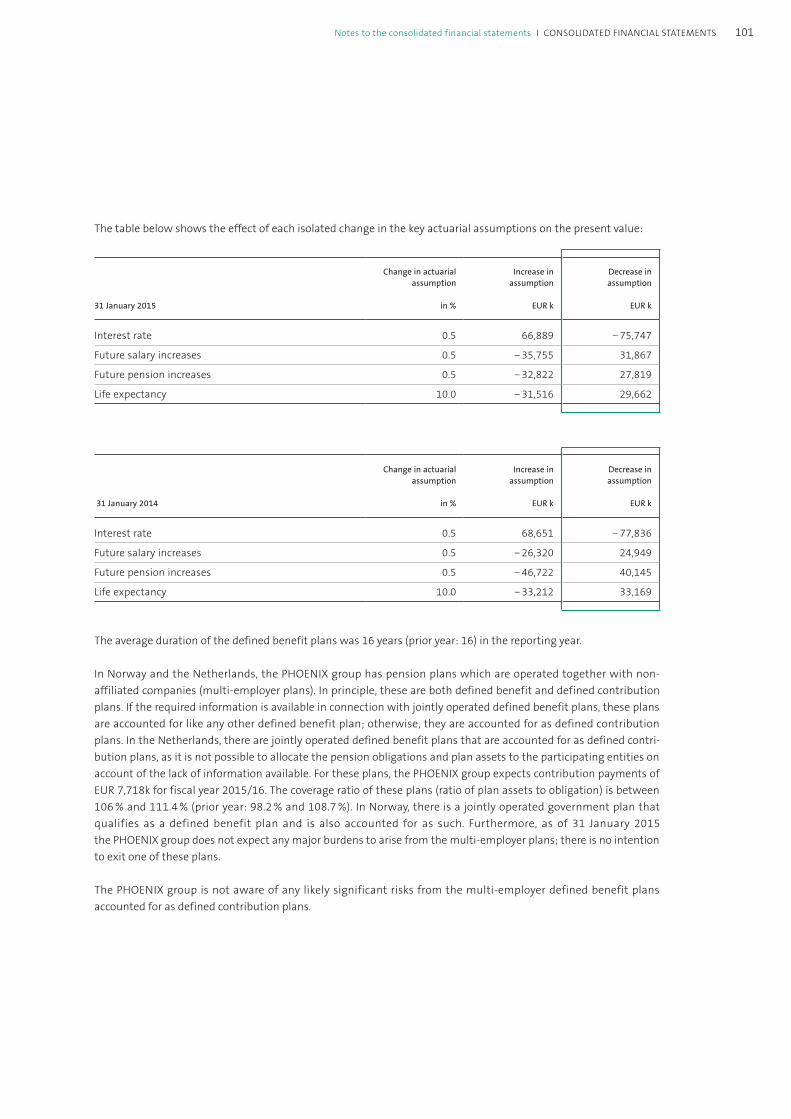
The table below shows the effect of each isolated change in the key actuarial assumptions on the present value:
31 January 2015
Change in actuarial assumption
in %
Increase in assumption
EUR k
Decrease in assumption
EUR k
Interest rate 0.5 66,889 − 75,747
Future salary increases 0.5 − 35,755 31,867
Future pension increases 0.5 − 32,822 27,819
Life expectancy 10.0 − 31,516 29,662
31 January 2014
Change in actuarial assumption
in %
Increase in assumption
EUR k
Decrease in assumption
EUR k
Interest rate 0.5 68,651 − 77,836
Future salary increases 0.5 − 26,320 24,949
Future pension increases 0.5 − 46,722 40,145
Life expectancy 10.0 − 33,212 33,169
The average duration of the defined benefit plans was 16 years (prior year: 16) in the reporting year.
In Norway and the Netherlands, the PHOENIX group has pension plans which are operated together with non- affiliated companies (multi-employer plans). In principle, these are both defined benefit and defined contribution plans. If the required information is available in connection with jointly operated defined benefit plans, these plans are accounted for like any other defined benefit plan; otherwise, they are accounted for as defined contribution plans. In the Netherlands, there are jointly operated defined benefit plans that are accounted for as defined contri-bution plans, as it is not possible to allocate the pension obligations and plan assets to the participating entities on account of the lack of information available. For these plans, the PHOENIX group expects contribution payments of EUR 7,718k for fiscal year 2015/16. The coverage ratio of these plans (ratio of plan assets to obligation) is between 106 % and 111.4 % (prior year: 98.2 % and 108.7 %). In Norway, there is a jointly operated government plan that qualifies as a defined benefit plan and is also accounted for as such. Furthermore, as of 31 January 2015 the PHOENIX group does not expect any major burdens to arise from the multi-employer plans; there is no intention to exit one of these plans.
The PHOENIX group is not aware of any likely significant risks from the multi-employer defined benefit plans accounted for as defined contribution plans.
101Notes to the consolidated financial statements i CoNsolidated fiNaNCial statemeNts
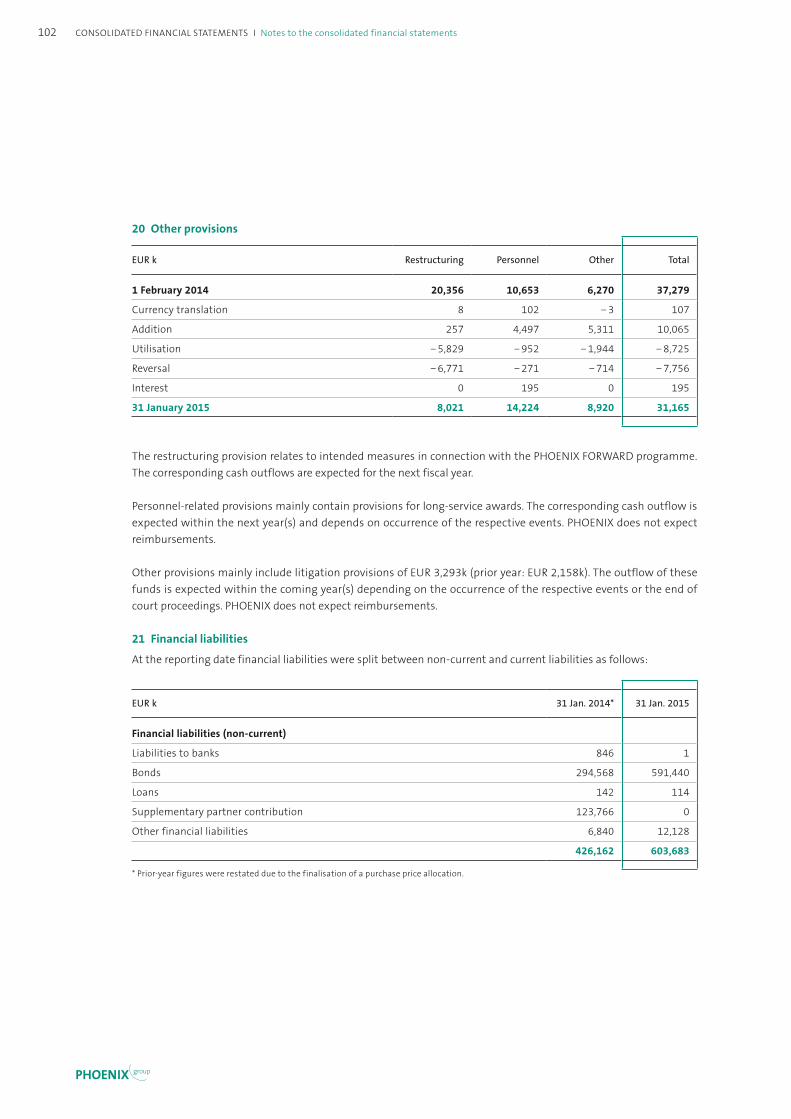
20 Other provisions
EUR k Restructuring Personnel Other Total
1 February 2014 20,356 10,653 6,270 37,279
Currency translation 8 102 − 3 107
Addition 257 4,497 5,311 10,065
Utilisation − 5,829 − 952 − 1,944 − 8,725
Reversal − 6,771 − 271 − 714 − 7,756
Interest 0 195 0 195
31 January 2015 8,021 14,224 8,920 31,165
The restructuring provision relates to intended measures in connection with the PHOENIX FORWARD programme. The corresponding cash outflows are expected for the next fiscal year.
Personnel-related provisions mainly contain provisions for long-service awards. The corresponding cash outflow is expected within the next year(s) and depends on occurrence of the respective events. PHOENIX does not expect reimbursements.
Other provisions mainly include litigation provisions of EUR 3,293k (prior year: EUR 2,158k). The outflow of these funds is expected within the coming year(s) depending on the occurrence of the respective events or the end of court proceedings. PHOENIX does not expect reimbursements.
21 Financial liabilities
At the reporting date financial liabilities were split between non-current and current liabilities as follows:
EUR k 31 Jan. 2014* 31 Jan. 2015
Financial liabilities (non-current)
Liabilities to banks 846 1
Bonds 294,568 591,440
Loans 142 114
Supplementary partner contribution 123,766 0
Other financial liabilities 6,840 12,128
426,162 603,683
* Prior-year figures were restated due to the finalisation of a purchase price allocation.
102
PHOENIX group
Consolidated finanCial statements i notes to the consolidated financial statements
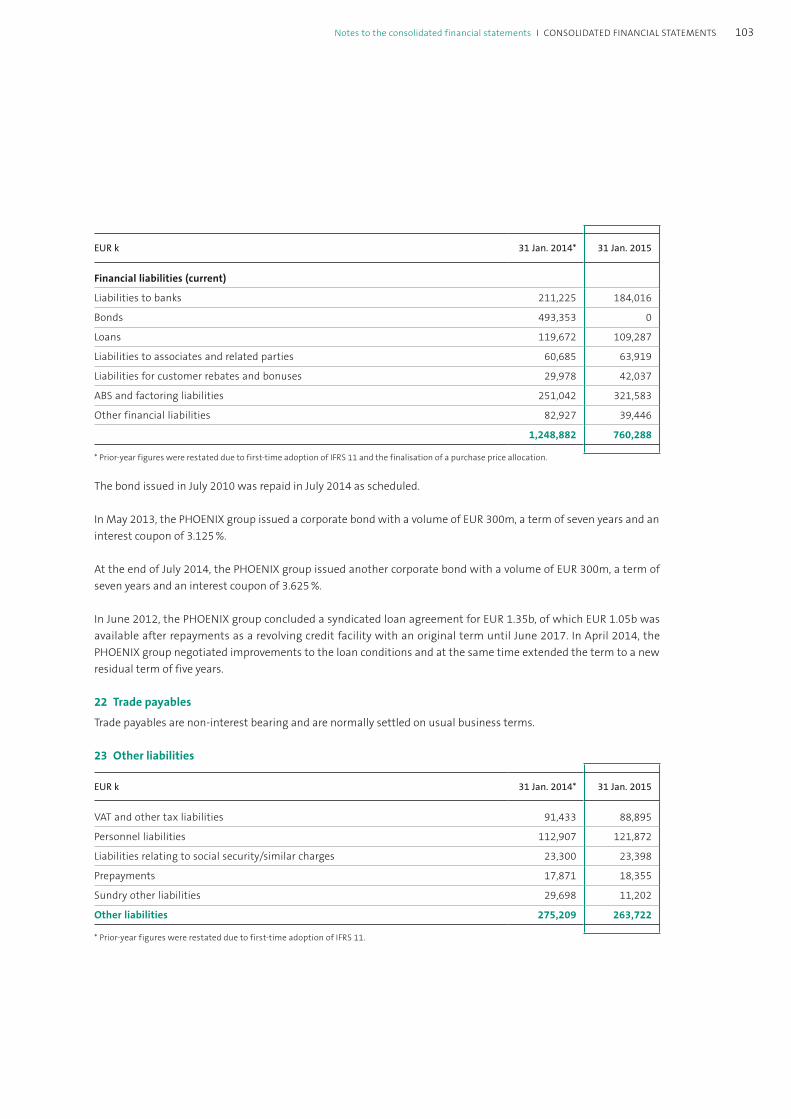
EUR k 31 Jan. 2014* 31 Jan. 2015
Financial liabilities (current)
Liabilities to banks 211,225 184,016
Bonds 493,353 0
Loans 119,672 109,287
Liabilities to associates and related parties 60,685 63,919
Liabilities for customer rebates and bonuses 29,978 42,037
ABS and factoring liabilities 251,042 321,583
Other financial liabilities 82,927 39,446
1,248,882 760,288
* Prior-year figures were restated due to first-time adoption of IFRS 11 and the finalisation of a purchase price allocation.
The bond issued in July 2010 was repaid in July 2014 as scheduled.
In May 2013, the PHOENIX group issued a corporate bond with a volume of EUR 300m, a term of seven years and an interest coupon of 3.125 %.
At the end of July 2014, the PHOENIX group issued another corporate bond with a volume of EUR 300m, a term of seven years and an interest coupon of 3.625 %.
In June 2012, the PHOENIX group concluded a syndicated loan agreement for EUR 1.35b, of which EUR 1.05b was available after repayments as a revolving credit facility with an original term until June 2017. In April 2014, the PHOENIX group negotiated improvements to the loan conditions and at the same time extended the term to a new residual term of five years.
22 Trade payables
Trade payables are non-interest bearing and are normally settled on usual business terms.
23 Other liabilities
EUR k 31 Jan. 2014* 31 Jan. 2015
VAT and other tax liabilities 91,433 88,895
Personnel liabilities 112,907 121,872
Liabilities relating to social security/similar charges 23,300 23,398
Prepayments 17,871 18,355
Sundry other liabilities 29,698 11,202
Other liabilities 275,209 263,722
* Prior-year figures were restated due to first-time adoption of IFRS 11.
103Notes to the consolidated financial statements i CoNsolidated fiNaNCial statemeNts
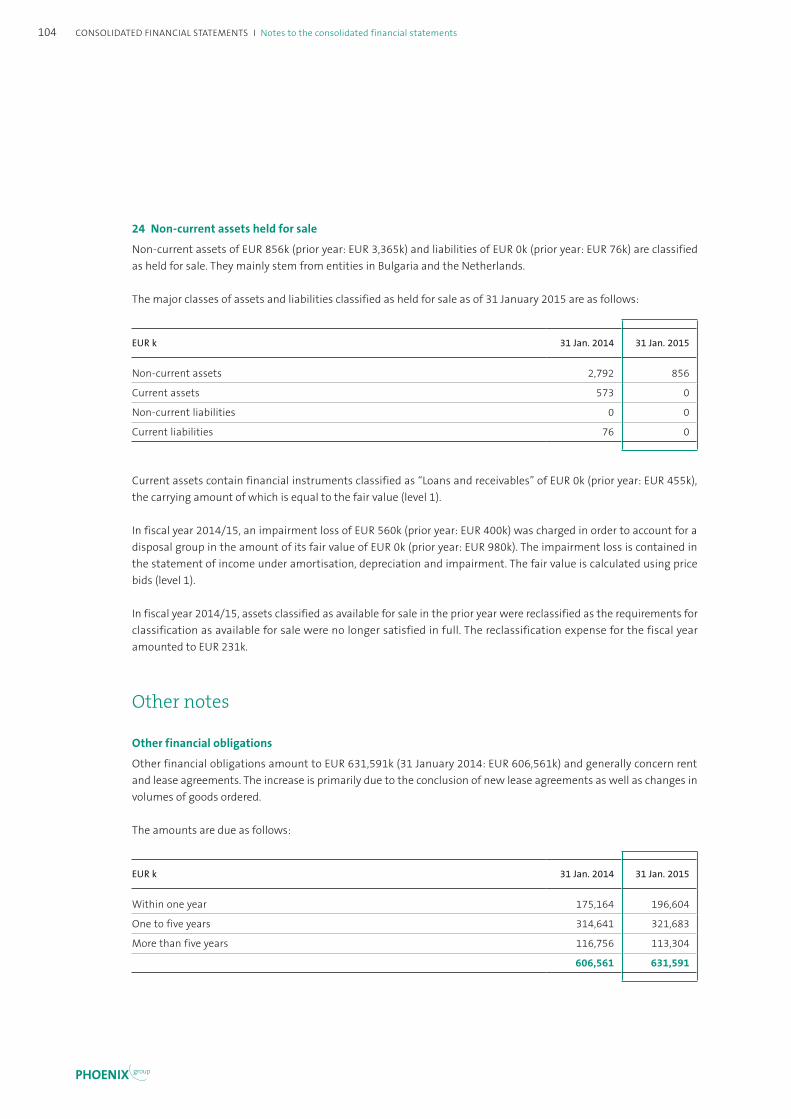
24 Non-current assets held for sale
Non-current assets of EUR 856k (prior year: EUR 3,365k) and liabilities of EUR 0k (prior year: EUR 76k) are classified as held for sale. They mainly stem from entities in Bulgaria and the Netherlands.
The major classes of assets and liabilities classified as held for sale as of 31 January 2015 are as follows:
EUR k 31 Jan. 2014 31 Jan. 2015
Non-current assets 2,792 856
Current assets 573 0
Non-current liabilities 0 0
Current liabilities 76 0
Current assets contain financial instruments classified as “Loans and receivables” of EUR 0k (prior year: EUR 455k), the carrying amount of which is equal to the fair value (level 1).
In fiscal year 2014/15, an impairment loss of EUR 560k (prior year: EUR 400k) was charged in order to account for a disposal group in the amount of its fair value of EUR 0k (prior year: EUR 980k). The impairment loss is contained in the statement of income under amortisation, depreciation and impairment. The fair value is calculated using price bids (level 1).
In fiscal year 2014/15, assets classified as available for sale in the prior year were reclassified as the requirements for classification as available for sale were no longer satisfied in full. The reclassification expense for the fiscal year amounted to EUR 231k.
Other notes
Other financial obligations
Other financial obligations amount to EUR 631,591k (31 January 2014: EUR 606,561k) and generally concern rent and lease agreements. The increase is primarily due to the conclusion of new lease agreements as well as changes in volumes of goods ordered.
The amounts are due as follows:
EUR k 31 Jan. 2014 31 Jan. 2015
Within one year 175,164 196,604
One to five years 314,641 321,683
More than five years 116,756 113,304
606,561 631,591
104
PHOENIX group
Consolidated finanCial statements i notes to the consolidated financial statements

Contingent liabilities
Contingent liabilities comprise EUR 100,060k (31 January 2014: EUR 111,373k) and exclusively relate to guarantees.
Guarantees are potential future obligations to third parties, the existence of which depends on the occurrence of at least one uncertain future event outside the control of PHOENIX. The guarantees mainly relate to pharmacy customers in the wholesale business and were primarily issued by subsidiaries of the subgroups in the UK and Austria. The guarantees include obligations for which the probability of outflow is remote.
The PHOENIX group has filed an appeal with the tax authorities regarding VAT for the period 2001 through 2004. Amended VAT and interest notices were issued for 2001 and 2002, against which PHOENIX has filed an objection/proceedings and lodged an appeal for suspension of enforcement. Pending the conclusion of the appeal proceed-ings, it is not possible to assess the timing and extent of cash outflows.
Additional information on financial instruments
The items in the statement of financial position for financial instruments are assigned to classes and categories. The carrying amounts for each category and class and the fair values for each class are presented in the following table for fiscal year 2014/15:
Category pursuant to IAS 39
31 Jan. 2015 EUR k
Loans and receivables
Available forsale
financial assets
Heldto maturity financial
assets
Financial assets
held for trading
Outside the scope of
IFRS 7
Carrying amount
Fair value
Assets
Available-for-sale financial assets 0 35,689 0 0 0 35,689 35,689
Trade receivables 2,436,183 0 0 0 0 2,436,183 2,436,183
Loans to and receivables from associates or related parties 10,836 0 0 0 0 10,836 10,836
Other loans 45,901 0 0 0 0 45,901 45,922
Derivative financial assets without hedge accounting 0 0 0 670 0 670 670
Other financial assets 164,438 0 0 0 0 164,438 164,438
Cash and cash equivalents 567,449 0 0 0 0 567,449 567,449
105Notes to the consolidated financial statements i CoNsolidated fiNaNCial statemeNts

The carrying amounts for each category and class and the fair values for each class are presented in the following table for fiscal year 2013/14:
Category pursuant to IAS 39
31 Jan. 2014* EUR k
Loans and receivables
Available forsale
financial assets
Heldto maturity financial
assets
Financial assets
held for trading
Outside the scope of
IFRS 7
Carrying amount
Fair value
Assets
Available-for-sale financial assets 0 39,657 0 0 0 39,657 39,657
Trade receivables 2,353,127 0 0 0 0 2,353,127 2,353,127
Loans to and receivables from associates or related parties 10,085 0 0 0 0 10,085 10,085
Other loans 46,573 0 0 0 0 46,573 46,725
Derivative financial assets without hedge accounting 0 0 0 59 0 59 59
Other financial assets 153,501 73 0 0 0 153,574 153,574
Cash and cash equivalents 494,454 0 0 0 0 494,454 494,454
* Prior-year figures were restated due to first-time adoption of IFRS 11.
Available-for-sale financial assets primarily contain shares in unlisted entities. Where no fair value can be deter-mined, they are recorded at acquisition cost. Shares in listed entities are measured at the quoted price determined as of the reporting date. For other available-for-sale financial assets, the fair value is determined using a multiplier method (revenue multiple, level 3). This uses individually derived multipliers between 0.62 and 1.2 (prior year: between 0.62 and 1.2). A 10 % increase in the multipliers would increase the value by EUR 4,426k (prior year: EUR 4,260k); a 10 % decrease in the multipliers would decrease the value by EUR 4,252k (prior year: EUR 4,005k).
Derivatives are carried at fair value.
106
PHOENIX group
Consolidated finanCial statements i notes to the consolidated financial statements

Due to the short-term maturities of cash and cash equivalents, receivables and other current financial assets, their carrying amounts generally approximate the fair values at the reporting date.
The fair values of loans to and receivables from associates or related entities, other loans, held-to-maturity financial assets and other non-current financial assets due after more than one year correspond to the net present value of the payments related to the assets based on the current interest rate parameters and yield curves.
The carrying amounts for each category and class of financial liabilities and the fair values for each class are presented in the following table for fiscal year 2014/15:
Category pursuant to IAS 39
31 Jan. 2015 EUR k
Other financial liabilities
Financial liabilities
held for trading
No category according to
IAS 39.9
Outside the scope of
IFRS 7
Carrying amount
Fair value
Financial liabilities
Liabilities to banks 184,017 0 0 0 184,017 184,017
Bonds 591,440 0 0 0 591,440 621,663
Loans 109,401 0 0 0 109,401 109,401
Trade payables 3,130,482 0 0 0 3,130,482 3,130,482
Liabilities to associates and related parties 63,919 0 0 0 63,919 63,919
Supplementary contributions 0 0 0 0 0 0
Liabilities and provisions for customer rebates and bonuses 42,037 0 0 0 42,037 42,037
ABS and factoring liabilities 321,583 0 0 0 321,583 321,583
Other financial liabilities 22,681 0 16,741 0 39,422 39,422
Derivative financial liabilities without hedge accounting 0 12,152 0 0 12,152 12,152
107Notes to the consolidated financial statements i CoNsolidated fiNaNCial statemeNts

The carrying amounts for each category and class of financial liabilities and the fair values for each class are presented in the following table for fiscal year 2013/14:
Category pursuant to IAS 39
31 Jan. 2014* EUR k
Other financial liabilities
Financial liabilities
held for trading
No category according to
IAS 39.9
Outside the scope of
IFRS 7
Carrying amount
Fair value
Financial liabilities
Liabilities to banks 212,071 0 0 0 212,071 212,071
Bonds 787,921 0 0 0 787,921 804,942
Loans 119,814 0 0 0 119,814 119,814
Trade payables 2,813,538 0 0 0 2,813,538 2,813,538
Liabilities to associates and related parties 60,685 0 0 0 60,685 60,685
Supplementary contributions 123,766 0 0 0 123,766 123,766
Liabilities and provisions for customer rebates and bonuses 29,978 0 0 0 29,978 29,978
ABS and factoring liabilities 251,042 0 0 0 251,042 251,042
Other financial liabilities 46,724 0 39,936 0 86,660 86,660
Derivative financial liabilities without hedge accounting
0 3,107 0 0 3,107 3,107
* Prior-year figures were restated due to first-time adoption of IFRS 11.
The fair value of the bonds is the nominal value multiplied by the quoted price as of the reporting date (level 1).
Derivatives are carried at fair value (level 2).
Due to the short-term maturities of trade payables and other current financial liabilities their carrying amounts generally approximate the fair values at the reporting date (level 2).
108
PHOENIX group
Consolidated finanCial statements i notes to the consolidated financial statements

Fair value hierarchy of financial instrumentsPHOENIX applies the following fair value hierarchy to define and present its financial instruments measured at fair value:
Level 1: Quoted (unadjusted) prices in active markets for identical assets or liabilities.
Level 2: Inputs other than quoted prices included within level 1 that are observable for the asset or liability, either directly (i.e., as prices) or indirectly (i.e., derived from prices).
Level 3: Techniques that use inputs that are not based on observable market data.
Financial instruments measured at fair value
EUR k Level 1 Level 2 Level 3 Total
31 Jan. 2015
Available-for-sale financial assets 0 0 31,630 31,630
Derivative financial assets without hedge accounting 0 670 0 670
Derivative financial liabilities without hedge accounting 0 12,152 0 12,152
31 Jan. 2014
Available-for-sale financial assets 0 0 29,424 29,424
Derivative financial assets without hedge accounting 0 59 0 59
Derivative financial liabilities without hedge accounting 0 3,107 0 3,107
The fair value of available-for-sale assets measured at cost of EUR 4,059k (prior year: EUR 10,233k) has not been disclosed because the fair value cannot be measured reliably. A sale is not currently planned.
109Notes to the consolidated financial statements i CoNsolidated fiNaNCial statemeNts
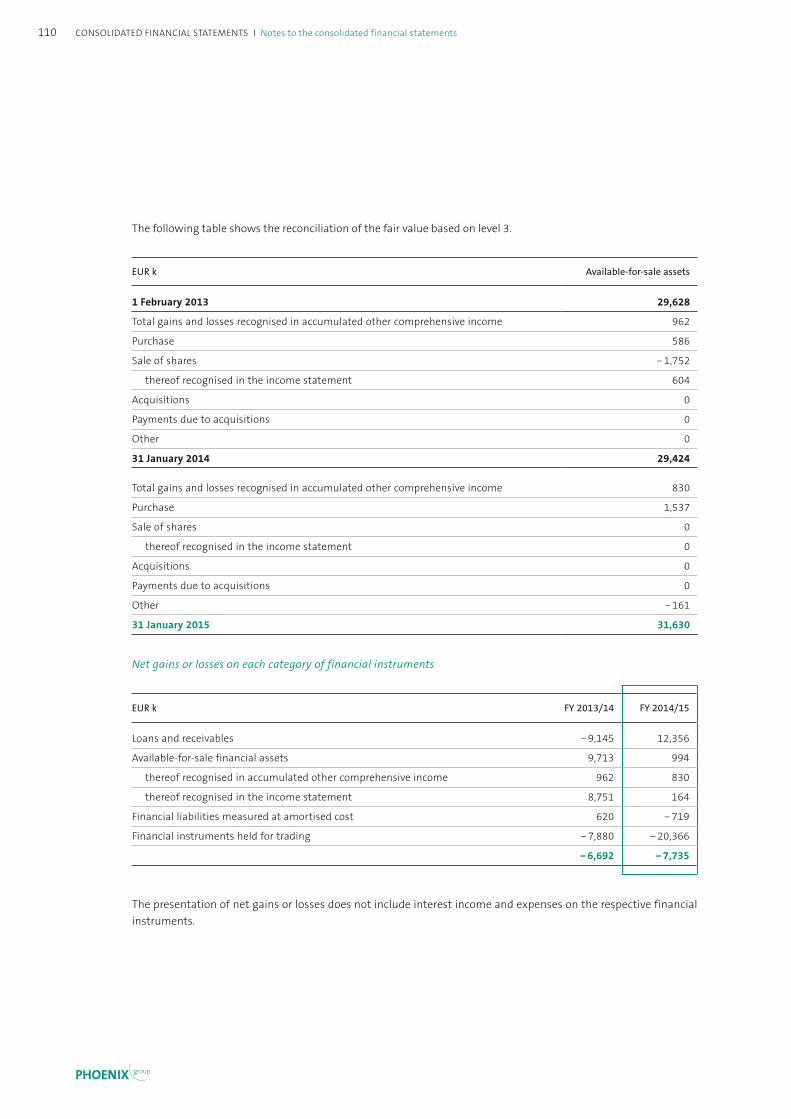
The following table shows the reconciliation of the fair value based on level 3.
EUR k Availableforsale assets
1 February 2013 29,628
Total gains and losses recognised in accumulated other comprehensive income 962
Purchase 586
Sale of shares − 1,752
thereof recognised in the income statement 604
Acquisitions 0
Payments due to acquisitions 0
Other 0
31 January 2014 29,424
Total gains and losses recognised in accumulated other comprehensive income 830
Purchase 1,537
Sale of shares 0
thereof recognised in the income statement 0
Acquisitions 0
Payments due to acquisitions 0
Other − 161
31 January 2015 31,630
Net gains or losses on each category of financial instruments
EUR k FY 2013/14 FY 2014/15
Loans and receivables − 9,145 12,356
Available-for-sale financial assets 9,713 994
thereof recognised in accumulated other comprehensive income 962 830
thereof recognised in the income statement 8,751 164
Financial liabilities measured at amortised cost 620 − 719
Financial instruments held for trading − 7,880 − 20,366
− 6,692 − 7,735
The presentation of net gains or losses does not include interest income and expenses on the respective financial instruments.
110
PHOENIX group
Consolidated finanCial statements i notes to the consolidated financial statements
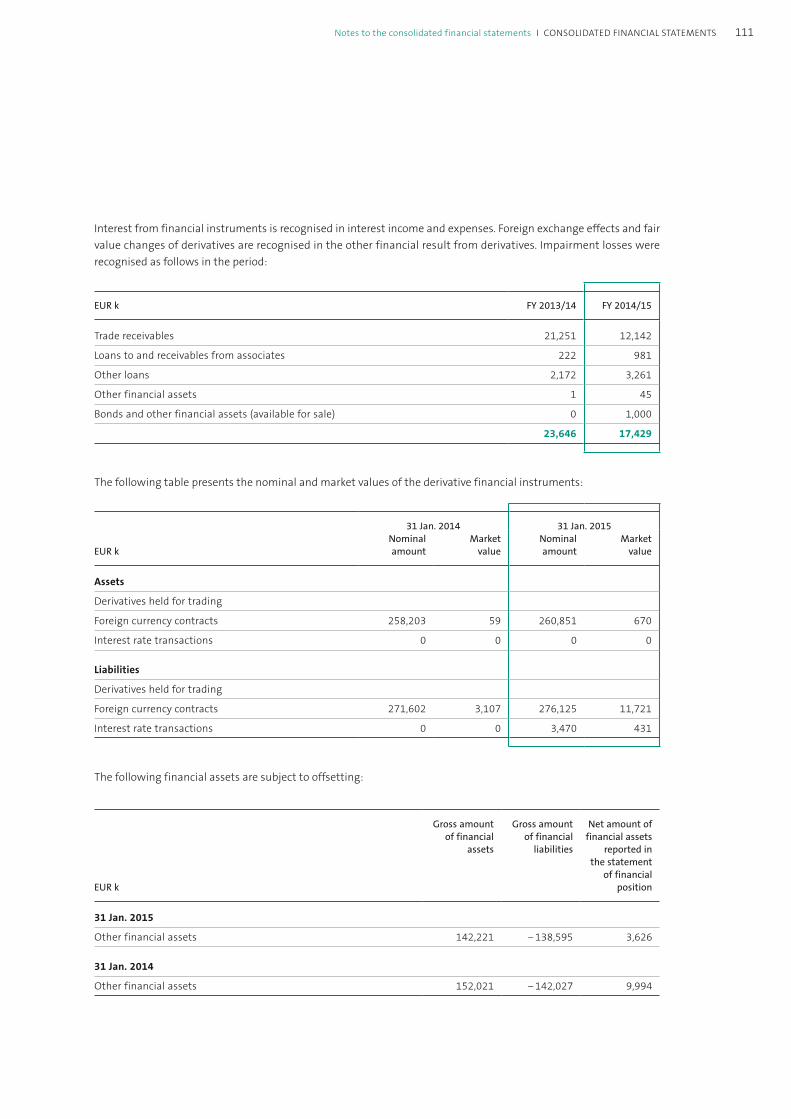
Interest from financial instruments is recognised in interest income and expenses. Foreign exchange effects and fair value changes of derivatives are recognised in the other financial result from derivatives. Impairment losses were recognised as follows in the period:
EUR k FY 2013/14 FY 2014/15
Trade receivables 21,251 12,142
Loans to and receivables from associates 222 981
Other loans 2,172 3,261
Other financial assets 1 45
Bonds and other financial assets (available for sale) 0 1,000
23,646 17,429
The following table presents the nominal and market values of the derivative financial instruments:
31 Jan. 2014 31 Jan. 2015
EUR kNominal amount
Market value
Nominal amount
Market value
Assets
Derivatives held for trading
Foreign currency contracts 258,203 59 260,851 670
Interest rate transactions 0 0 0 0
Liabilities
Derivatives held for trading
Foreign currency contracts 271,602 3,107 276,125 11,721
Interest rate transactions 0 0 3,470 431
The following financial assets are subject to offsetting:
EUR k
Gross amount of financial
assets
Gross amount of financial
liabilities
Net amount of financial assets
reported in the statement
of financial position
31 Jan. 2015
Other financial assets 142,221 − 138,595 3,626
31 Jan. 2014
Other financial assets 152,021 − 142,027 9,994
111Notes to the consolidated financial statements i CoNsolidated fiNaNCial statemeNts
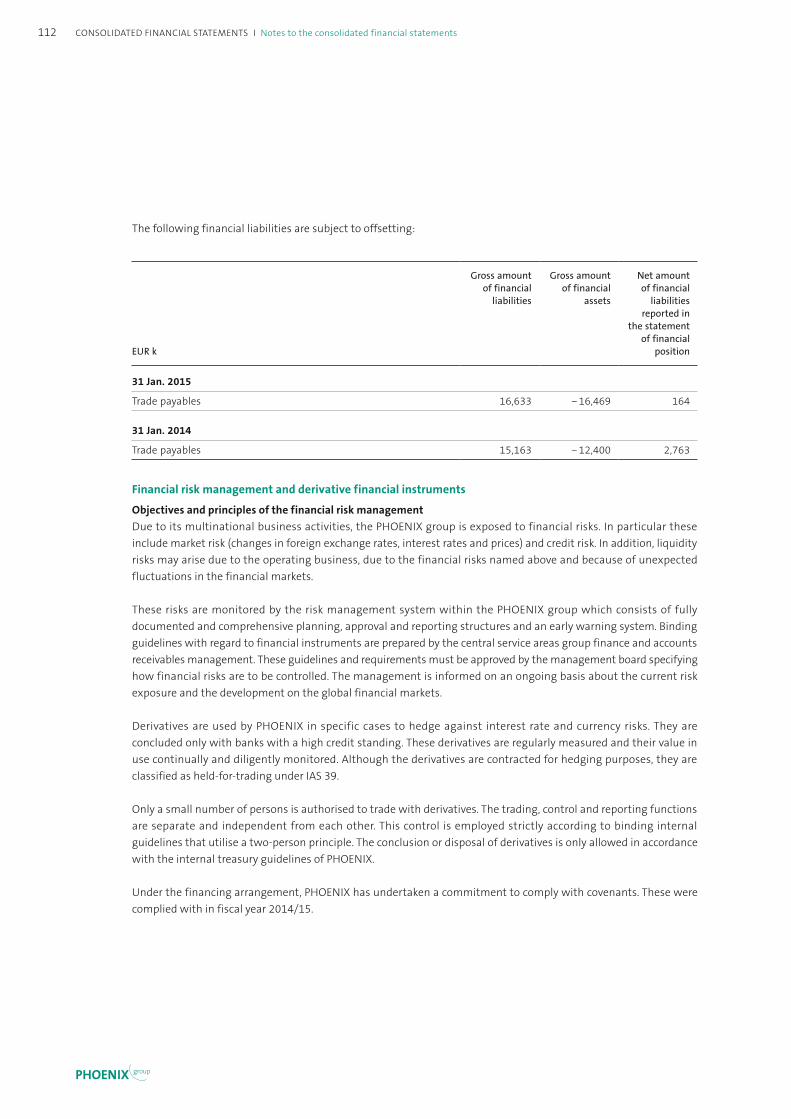
The following financial liabilities are subject to offsetting:
EUR k
Gross amount of financial
liabilities
Gross amount of financial
assets
Net amount of financial
liabilities reported in
the statement of financial
position
31 Jan. 2015
Trade payables 16,633 − 16,469 164
31 Jan. 2014
Trade payables 15,163 − 12,400 2,763
Financial risk management and derivative financial instruments
Objectives and principles of the financial risk managementDue to its multinational business activities, the PHOENIX group is exposed to financial risks. In particular these include market risk (changes in foreign exchange rates, interest rates and prices) and credit risk. In addition, liquidity risks may arise due to the operating business, due to the financial risks named above and because of unexpected fluctuations in the financial markets.
These risks are monitored by the risk management system within the PHOENIX group which consists of fully documented and comprehensive planning, approval and reporting structures and an early warning system. Binding guidelines with regard to financial instruments are prepared by the central service areas group finance and accounts receivables management. These guidelines and requirements must be approved by the management board specifying how financial risks are to be controlled. The management is informed on an ongoing basis about the current risk exposure and the development on the global financial markets.
Derivatives are used by PHOENIX in specific cases to hedge against interest rate and currency risks. They are concluded only with banks with a high credit standing. These derivatives are regularly measured and their value in use continually and diligently monitored. Although the derivatives are contracted for hedging purposes, they are classified as held-for-trading under IAS 39.
Only a small number of persons is authorised to trade with derivatives. The trading, control and reporting functions are separate and independent from each other. This control is employed strictly according to binding internal guidelines that utilise a two-person principle. The conclusion or disposal of derivatives is only allowed in accordance with the internal treasury guidelines of PHOENIX.
Under the financing arrangement, PHOENIX has undertaken a commitment to comply with covenants. These were complied with in fiscal year 2014/15.
112
PHOENIX group
Consolidated finanCial statements i notes to the consolidated financial statements
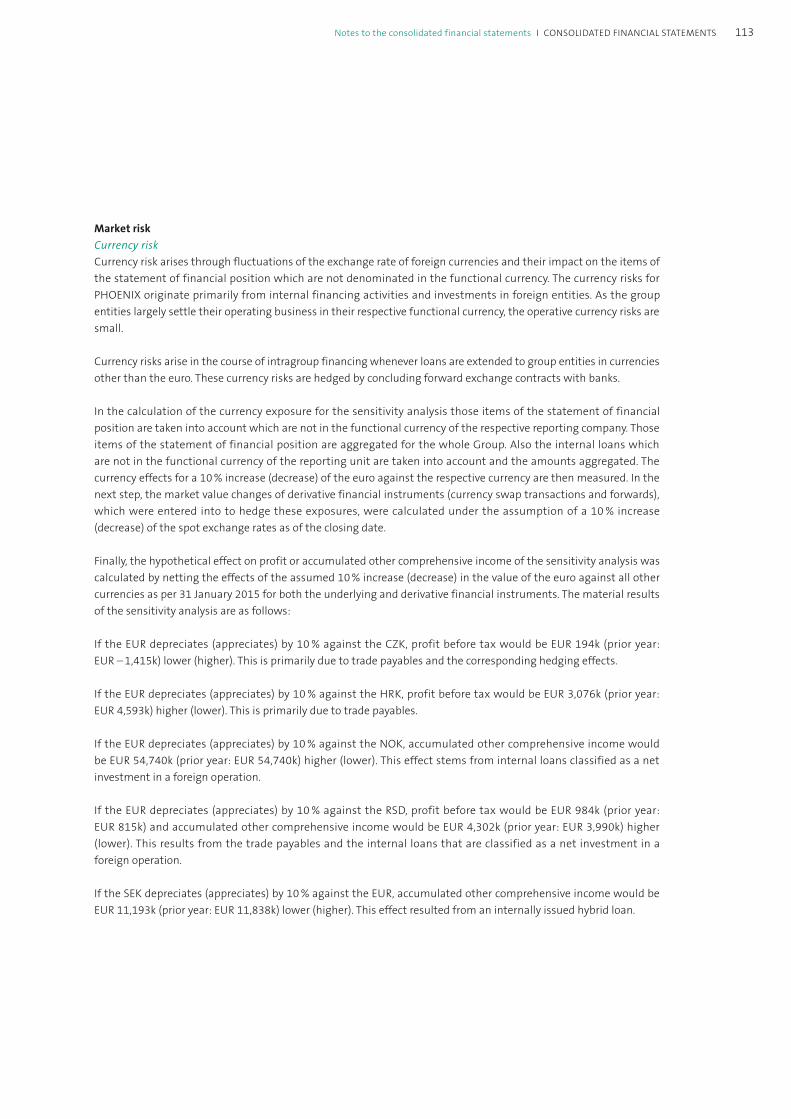
Market riskCurrency riskCurrency risk arises through fluctuations of the exchange rate of foreign currencies and their impact on the items of the statement of financial position which are not denominated in the functional currency. The currency risks for PHOENIX originate primarily from internal financing activities and investments in foreign entities. As the group entities largely settle their operating business in their respective functional currency, the operative currency risks are small.
Currency risks arise in the course of intragroup financing whenever loans are extended to group entities in currencies other than the euro. These currency risks are hedged by concluding forward exchange contracts with banks.
In the calculation of the currency exposure for the sensitivity analysis those items of the statement of financial position are taken into account which are not in the functional currency of the respective reporting company. Those items of the statement of financial position are aggregated for the whole Group. Also the internal loans which are not in the functional currency of the reporting unit are taken into account and the amounts aggregated. The currency effects for a 10 % increase (decrease) of the euro against the respective currency are then measured. In the next step, the market value changes of derivative financial instruments (currency swap transactions and forwards), which were entered into to hedge these exposures, were calculated under the assumption of a 10 % increase (decrease) of the spot exchange rates as of the closing date.
Finally, the hypothetical effect on profit or accumulated other comprehensive income of the sensitivity analysis was calculated by netting the effects of the assumed 10 % increase (decrease) in the value of the euro against all other currencies as per 31 January 2015 for both the underlying and derivative financial instruments. The material results of the sensitivity analysis are as follows:
If the EUR depreciates (appreciates) by 10 % against the CZK, profit before tax would be EUR 194k (prior year: EUR – 1,415k) lower (higher). This is primarily due to trade payables and the corresponding hedging effects.
If the EUR depreciates (appreciates) by 10 % against the HRK, profit before tax would be EUR 3,076k (prior year: EUR 4,593k) higher (lower). This is primarily due to trade payables.
If the EUR depreciates (appreciates) by 10 % against the NOK, accumulated other comprehensive income would be EUR 54,740k (prior year: EUR 54,740k) higher (lower). This effect stems from internal loans classified as a net investment in a foreign operation.
If the EUR depreciates (appreciates) by 10 % against the RSD, profit before tax would be EUR 984k (prior year: EUR 815k) and accumulated other comprehensive income would be EUR 4,302k (prior year: EUR 3,990k) higher (lower). This results from the trade payables and the internal loans that are classified as a net investment in a foreign operation.
If the SEK depreciates (appreciates) by 10 % against the EUR, accumulated other comprehensive income would be EUR 11,193k (prior year: EUR 11,838k) lower (higher). This effect resulted from an internally issued hybrid loan.
113Notes to the consolidated financial statements i CoNsolidated fiNaNCial statemeNts

Interest rate riskInterest rate risks exist as a result of potential changes in the market interest rate and may lead to a change in fair value in the case of fixed interest bearing financial instruments and to fluctuations in interest payments in the case of variable interest-bearing financial instruments. As of 31 January 2015, there was only one interest option (collar) to hedge against increasing reference interest rates at an agreed minimum interest rate from 2010/11. This was accounted for as a derivative held for trading.
For financial instruments with fixed interest that are measured at amortised cost, changes in market interest rates have no impact on the earnings and equity. With regard to variable interest-bearing financial instruments, changes in market risk rates impact the earnings and are thus considered in the sensitivity analysis.
The interest sensitivity analysis presented below shows the hypothetical effects which a change in the market inter-est rate at the reporting date would have had on the pre-tax result. It assumes that the exposure at the reporting date is representative of the year as a whole.
PHOENIX’s fixed-interest period is primarily of a long-term nature. Therefore, a positive (negative) parallel shift of the EUR market yield curve by 100 basis points as of the reporting date would lead to a positive (negative) impact of EUR 332k (prior year: EUR 29k) on the profit before tax.
A positive (negative) parallel shift of 100 basis points for the EUR interest rate curves, assuming other interest rate curves and exchange rates remain constant, would have a negative (positive) effect of EUR 596k (EUR 600k) on profit before tax on account of the interest derivatives in the portfolio as of the reporting date. In the prior year, the posi-tive (negative) shift for the EUR yield curve would have resulted in a negative (positive) effect of EUR 359k (EUR 95k).
For the interest rate collar in the portfolio, a positive (negative) parallel shift of 100 basis points for the EUR interest rate curves would have a positive (negative) effect of EUR 217k (prior year: EUR 30k) on profit before tax.
Credit riskFrom the Group’s perspective, credit risk describes the risk that a party to a financial instrument will fail to meet its contractual obligations and thus cause a financial loss for the Group. Credit risk comprises both the direct default risk and the risk that the creditworthiness of the counterparty will deteriorate, as well as the concentration of risks. The Group is exposed to credit risk from its operating activities, from certain financial transactions and from the granting of financial guarantees for bank loans for pharmacy customers, mainly in Austria and the UK.
The maximum exposure of financial assets to credit risk is equal to the carrying amount of each class of financial assets plus the nominal volume of financial guarantee contracts issued.
The level of credit risk from operating activities is monitored and kept in check by a rigorous accounts receivable management system. Due to the structure of our customers, the risk of default is assessed to be rather low in the Group. This is because our customers, in the wholesale segment mostly pharmacies, generally have a high credit standing. Despite some bigger customers, our customer base is widely diversified with small amounts of receivables allocable to each individual customer. In the course of liberalisation of the pharmacy markets in Europe, however, pharmacy chains and new sales channels are increasingly emerging, creating a large number of major customers with a higher level of receivables outstanding. In addition, the Group holds in some cases promissory notes from customers, pledged assets of pharmacies, mortgages and other personal guarantees as collateral for loans to pharmacies in the form of goods supplied.
114
PHOENIX group
Consolidated finanCial statements i notes to the consolidated financial statements
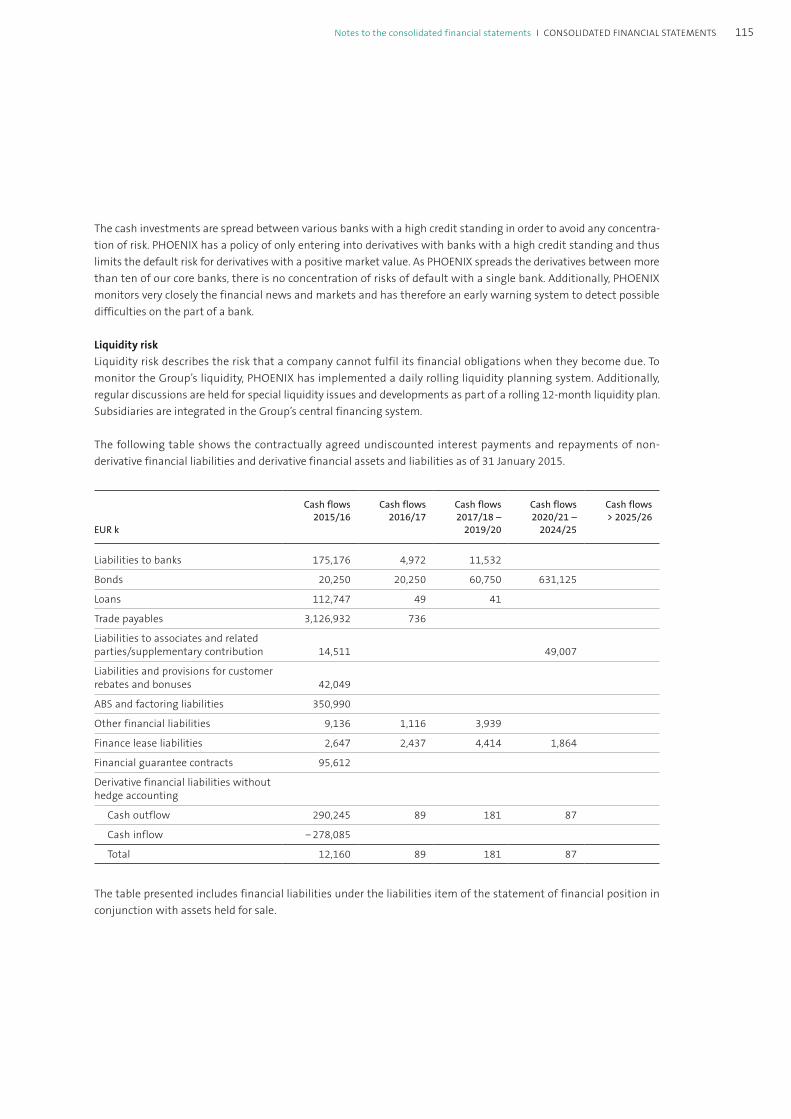
The cash investments are spread between various banks with a high credit standing in order to avoid any concentra-tion of risk. PHOENIX has a policy of only entering into derivatives with banks with a high credit standing and thus limits the default risk for derivatives with a positive market value. As PHOENIX spreads the derivatives between more than ten of our core banks, there is no concentration of risks of default with a single bank. Additionally, PHOENIX monitors very closely the financial news and markets and has therefore an early warning system to detect possible difficulties on the part of a bank.
Liquidity riskLiquidity risk describes the risk that a company cannot fulfil its financial obligations when they become due. To monitor the Group’s liquidity, PHOENIX has implemented a daily rolling liquidity planning system. Additionally, regular discussions are held for special liquidity issues and developments as part of a rolling 12-month liquidity plan. Subsidiaries are integrated in the Group’s central financing system.
The following table shows the contractually agreed undiscounted interest payments and repayments of non- derivative financial liabilities and derivative financial assets and liabilities as of 31 January 2015.
EUR k
Cash flows 2015/16
Cash flows 2016/17
Cash flows 2017/18 –
2019/20
Cash flows 2020/21 –
2024/25
Cash flows > 2025/26
Liabilities to banks 175,176 4,972 11,532
Bonds 20,250 20,250 60,750 631,125
Loans 112,747 49 41
Trade payables 3,126,932 736
Liabilities to associates and related parties/supplementary contribution 14,511 49,007
Liabilities and provisions for customer rebates and bonuses 42,049
ABS and factoring liabilities 350,990
Other financial liabilities 9,136 1,116 3,939
Finance lease liabilities 2,647 2,437 4,414 1,864
Financial guarantee contracts 95,612
Derivative financial liabilities without hedge accounting
Cash outflow 290,245 89 181 87
Cash inflow − 278,085
Total 12,160 89 181 87
The table presented includes financial liabilities under the liabilities item of the statement of financial position in conjunction with assets held for sale.
115Notes to the consolidated financial statements i CoNsolidated fiNaNCial statemeNts

The contractually agreed undiscounted payments at 31 January 2014 are presented in the following table:
EUR k
Cash flows 2014/15
Cash flows 2015/16
Cash flows 2016/17 –
2018/19
Cash flows 2019/20 –
2023/24
Cash flows > 2024/25
Liabilities to banks 223,026 7,276 9,647
Bonds 529,428 9,375 28,125 309,375
Loans 122,324 62
Trade payables 2,813,606
Liabilities to associates and related parties/supplementary contribution 67,890 7,426 22,278 131,055
Liabilities and provisions for customer rebates and bonuses 28,561
ABS and factoring liabilities 253,633
Other financial liabilities 35,875 343 5,243
Finance lease liabilities 25,584 1,471 4,334 3,346
Financial guarantee contracts 97,664
Derivative financial liabilities without hedge accounting
Cash outflow 274,149
Cash inflow − 271,030
Total 3,119
Liabilities with early termination rights have been classified according to the first call date. For floating rate interest payments, the current floating interest rate is taken as a basis. Payments in foreign currency are translated using the exchange rate at year end.
Notes to the cash flow statement
Cash and cash equivalents amounted to EUR 567,449k at the end of the reporting period (prior year: EUR 494,458k) and comprised cash of EUR 567,437k (prior year: EUR 494,458k) as well as cash equivalents of EUR 12k (prior year: EUR 0k). Restricted cash at the end of the period amounts to EUR 7,244k (prior year: EUR 13,038k) and corresponds to security deposits for revolving credit lines (e.g. ABS and factoring). There are also restrictions on cash and cash equivalents of EUR 15,342k (prior year: EUR 10,643k) of foreign subsidiaries at the end of the period, since local covenants or other agreements do not allow the subgroups to transfer those amounts directly or indirectly via other subsidiaries to the parent company.
116
PHOENIX group
Consolidated finanCial statements i notes to the consolidated financial statements

Payments made for acquisitions of consolidated entities and business units correspond to the purchase price of EUR 23,582k (prior year: EUR 22,829k) less any cash and cash equivalents acquired of EUR 4,214k (prior year: EUR 1,456k). Payments received from the sale of consolidated entities and business units correspond to the sale proceeds received of EUR 899k (prior year: EUR 7,153k) less cash and cash equivalents disposed of EUR 1k (prior year: EUR 241k).
Related party disclosures
GeneralIn accordance with IAS 24, entities or persons, which are in control of or controlled by the PHOENIX group must be disclosed. Members of the Merckle family and entities controlled by them are considered as related parties. In addition, the disclosure requirements of IAS 24 comprise persons and entities over which PHOENIX has significant influence or joint control.
Transaction volumeThe goods and services sold as well as other income from transactions with related parties and goods and services received as well as other expenses from such transactions break down as follows:
Goods and services sold as well as other income
in the fiscal year
Goods and services received as well as other expenses
in the fiscal year
EUR k 2013/14 2014/15 2013/14 2014/15
Partners 23 31 22,970 17,040
from financing 0 0 7,426 3,982
from leases, other services 23 31 15,544 13,058
Associates 30,039 31,255 7,404 8,513
from financing 321 269 0 0
from leases, other services 117 131 5,915 7,054
from goods sold 29,601 30,855 1,489 1,459
Other related parties 2 10 1,417 1,064
from financing 0 0 402 0
from leases, other services 2 10 1,015 1,064
from goods sold 0 0 0 0
The goods and services sold mainly consist of goods supplied and other services.
The goods and services received relate primarily to goods, leases and financing transactions.
117Notes to the consolidated financial statements i CoNsolidated fiNaNCial statemeNts

Outstanding balances
Receivables as of 31 Jan. Liabilities as of 31 Jan.
EUR k 2014 2015 2014 2015
Partners 24 335 183,298 63,768
from financing 0 0 168,790 49,007
from leases, other services 24 335 14,508 14,761
Associates 9,159 8,073 128 1,301
from financing 6,962 5,349 0 0
from leases, other services 0 17 75 1,115
from goods sold 2,197 2,707 53 186
Other related parties 96 106 700 0
from financing 0 0 443 0
from leases, other services 96 106 257 0
from goods sold 0 0 0 0
Impairment losses − 965 − 1,032 0 0
For the most part, the outstanding balances are not secured nor have guarantees been issued on them. The receivables were settled by payment or by netting them against accounts payable. In connection with the bond issued in July 2014, related parties hold bond certificates with a nominal value of EUR 112,400k. In connection with the bond issued in 2013, related parties hold bond certificates with a nominal value of EUR 30,200k. To the extent that these are still held, interest was paid at the prevailing terms and conditions. In fiscal year 2014/15, the PHOENIX group acquired interests in an entity from related parties for EUR 231k.
Terms and conditionsUnless terms and conditions of related party transactions have been commented on specifically above, they were made on an arm’s length basis. Outstanding balances at year end are unsecured and settled by payment.
Remuneration of the members of the management board
The total remuneration of the management board in the reporting period was EUR 5,876k (prior year: EUR 7,507k) and is classified as short-term employee benefits.
The current service cost for benefits earned by management in the reporting period was EUR 245k (prior year: EUR 238k).
Former members of management received remuneration (including severance payments and non-competition payments) of EUR 1,181k in the reporting year (prior year: EUR 1,558k). Pension provisions of EUR 27,683k (prior year: EUR 16,518k) were recognised.
118
PHOENIX group
Consolidated finanCial statements i notes to the consolidated financial statements

Remuneration of the advisory board
The advisory board remuneration amounted to EUR 350k in the fiscal year (prior year: EUR 350k).
Mannheim, 2 April 2015
Management of the unlimited partnerPHOENIX Verwaltungs GmbH
Oliver Windholz Helmut Fischer Frank Große-Natrop Stefan Herfeld
119Notes to the consolidated financial statements i CoNsolidated fiNaNCial statemeNts

Audit opinion
We have audited the consolidated financial statements prepared by PHOENIX Pharmahandel GmbH & Co KG, Mann-heim, comprising the income statement, the statement of comprehensive income, the statement of financial position, the statement of cash flows, the statement of changes in equity and the notes to the financial statements, together with the group management report for the fiscal year from 1 February 2014 to 31 January 2015. The preparation of the consolidated financial statements and the group management report in accordance with IFRSs as adopted by the EU and the additional requirements of German commercial law pursuant to Sec. 315a (1) HGB [“Handelsgesetzbuch”: German Commercial Code] is the responsibility of the Company’s management. Our responsibility is to express an opinion on the consolidated financial statements and on the group management report based on our audit.
We conducted our audit of the consolidated financial statements in accordance with Sec. 317 HGB and German generally accepted standards for the audit of financial statements promulgated by the Institut der Wirtschaftsprüfer [Institute of Public Auditors in Germany] (IDW). Those standards require that we plan and perform the audit such that misstatements materially affecting the presentation of the net assets, financial position and results of operations in the consolidated financial statements in accordance with the applicable financial reporting framework and in the group management report are detected with reasonable assurance. Knowledge of the business activities and the economic and legal environment of the Group and expectations as to possible misstatements are taken into account in the determination of audit procedures. The effectiveness of the accounting-related internal control system and the evidence supporting the disclosures in the consolidated financial statements and the group management report are examined primarily on a test basis within the framework of the audit. The audit includes assessing the annual financial statements of those entities included in consolidation, the determination of entities to be included in consolidation, the accounting and consolidation principles used and significant estimates made by management, as well as evaluating the overall presentation of the consolidated financial statements and management report. We believe that our audit provides a reasonable basis for our opinion. Our audit has not led to any reservations.
In our opinion, based on the findings of our audit, the consolidated financial statements comply with IFRSs as adopted by the EU as well as the additional requirements of German commercial law pursuant to Sec. 315a (1) HGB and give a true and fair view of the net assets, financial position and results of operations of the Group in accordance with these requirements. The group management report is consistent with the consolidated financial statements and as a whole provides a suitable view of the Group’s position and suitably presents the opportunities and risks of future development.
Stuttgart, 2 April 2015
Ernst & Young GmbHWirtschaftsprüfungsgesellschaft
Prof. Dr. Wollmert SomesWirtschaftsprüfer Wirtschaftsprüferin [German Public Auditor] [German Public Auditor]
120
PHOENIX group
CONSOLIDATED FINANCIAL STATEMENTS I Audit opinion
Further information 2014/15
Foreign shareholdings and domestic subsidiaries 122
Financial calendar 2015 124
Imprint

Foreign shareholdings and domestic subsidiaries
AustriaPHOENIX Arzneiwaren-großhandlung GmbHAlbert-Schweitzer-Gasse 3A-1140 Wienwww.PHOENIX-gh.at
Bosnia and HerzegovinaPHOENIX Pharma d.o.o.Stefana Dečanskog bbBA-76300 Bijeljinawww.PHOENIX.ba
BulgariaPHOENIX Pharma EOOD199 A Okolovrasten patBG-1700 Sofia Vwww.phoenixpharma.bg
CroatiaPHOENIX Farmacija d.d.Ozaljska ulica 95HR-10000 Zagrebwww.PHOENIX-farmacija.hr
Czech RepublicPHOENIX Lékárenskývelkoobchod a.s.Pérovně 945/7CZ-10200 Praha Hostivarwww.PHOENIX.cz
DenmarkNomeco A/SBorgmester ChristiansensGade 40DK-1790 Copenhagen Vwww.nomeco.dk
EstoniaTamro BalticsPärnu mnt. 501 LaagriEST-76401 Harjumaawww.tamro.ee
FinlandTamro OyjRajatorpantie 41 BFI-01640 Vantaawww.tamro.fi
FrancePHOENIX Pharma S.A.S.ZA des Bouvets1. rue des BouvetsF-94015 Créteil Cedexwww.PHOENIXpharma.fr
GermanyPHOENIX PharmahandelGmbH & Co KGPfingstweidstrasse 10-12D-68199 Mannheimwww.PHOENIXgroup.eu
HungaryPHOENIX Pharma Zrt.Keleti M. ut 19H-2151 Fótwww.mypin.hu
ItalyComifar GroupVia Fratelli Di Dio N 2I-20026 Novate Milanesewww.comifar.it
KosovoEvropa Lek Pharma L.L.C.Cagllavice PN10500 Gracanice, Pristinawww.elpharma.com
LatviaTamro BalticsKleistu iela 24LV-1067 Rigawww.tamro.lv
LithuaniaTamro Baltics9-ojo Forto g. 70LT-3040 Kaunaswww.tamro.lt
MacedoniaPHOENIX Pharma DOOELKacanicki pat bb. VizbegovoMK-1000 Skopjewww.PHOENIXpharma.com.mk
Montenegro Evropa Lek Pharma d.o.o. Kritskog Odreda 4/1 81000 Podgoricawww.elpharma.com
NetherlandsBrocacef Groep NVStraatweg 2NL-3600 AA Maarssenwww.brocacef.nl
122
PHOENIX group
FURTHER INFORMATION I Foreign shareholdings and domestic subsidiaries

NorwayApotek 1Skårersletta 55N-1473 Lørenskogwww.apotek1.no
PolandPHOENIX Pharma Polska Sp. z o.o.Oddział Warszawaul. Oplotek 26PL-01940 Warszawawww.pharma.com.pl
SerbiaPHOENIX Pharma d.o.o.Bore Stankovica 2. P. Box 21SRB-11 250 Beograd 92www.PHOENIXpharma.rs
SlovakiaPHOENIX Zdravotníckezásobovanie a.s.Pribylinská 2/ASK-831 04 Bratislavawww.PHOENIX.sk
SwedenTamro ABImportgatan 18S-401 20 Gothenburgwww.tamro.se
SwitzerlandAmedis-UE AGMönchmattweg 5CH-5035 Unterentfeldenwww.amedis.ch
Pharmacies BENU S.A.Rue du Centre 6Case postale 108CH1752 Villars-sur-Glâne 1wwww.benupharmacie.ch
United KingdomPHOENIX Medical Supplies Ltd.Rivington RoadWhitehouse Industrial EstateGB-Runcorn, Cheshire WA7 3DJwww.myp-i-n.co.uk
Domestic subsidiaries
ADG Apotheken Dienstleistungs gesellschaft mbHPfingstweidstrasse 568199 MannheimGermanywww.adg.de
Health Logistics GmbHVichystrasse 1476646 BruchsalGermanywww.health-logistics.de
PHOENIX Pharma-Einkauf GmbHPfingstweidstrasse 10-1268199 MannheimGermany
transmed Transport GmbHDr.-Gessler-Strasse 3793051 RegensburgGermanywww.transmed.de
123Foreign shareholdings and domestic subsidiaries I FURTHER INFORMATION
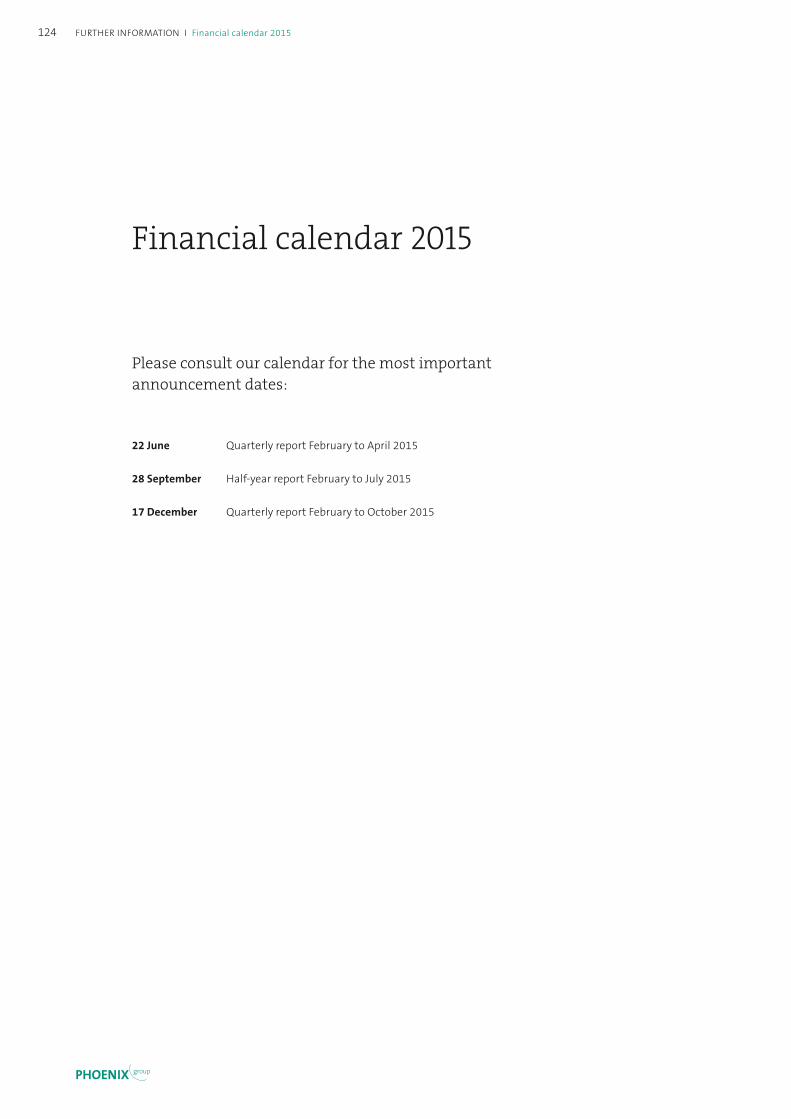
Financial calendar 2015
Please consult our calendar for the most important announcement dates:
22 June Quarterly report February to April 2015
28 September Half-year report February to July 2015
17 December Quarterly report February to October 2015
124 FURTHER INFORMATION I Financial calendar 2015
PHOENIX group
Financial calendar 2015
Imprint
PublisherThomas EhmannChief Representative Jacob-Nicolas SprengelSenior Manager Corporate Communications PHOENIX group
PHOENIX Pharmahandel GmbH & Co KGGroup CommunicationsPfingstweidstrasse 10 -1268199 MannheimGermanyPhone +49 (0)621 8505 8502Fax +49 (0)621 8505 [email protected]
Investor RelationsKarsten LogesHead of Corporate Finance/Group Treasury/HoldingsPhone +49 (0)621 8505 741 [email protected]
Concept and realisationGroup Communications PHOENIX groupHGB Hamburger Geschäftsberichte GmbH & Co. KG, Hamburg, GermanyHERING SCHUPPENER Healthcare, Hamburg, Germany
PhotographsADG mbH (p. 10)Brocacef Groep NV (p. 11)HeidelbergCement AG (p. 6)P. Keppler Verlag GmbH & Co. KG (p. 11)Hans-Georg Merkel (p. 2, 4, 5, 9, 11, 16, 17, 20, 21, 23, 24, 25, 27, 28, 29)PHOENIX Farmacija (p. 31)PHOENIX group (p. 10)
PrintingCHARTERHOUSE Print Management Ltd., CologneGermany
© PHOENIX Pharmahandel GmbH & Co KG, Mannheim, Germany Printed in Germany. All rights reserved.
Translation of the German version. The German version is binding.
Platzhalter FSC Logo
Imprint

PHOENIX Pharmahandel GmbH & Co KGPfi ngstweidstraße 10-1268199 MannheimGermanywww.PHOENIXgroup.eu
Ann
ual R
epor
t 201
4/15
PHOENIX group
Ann
ual R
epor
t 201
4/15
PHOEN
IXgrou
p