achievements - stellenbosch university pharmacology... · division clinical pharmacology faculty of...
TRANSCRIPT

TYGERBERG POISON INFORMATION CENTRE
ANNUAL REPORT
2014
24 hour Telephone Number: +27 861 555 777 Tygerberg Poison Information Centre (TPIC) Division Clinical Pharmacology Faculty of Medicine and Health Sciences Stellenbosch University Tygerberg Hospital Tygerberg, Cape Town, 7505 South Africa

Personnel:
Director:
Ms Carine Marks
Staff:
Ms Cherylynn Wium Ms Arina du Plessis
Part time consultants Dr GJ Muller Dr J Lamprecht Dr E Decloedt Dr DJH Veale Dr M Makiwane Dr A Abulfathi Dr N Van Hoving
www.sun.ac.za/poisoncentre [email protected]

Contents Background ............................................................................................................................................. 1 Objective .................................................................................................................................................. 1 The functions of the TPIC ........................................................................................................................ 1 Summary ................................................................................................................................................. 3 TPIC Communications ............................................................................................................................. 4 Service Statistics ..................................................................................................................................... 4
Time of Communication ................................................................................................................... 5 Geographical Distribution ................................................................................................................. 6 Interlocutors ...................................................................................................................................... 6 Interlocutor Location ......................................................................................................................... 7 Victims .............................................................................................................................................. 7 Age Distribution ................................................................................................................................ 8 Gender Distribution .......................................................................................................................... 8 Type of Exposure ............................................................................................................................. 9 Risk Assessment of poisoning ....................................................................................................... 10
Consultation Substance Categories ...................................................................................................... 11 Pharmaceuticals ................................................................................................................................ 12 Non drug chemicals ........................................................................................................................... 16 Biologicals .......................................................................................................................................... 19
Snake bite ...................................................................................................................................... 20 Spider bite ...................................................................................................................................... 21 Scorpion sting ................................................................................................................................. 22 Marine envenomation ..................................................................................................................... 23 Plant Exposures ............................................................................................................................. 24
General Activities ................................................................................................................................... 26 Teaching and Training ....................................................................................................................... 26 Workshops ......................................................................................................................................... 26 Community outreach .......................................................................................................................... 26 Congresses ........................................................................................................................................ 27 Academic Year Day ........................................................................................................................... 27 Collaboration and Visits ..................................................................................................................... 27 Other Projects .................................................................................................................................... 28
Quarterly reports ............................................................................................................................ 28 Tygerberg Hospital ......................................................................................................................... 28

Page 1 of 29
Background The Poison Information Service was started in 1970 and eventually evolved into the Tygerberg Poison Information Centre (TPIC). The Centre is situated in the Division of Clinical Pharmacology, Faculty of Medicine and Health Sciences on the Tygerberg Campus of Stellenbosch University in close proximity to Tygerberg Hospital. The Centre provides a 24 hour 7 day a week consultant based service to medical professionals as well as the general public. Telephone enquiries are answered by toxicologists with a scientific or medical background. All communications are recorded on a consultation sheet from where it is entered into the IPCS INTOX data management system obtained from the World Health Organization (WHO). Two information data bases are used, namely: (i) Micromedex and (ii) AfriTox (which is maintained by Red Cross War Memorial Children’s Hospital Poisons Information Service, Cape Town).
Objective The main objective of the TPIC is to improve the outcome of poisoned patients by providing information on the diagnosis and treatment of poisoning to health care professionals and advising the general public on management of exposures and thus reducing unnecessary use of medical facilities.
The functions of the TPIC See Figure 1
Providing a comprehensive, consultant-based service, 24 hours a day, 7 days a week, serving both the health care professionals and the general public.
Providing a system of toxicovigilance which serves to identify new hazards and the epidemiology of new forms of poisoning, national trends in poisoning and the associated vulnerable populations and risk factors.
Dealing with issues relating to occupational and environmental toxicology and providing valuable forensic / medico-legal support.
The training of medical doctors, pharmacists, pharmacist interns, paramedics and nurses on management of exposures to poisonous substances.
Teaching toxicology to undergraduate and postgraduate medical students at the University of Stellenbosch, and supervising postgraduate research projects in toxicology.
Community interaction which includes public education and information programmes on the prevention and immediate management of acute poisoning. The TPIC personnel regularly contributes to radio and television programmes, newspapers and magazines as well as participating in poisoning presentations to the general public.
Routine ward rounds in Tygerberg Hospital’s emergency wards. This enables us to compare the acute poisoning cases of Tygerberg Hospital admissions to the TPIC consultations. This information is used for research, toxicovigilance, poisoning prevention strategies, health service planning and to monitor toxicology regulatory compliance.
Providing statistics (data analysis) on pesticide poisoning to various institutions e.g. Department of Agriculture, Forestry and Fishery and AVCASA for
Non

Page 2 of 29
utilization in determining the necessity of restricting / deregistering toxic pesticide formulations.
Other important functions:
Presentation of research undertaken in the centre at national and international conferences.
Publishing research findings in peer-reviewed journals.
Research projects include o epidemiology of poisoning o biological toxin research on snake, spider and scorpion venoms and
envenoming.
Figure 1: Functions of the TPIC

Page 3 of 29
Summary During 2014 6228 communications were received of which 5580 were cases of suspected / actual exposures to potentially poisonous substances. The other 648 (8.5%) were general enquiries on various subjects including possible toxicity of substances, how to discard such substances, prevention and treatment of poisonings and pharmacotherapy. In a number of cases more than one substance was concurrently ingested. 6404 substances were involved in potential exposures. Calls were received from all 9 provinces in South Africa as well as from other countries particularly the neighboring countries such as Namibia, Botswana and Mozambique. Most calls were received from health care professionals (67%, 4173) at a medical facility. 64% (3986) of the calls were received after hours. 48.4% (2639) of exposures occurred in males, 48.5% (2643) in females and 3% (166) were of unknown gender. Children (≤ 14 years) were involved in 47.7% (2601), adolescents (15 – 19 years) in 6.5% (353) and adults (>19 years) in 45.8% (2494) of exposures. Most of the exposures in children were accidental (93.6%, 2435), whereas in adolescents most exposures were due to intentional exposures (84.4%, 298). In adults 58.0% (1447) of the exposures were intentional, 40.9% (1019) were accidental and 1.1% (28) medication errors. Exposures were divided into three categories:
Pharmaceutical overdose/exposure 2662 (37.8%)
Non-drug chemicals (NDC) exposures 3042 (43.1%) o 32% of NDC were due to pesticides
Biological exposures 700 (9.9%)
Non-patient related and Pharmacotherapy: 648 (9.2%)
General activities include teaching, workshops, community outreach, research, conference presentations and publications.

Page 4 of 29
TPIC Communications Figure 2 indicates the number of communications received during the past 13 years. The increase in call volume from 2007 was due to the closure of other Poison Information Centres in the country. The TPIC presently receives calls from the whole of South Africa.
Figure 2: Number of TPIC communications per year.
Service Statistics In 2014 the TPIC received 6228 calls. Of these, 5580 were related to actual exposures to poisonous substances and 648 were requests for general information on poisonous substances and pharmacotherapy. Figure 3 shows the number of communications received per month during 2014.
Figure 3: Communications received per month

Page 5 of 29
Time of Communication: 36% (2242) of the communications were received within office hours and 64% (3986) after hours, figure 4. After hour calls include weekends and public holidays.
Figure 4: Time of communication
Most of the communications dealt with by the Centre were received between 09:00 in the morning and 23:00 in the evening, figure 5. The least number of calls were received between 04:00 and 07:00 in the morning.
Figure 5: Communications per hour of the day

Page 6 of 29
Geographical Distribution: Calls were received from all 9 provinces in South Africa as well as from other countries, particularly the neighboring countries such as Namibia, Botswana and Mozambique, figure 6. Most of the calls originated from the Western Cape (35.5%, 2210) where the TPIC is situated. KwaZulu Natal (24.5%, 1525) and Gauteng (21.2%, 1320) were regular users of the Centre. Although the population (figure 7) of the Western Cape, the Eastern Cape and the Limpopo Provinces are similar very few calls were received from the Eastern Cape and the Limpopo Provinces. The reason could be a lack of knowledge as to the existence of the poison centre.
0.0%
5.0%
10.0%
15.0%
20.0%
25.0%
11.3%
19.9%
24.0%
7.8%
12.6%
2.2%
6.7%
10.4%
5.1%
Figure 6: Geographical distribution of calls. Figure 7: SA Population per Province
Interlocutors: 67% (4173) of calls were received from health care professionals including doctors, nurses, pharmacists, veterinarians and paramedics. The other 33% (2055) were from the general public divided into: Family (27%, 1681), Victim (4%, 249) and other (2%, 125), figure 8. The “Other” group includes educational personnel as well as people in other workplaces.
Figure 8: Interlocutors
Statistics South Africa 2014

Page 7 of 29
Interlocutor Location: 67% (4173) of calls originated from medical facilities (state hospitals, private hospitals, clinics, general practitioners, pharmacies), Table 1. The other calls came from private homes (30%, 1868) and educational institutions / the workplace (3%, 187), figure 9. Most of these exposures occurred in the household setting.
Figure 9: Location of Interlocutors
Table 1: Calls from Medical Facilities
State Hospitals / Clinics 69% 2880
Private Hospitals (Mediclinic, Netcare, Life, etc.) 25% 1043
General Practice 2% 84
Other 4% 166
Victims: Humans were implicated in most of the exposures the centre dealt with. Animal exposures accounted for only 2% (125) of the communications, figure 10. 98% (5455) were human exposures which included 7 incidents. Incidents are cases where more than 3 people were affected e.g. fumigation of a building.
Figure 10: Victims exposed to poisonous substances

Page 8 of 29
Age Distribution: o Children: 0 – 14 years: (i) < 5 years (ii) 5 – 14 years o Adolescents: 15 – 19 years o Adults: ≥ 20 years
Figure 11a: The number of exposures in children (47.7%, 2601) were similar to the exposures in adults (45.8%, 2494) whereas adolescent exposures were generally small (6.5%, 353).
Figure 11b: 39.1% (2133) of exposures occurred in the < 5 year age group.
0.0%
10.0%
20.0%
30.0%
40.0%
50.0%
0 - 5yrs
6 - 14yrs
15 - 19yrs
> 20yrs
39.1%
8.6% 6.5%
45.8%
2014: Age Distribution
Figure 11a: Age distribution Figure 11b: Age distribution
Gender Distribution:
Figure 12a indicates that the number of exposures in males (48.4%, 2639) and females (48.5%, 2643) were almost the same with 3.1% (166) being of unknown gender.
Figure 12b and Table 2: More male children (55.0%, 1430) were exposed than female children (40.6%, 1056) whereas in the adolescent and adult groups more females were implicated in exposures than males.
Figure 12a: Gender Distribution Figure 12b: Gender distribution per age group
Table 2: Gender per Age Group
Male Female Unknown
Children 1430 1056 115
Adolescents 87 265 1
Adults 1122 1322 50

Page 9 of 29
Type of Exposure: The type of exposure is divided into (i) intentional (ii) accidental (iii) medication errors. Most of the cases dealt with were due to accidental exposures (65.8%, 3589). In 32.6% (1766) of cases the exposures were intentional and in 1.6% (93) medication errors occurred. Figure 13.
Figure 13: Type of Exposures: intentional, accidental, medication error.
98.1% (2091) of exposures in the < 5 year age group were accidental, the other 1.9% (42) were due to medication errors.
In the 5 – 14 year age group 73.5% (344) of exposures were accidental, 21.6% (101) intentional and 4.9% (23) medication errors.
In the adolescent group (15 – 19 years) most exposures (84.4%, 298) were intentional, only 15.6% (55) were accidental. No medication errors were recorded in this age group.
In the adult group (≥ 20 years) 58.0% (1447) of exposures were intentional and 40.9% (1019) were accidental with 1.1% (28) due to medication errors. Figure14.
Figure 14: Type of Exposures encountered in each age group.

Page 10 of 29
Accidental exposures occurred more often in the male group (35.1%, 1914) whereas intention exposures were more prominent in the female group (20.1%, 1086). Figure 15 and Table 3.
Figure 15: Type of exposures in the gender groups
Table 3: Type of Exposure per Gender group
Intentional Accidental Medication error
Male 680 1914 45
Female 1086 1509 48
Unknown 0 166 0
Risk Assessment of poisoning Cases were divided into risk categories according to the symptoms and signs reported to the TPIC at the time of the call. No risk 0, minimal risk 1, moderate risk 2, high risk 3, death 4. It can be seen from figure 16 that in most of the exposure case the TPIC dealt with there was either no risk of poisoning or only a minimum risk.
Figure 16: Risk Assessment

Page 11 of 29
Consultation Substance Categories The TPIC dealt with 6228 communications which included 648 general non-patient related enquiries and 5580 patient related enquiries. The patient related enquiries included 6404 potentially poisonous substances/agents. Potentially poisonous substances/agents (figure 17) are divided into
pharmaceutical overdose/exposure (37.8%, 2662),
non-drug chemical exposures (NDC) (43.1%, 3042)
biological exposures (9.9%, 700).
Non-patient related consultations (9.2%, 648) include general advice with regards to prevention and treatment of poisonings and pharmacotherapy.
Figure 17: Exposure Categories
Pharmaceuticals include all the pharmaceuticals use in the treatment of humans and animals (veterinary products) as well as the drugs of abuse.
Non-drug chemicals (NDC) include o household products (e.g. soaps, cleaners, bleaches, paraffin, etc.) o cosmetics (e.g. moisturizers) o food and beverages (e.g. food additives, alcohol) o agricultural (pesticides and non-pesticides) o industrial products (e.g. heavy metals and solvents).
Biologicals include bites and stings of snakes, spiders, scorpions, bees and wasps as well as other insects, plant and mushroom exposures and marine envenomation.

Page 12 of 29
Pharmaceuticals: Pharmaceuticals are divided into categories as seen in figure 18 and Table 4.
Figure 18: Pharmaceuticals most often encountered during exposure calls
Pharmaceuticals encountered most often were the psychiatric medications (19.7%,
536) which include the psycholeptics and physchoanaleptics followed by the
analgesics (18.3%, 497) and the anti-infectives (antibiotics) (10.9%, 298). Table 4.

Page 13 of 29
Table: 4: Pharmaceuticals responsible for exposure divided into categories and subgroups.
Major/subgroup classification
Number
%
Most common products or substances
1. Psychiatric 536 19.7%
Psycholeptics 289 Neuroleptics (126) Haloperidol = 30 Anxiolytics (101) Alprazolam = 22 Hypnotics & Sedatives (62) Zolpidem = 40
Psychoanaleptics 212 Antidepressants (186) Amitriptyline = 73 Psychostimulants (26) Methylphenidate = 26
Other 35
2. Analgesics 497 18.3% Paracetamol (250 cases) NSAIDs (103 cases): Ibuprofen = 64 Opioids (95 cases): Codeine phosphate = 52 Salicylates (49 cases): Aspirin = 42
3. Anti-infectives (antibiotics) Antivirals Antimycobacterials Antibacterials Antiparasetic Antifungal Unknown antibiotics
298 10.9% 141 Efavirenz = 43 52 Isoniazid = 38 51 Amoxycilline = 18 18 Chloroquin = 6 5 Fluconazole = 2 31
4. Cardiovascular 172 6.3% Captopril (29 cases)
5. Dermal 158 5.8% Calamine lotion (34 cases)
6. Cough and Cold 131 4.8%
7. Anti-epileptics 128 4.7% Carbamazepine (60 cases)
8. Antihistamines 127 4.6%
9. Vitamins 101 3.7%
10. Traditional/Herbal 95 3.5%
11. Alimentary Tract 70 2.6%
12.Contraceptives 60 2.2%
13. Drugs of Abuse 53 2.0% Methamphetamine (11 cases)
14. Respiratory 50 1.8% Theophylline (29 cases)
15. Other 195 7.2% Iron tablets (66 cases)
16. Unknown 52 1.0%
Page 14 of 29
Of the psychiatric medications amitriptyline (60 cases), zolpidem (40 cases),
citalopram (34 cases), orphenadrine (31 cases), fluoxetine (30 cases) and
haloperidol (30 cases) were most often implicated in exposures. See Table 5.
Table 5: Individual psychiatric drugs most often encountered in exposure cases
Antidepressants & Psychostimulants Anxiolytics Parkinsons drugs
Amitriptyline 60 Alprazolam 22 Orphenadrine 31
Citalopram 34 Clonazepam 22
Fluoxitine 30 Lorprazolam 18
Methylphenidate 26 Diazepam 10
Neuroleptics Hypnotics & Sedatives
Haloperidol 30 Zolpidem 40
Chlorpromazine 23 Zopiclon 22
Quetiapine 23
Risperidone 19
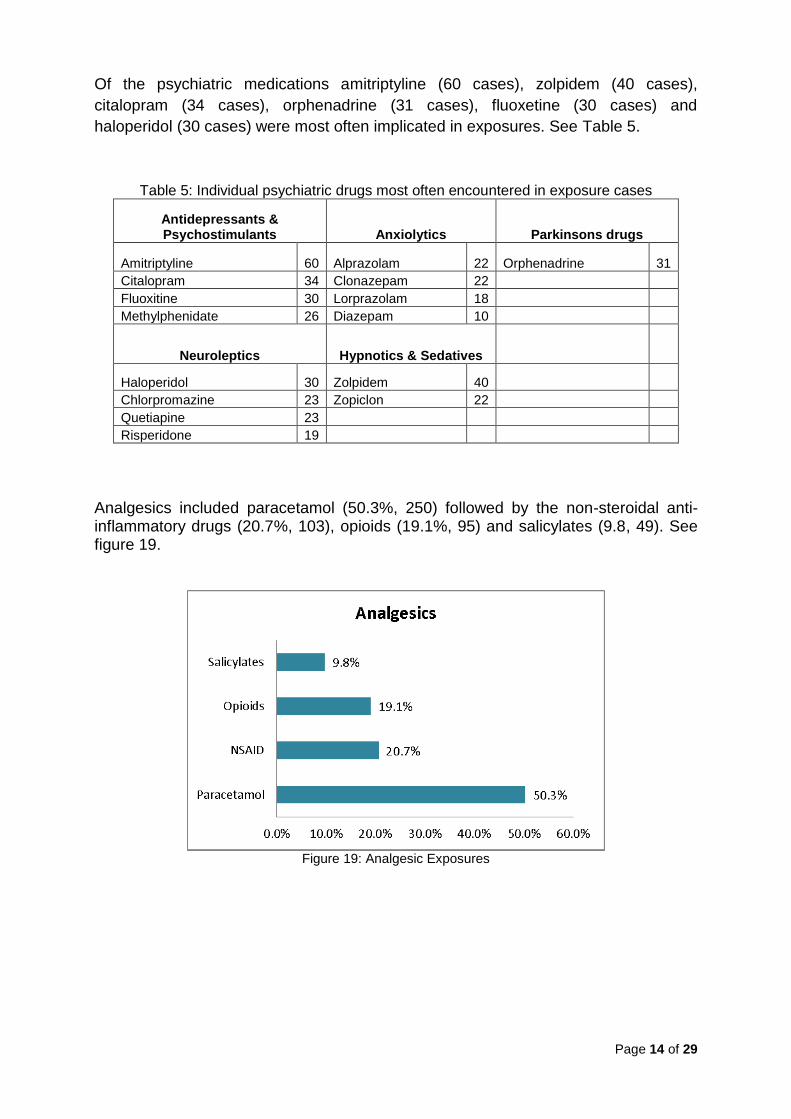
Analgesics included paracetamol (50.3%, 250) followed by the non-steroidal anti-inflammatory drugs (20.7%, 103), opioids (19.1%, 95) and salicylates (9.8, 49). See figure 19.
Figure 19: Analgesic Exposures

Page 15 of 29
The anti-infectives are divided into Antivirals (47.3%, 141), Antimycobacterials (17.4%, 52), Antibacterials (17.1%, 51), Antiparasetic (6.0%, 18), Antifungal (1.6%, 5) and an unknown group (10.4%, 31). Figure 20.
Figure 20: Antimicrobial drugs encountered in overdose
The individual pharmaceutical (medicine) responsible for most of the exposures were paracetamol containing tablets, iron tablets, amitriptyline tablets, carbamazepine tablets and ibuprofen containing tablets, figure 21.
Figure 21: Drugs most often involved in acute poisoning exposures

Page 16 of 29
Non drug chemicals
The NDCs include household products, 51.9% (1528), pesticides, 32.0% (970), cosmetic, 6.9% (202), food and beverages, 4.5% (133) as well as industrial products, 3.7% (110). Figure 22.
Figure 22: Non-drug chemical categories responsible for acute poisoning exposures
Household products (1528): Exposures often occurred in children < 5 years of age. Household products are divided into irritants, corrosives, volatile hydrocarbons, alcohols, antiseptics, essential oils, gas/fumes, a non-toxic and a miscellaneous group. See figure 23.
Figure 23: Household product categories
o Irritants (30.8%, 750) include most of the products used in and around the
house e.g. dishwashing/laundry liquids, bleach, general cleaning products, polishes, etc.

Page 17 of 29
o Volatile hydrocarbons (18.4%, 281) include paraffin, thinners, turpentine and petrol.
o Corrosives (13.3%, 203) include drain cleaners (caustic soda), oven cleaners, kettle descalers, etc.
o Alcohols (13.3%, 203) include brake fluid (ethylene glycol), methylated spirits, surgical spirits, etc.
o Antiseptics (4.1%, 63) include substances such as Dettol®, Milton®, Savlon® and chlorhexidine containing products.
o Essential oils (3.4%, 53) include camphor oil, eucalyptus oil, lavender oil, tea tree oil, etc.
o Gas (0.9%, 13) includes mostly carbon monoxide. o Non-toxic group (11.9%, 182) includes all the substances that are not
known to cause toxicity e.g. silica gel, ink, glue, etc. o Miscellaneous group (3.9%, 60) includes all substances that do not fit into
the above categories.
In the household setting bleach (Jik®) (102 cases) was the product encountered most often followed by non-toxic silica gel granules (88 cases) found in shoeboxes and medicine containers.
Pesticides (970): Pesticides are widely used in the agricultural sector as well as the household setting. However, most of the calls the poison centre dealt with were due to exposures in the household setting. Only 8% (77) of pesticide exposures were from the agricultural sector. Pesticides are divided into the following groups: Insecticides (61.7%, 598), Rodenticides (17.2%, 167), Herbicides & Fungicides (7.7%, 75) and Unknown Pesticides (13.4%, 130). Figure 24.
Figure 24: Pesticide Categories.
Table 6 shows that the pyrethroid containing insecticides (24.6%, 239) were encountered most often followed by the anticoagulant rodenticide (15.9%, 154), carbamates (13.5%, 131), organophosphates (8.2%, 80), amitraz (3.9%, 38), naphthalene (moth ball) (2.4%, 23) and glyphosate (2.4%, 23).

Page 18 of 29
o The product encountered most often was the anticoagulant Rattex® (15.5%, 150), usually ingested accidentally by children.
o The product which caused the most severe effects and often death was the herbicide Gramoxone® containing paraquat (1.0%, 10 cases).
o Aldicarb, a carbamate insecticide, is often sold illegally as a rodenticide. In 39 (29.8%) of the carbamate exposure cases it was reported to the poison centre as a “rat poison”.
Table 6: Pesticides implicated in exposures
Insecticides Herbicides & Fungicides
Organophosphate 80 Acetochlore 1
Carbamate 131 Herbicides unknown 25
Pyrethroids 239 MPCA 9
Chlorinated Hydrocarbons 4 Pyridine Herbicide 4
Metaldehyde (snail bait) 3 Glyphosate 23
Amitraz 38 Paraquat 10
Naphthalene (Moth balls) 23 Fungicides 3
DEET 18 75
Sodium cacodylate (An Trap) 15 Rodenticides
Other insecticides 47 Anticoagulants 154
598 Fumigants (Al phosphide) 13
Unknown Pesticides 130 167
Cosmetics (202): They are mostly non-toxic e.g. moisturizing creams or irritants e.g. soap. The only corrosive substance in this category was the hair relaxers (17.3%. 35 cases). Table 7 summarizes the cosmetics dealt with.
Table 7: Cosmetics
Hair relaxers 35
Moisturizing cream 27
Nail Polish Remover 20
Soap 13
Shampoo 12
Deodorant 11
Perfumes 9
Mouth wash 9
Body powder 9
Food and Beverages (133): 71.4% (95) were intentional ingestions of alcohol, usually co-ingested with other substances.
Industrial products (110): 15.4% (17) were due to heavy metal exposures. In six cases broken thermometers were implicated.

Page 19 of 29
Biologicals
Biologicals include all animal, marine, plant and mushroom exposures. This group is divided into the following:
o snake bite o spider bite o scorpion sting o marine envenomation o plant o mushroom exposures o bees and wasps o miscellaneous group
The miscellaneous group (8.9%, 62) includes all other bites and stings e.g. dog and insect bites. Snake bites (26.8%, 187) were responsible for most of the biological consultations followed by spider bites (24.3%, 169), plant exposures (17.6%, 123), scorpion sting (14.5%, 101), mushroom exposures (5.9%, 41), marine envenomations (1.4%, 10) and bee and wasp stings (0.6%, 4). Figure 25.
Figure 25: Biological exposures

Page 20 of 29
Figure 26 demonstrates that during the 1st and 4th quarters of the year, which are the warmer summer months, more snake bites and scorpion stings occurred than during the colder winter months (2nd and 3rd quarters). During 2014 spider bite enquiries did not follow the same pattern as the snake and scorpion enquiries but occurred all year round with least recorded during the 4th quarter.
0%
10%
20%
30%
40%
Snakes Scorpions Spider
29%
19% 21%26%
10%
24%
14%
7%
30%31%26%
14%
2014:Snake, Scorpion & Spider Consultations
1st Qtr
2nd Qtr
3rd Qtr
4th Qtr
Figure 26 Quarterly comparisons of snake, scorpion and spider consultations
Snake bite
26.8% (187) of the biological exposures were due to snake bite. Snakes are divided into three main groups: neurotoxic snakes, cytotoxic snakes and haemotoxic snakes. All the other snakes are grouped together as “Other”. In 60.4% (113) of reported snake bite cases the snakes were not identified. Of those identified 22.0% (41) were due to cytotoxic snake bites e.g. the puff adder, 14.4% (27) were neurotoxic snake bites e.g. Cape cobra, 1.6% (3) were haemotoxic snake bites e.g. boomslang and 1.6% (3) were other identified snakes e.g. skaapsteker. Figure 27.
Figure 27: Snake groups involved in envenomations

Page 21 of 29
Puff adders were responsible for most of the reported snake bites followed by the Mozambique spitting cobra, Cape cobra, rinkhals, black mamba and night adder, see Table 8. Envenomation by Mozambique spitting cobras were due to spitting, usually in the eyes, as well as bites.
Table 8: Number of identified snakes involved in snake envenomation
Bitis arientans Puff Adder 19
Naja mossambica Mozambique spitting cobra 13
Naja nivea Cape Cobra 12
Hemachatus Haemachatus Rinkhals 6
Dendroaspis polylepis Black Mamba 5
Causus rhombeatus Night adder 4
Naja nigricollis woodi Black spitting cobra 3
Atractaspis bibronii Stiletto snake 3
Dispholidus typus Boomslang 3
Bitis atropos Berg Adder 2
Psammophylax rhombeatus Skaapsteker 2
Naja annulifera Snouted Cobra 1
Crotalus atrox Diamond Back Rattle Snake 1
Spider bite
24.3% (169) of the biological exposures were due to spider bite. Spiders of medical importance are divided into two groups: the neurotoxic spiders and the cytotoxic spiders. Figure 28. In 88.7% (150) of spider bite consultations the spider was not identified. However, spiders are often not seen and then it is presumed to be a spider that has caused the bite. In 8.9% (15) of spider bite cases the spider was identified as a neurotoxic spider and in 1.2% (2) of spider bite cases the spider was identified as a cytotoxic spider. Non-toxic identified spiders included the rain spider: Palystes (1.2%, 2).
Figure 28: Type of spiders involved in spider bites

Page 22 of 29
Cases where the spiders were identified: (See Table 9)
Neurotoxic spiders: o Latrodectus indistinctus (black button spider) (6.7%, 11) o L. geometricus (brown button spider) (2.4%, 4).
Cytotoxic spiders: o Cheiracanthium (sac spider) (0.6%, 1) o Loxosceles (violin spider) (0.6%, 1).
Non Toxic: Palystes (rain spider) (1.2%, 2).
Table 9: Number of spider bite/suspected spider bite cases
Non toxic Cytotoxic Neurotoxic Unidentified
Palystes 2 Cheiracanthium 1 L indistinctus 11 150
Loxosceles 1 L geometricus 4
Scorpion sting
14.5% (101) of the biological exposures were due to scorpion sting. Most scorpion stings (86.2%, 87) were inflected by unidentified species and only an intense burning sensation was recorded, Figure 29.
Figure 29: Type of scorpions involved in envenomation
5.9% (6) of the scorpions involved in stings were identified as Parabuthus granulatus. A further 5.9% (6) of scorpion sting cases presented with symptoms and signs of parabuthus species envenomation however the scorpion was not identified. Uroplectes (2%, 2) stings do not cause life-threatening symptoms and signs. Table 10 indicates the number of scorpion sting cases that was dealt with during the year.

Page 23 of 29
Table 10: Number of scorpion sting cases
Unidentified scorpions 87
Venomous symptoms: unidentified scorpion 6
Parabuthus granulatus 6
Uroplectes 2
Marine envenomation
1.4% (8) of the biological exposures was due to marine exposures which are caused by venomous and poisonous marine animals.
Venomous marine animals inflict injury by means of bites, stings or direct contact, e.g. blue bottles and stingrays.
Poisonous marine animals are those that cause systemic effects when ingested e.g. mussels (red tide) and “spoilt” fish (scombroid poisoning).
Serious venomous marine envenomations were caused by contact with stingrays. Penetration of the stinger causes a wound that does not heal easily. Ingestion of yellow tail was responsible for the two poisonous marine animal exposures resulting in scombroid poisoning. Table 11 indicates the venomous and poisonous marine animals encountered during 2014.
Table 11: Venomous and poisonous marine animals
Venomous marine animals Poisonous marine animals
Barbel 1 Yellow tail 2
Catfish 1
Eel 1
Jelly fish 1
Octopus 1
Seal 1
Stingray 2

Page 24 of 29
Mushroom exposures 5.9% (41) of the biological exposures were due to mushroom ingestions. Mushroom exposures occurred mostly in children under the age of 5 years (80%, 33). These were mushrooms found on the lawn and in the garden. Although photographs can be of assistance in the identification of mushrooms, in most cases of mushroom ingestion the mushrooms were unidentified (95.1%, 39). Table 12. During 2014 two Amanita phalloides mushroom cases (4.9%) were reported, one case was in an adult and one case in a 9 year old child. It caused death in the child.
Table 12: Mushroom Exposures
Mushrooms
Unidentified Mushrooms 39
Amanita phalloides 2
Plant Exposures
17.6% (123) of the biological exposures were due to plant exposures. Plants were divided into groups as seen in Table 13.
Table 13: Plants as per toxin-group
Other
Cactus 2 Arum lily 11 Berries unknown 11 Acorns 1
Euphorbia 2 Delicious monster 5 Seeds unknown 5 Canna lily 1
Succulant 2 Dumb cane 6 Lucky bean 2 Fig 1
Elephants ear 4 Jerusalem Cherry 1 Cycad 2
Other Araceae 3 Coral tree berry 2 Frangipani 1
Jatropha seed 2 Potato 1
Syringa berry 6 Palm tree 2
Clivia seed 4 Thorn 2
6 29 33 Strilitzia 1
Duranta species 6 Oleander 4 Unknown Plant 32
Moonflower 1
7 4 32 12
Cardiac Glycosides
Euphorbia Oxalate Crystals Berries & Seeds
Anticholinergics Unknown Plant
Figure 30 indicates the exposures to plants and plant groups that the centre dealt with during 2014. Most of the plant exposures were in children.

Page 25 of 29
Figure 30: Exposures to plants and plant toxins.
Berries (26.8%, 33) were responsible for the largest number of plant ingestions, occurring mostly in children.
o In most cases (48.5%, 16) the berries were unidentified. o In 6 cases (18.2%) syringa berries were involved. o In 4 cases (12.1%) clivia seeds were involved.
Oxalate crystal containing plants (23.6%, 29) were responsible for the second most exposures to plants. Most of these exposures were also in children.
o This group includes arum lily, elephant’s ear, delicious monster and dumb cane.
The anticholinergics (5.7%, 7), containing tropane alkaloids, include o Datura strammonium (thorn apple) especially the seeds which are locally
known as “malpitte” (85.7%, 6). o Brugmansia commonly known as moon flowers (14.3%, 1). o These were ingested mostly by the adolescent group.
Adult exposures were usually accidental and due to dermal contact with euphorbia species (4.9%, 6 cases).
o Euphorbia species include all plants that produce a white, milky sap called latex. It is usually very irritating to humans.

Page 26 of 29
General Activities
Teaching and Training
MB ChB V Clinical Block 28 January 2014: Toxicology
Two clinical pharmacology registrars, Dr M Makiwane and Dr A Abulfathi, from the Division of Clinical Pharmacology, Faculty of Medicine and Health Sciences, Stellenbosch University, completed a 2 month toxicology training rotation at the TPIC – January – February 2014
Eleven Pharmacist interns received training in poison centre work o Seven Pharmacist Interns: 04 February 2013 until 31 March 2014. o One Pharmacist Intern: 05 – 16 May 2014. o Three Pharmacist Interns: 17 – 27 June 2014.
Hons (Clinical Pharmacology): 4 students received training in toxicology – 31 March – 4 April 2014.
Rezia Banderker, 5th year MBChB, did her elective in Toxicology: 7 July – 25 July 2014.
Workshops Venomous Bites and Stings Course: Johan Marais, University of Stellenbosch,
Tygerberg Campus. 10 April 2014 o Dr GJ Muller. Management of Scorpion sting and spider bite.
StellMed Refreshers Course for GP’s: Spier, Stellenbosch. 28 May 2014. o Ms C Marks. Drugs of Abuse.
TOXSA training workshop. “In vivo and in vitro methods to identify and evaluate chemical health hazards: establishment of laboratory facilities and provision of training in the Risk Assessment of Chemicals in South Africa.” 11 – 12 July 2014. Two Oceans Aquarium, Cape Town. Attendance: Ms CA Wium.
Spider Bite Course: Prof A Dippenaar-Schoeman, Division of Clinical Pharmacology, University of Stellenbosch, Tygerberg Campus. 28 October 2014
o Dr GJ Muller. Diagnosis and Management of spider bite.
Eighth Meeting of Users of the IPCS INTOX Data Management System, Cardiff Metropolitan University, Cardiff, UK. 24 – 26 November 2014.
Poisons centre data collection projects o South African data on pesticide exposures: CJ Marks o Epidemiology of Snake Bite in South Africa:CJ Marks o Evidence for the cost-effectiveness of poison centres: CJ Marks o Poisoning in special populations: Infants , CJ Marks
Update in Medical Toxicology. Thistle Hotel, Cardiff. 27 November 2014. Ms CJ Marks.
Media skills workshop for research scientists. Stellenbosch University, 1 December 2014. Ms CJ Marks.
Community outreach Ruyterwacht Senior Sentrum, Cape Town. Presentation on Snake and Spider
bite, Scorpion stings. 11 February 2014. o Ms CA Wium

Page 27 of 29
Mail and Guardian: Article. 24 February 2014 o Medicinal use of cannabis. Dr GJ Muller
RSG radio interview: 24 February 2014 o Medicinal use of cannabis. Dr GJ Muller
Franschhoek Style: Article (page 36 – 37). 01 April 2014. o The dagga debate: Weeding out the fiction. Dr GJ Muller.
SABC2 TV Bonita’s House Call: medical talk show with Dr Victor Ramathesele, 05 April 2015.
o Poisoning. Dr GJ Muller and Ms CJ Marks
SABC eTV: Interview. 15 April 2014. o Acid attacks in the country. Dr GJ Muller
International Labour Organization’s (ILO) World Day for Safety and Health at Work: Seminar conducted by Occupational Health and Hygiene, City of Cape Town: “Safety and Health in the use of chemicals at work”. 23 April 2014.
o Toxicology, common poisoning cases and first aid measures. Dr GJ Muller.
Die Burger: Article. 19 May 2014. o Dagga as medisyne vereis ook beheer. Dr GJ Muller.
Ruyterwacht Senior Sentrum, Cape Town. Presentation on Plants and Mushrooms. 20 May 2014.
o Ms CA Wium
Mini Safety Expo: Table View Pick ‘n Pay Centre. Participated in the safety expo by providing educational information on exposures to poisonous substances. 27 June 2014.
Child Magazine: Cape Town’s best guide for parents. Article. November 2014. o Quicksilver. Ms CA Wium.
.
Congresses
Feasibility for a Sub-Regional Poisons Centre in the East Africa Sub-Region. 17th World Congress of Basic and Clinical Pharmacology, Cape Town, South Africa, 14 – 18 July 2014. CJ Marks.
17th World Congress of Basic and Clinical Pharmacology, Cape Town, South Africa, 14 – 18 July 2014. Delegate attendance: A Du Plessis: 15 July 2014 and CA Wium: 17 July 2014.
Academic Year Day
57th Annual Academic Year Day, Faculty of Health Sciences, University of Stellenbosch, 13 August 2014 Tygerberg Campus o Methamphetamine Abuse: The Clinical Pharmacology Laboratory Experience.
DJ Francis, B Rosenkranz, CA Wium.
Collaboration and Visits
Professor David Warrell, Emeritus Professor of tropical medicine at the Nuffield Department of Clinical Medicine; Honorary Fellow of St Cross College, University of Oxford; and Principal Fellow, Australian Venom Research Unit, University of Melbourne, Australia. Visited the TPIC on 19 February 2014.
o Scorpion identification and discussion.
Dr Tom Menge, Deputy chief pharmacist, specialist pharmacologist and toxicologist, Department of Pharmacy, Kenyatta National Hospital, Nairobi, Kenya. Visited the TPIC on 04 April 2014.

Page 28 of 29
o Discussions on centres in Africa.
Prof D Tagwireyi, Poison Control Centre, Department of Pharmacology, University of Zimbabwe, Harare, Zimbabwe. Visited the TPIC on 24 July 2014.
o PIC collaboration discussions.
Other Projects
Quarterly reports on activities and achievements of the Centre are submitted to the Department of Environmental Health.
Tygerberg Hospital: Patients admitted to Tygerberg Hospital due to drug
overdose or exposures to poisonous substances are followed up by the Poison Information Centre personnel on a regular basis.

Page 29 of 29
Acknowledgements:
o The Tygerberg Poison Information Centre gratefully acknowledges
o Tygerberg Hospital’s financial support toward maintaining and running
the centre and remuneration of after hour consultants.
o Support from the Faculty of Medicine and Health Sciences, University
of Stellenbosch.
o Financial support from CropLife South Africa.