accuracy of methods for reporting inorganic element
TRANSCRIPT

Accuracy of methods for reporting inorganic element concentrations and radioactivity in oil and gas wastewaters
from the Appalachian Basin, U.S. based on an inter-laboratory comparison
Journal: Environmental Science: Processes & Impacts
Manuscript ID EM-ART-08-2018-000359.R2
Article Type: Paper
Date Submitted by the Author: 09-Oct-2018
Complete List of Authors: Tasker, Travis; The Pennsylvania State University, Civil and Environmental EngineeringBurgos, Bill; Pennsylvania State University, Ajemigbitse, Moses; Penn State, Lauer, Nancy; Duke University, Nicholas School of the EnvironmentGusa, Alen; University of Pittsburgh, Department of Civil and Environmental EngineeringKuatbek, Maksat; The Pennsylvania State University, Department of Mechanical and Nuclear EngineeringMay, Dustin; University of IowaLandis, Joshua; Dartmouth CollegeAlessi, Daniel; University of Alberta, Earth and Atmospheric SciencesJohnsen, Amanda; The Pennsylvania State University, Radiation Science and Engineering CenterKaste, James; The College of William & Mary, Department of GeologyHeadrick, Kurt; Maxxam AnalyticsWilke, Franziska D. H.; Helmholtz Ctr PotsdamMcNeal, Mark; ACZ LaboratoriesEngle, Mark; USGSJubb, Aaron; USGSVidic, Radisav; University of Pittsburgh, Radisav Vidic; Radisav Vidic, Radisav VidicVengosh, Avner; Duke University, Nicholas School of the EnvironmentWarner, Nathaniel; Penn State, CEE; Penn State CEE
Environmental Science: Processes & Impacts
Accuracy of methods for reporting inorganic element concentrations and radioactivity in
oil and gas wastewaters from the Appalachian Basin, U.S. based on an inter-laboratory
comparison
Significance Statement
Accurate analyses are important for regulating oil and gas (O&G) development and tracing
potential contamination events. In this work, an inter-laboratory comparison among commercial and
academic labs revealed that reported radioactivity and trace metal concentrations (i.e., Ra, Cr, Ni, Cu, Zn,
As, Cd, and Pb) in O&G wastewaters can be over ±40% different from the most probable value (MPV).
Out of all the analytes measured in this study, reported 226
Ra activities—a known carcinogen—were the
most inconsistent and ranged by approximately 200% for a single sample. This variability in reported Ra
activities could influence how the wastewaters are managed or identified in the environment, warranting
further attention and research. We propose that the variable Ra activities could be due to calibration
inconsistencies among labs, radon leakage, or failure to account for self-attenuation. Future work is
necessary to develop standard methods and reference materials for Ra analyses of O&G wastewaters.
Page 1 of 53 Environmental Science: Processes & Impacts
123456789101112131415161718192021222324252627282930313233343536373839404142434445464748495051525354555657585960

Accuracy of methods for reporting inorganic element concentrations and radioactivity in oil and gas wastewaters from the Appalachian Basin, U.S. based on an inter-laboratory comparison
Tasker, T.L.a*, Burgos, W.D. a, Ajemigbitse, M.A.a, Lauer, N.E.b, Gusa, A.V.c, Kuatbek, M.d,e,, May, D.f, Landis, J.D.g, Alessi, D.S.h, Johnsen, A.M.d, Kaste, J.M.i, Headrick, K.j, Wilke, F.D.H.k, McNeal, M.l, Engle, M.m, Jubb, A.M.m, Vidic, R.c, Vengosh, A.b, Warner, N.R.a
aDepartment of Civil and Environmental Engineering, The Pennsylvania State University, 212 Sackett Building, University Park, Pennsylvania 16802, United States
bDivision of Earth and Ocean Sciences, Nicholas School of the Environment, Duke University, Durham, North Carolina 27708, United States
cDepartment of Civil and Environmental Engineering, University of Pittsburgh, Pittsburgh, Pennsylvania 15213, United States
dRadiation Science and Engineering Center, The Pennsylvania State University, 101 Breazeale Nuclear Reactor, University Park, Pennsylvania 16802, United States
eDepartment of Mechanical and Nuclear Engineering, The Pennsylvania State University, 137 Reber Building, University Park, Pennsylvania, 16802, United States
fState Hygienic Laboratory, University of Iowa, 2490 Crosspark Road, Coralville, Iowa 52241, United States
gDepartment of Earth Sciences, Dartmouth College, 6105 Fairchild Hall, Hanover, New Hampshire 03755, United States
hDepartment of Earth and Atmospheric Sciences, University of Alberta, 1-26 Earth Sciences Building, Edmonton, Alberta T6G 2E3, Canada
iDepartment of Geology, The College of William & Mary, Williamsburg, Virginia 23185, United States
jMaxxam Analytics, 6790 Kitimat Road, Unit 4, Mississauga, Ontario L5N 5L9, Canada
kHelmholtz Centre Potsdam – German Centre for Geosciences (GFZ), Telegrafenberg, Potsdam 14473, Germany
lACZ Laboratories, Inc., 2773 Downhill Drive, Steamboat Springs, Colorado 80487, United States
mU.S. Geological Survey, 12201 Sunrise Valley Drive, Reston, Virginia 20192, United States
*Corresponding author
Page 2 of 53Environmental Science: Processes & Impacts
123456789101112131415161718192021222324252627282930313233343536373839404142434445464748495051525354555657585960

Abstract
Accurate and precise analyses of oil and gas (O&G) wastewaters and solids (e.g., sediments and
sludge) are important for the regulatory monitoring of O&G development and tracing potential
O&G contamination in the environment. In this study, 15 laboratories participated in an inter-
laboratory comparison on the chemical characterization of three O&G wastewaters from the
Appalachian Basin and four solids impacted by O&G development, with the goal of evaluating
the quality of data and the accuracy of measurements for various analytes of concern. Using a
variety of different methods, analytes in the wastewaters with high concentrations (i.e., > 5
mg/L) were easily detectable with relatively high accuracy, often within ±10% of the most
probable value (MPV). In contrast, often less than 7 of the 15 labs were able to report detectable
trace metal(loids) concentrations (i.e., Cr, Ni, Cu, Zn, As, and Pb) with accuracies of
approximately ±40%. Despite most labs using inductively coupled plasma mass spectrometry
(ICP-MS) with low instrument detection capabilities for trace metal analyses, large dilution
factors during sample preparation and low trace metal concentrations in the wastewaters limited
the number of quantifiable determinations and likely influenced analytical accuracy. In contrast,
all the labs measuring Ra in the wastewaters were able to report detectable concentrations using
a variety of methods including gamma spectroscopy and wet chemical approaches following
Environmental Protection Agency (EPA) standard methods However, the reported radium
activities were often greater than ±30% different than the MPV possibly due to calibration
inconsistencies among labs, radon leakage, or failing to correct for self-attenuation. Reported
radium activities in solid materials had less variability (±20% from MPV) but accuracy could
likely be improved by using certified radium standards and accounting for self-attenuation that
results from matrix interferences or a density difference between the calibration standard and the
Page 3 of 53 Environmental Science: Processes & Impacts
123456789101112131415161718192021222324252627282930313233343536373839404142434445464748495051525354555657585960

unknown sample. This inter-laboratory comparison illustrates that numerous methods can be
used to measure major cation, minor cation, and anion concentrations in O&G wastewaters with
relatively high accuracy while trace metal(loid) and radioactivity analyses in liquids may often
be over ±20% different from the MPV.
Keywords: brine; analysis; trace metals; radium; solids (TENORM)
Introduction:
Horizontal drilling and hydraulic fracturing has increased oil and gas (O&G) production
from low permeability shale formations throughout the United States (U.S.). In 2017, the U.S.
Energy Information Administration (EIA) estimated that nearly 60% (0.48 trillion cubic meters)
of the U.S. natural gas production was produced from shale resources throughout the U.S.,
including the Marcellus, Utica, Permian, Haynesville, Eagle Ford, Barnett, Woodford, and
Bakken Shales1. This shale development has lowered national carbon dioxide (CO2), nitrogen
oxide (NOx), and sulfur dioxide (SO2) emissions by shifting energy production from coal to
natural gas2. However, the increased production has also resulted in concerns with respect to
seismic activity3, methane emissions4, ground water and surface water contamination5, 6, and the
disposal of solid and liquid wastes that can lead to substantial increases in seismic activity and
concentrations of some contaminants in surface waters7, 8.
O&G production creates large quantities of high salinity (>100,000 mg/L total dissolved
solids [TDS]) liquid wastes that cause challenges for wastewater management and disposal.
Wastewater production volumes from U.S. shale plays have been estimated at 27 - 130 liters of
produced water per billion cubic meter of gas (L/Bm3) in the Eagle Ford and Haynesville shales,
more than 130 L/Bm3 from the Barnett Shale, and approximately 3.3 - 94 L/Bm3 from the
Marcellus Shale, which generated approximately 0.67 billion cubic meters of natural gas per day
Page 4 of 53Environmental Science: Processes & Impacts
123456789101112131415161718192021222324252627282930313233343536373839404142434445464748495051525354555657585960
(Bm3/day) in 2017 9, 10. Depending on the shale play, these fluids typically contain high
concentrations of salts, metals, naturally occurring radioactive materials (NORMs), and organic
compounds that make proper management via treatment and/or disposal particularly important in
limiting potential human and environmental health concerns11, 12. O&G wastewater disposal
options include injection into subsurface formations, reuse to develop other wells, treatment at
wastewater treatment facilities with surface water discharge permits, storage in evaporation
ponds, or beneficial reuse for other practices such as irrigation, dust suppression and de-icing of
roads, or livestock watering13-16. Particular concerns with these practices are related to the
salinization of freshwater resources17, accumulation of radium or trace metals in roads treated
with O&G wastewaters15, 18 or in sediments downstream of O&G wastewater treatment
facilities19, and human health impacts (e.g., mutagenesis, endocrine disruption, neurotoxicity, or
cytotoxicity) by exposure to organic compounds in the wastewaters20, 21. One way that state and
federal regulators monitor O&G wastewater disposal is by requiring chemical analyses of surface
water discharges from facilities treating O&G wastewaters (40 CFR Part 122) or analyses of
O&G wastewaters being permitted for other beneficial uses (e.g., irrigation, dust suppression, de-
icing, or livestock)13, 15. States such as Pennsylvania also require O&G operators who generate
more than 1,000 kilograms of waste per well in a calendar year to report the chemistry of their
wastewater to the Pennsylvania Department of Environmental Protection (PADEP) along with a
description of disposal facilities that have received the waste22. The accuracy of these chemical
analyses are important for regulatory purposes, proper treatment, as well as fingerprinting
applications for identifying O&G wastewaters after potential contamination events23-25.
Accurate analyses of metal and radioactivity concentrations in O&G wastewaters are
challenging due to the complex fluid matrix26. Common analytical methods for detecting metals
Page 5 of 53 Environmental Science: Processes & Impacts
123456789101112131415161718192021222324252627282930313233343536373839404142434445464748495051525354555657585960

in O&G wastewaters, such as inductively coupled plasma optical emission spectrometry (ICP-
OES) or mass spectrometry (ICP-MS), can be hampered by non-spectral and spectral
interferences in high salinity fluids. Non-spectral interferences include signal suppression from
easily ionized elements (e.g., Na and K) as well as the accumulation of salts or oxide minerals on
cones in ICP-MS systems26. Other spectral interferences such as superimposing element
emission lines in ICP-OES or the presence of polyatomic species (e.g., as 40Ar23Na+ on 63Cu+) in
ICP-MS can also influence analytical results27, 28. A number of techniques exist to correct for
these differences, including sample dilution, wet chemical separation, alternative sample
introduction, mathematical calculations, and calibration and internal standard modifications.29, 30
Sample dilution is the most common way of reducing potential matrix effects, but often results in
decreased sensitivity and elevated method detection limits for trace metal(loids) of concern (e.g.,
As, Pb) in O&G wastewaters26.
Numerous techniques exist for measuring radium in O&G wastewaters including
methods by alpha particle spectrometry (EPA Method 903.0)31, 222Rn emanation counting in a
scintillation cell (EPA Method 903.1)32, gamma ray spectrometry (EPA Method 901.1)33, beta
particle spectroscopy (EPA Method 904.0)34, or ICP-MS35. Some of these methods measure Ra
activities directly by ICP-MS or alpha, beta, and gamma emissions while other methods measure
Ra indirectly based on emissions by daughter products. Among these, the 222Rn emanation
technique involves the collection and indirect counting of alpha particles emitted by 222Rn, a
daughter product of 226Ra 32. In some cases, this method may also require the pre-concentration
of 226Ra from samples using co-precipitation techniques with barium sulfate (EPA Method
903.1)32, 36, 37. There are some undesirable aspects of this method including long waiting periods
required for radon ingrowth (>21 days ingrowth) and potential loss of Ra during sample pre-
Page 6 of 53Environmental Science: Processes & Impacts
123456789101112131415161718192021222324252627282930313233343536373839404142434445464748495051525354555657585960

concentration 32, 36, 37. Co-precipitation techniques are also required to remove 228Ra from
solutions prior to indirect measurements of its 228Ac daughter using beta particle spectroscopy34.
Methods by alpha particle spectrometry can measure 226Ra directly based on α emissions at 4.78
MeV but also often require pre-concentration, chemical separation, and purification techniques
to remove other alpha emitters38. High salinity O&G samples can reduce Ra yields during
chemical separation and purification but can likely be accounted for using tracers37, 38. Because
of the high salinity of O&G wastewaters and potential difficulty in recovering Ra from these
solutions, standard EPA methods that require Ra separation prior to analyses have been
discouraged for analyses of O&G wastewaters37.
One method that has been encouraged for radioactivity analyses of O&G waste is gamma
ray spectrometry37. This method requires no sample preparation or pre-concentration techniques
potentially reducing the risk of low Ra yields from co-precipitation or chemical separation
methods; yet, it is still common to concentrate Ra in co-precipitates or evaporites and analyze the
solids using gamma ray spectrometry39. 226Ra can be measured directly using the gamma
emission energy at 186.2 keV. However, gamma emissions from 235U at 185.7 keV can also
interfere with direct 226Ra measurements. This interference is more likely an issue in O&G drill
cuttings or sediment materials than O&G wastewaters due to their relative activities of 235U 37.
An alternative method for 226Ra is to measure the indirect gamma emission of 214Pb at 295.2 keV
and 351.9 keV and 214Bi at 609.3 keV following equilibrium between 226Ra and 222Rn. Similarly,
the indirect method for determining 228Ra is based on the gamma emission of its 228Ac daughter
at 911.2 keV. There are several factors that could lead to inaccurate Ra measurements of O&G
wastes using gamma spectrometry. Rn leakage in sample containers can influence indirect
measurements of 222Rn progeny (i.e., 214Pb and 214Bi). Leakage could occur by improperly sealed
Page 7 of 53 Environmental Science: Processes & Impacts
123456789101112131415161718192021222324252627282930313233343536373839404142434445464748495051525354555657585960
containers or by diffusion through polyethylene plastics which commonly make up Marinelli
beakers and other containers used for gamma ray spectroscopy measurements40. O&G solid and
liquid wastes may also have different chemical compositions (e.g., high salinity; radio-barite co-
precipitates) and densities (e.g., often greater than 1.2 g/mL densities in O&G wastewaters) in
comparison to standards. This can result in differences in attenuation of gamma photons between
samples and standards, leading to analytical inaccuracies41. Attenuation may be accounted for
using a variety of techniques although standard EPA methods do not require these corrections33,
41, 42.
An inter-laboratory comparison was organized among commercial, academic, and
government labs throughout the U.S., Canada, and Germany to determine how these potential
sources of error effect the accuracy of O&G waste characterizations. Several of the commercial
labs had previously analyzed O&G wastes for certificate of analyses in regulatory applications.
The main goals of the comparison were to 1) evaluate the overall quality of data from
laboratories analyzing O&G wastes, 2) identify methods that produce acceptable quality data for
the analytes of concern in O&G wastes, and 3) evaluate the analytical accuracy for various
analytes of concern in O&G wastes, including Na, K, Mg, Ca, Sr, Ba, Li, B, Al, Fe, Mn, Cr, Ni,
Cu, Zn, As, Pb, Cl, Br, SO4, 226Ra, and 228Ra.
Methods
Sample preparation and shipment. Three O&G wastewaters chosen for the study were
collected from oil and gas wells throughout the Appalachian Basin, located in the northeastern
United States and stored in 20 liter high density polyethylene (HDPE) containers. One liter of
each of the wastewaters were filtered with a 0.45 µm cellulose acetate filter and then stored at
4°C for anion analyses (i.e., Cl, Br, SO4). The remaining wastewaters were acidified with 5%
Page 8 of 53Environmental Science: Processes & Impacts
123456789101112131415161718192021222324252627282930313233343536373839404142434445464748495051525354555657585960

nitric acid and filtered for elemental and radioactivity analyses (i.e., Na, K, Mg, Ca, Sr, Ba, Li,
B, Al, Fe, Mn, Cr, Ni, Cu, Zn, As, Pb,226Ra, 228Ra). Thereafter, sub aliquots of each of the
samples were stored in HDPE bottles for sample shipment.
In addition to the three oil and gas wastewaters, four solid samples were pulverized and
sieved (<1.18 mm) for interlab comparisons. Each solid sample was selected to have a matrix
similar to solids commonly analyzed in environmental studies accessing O&G impacts (i.e., river
sediments impacted by O&G wastewater, barite sludge from treatment facilities, and shale core
or cuttings). These solid samples were as follows: solid sample 1 (SS1) was a stream sediment
collected from the Blacklick Creek, Pennsylvania, solid sample 2 (SS2) was a Marcellus Shale
outcrop, and solid sample 3 (SS3) and 4 (SS4) were both Blacklick creek stream sediments
mixed with radio-barite sludge at different ratios. All solid samples were homogenized with a
mixing paddle before packaging and shipment.
Each sample was sent to 15 labs and was received within 1-4 days after shipment. The
labs included eight academic, six commercial, and one government lab. Each lab was instructed
to use their own preparation and analytical methods to analyze the liquid samples for a suite of
cations and anions including Cl, Br, SO4, Li, B, Na, K, Mg, Ca, Sr, Ba, Al, Fe, Mn, S, Cr, Ni,
Cu, Zn, As, Cd, Pb, 226Ra, and 228Ra. Due to the analytical capabilities of participating labs and
the interest in technologically enhanced naturally occurring radioactive material (TENORM) in
oil and gas wastes, only 226Ra and 228Ra were measured for solid samples. Many labs did not
have the analytical equipment to measure all the cations or anions and were therefore asked to
only report analytes and values within their capabilities. An anonymous online portal was created
for data submission and reporting of sample preparation procedures (i.e., dilution factors,
Page 9 of 53 Environmental Science: Processes & Impacts
123456789101112131415161718192021222324252627282930313233343536373839404142434445464748495051525354555657585960

precipitation or pre-concentration methods), analytical equipment and methods used for analyses,
uncertainties, and calibration standards.
Data processing and statistical analysis. All submitted data were evaluated according to
nonparametric statistical methods in Hoaglin et al. (1983)44 that are commonly used in inter-
laboratory comparisons by the United States Geological Survey (USGS)45. This statistical
approach is known to be resistant to outliers because the method is based on median, 25th
percentile, and 75th percentile values rather than mean values in parametric statistics. All data
were first trimmed to exclude values that were reported as zero or below detection limits.
Thereafter, the 25th percentile (Q1), median, and 75th percentile (Q3) concentrations for all
analytes in the three O&G wastewaters and four solid samples were calculated. Fpseudosigma
(mg/L), an approximation for standard deviation, was calculated for each analyte according to:
where 1.349 is the number Fpseudosigma =Q3 ― Q1
1.349 (Equation 1)
of standard deviations encompassing 50% of the data (i.e., Q3-Q1)44.
To perform all desired statistical processing tests, a full suite of data with a high number
of total reported values (>7 reported values per analyte) and low Fpsuedosigma was required. For
analytes with over seven reported values and with Fpseudosigma values less than the median, the
median value of all the data was reported as the most probable value (MPV) for the analyte
concentration within the sample. In this study, Fpseudosigma values for analytes with over seven
reported values were never greater than the median. Thereafter, the performance of the labs were
evaluated by calculating their z-score (dimensionless) according to:
Interpretation of the z-z =reported value ― MPV
Fpseudosigma (Equation 2)
scores were as follows: |z| ≤ 2 is an acceptable result, 2<|z| ≤ 3 is a questionable result, and |z| > 3
Page 10 of 53Environmental Science: Processes & Impacts
123456789101112131415161718192021222324252627282930313233343536373839404142434445464748495051525354555657585960
is an unacceptable result44. The range of acceptable results were compared to the MPV value for
a given analyte to determine the % difference (i.e., accuracy) of the measurements according to:
where MV is the % difference = [MV ― MPVMPV ] × 100 (Equation 3)
measured value of an acceptable result.
In some cases, there were not enough reported values for specific analytes to do all the
desired statistical tests. Therefore, the following modifications were made to the statistical
processing methods above. When five or six values were reported for an analyte in a sample, the
median and Fpseudosigma values were reported with an asterisk (*) along with the 25th and 75th
percentile concentrations. In this scenario, no z-scores or % difference calculations were
performed. No summary statistics were calculated for analytes with <5 reported values. For these
scenarios, the z-scores are represented as not calculable (n.c.) throughout the manuscript and are
not included in data interpretations.
Results and Discussion
Major cations, minor cations, and anions. Major cation (i.e., Na, K, Mg, Ca, Sr, and
Ba), minor cation (i.e., Li, B, Al, Fe, and Mn), and anion (Br, Cl, SO4) concentrations in the
three O&G wastewaters were measured using a variety of methods, including inductively
coupled plasma with optical emission spectrometry (ICP-OES), direct plasma spectrometry
(DCP), inductively coupled plasma with mass spectrometry (ICP-MS), triple quadrupole
inductively coupled plasma with mass spectrometry (ICP-MS/MS), neutron activation analysis
(NAA), X-ray fluorescence (XRF), and ion chromatography (IC). A summary of the instruments
used by participating labs for measuring particular analytes is included in the Supporting
Information (Table S1).
Page 11 of 53 Environmental Science: Processes & Impacts
123456789101112131415161718192021222324252627282930313233343536373839404142434445464748495051525354555657585960

Approximately 50% of all major and minor element analyses were performed using an
ICP-OES (e.g., Perkin Elmer Optima 5300DV ICP-OES, Horiba Ultima Expert ICP-OES,
Spectro ARCOS ICP-OES, Thermo Scientific iCAP 7400, and Thermo Scientific iCAP 6000).
Prior to analyses, samples were diluted between 100-1000 times and measured in accordance
with EPA method 200.7 46 using internal standards (i.e., Sc, In, Re, and Y), quality control
samples, external standards [National Institute of Standards and Technology (NIST) 1640a,
NIST 1643f, Ocean Scientific International Ltd (OSIL) seawater standard, USGS M-220, and
NIST Standard Reference Material (SRM) 1640a], laboratory fortified blanks, matrix spikes,
and/or laboratory reagent blanks to confirm the accuracy of the equipment. In one to three
instances, labs using ICP-OES for major cation analyses switched to ICP-MS for Li, B, Ba, Al,
Fe, or Mn measurements likely due to the lower concentrations of these cations relative to many
of the major cations and lower detection limits of the ICP-MS (often less than 1 ppm after
accounting for sample dilution). More complete descriptions of ICP-MS methods are included in
the following section.
Table 1. The most probable value (MPV), 25th percentile (Q1), 75th percentile (Q3), and Fpseudosigma (F) for major cation, minor cation, and anion concentrations in sample 1, 2, and 3. All values are represented in mg/L. When there were only 5 or 6 reported values submitted, summary statistics are noted with an asterisk (*).When there were less than 5 reported values for a given analyte, summary statistics were not calculable (n.c.).
Sample 1 Sample 2 Sample 3Analyte MPV Q1-Q3 F MPV Q1-Q3 F MPV Q1-Q3 F
Br 746 652 - 773 90.4 1270 1180 - 1440 189 1890 1630 - 2060 320Cl 65600 63900 - 68300 3300 117000 113000 - 120000 5470 176000 160000 - 180000 15000
SO4 n.c. n.c. n.c. n.c. n.c. n.c. 170* 130 – 172* 33.0*Na 27000 24900 - 28600 2710 47500 43600 - 49300 4260 66850 64600 - 68900 3170K 336 276 - 383 79.3 716 621 - 765 107 2190 1770 - 2310 402
Mg 1230 1200 - 1300 69.3 2168 2100 - 2270 127 3100 2990 - 3130 104Ca 10000 9280 - 10200 686 19800 18600 - 20600 1480 31400 30000 - 33200 2350Sr 2160 2130 - 2200 49.7 3710 3580 - 3940 270 1540 1410 - 1620 156Ba 659 641 - 690 37.2 1320 1280 - 1380 72.8 6.12 6.07 - 6.33 0.20Li 32.1 30.3 - 34.3 3.00 50.3 48.0 – 51.0 2.19 71.7 68.0 - 74.2 4.60B 5.00 3.95 - 5.09 0.85 7.00 6.76 - 8.05 0.95 15.3 14.7 - 16.0 0.99Al n.c. n.c. n.c. n.c. n.c. n.c. n.c. n.c. n.c.Fe 64.8 58.7 - 69 7.61 94.9 85.8 - 98.5 9.44 169 158 - 181 17.0Mn 6.10 5.75 - 6.7 0.70 14.4 13.7 - 14.9 0.93 47.8 41.5 - 48.3 5.06
Page 12 of 53Environmental Science: Processes & Impacts
123456789101112131415161718192021222324252627282930313233343536373839404142434445464748495051525354555657585960
Other methods for analyses included NAA, XRF, DCP, and IC. One lab used a neutron
activation analysis method for all analyses that consisted of drying samples into crystals,
irradiating the crystals in a nuclear reactor core, and then comparing the emitted gamma rays to
irradiated standard reference materials (i.e., Montana soil 2711 SRM and Buffalo River
sediments)47, 48 using a high purity germanium detector. Another lab used XRF for all analyses
but no details were provided on the method other than the sample analysis time (21 minutes) and
instrument manufacturer (i.e., SPECTRO XEPOS XRF Spectrometer). In one case, an IC
column (Dionex IonPac CS12A IC column with 15 mM methanesulfonic acid eluent) was used
to separate major cations (i.e. Ca, Mg, Na, K, and Sr) for analysis using a Dionex ICS2000 Ion
Chromatograph.
Over 80% of the labs used IC for anion analyses. A diversity of columns and methods
were referenced by participating labs, including AS11 HC, AS18, and AS19 columns with KOH
eluent. With the exception of one lab who reported greater than 10,000 times dilution, all labs
diluted samples approximately 100-1,000 times prior to IC analyses. Referenced standards
included the Dionex 7 Anion Standard II and a diluted OSIL seawater standard. Two other labs
used XRF or NAA for determining Cl and Br concentrations in the three samples.
All three O&G wastewaters had major cation, minor cation, and anion concentrations
(Table 1) that were within the 25th to 75th percentile concentrations for wastewaters from the
Appalachian Basin, U.S. (Table S2)49. The samples were nearly 100% charge balanced by
chloride which had the highest concentration in sample 3 (MPV=176,000 mg/L Cl) and the
lowest concentration in sample 1 (MPV=65,600 mg/L Cl). With the exception of SO42- and Al,
which had a low number of reported concentrations among the three samples (n < 5), summary
statistics were calculated for all major cation, minor cation, and anion concentrations according
Page 13 of 53 Environmental Science: Processes & Impacts
123456789101112131415161718192021222324252627282930313233343536373839404142434445464748495051525354555657585960

to non-parametric statistics (Table 1)44. Fpseudosigma values for all these analytes were often orders
of magnitude lower than the MPV suggesting low variability among the reported results.
Greater than 80% of the reported values for major cation, minor cation, and anion
concentrations were of acceptable or questionable quality (Figure 1). For example, between all
three samples, a total of 433 values were reported (e.g., 14 analytes per sample x 3 samples x
number of values submitted by individual labs) and 365 of the values were determined to be of
acceptable or questionable quality. Of the remaining 68 reported values, 56 were of unacceptable
quality and 12 were not calculable because they were below method detection limits (e.g., Al and
SO42- analyses). Unacceptable data quality was examined in more detail to determine if the data
quality was influenced by the methods used for analyses.
Figure 1. Data quality for major cation, minor cation, and anion concentrations reported in sample 1, 2, and 3. Acceptable, questionable, and unacceptable quality were based on z-score calculations when the number of values were ≥ 7 for a given analyte. When 5 or 6 values were reported, no z score was calculated but is noted with an asterisk as a MPV and Fpseudosigma were still calculated (i.e., Table 1). When less than 5 values were reported, no statistics were calculated.
Analyses of unacceptable quality data suggests that both the method and/or lab could
have an influence on the reported major and minor cation concentrations submitted in this study.
There were 48 total unacceptable quality values reported for major and minor cations (note that
an additional 8 anion results were unacceptable) among all three O&G wastewaters. When
grouped by method, the highest percent of unacceptable values were for XRF and NAA (e.g.,
52% of the XRF and 33% of the NAA) while only 9% of the ICP results were unacceptable.
NAA and XRF accounted for 40% of the total unacceptable values for all the submitted data. In
addition, these two methods were each used by one lab.
The high percentage of unacceptable values for NAA could be attributed to analyses of a
few cations. The NAA laboratory reported all detectable analytes, even though there was a strong
Page 14 of 53Environmental Science: Processes & Impacts
123456789101112131415161718192021222324252627282930313233343536373839404142434445464748495051525354555657585960

likelihood that elements with activation products that have short half-lives (less than several
days, e.g. 42K and 82Br) would be compromised by interference from the scattering of gamma
rays from 24Na in the high purity germanium detector. A number of factors influence NAA
detection capabilities, including the isotopic abundance and neutron absorption cross-section of
the target isotope, the gamma ray intensity and gamma ray energy from the activated isotope,
and the presence of other elements in the sample. These last two factors are significant in the
high salinity O&G samples. The very high Na concentration in these samples produces a large
amount of 24Na (t½ = 14.997 hours) during neutron irradiation. The high energy gamma rays
from 24Na (1368.6 keV (99.99%) and 2754.0 keV (99.86%)) undergo Compton scattering in the
high purity germanium detector, creating a Compton plateau of increased counts at energies
below approximately Eγ – 256 keV 50. These increased counts in the lower energy region of the
gamma ray spectrum can alter and even completely obscure the gamma ray peaks from activiated
isotopes that emit lower energy gamma rays. Mainly because of this phenomenon, the most
accurate elemental determinations in these types of O&G samples are for elements whose
activation products have half-lives greater than several days, which allows for the full decay of
the 24Na and the elimination of the 24Na Compton plateaus. For example, by excluding data from
the shorter-lived isotopes (e.g. 42K and 82Br), the percentage of acceptable data points reported
by the NAA laboratory increases to 80%. Furthermore, it appears that three of the four remaining
outliers of unacceptable quality are from sample 3, which has the highest Na concentration of the
three samples; the exact reason for the concentration of outliers in sample 3 is not known, but the
high Na concentration could be the cause. Overall, NAA performs well for elements with longer-
lived activated isotopes such as Sr, Ba, Fe.
Page 15 of 53 Environmental Science: Processes & Impacts
123456789101112131415161718192021222324252627282930313233343536373839404142434445464748495051525354555657585960

Other values reported by labs using ICP-OES suggests that the lab also has an influence
on the quality of data that was submitted. For instance, 17% and 27% of the reported values by
two labs using ICP-OES had unacceptable quality while each of the other six labs using ICP-
OES never had more than 4% of their data rejected due to unacceptable quality. As another
comparison, one lab using ICP-MS for all analyses had 40% of their reported values rejected for
data quality issues while another lab using ICP-MS had less than 6% rejected. These examples
illustrate that each of these ICP methods can likely be used to generate acceptable quality data
when measuring major and minor cation concentrations in O&G wastewaters and that a large
portion of the variability observed in the current study is likely a result of quality control issues
and internal lab protocols for specific analytical methods.
The only analytes that were particularly challenging for all participating labs were
SO4and Al. For instance, only five total detectable SO4 concentrations and seven total detectable
Al concentrations were measured in the three O&G wastewaters (Figure 1). All the reported SO4
values were for sample 3 which had a median value of 170 mg/L and Fpseudosigma value of 33.0
mg/L. While the median value was 170 mg/L, seven labs reported that this was below their
detection (i.e., 200 to 500 mg/L) indicating that SO4 analyses of O&G wastewaters are
challenging for labs when concentrations are below 200 to 500 mg/L. The reasons for the
challenges associated with measuring Al are unresolved as the number of reported values (n = 2
or 3 per sample) and large variations in detection limits (0.02 to 14 mg/L) prevent drawing any
conclusions from the data.
Major cation, minor cation, and anion concentrations in O&G wastewaters were within
±10% of the MPV, with the exception of Br and K which sometimes exceeded ±20%. These
accuracies are very similar to recent inter-laboratory comparisons of freshwaters where
Page 16 of 53Environmental Science: Processes & Impacts
123456789101112131415161718192021222324252627282930313233343536373839404142434445464748495051525354555657585960
acceptable quality data for major cations had ± 8.5% difference from the MPV and minor cations
had up to ± 14.2 % difference (Table S3)45. The range in the percent difference is based on
comparisons of the reported minimum and maximum concentrations of acceptable quality data to
the MPV. Results among the three samples indicate that the most deviation from the expected
MPV occurred for Br and K. If these differences were a result of dilution errors during sample
preparation, then similar % differences would be expected for analytes diluted to the same
dilution factors. This was not observed among the data submitted by several of the labs. For
instance, one lab diluted sample 2 by 50 times for K and Ca analyses by ICP-OES yet Ca
concentrations were within 5% of the MPV while K concentrations were 23% greater than the
MPV. Some of these differences could be attributed to the challenges of analyzing easily
ionizable cations such as K and Na that can have large relative standard deviations in analyses by
ICP51. In another case, one of the labs diluted sample 3 by 100 times and measured Cl
concentrations that were within 2% of the MPV while the bromide concentrations were 20%
greater than the MPV. All Br values reported with acceptable quality were measured using ion
chromatography, therefore, these differences are not necessarily instrument specific but could be
related to differences in calibration standards (e.g., use of certified standards versus standards
made from NaCl or NaBr salts, etc.), matrix-matching calibration standards (e.g., high Cl/Br
ratios in standards), or methods accounting for matrix interferences (e.g., peak overlap with
chloride or peak broadening by CO2 or carbonate anions)52.
Figure 2. Range in accuracy of reported values with acceptable quality for major cation, minor cation, and trace cation concentrations based on comparisons to the MPV. Values with a z score that was between -2 and 2 were considered of acceptable quality. No accuracy calculations were performed for SO4 or Al due to the low number of detectable values and are represented as not calculable (n.c.).
Page 17 of 53 Environmental Science: Processes & Impacts
123456789101112131415161718192021222324252627282930313233343536373839404142434445464748495051525354555657585960

From a regulatory perspective, ±10% to 20% differences in any of the measured analytes
will not have a significant impact on the management or treatment of O&G wastewaters but
could influence geochemical interpretations made about O&G reservoirs based on wastewater
chemistry. For instance, some states that regulate the use of O&G wastewater spreading on roads
require the wastewaters to meet standards for Cl, Ca, Mg, Na, Ba, or Fe15. Other facilities that
treat these same wastewaters are also required to meet effluent discharge standards and permitted
total maximum daily loads for analytes; these standards often include Cl, Ba, and Fe 53. Based on
the results from this inter-laboratory comparison, academic, commercial, and government labs
can analyze each of these analytes with relatively high accuracy following a dilution step and the
±10% differences in measured versus expected values will likely have very little influence on
how the wastewaters are managed. Other ions such as Br may have large percent differences
between measured and expected values. However, there are currently no surface water or
groundwater standards for Br despite evidence that it can lead to the formation of carcinogenic
disinfection byproducts in drinking water17. However, monitoring of Br loads from treatment
facility discharges may be required in future permits and therefore accurate Br measurements
should be a goal of every laboratory54.
Differences in major and minor cations and anion concentrations between the measured
value and MPV will influence the calculation of elemental ratios, which are commonly used to
explain the origin of O&G wastewaters or are used as tracers for fingerprinting potential
contamination events55, 56. For instance, Cl/Br ratios (mass/mass) for reported results with
acceptable quality ranged from 79 to 105 in sample 1 and 78 to 100 in sample 3 (Table S4).
O&G wastewaters throughout the Appalachian Basin are believed to originate from a common
ancient seawater source, however, the range in Cl/Br ratios (<50 to 110) reported in the literature
Page 18 of 53Environmental Science: Processes & Impacts
123456789101112131415161718192021222324252627282930313233343536373839404142434445464748495051525354555657585960

suggests that these fluids likely underwent varying degrees of evaporation (ranging from 20 -
40% evaporation)56-58. As a comparison, the range in Cl/Br ratios reported for any one of the
three samples in this study could be interpreted as a wastewater that originated from a seawater
evaporated by 27% to 39%. Therefore, some of the variability in Cl/Br ratios in existing
literature could be related to the challenges in measuring Br in these fluids. Other ratios
commonly used to trace O&G wastewaters in the environment (e.g., Sr/Ca and B/Cl)23-25 showed
much less variability (Table S4).
Trace metal(loid) measurements. Trace metal(loid)s (i.e., Cr, Ni, Cu, Zn, As, and Pb)
were measured using many of the same methods highlighted for major and minor cations.
However, the majority of analyses (60-75%) were performed using ICP-MS. ICP-MS equipment
included an ICP-MS Element2XR, VG PlasmaQuad3 ICP-MS, Agilent 7500 ICP-MS (n = 2),
Agilent 7900 ICP-MS, Thermo X series 2 ICP-MS, and Agilent 8800 ICP-MS/MS. Samples
prepared for the ICP-MS Element2XR were measured against a 2-point calibration curve and
with a In internal standard. Samples measured on the VG PlasmaQuad-3 ICP-MS were diluted
~1,000 times prior to analyses. The equipment was calibrated with the NIST 1643e/1643f
standard, which was measured at varying concentrations before, after, and throughout sample
runs. Internal standards of In, Th, and Bi were spiked into all the samples prior to analyses.
Analyses on the Agilent 7500 ICP-MS were diluted 100 to 1,000 times prior to measurements.
The equipment was calibrated using NIST traceable standards and Sc, Ba, Ge, Rh, In, Pt, and Bi
were used as internal standards. All analyses on the Agilent 7900 ICP-MS were measured
according to EPA 200.8. Samples were diluted ~10 times prior to analyses. Calibration check
standards and laboratory control samples were measured before all samples and four internal
standards were used (Tb, Rh, Ge, and Sc) to account for instrument drift. All analyses on the
Page 19 of 53 Environmental Science: Processes & Impacts
123456789101112131415161718192021222324252627282930313233343536373839404142434445464748495051525354555657585960

Thermo X series 2 ICP-MS were diluted approximately ~100 times prior to analyses. Mass
interferences and matrix complications were accounted for by using internal standards (Sc, In,
Re, Y) and high salinity, matrix-matched standards. Calibration curves for all analyses were
verified by confirming <5% differences between measured and known metal(loid) concentrations
in check standards (USGS M-220, USGS T-227, and SRM1640a). Lastly, analyses performed on
the Agilent 8800 ICP-MS/MS were analyzed under a variety of conditions (i.e. no gas, He 5 mL,
H2, and O2 gas). To account for instrumentation drift, a mix of internal standards including Sc,
Ge, In, Lu, and Bi were run in a variety of acquisition modes. Dilution factors for all metal(loid)s
measured by this method were approximately 70.
Table 2. The most probable value (MPV), 25th percentile (Q1), 75th percentile (Q3), and Fpseudosigma (F) for trace metal(loid) concentrations in sample 1, 2, and 3. All values are represented in mg/L. When there were less than 5 reported values for a given analyte, summary statistics were not calculable (n.c.). When there were only 5 or 6 reported values submitted, summary statistics are noted with an asterisk (*). A Grubbs test was also performed on analytes with 5 or more reported values to remove any outliers59.
Sample 1 Sample 2 Sample 3Analyte MPV Q1-Q3 F MPV Q1-Q3 F MPV Q1-Q3 F
Ni 0.01* 0.01 - 0.35* 0.25* 0.03* 0.03 - 0.14* 0.08* 0.03* 0.03 - 0.17* 0.11*
Ni minus outliers
0.01* 0.01 - 0.35* 0.25* 0.03* 0.03* 0.00* 0.03* 0.030* 0.00*
Cu n.c. n.c. n.c. 0.26* 0.12 - 0.69* 0.42* 1.53 1.34 - 1.92 0.43
Cu minus outliers
n.c. n.c. n.c. 0.26* 0.12 - 0.69* 0.42* 1.53 1.34 - 1.92 0.43
Zn 0.16* 0.11 - 0.36* 0.19* 0.33 0.18 - 0.55 0.27 1.86 1.43 - 1.97 0.41
Zn minus outliers
0.13* 0.10 - 0.19* 0.07* 0.28 0.16 - 0.35 0.14 1.83 1.36 - 1.93 0.42
As n.c. n.c. n.c. n.c. n.c. n.c. 0.07* 0.06 – 5.10* 3.75*
As minus outliers
n.c. n.c. n.c. n.c. n.c. n.c. 0.07* 0.06 - 0.10* 0.03*
Pb n.c. n.c. n.c. n.c. n.c. n.c. 0.21 0.20 - 0.45 0.18
Pb minus outliers
n.c. n.c. n.c. n.c. n.c. n.c. 0.20 0.20 - 0.21 0.01
Trace metal(loid) determinations in the O&G wastewaters were challenging for all
laboratories (Table 2). There were only four analytes among the three wastewaters (Zn in sample
2, and Cu, Zn, and Pb in sample 3) that had sufficient data for performing non-parametric
Page 20 of 53Environmental Science: Processes & Impacts
123456789101112131415161718192021222324252627282930313233343536373839404142434445464748495051525354555657585960

statistics and calculating z-scores. The remaining analytes either had too little data to perform
any statistics (n < 5) or not enough data (n = 5 or 6) to perform all statistical analyses (Figure 3).
Even in samples where 5 or 6 values were reported, the 25th (Q1) to 75th (Q3) percentile ranges
were highly variable. For instance, Q1 to Q3 for Ni ranged from 0.009 to 0.345 mg/L and Zn
ranged from 0.108 to 0.358 mg/L in Sample 1 (Table 2). In every analyte with 5 or 6 values
reported, Fpseudosigma was greater than the MPV indicating that there was a large amount of
variability among the data.
High method detection limits relative to the trace metal(loid) concentrations within the
wastewaters reduced the number of reported values. The reported MPVs for trace metal(loid)
measured in the three O&G wastewaters for this study (Table 2) are within the 25th to 75th
percentile concentrations for Appalachian Brines (Table S2). However, often greater than 50% of
the participating labs were unable to measure detectable concentrations within the samples
(Figure 3). Trace metal(loid) analyses are often required for certificates of analysis of O&G
wastewaters, but there are no federal trace metal(loid) standards that limit O&G wastewater
disposal. Therefore, trace metal(loid) concentrations in O&G wastewaters are often compared to
the drinking water standards22. Of the analyzed trace metal(loid), the most important to detect are
Cr, Cu, As, and Pb since they have primary drinking water standards of 0.1 mg/L, 1.3 mg/L, 0.01
mg/L, and 0.015 mg/L, respectively. While all the reported instrument detection limits (IDL’s)
for labs using ICP-MS were below these standards, the labs diluted the samples 10 to 1,000 times
to reduce potential matrix effects from analyzing the high salinity brines, resulting in method
detection limits (MDLs) (e.g., dilution factor times instrument detection limit) that were
sometimes greater than the drinking water standards. Methods other than dilution, such as resins
or chelating agents, are often used to remove trace metals from high salinity solutions and
Page 21 of 53 Environmental Science: Processes & Impacts
123456789101112131415161718192021222324252627282930313233343536373839404142434445464748495051525354555657585960

increase method detection limits 60. However, these methods are not necessary if the method
detection limits for analyzing O&G wastewaters are at or below the regulatory standards. ICP-
MS MDLs for these trace metal(loid)s were 0.05 to 0.6 mg/L for Cr, 0.01 to 2.76 mg/L for Cu,
0.01 to 0.1 mg/L for As, and 0.01 to 0.06 mg/L for Pb. Therefore, the MDLs were less than one-
to-six times above the drinking water standard for Cr, less than one-to-two times above for Cu,
one-to-ten times above for As, and one-to-seven times above for Pb. In other words, all labs were
able to achieve MDLs that were close to the primary drinking water standards, the concentrations
in the O&G wastewaters were simply low and challenging to detect after the samples were
diluted.
Figure 3. Data quality for trace metal(loid) concentrations reported in sample 1, 2, and 3. Acceptable, questionable, and unacceptable designations were based on z-score calculations when the number of reported values was ≥ 7 for a given analyte. When 5 or 6 values were reported, no z score was calculated but is noted with an asterisk as a MPV and Fpseudosigma were still calculated (Table 2). When less than 5 values were reported, no statistics were calculated.
Only samples that had more than 0.2 mg/L of Pb or 1.5 mg/L Cu were detectable by more
than 50% of labs. Of the reported values for Pb in sample 3, five were of acceptable quality
while the other two values reported by labs using XRF or ICP-OES were determined to be of
questionable or unacceptable quality. The lab using ICP-OES performed no sample dilution.
Therefore, matrix interferences from the high salinity wastewater could have influenced their
reported Pb concentrations26. All the reported values with acceptable quality were by labs using
ICP-MS with measured Pb concentrations ranging from 0.2 mg/L to 0.22 mg/L, approximately
10 times above the drinking water standard. Pb measurements by ICP-MS were accurate, only
deviating ±5% from the MPV (Figure 4). In comparison, other methods that produced
questionable or unacceptable quality values for sample 3 (i.e., XRF and ICP-OES) measured Pb
concentrations that were 200 to 11,000% different than the MPV. Therefore, we strongly
Page 22 of 53Environmental Science: Processes & Impacts
123456789101112131415161718192021222324252627282930313233343536373839404142434445464748495051525354555657585960

encourage using ICP-MS for Pb analyses of O&G wastewaters. This method might be limited by
MDLs, but appears to be accurate among five labs using ICP-MS at concentrations
approximately 10 times above the drinking water standard. Due to the low number of measured
Pb values in other samples, we could not assess the data quality and performance at lower Pb
concentrations.
Figure 4. Range in accuracy of reported values with acceptable quality for trace metal(loid)s based on comparisons to the MPV. No accuracy calculations were performed for sample 1 due to the low number of detectable concentrations. Other metal(loid)s where statistics were not calculable (n.c.) due to the low number of detectable values (n < 7) are shown for sample 2 and 3.
Cu was the only other metal on the EPA’s list of metals in drinking water that had a
sufficient number of reported values to assess the data quality. All of the reported Cu values in
sample 3 were determined to be of acceptable quality with concentrations ranging from 1.0 to 2.1
mg/L; values that are close to the EPA standard for drinking water quality (1.3 mg/L). These
measurements were also relatively accurate, ranging from ± 40% difference in comparison to the
MPV (Figure 4). In other samples with Cu concentrations less than 1.5 mg/L, there was a high
amount of variability with Fpseudosigma often greater than the median value (Table 2).
A significant amount of variability was observed in reported values for all other trace
metal(loid)s that could be related to the methods used by a few participating labs. For many of
the trace metal(loid)s, less than seven measured values were reported limiting our ability to use
the non-parametric statistics method (i.e., the z-score method by Hoaglin et al. (1983) and in
USGS inter-laboratory comparisons)44, 45 to identify unacceptable or questionable quality data.
Therefore, the Grubbs statistical test for identifying outliers59 was performed on analytes with
five or more detectable values to determine if there were any statistically significant outliers (p <
0.05) in the trace metal data. When outliers were detected, the MPV, Q1 to Q3, and Fpseudosigma
Page 23 of 53 Environmental Science: Processes & Impacts
123456789101112131415161718192021222324252627282930313233343536373839404142434445464748495051525354555657585960

values were recalculated (Table 2). For all trace metal(loid)s with five or more measured values,
10 outliers were identified out of the 66 total values reported for trace metal(loids)s. All outliers
came from results submitted by four labs who used ICP-OES, XRF, NAA, or ICP-MS. When
compared to the total number of trace metal(loid) values determined by each method, 57% of the
data submitted by XRF (4 outliers out of 7 measured values), 50% of the data submitted by ICP-
OES (3 outliers out of 6 measured values), and 33% of the data submitted by NAA methods (1
outlier out of 3 measured values) were outliers. For NAA, both reported Zn values were
acceptable, but the single As value was not. These NAA results are consistent with the
previously identified trend of longer-lived activated isotopes (65Zn, t½ = 243. 93 days) providing
more accurate data than shorter-lived activated isotopes (76As t½ = 26.24 hours), as the longer-
lived isotopes can be measured after the decay of 24Na. In contrast, less than 4% of the data (2
out of 53) submitted by ICP-MS were considered outliers. After removing these outliers, the
recalculated Q1-Q3 values became smaller and the Fpseudosigma values were reduced to below the
median values (Table 2).
Removing all ICP-OES, XRF, and NAA data from the measured values submitted for
sample 3 influenced interpretations of the submitted data. Therefore, we performed additional
calculations for sample 3 where all the reported values of Ni, Cu, Zn, As, and Pb by ICP-MS
were compared to the median values submitted by ICP-MS. After making these adjustments, the
% differences from the median were -5% to 30% for Ni, -34 to 38% for Cu, -30% to 65% for Zn,
-37% to 9% for As, and -1% to 9% for Pb. While we acknowledge that this is not a standard
method for statistical analyses, the example simply illustrates that after excluding methods other
than ICP-MS, most of the measured values deviated by ±40% from the median values. Similar %
differences were reported for acceptable quality data in recent inter-laboratory comparisons by
Page 24 of 53Environmental Science: Processes & Impacts
123456789101112131415161718192021222324252627282930313233343536373839404142434445464748495051525354555657585960

the USGS (e.g., up to 30% difference for trace metal(loid)s)45. While the high percentage of
outliers in NAA, ICP-OES, or XRF could be attributed to lab protocols for each technique, we
encourage using ICP-MS for measuring trace metals in O&G wastewaters as there is some
evidence to suggest that ICP-MS measurements are accurate to within approximately ±40%.
Analyzing trace metal concentrations in O&G wastewaters requires a dilution factor that
is enough to reduce potential matrix interferences without diluting analytes below their method
detection limits. Results from this inter-laboratory comparison suggest that most labs using ICP-
MS can detect metal(loid)s on the EPAs list of regulated metals in drinking water at
concentrations as low as 1 to 10 times above the primary standards. For instance, labs using ICP-
MS were able to measure Cu, As, and Pb concentrations to within ±40% difference when the
median values for these analytes were 1.5 mg/L, 0.06 mg/L, and 0.2 mg/L, respectively. Many
labs struggled to report values below these concentrations. From a regulatory perspective, the
question then becomes what is the method detection limit and accuracy that is needed for trace
metal determinations in O&G wastewaters and how necessary are these measurements since the
majority of these measurements appear to be below detection limits that are above the standards
set for trace metal concentrations in drinking water. If the goal of trace metal(loid) analyses is to
only identify wastewaters that may have trace concentrations approximately 1 to 100s of times
above the drinking water standard, then simply diluting the wastewaters and analyzing by ICP-
MS methods can result in accurate measurements (to within ±40% from the true value). If there
is a need to measure lower concentrations for regulatory purposes or to understand trace metal
geochemistry, then other methods that use resins or chelating agents to concentrate these metals
are likely required61.
Page 25 of 53 Environmental Science: Processes & Impacts
123456789101112131415161718192021222324252627282930313233343536373839404142434445464748495051525354555657585960

Radium measurements in liquids. Participating labs (n=11) analyzed the O&G
wastewaters for radium activity using a diversity of methods, including gamma ray spectroscopy,
beta particle spectroscopy, Rn emanation counting in a scintillation cell, and alpha particle
spectroscopy. A summary table with each of the methods used is included in the supporting
information (Table S5). Gamma spectroscopy analyses were performed by the majority of the
labs (70%) at geometries consistent with internal standards or certified reference materials. A
common method for gamma spec analyses was to seal the samples in Marinelli beakers or
polypropylene containers for 21 days to allow the ingrowth of 226Ra daughter products (214Pb or
214Bi) that were measured at 295.2 keV, 351.9 keV, or 609.3 keV. In some cases, labs also
analyzed the 226Ra without ingrowth by direct measurements at 186.2 keV. One lab (Lab 7b;
Table S5) also co-precipitated 226Ra from the wastewaters along with a 133Ba tracer to estimate
Ra recoveries prior to analysis by gamma spectroscopy. Complete details of the method were not
reported but similar methods have been reported previously62. This same lab also measured Ra
directly in the samples using gamma spectroscopy (Lab 7a; Table S5).
Table 3. The most probable value (MPV), 25th percentile (Q1), 75th percentile (Q3), and Fpseudosigma (F) for radium activities and isotope ratios in sample 1, 2, and 3. All values are represented in pCi/L except 228Ra/226Ra (dimensionless).
Sample 1 Sample 2 Sample 3Analyte MPV Q1-Q3 F MPV Q1-Q3 F MPV Q1-Q3 F
226Ra 676 513 - 916 299 1420 1170 - 1840 497 526 425 - 659 173228Ra 722 616 - 780 122 1520 1280 - 1630 256 928 765 - 998 173
228Ra/226Ra 0.86 0.75 - 1.39 0.47 0.82 0.74 - 1.45 0.52 1.41 1.32 - 2.17 0.63
Two labs used modified versions of EPA methods to pre-concentrate radium from the
samples before analyses by alpha particle spectroscopy, Rn emanation counting in a scintillation
cell, or beta particle spectroscopy (e.g., EPA Methods 903.0, 903.1, and 904.0, respectively).
One lab added a 225Ra tracer to the samples and then pre-concentrated radium using manganese
oxide (MnO2) and a Diphonix resin. Radioactivity measurements were performed by alpha
Page 26 of 53Environmental Science: Processes & Impacts
123456789101112131415161718192021222324252627282930313233343536373839404142434445464748495051525354555657585960

spectrometry and the 226Ra activity was corrected for chemical yield based on the observed
activity of the alpha peak at 7.07 MeV (217At, a progeny of 225Ra). Complete details of the
method were not provided by the lab but similar methods have been included elsewhere38.
Another lab used co-precipitation methods to remove and concentrate 226Ra from the samples
according to EPA method 903.1. Radium was co-precipitated with barium-sulfate and the
precipitate was then dissolved with ethylenediaminetetraacetic acid (EDTA) and stored for
ingrowth of 222Rn. 222Rn alpha activity measured by scintillation counting was used to determine
the 226Ra activity. These two labs also precipitated 228Ra with barium and lead sulfate according
to EPA method 904.0. Lead sulfate precipitates were re-digested with EDTA and precipitated
with yttrium oxalate, which was then purified, and transferred to a planchet for gas proportional
counting of 228Ac, a daughter of 228Ra. One lab also noted that sub aliquots of the dissolved
precipitate were saved to determine the barium yield and estimate radium recovery from the
sample.
All but one of the participating labs were able to report detectable Ra concentrations in
the three oil and gas wastewaters (Figure 5). The only method that reported below detectable
concentrations was NAA; Ra is not considered a detectable element using NAA. The rest of the
values reported had 226Ra and 228Ra activities that were within the 25th to 75th percentiles for
O&G wastewaters from the Appalachian Basin and were generally of acceptable quality (Table
3; Figure 5); all 226Ra results were considered to be acceptable quality while one 228Ra value was
considered to be questionable quality along with another value that was of unacceptable quality.
Both 228Ra values that were of questionable or unacceptable quality were from gamma ray
spectroscopy methods. Due to the large number of other acceptable quality analyses (n=7) by
gamma ray spectroscopy methods, the unacceptable or questionable Ra measurements do not
Page 27 of 53 Environmental Science: Processes & Impacts
123456789101112131415161718192021222324252627282930313233343536373839404142434445464748495051525354555657585960

appear to be a result of using gamma ray spectroscopy and could instead be attributed to lab
specific methods or other potential sources of bias.
Results from this inter-laboratory comparison suggests that reported Ra activities in O&G
wastewaters could be within ±50% of the MPV (Figure 6). Comparisons of the reported values to
the MPV for radium activity in the three samples suggests that there is likely more inaccuracy in
226Ra measurements than 228Ra measurements, as 226Ra values were approximately ±50% from
the MPV while 228Ra values were approximately ±30% from the MPV. As a comparison, ±20%
accuracy has been estimated for 226Ra in drinking water assessments63. In another study, up to
±60% accuracy for 226Ra and ±20% for 228Ra were reported in seawater samples64.
Figure 5. Data quality for Ra concentrations reported in sample 1, 2, and 3. Acceptable, questionable, and unacceptable quality were based on z-score calculations when the number of values were ≥ 7 for a given analyte.
The differences in 226Ra and 228Ra activities measured by labs also influenced the
Raisotope ratios. The 25th to 75th percentile ratios for 228Ra/226Ra ranged from 0.8 - 1.5 in sample
1, 0.8 - 1.4 in sample 2, and 1.4 - 2.4 in sample 3 (Table 3). As a comparison, 228Ra/226Ra ratios
for all produced waters from the Appalachian Basin can range from 0 to 4 65. These ratios are
often used to fingerprint wastewaters produced from unconventional shale reservoirs compared
to conventional oil and gas reservoirs as the higher 238U (parent isotope for 226Ra) concentrations
in organic-rich shales relative to conventional sandstone formations can result in low 228Ra/226Ra
ratios (e.g., median value for Marcellus Shale is 0.12)58 that are traceable in suspected
contamination events7, 66. None of the wastewaters analyzed in this study were from O&G wells
drilled into the Marcellus Shale, which was also reflective of the higher 228Ra/226Ra ratios (e.g.,
all MPVs greater than 0.9) measured by the participating labs. The range in 228Ra/226Ra ratios
reported by the labs did not influence the ability of this tracer to confirm that the fluids were not
Page 28 of 53Environmental Science: Processes & Impacts
123456789101112131415161718192021222324252627282930313233343536373839404142434445464748495051525354555657585960

from the Marcellus Shale. However, there could be instances where labs that under-reported
226Ra and over-reported 228Ra activities (e.g., Lab 4, Lab 12, and Lab 14) in the three samples
could measure higher 228Ra/226Ra activities in a Marcellus Shale wastewater, which could be
interpreted as fluids from conventional oil and gas reservoirs. This variability in 228Ra/226Ra
ratios and radium activities could have implications for how wastewaters are identified or
managed and it is therefore important to determine why these inaccuracies exist.
There are several factors that could influence the variability in the reported 226Ra
activities including (1) Rn leakage, (2) gamma photon attenuation, or (3) calibration
inconsistencies37, 40-42. Rn diffusion through storage containers and inconsistent preparation
procedures between samples and standards can result in inaccurate measurements of 226Ra
daughter products40. Potential concerns with losses of daughter products can be resolved by
measuring 226Ra directly at 186 keV with gamma ray spectroscopy or at 4.8 MeV using alpha
particle spectroscopy. In this study, reported values by labs using either of these methods were
compared to determine if these indirect or direct counting techniques influenced the 226Ra
activities. However, there was no consistency in the reported Ra activities by labs using either of
these methods. For instance, lab 13 measured 226Ra activities using daughter products and had
average z-scores of -1.24 (-45% from MPV) for the three O&G wastewaters, while lab 3 also
measured 226Ra using daughter products but had average z-scores of 0.67 (24% from MPV). In
other words, both labs used similar methods but values reported by lab 3 were often two times
higher than the values reported by lab 13. Interestingly, labs that measured 226Ra directly also
showed significant variability despite being unaffected by potential biases from Rn leakage.
Among the labs that used direct measurements, average z-scores were -0.5 (-20% from MPV) for
Lab 11 and 14b, 0.2 (~5% from MPV) for lab 3, and 0.9 for Lab 7a (34% from MPV). Because
Page 29 of 53 Environmental Science: Processes & Impacts
123456789101112131415161718192021222324252627282930313233343536373839404142434445464748495051525354555657585960

these z-scores span almost the entire range of calculated values, it does not appear that indirect
vs direct counting methods had a significant influence on the accuracy of the results. However,
an inter-laboratory comparison performed with a greater number of laboratories could examine
this possibility with greater statistical certainty.
Other potential sources of bias could occur by not accounting for photon attenuation in
samples relative to the O&G wastewaters41, 42. Specifically, the attenuation of photons by
solutions with different densities or chemical matrixes relative to standard solutions can result in
negative bias (i.e., under-reporting of Ra activities). While attenuation effects are well known in
the literature, they are often unaccounted for in O&G wastewaters40,41. In the current study, only
one lab (lab 7a) accounted for photon attenuation by using a high-salinity matrix-matched
radium standard to calibrate gamma ray spectroscopy equipment. Additionally, other wet-
chemical methods used by labs 8 and 9 were not affected by attenuation biases since Ra was
separated from solution prior to analysis. When grouped together, these labs (labs 7a, 8, and 9)
consistently reported 226Ra activities that were 20 to 50% higher than the MPV. It is possible that
these labs are closer to the true 226Ra activity of the wastewaters as they are likely unaffected by
attenuation bias or bias from Rn leakage. However, this is uncertain as other methods by lab 3
and lab 7b that were likely influenced by these potential sources of bias also over-reported Ra
activities by >20%.
Figure 6. The % difference of measured Ra activities by individual labs based on comparisons to the MPV. A summarized description of each labs methods is included in Table S5.
Regardless of the source and magnitude of these potential sources of bias, they appear to
have a consistent influence on the Ra activities reported by individual labs in this inter-laboratory
comparison. This is supported by the calculated z-scores for each of the labs which indicated that
if a lab reported high or low activity for one of the samples, they reported high or low activity for
Page 30 of 53Environmental Science: Processes & Impacts
123456789101112131415161718192021222324252627282930313233343536373839404142434445464748495051525354555657585960
all of the samples. For instance, calculated z-scores for lab 13 were -0.9 (-39% from MPV), -1.3
(-44% from MPV), and -1.5 (-52% from MPV) for sample 1, 2, and 3 respectively. In other
words, the similar z-scores for all samples analyzed by individual labs suggests that lab methods
were precise but inaccurate. The precision of the labs are encouraging in suggesting that the
inaccuracies in reported 226Ra activities could be resolved by (1) confirming that the standards
used for calibrating equipment are accurate, (2) ensuring consistent Rn entrapment between
standards and samples, and (3) accounting for potential attenuation differences in standards and
samples. However, future work is needed to identify which of these factors has the most impact
on the reported activities in O&G wastewaters. We recommend that a high salinity solution with
certified Ra activities be developed (e.g., NIST standard) to help alleviate the potential sources
of bias from attenuation. Labs could also correct for potential negative bias from attenuation by
making their own high salinity, matrix matched Ra standards. We also recommend that labs
measuring 226Ra activities in O&G wastewaters by 214Bi or 214Pb should perform simple quality
control metrics such as verifying potential bias from Rn leakages by confirming that
measurements using 186 keV or 352 keV, 609 keV, etc are comparable.
Radium measurements in solids. Most of the labs (9 of 10) measured radioactivity in the solid
samples by gamma spectroscopy. Of these nine labs, eight labs directly measured radioactivity
without chemically separating radium from the solids, i.e. radium activities were directly
measured on the solids as received. One lab did not describe their sample preparation, but stated
that they performed direct measurements using gamma spectroscopy. Because the study was
anonymous, only the sample preparation procedures described when the data was submitted
could be used for data interpretations. Radioactivity was determined in varying geometries that
were often incubated for >21 days prior to analysis, however, only two labs reported performing
Page 31 of 53 Environmental Science: Processes & Impacts
123456789101112131415161718192021222324252627282930313233343536373839404142434445464748495051525354555657585960

a self-attenuation correction based on the Cutshall method or with any other attenuation
method42, 67, 68. 226Ra activity was often determined based on the average of the daughter products
(214Pb at 295.2 keV and 351.9 keV, 214Bi at 609.3 keV) but also directly at 186.2 keV with a
correction factor. 228Ra activity was determined based on its daughter product activity, 228Ac at
911.2 keV or at 463 keV. Detector efficiencies were determined using various standards,
including ores from the Canadian Certified Reference Materials Project (CCRMP) (BL4a ore,
DL1a ore, BL5 ore and Oka2 ore) and other traceable standards (IAEA-385 and NIST 4353a).
One lab did not perform their analysis by gamma spectroscopy. Instead, they digested
0.25 – 0.5 grams of solid using nitric acid, hydrogen peroxide, and hydrochloric acid according
to EPA Method 3050B. Thereafter, 228Ra was pre-concentrated with barium/lead sulfate and then
purified by precipitation from EDTA solution. After an ingrowth period for 228Ac from 228Ra,
yttrium oxalate carried 228Ac, which was then purified, and measured for beta activity using a
gas-flow proportional counting system according to EPA Method 904.0. Likewise, 226Ra was
pre-concentrated with barium sulfate, sealed for 222Rn ingrowth, after which the 222Rn alpha
activity was determined using alpha spectrometry (EPA method 903.1). A summary table with
each of the methods used for determining the radium activities in the solids is included in the
supporting information (Table S6).
Table 4. The most probable value (MPV), 25th percentile (Q1), 75th percentile (Q3), and Fpseudosigma (F) for Ra activities and isotope ratios in solid samples 1, 2, 3, and 4. All values are represented as pCi/gram except 228Ra/226Ra (dimensionless).
Solid Sample Analyte MPV Q1-Q3 F226Ra 1.82 1.67-1.97 0.22228Ra 1.04 0.97-1.19 0.16SS1
228Ra/226Ra 0.59 0.53-0.66 0.09226Ra 10.3 10.2-11.8 1.21228Ra 0.55 0.50-0.65 0.10SS2
228Ra/226Ra 0.05 0.05-0.06 0.01
Page 32 of 53Environmental Science: Processes & Impacts
123456789101112131415161718192021222324252627282930313233343536373839404142434445464748495051525354555657585960

226Ra 6.50 6.20-7.22 0.75228Ra 1.18 1.16-1.31 0.11SS3
228Ra/226Ra 0.19 0.16-0.21 0.04226Ra 3.00 2.95-3.36 0.30228Ra 1.09 1.03-1.25 0.17SS4
228Ra/226Ra 0.36 0.33-0.40 0.05
All labs reported measurable activities of 226Ra and 228Ra in the solid samples (Table 4)
that were generally of acceptable quality (Figure 7). Ra data quality was comparable to a
previous inter-laboratory comparison performed by the International Atomic Energy Agency
(IAEA) on a sea sediment69. In our study, 14% (6 of 44) of the reported 226Ra values were
questionable or unacceptable which compares well to 18% from the IAEA study; while 25% (11
of 44) of the reported 228Ra values were questionable or unacceptable, compared to 56.5% from
the IAEA study69.
Figure 7. Data quality for Ra activities reported in solid samples 1, 2, 3, and 4. Acceptable, questionable, and unacceptable designations were based on z-score calculations when the number of values were ≥ 7 for a given analyte.
All 226Ra activities that were questionable or unacceptable were determined by gamma
spectroscopy methods; three of these analyses were performed with 2 hours of counting time
(and two of these analyses were performed in an unknown geometry), while the other three
analyses were counted for over 16 hours. It is likely that these questionable or unacceptable
measurements were because of lab specific methods (i.e., sample prep, counting time, and
efficiency calibration), and not because of the use of gamma spectroscopy. For 228Ra, eight of the
eleven questionable or unacceptable data were determined by gamma spectroscopy. The other
three were determined by beta counting after chemical separation. Amongst the questionable or
unacceptable data determined by gamma spectroscopy, six analyses were likely performed after
short counting times (< 24 hours).
Page 33 of 53 Environmental Science: Processes & Impacts
123456789101112131415161718192021222324252627282930313233343536373839404142434445464748495051525354555657585960

The results from this inter-laboratory comparison suggest that the reported Raactivities of
O&G impacted solids could be within ±20% from the MPV (Figure 8). Variations in the reported
Ra measurements in the solid could be attributed to a number of factors, including (1) sample
geometry (fill height), (2) unintentional differences in Rn sealing between samples and
standards, (3) insufficient counting time, and (4) sample attenuation42, 68, 70. All the reported
226Ra activities in SS1 and SS3 were of acceptable or questionable quality. SS1 had the lowest
activity, while SS2 had the highest activity. Yet SS2 and SS4 both had reported values that were
unacceptable. There was therefore no reason to believe that the quality of the data was influenced
by the activity of the samples. Furthermore, the densities and matrix/chemical composition of
these solids were different, yet analysis of the z-scores showed no systematic influence on the
reported activities by sample type. Some labs over-estimated the radium activities in one solid
sample, but under-estimated it in another sample. As such, it was difficult to conclude if the
questionable or unaccepted data were solely due to density and matrix differences. However,
large % differences in the reported activities by labs that did not account for density or potential
matrix differences with attenuation corrections suggests that this was likely still an issue.
As with gamma spectroscopy measurements of liquid samples, another potential cause of
discrepancy could be whether Ra activity was determined directly at 186 keV, or indirectly from
the daughter products (214Pb or 214Bi). Direct measurement at 186 keV can result in erroneous
data, if there is U in the sample, as the gamma decay of 235U (185.7 keV) interferes with 226Ra
measurements at 186.2 keV. An interference correction must be performed if this is the case. If
the daughter products are used instead, then improper sealing of counting vessels will lead to
escape of Rn gas, which will result in inaccurate measurements of 226Ra decay products37.
Figure 8. Range in the % difference of reported radium activities with acceptable quality based on comparisons to the MPV.
Page 34 of 53Environmental Science: Processes & Impacts
123456789101112131415161718192021222324252627282930313233343536373839404142434445464748495051525354555657585960

Alpha spectrometry following chemical separation of Ra produced data of acceptable
quality for 226Ra; however, 3 out of 4 measurements for 228Ra using beta particle counting were
of unacceptable quality. This suggested that beta counting by the gas-flow proportional counting
system following chemical separation was not a reliable method for determining the 228Ra
activities of the solids.
Close inspection of the z-scores allows us to identify methods and labs that produced data
of consistently high quality. These labs reported values with low z-scores, indicating that the
measured activities were likely accurate, and none of the reported values were rejected across the
four solids samples. We were able to identify that for reliable Ra measurements, gamma
spectroscopy produced the most accurate results. In addition to this, labs that used ores from the
CCRMP reported values that were acceptable quality. The labs,lab 3 and lab 7, that also
accounted for attenuation using a point-source correctionby the Cutshall technique, produced the
highest quality data. When these methods were used, the reported Ra activities were often within
< ±5 % of the MPV. We therefore recommend gamma spectroscopy methods that incorporate
certified Ra standards, such as the ores from CCRMP, and account for the self-attenuation in
solid samples that result from density and matrix differences between the calibration standard
and the unknown sample. Furthermore, we recommend longer counting times for samples with
activities close to environmental background (> 24 hours), and a close attention to the sample
preparation concerning the geometry, fill height and Rn gas entrapment.
Limitations of the inter-laboratory comparison
There were several limitations of the current study that the authors would like to
acknowledge. First, none of the labs were required to analyze samples multiple times. Therefore,
there was no way to adequately assess how precise individual labs were in analyzing the O&G
Page 35 of 53 Environmental Science: Processes & Impacts
123456789101112131415161718192021222324252627282930313233343536373839404142434445464748495051525354555657585960

wastewaters. We also explored several methods for analyzing the precision of the data; however,
these methods are heavily dependent on how outliers are excluded from the data. Therefore, we
relied on comparisons to the median (i.e., most probable value) to show how much agreement
there was among the reported values. Using the median as the MPV could influence our
interpretations of the accuracy of these measurements, however, this is a viable statistical method
that is a commonly used in inter-laboratory studies45. Testing the accuracy of each lab’s
measurements could be resolved by requiring all labs to analyze certified standards for the
analytes in this study but the availability and cost of these standards prevented this comparison.
A well characterized check standard from the Spring 2018 USGS inter-laboratory study 70 was
sent to participating labs for cation and anion analyses. However, not all of the labs analyzed the
sample. Because most labs did not report concentrations for the USGS sample, results for these
reference materials were not used to assess the accuracy of the labs. Another limitation of the
study was that statistical comparisons between various methods were not possible due to the
majority of labs performing one method of analysis. In some cases there were also not enough
reported values to determine the accuracy of the measurements (e.g., most of the trace
metal(loid)s) using the MPV method. Other potential factors that could influence the results,
such as dilution errors, were not explored but could be resolved by spiking internal standards into
all samples sent out for inter-laboratory comparisons and requiring labs to measure analytes
within the standard. Regardless of these limitations, there was relatively good agreement among
the reported values and we were able to comment on the accuracy of many of the methods used
for analyzing solid and liquid wastes from O&G development.
Page 36 of 53Environmental Science: Processes & Impacts
123456789101112131415161718192021222324252627282930313233343536373839404142434445464748495051525354555657585960
Conclusions and recommendations
Major cations, minor cations, and anions. The majority of laboratories that participated
in this study reported values for major and minor cations and anions in the O&G wastewaters
that were in good agreement with the MPVs. Accuracies for these cations and anions were
similar to other inter-laboratory comparisons analyzing freshwaters. Depending on the detection
limits of the analytical equipment, we recommend diluting samples approximately 10-1,000
times before analysis on an ICP-OES, ICP-MS, or IC, and using internal standards to correct for
potential matrix interferences along with check standards to verify calibration curves. Combined
major and minor cation and anion chemistry data supports the use of Sr/Ca and B/Cl ratios for
tracing O&G wastewaters. However, the range in reported Cl/Br values in this inter-laboratory
comparison indicate that geochemical interpretations using this ratio could have uncertainty and
should be acknowledged when using data sets with Cl/Br ratios from multiple laboratories.
Trace metal(loid) measurements. In contrast to the major and minor cations, few
reliable values were reported for trace metal(loid)s. The number of reported values were also
limited by high method detection limits relative to the trace metal(loid) concentrations in the
wastewaters. Reporting limits for trace metal(loid)s were often above or near drinking water
standards, which could lead to difficulties regulating high salinity oil and gas wastewaters based
on trace metal concentrations.
Radium measurements in liquids. The majority of laboratories were able to report
values for Ra activities in high salinity brines, but values showed greater variability between
laboratories than major and minor cations or anions. Compared to previous inter-laboratory
studies of naturally occurring radioactivity in seawater and freshwater, the accuracy of reported
values in this study were very similar, demonstrating that many participating laboratories using a
Page 37 of 53 Environmental Science: Processes & Impacts
123456789101112131415161718192021222324252627282930313233343536373839404142434445464748495051525354555657585960

variety of methods for O&G wastewater analyses can produce acceptable quality data. However,
the range in values reported also suggests that individual laboratories are over-reporting or
under-reporting Ra activities by ±50% likely due to calibration inconsistencies among labs,
radon leakage, or self-attenuation. We recommend that a high salinity brine Ra standard be
developed to help eliminate these sources of bias.
Radium measurements in solids. Ra analyses of solid samples were more accurate than
liquid measurements, deviating by ±20% from the MPV but had less consistency in the %
differences reported by individual labs; i.e., labs over-estimated the Ra activities in one sample,
but under-estimated it in other samples. Some of this variability could be minimized by longer
counting times for samples with activities close to environmental background (> 24 hours),
correcting for gamma attenuation, and paying close attention to sample preparation procedures
(e.g., geometry, fill height, and radon gas entrapment).
Acknowledgments
The authors would also like to thank the ALS Life Sciences division in Fort Collins, CO and
Geochemical Testing in Somerset, PA for participating in this inter-laboratory comparison. All
authors participated equally in the measurements for this inter-laboratory study. Author order is
based on contributions to data processing, experimental design, and manuscript preparation.
Author disclosure statement
There are no competing financial interests.
Page 38 of 53Environmental Science: Processes & Impacts
123456789101112131415161718192021222324252627282930313233343536373839404142434445464748495051525354555657585960
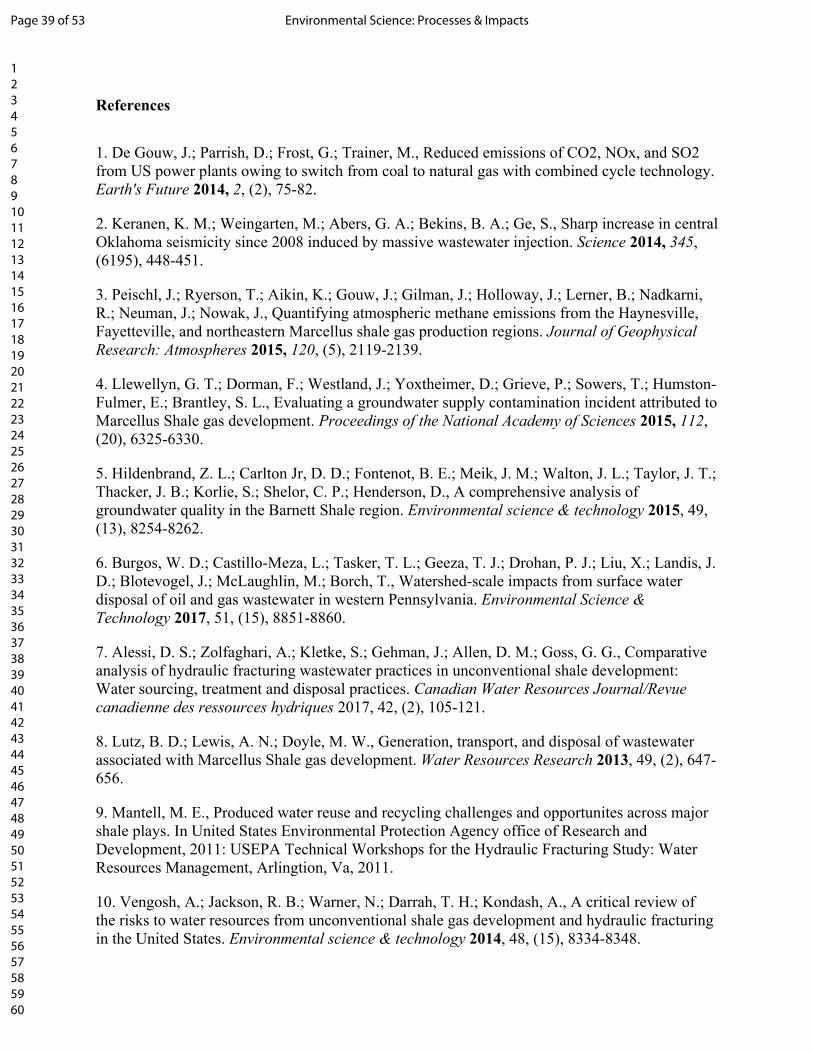
References
1. De Gouw, J.; Parrish, D.; Frost, G.; Trainer, M., Reduced emissions of CO2, NOx, and SO2 from US power plants owing to switch from coal to natural gas with combined cycle technology. Earth's Future 2014, 2, (2), 75-82.
2. Keranen, K. M.; Weingarten, M.; Abers, G. A.; Bekins, B. A.; Ge, S., Sharp increase in central Oklahoma seismicity since 2008 induced by massive wastewater injection. Science 2014, 345, (6195), 448-451.
3. Peischl, J.; Ryerson, T.; Aikin, K.; Gouw, J.; Gilman, J.; Holloway, J.; Lerner, B.; Nadkarni, R.; Neuman, J.; Nowak, J., Quantifying atmospheric methane emissions from the Haynesville, Fayetteville, and northeastern Marcellus shale gas production regions. Journal of Geophysical Research: Atmospheres 2015, 120, (5), 2119-2139.
4. Llewellyn, G. T.; Dorman, F.; Westland, J.; Yoxtheimer, D.; Grieve, P.; Sowers, T.; Humston-Fulmer, E.; Brantley, S. L., Evaluating a groundwater supply contamination incident attributed to Marcellus Shale gas development. Proceedings of the National Academy of Sciences 2015, 112, (20), 6325-6330.
5. Hildenbrand, Z. L.; Carlton Jr, D. D.; Fontenot, B. E.; Meik, J. M.; Walton, J. L.; Taylor, J. T.; Thacker, J. B.; Korlie, S.; Shelor, C. P.; Henderson, D., A comprehensive analysis of groundwater quality in the Barnett Shale region. Environmental science & technology 2015, 49, (13), 8254-8262.
6. Burgos, W. D.; Castillo-Meza, L.; Tasker, T. L.; Geeza, T. J.; Drohan, P. J.; Liu, X.; Landis, J. D.; Blotevogel, J.; McLaughlin, M.; Borch, T., Watershed-scale impacts from surface water disposal of oil and gas wastewater in western Pennsylvania. Environmental Science & Technology 2017, 51, (15), 8851-8860.
7. Alessi, D. S.; Zolfaghari, A.; Kletke, S.; Gehman, J.; Allen, D. M.; Goss, G. G., Comparative analysis of hydraulic fracturing wastewater practices in unconventional shale development: Water sourcing, treatment and disposal practices. Canadian Water Resources Journal/Revue canadienne des ressources hydriques 2017, 42, (2), 105-121.
8. Lutz, B. D.; Lewis, A. N.; Doyle, M. W., Generation, transport, and disposal of wastewater associated with Marcellus Shale gas development. Water Resources Research 2013, 49, (2), 647-656.
9. Mantell, M. E., Produced water reuse and recycling challenges and opportunites across major shale plays. In United States Environmental Protection Agency office of Research and Development, 2011: USEPA Technical Workshops for the Hydraulic Fracturing Study: Water Resources Management, Arlingtion, Va, 2011.
10. Vengosh, A.; Jackson, R. B.; Warner, N.; Darrah, T. H.; Kondash, A., A critical review of the risks to water resources from unconventional shale gas development and hydraulic fracturing in the United States. Environmental science & technology 2014, 48, (15), 8334-8348.
Page 39 of 53 Environmental Science: Processes & Impacts
123456789101112131415161718192021222324252627282930313233343536373839404142434445464748495051525354555657585960

11. Shaffer, D. L.; Arias Chavez, L. H.; Ben-Sasson, M.; Romero-Vargas Castrillón, S.; Yip, N. Y.; Elimelech, M., Desalination and reuse of high-salinity shale gas produced water: drivers, technologies, and future directions. Environmental science & technology 2013, 47, (17), 9569-9583.
12. Pichtel, J., Oil and gas production wastewater: Soil contamination and pollution prevention. Applied and environmental soil science 2016, 2016.
13. Clark, C.; Veil, J. Produced water volumes and management practices in the United States. United States Department of Energy, Argonne National Laboratory: Argonne, IL, 2009.
14. Tasker, T.; Burgos, W.; Piotrowski, P.; Castillo-Meza, L.; Blewett, T.; Ganow, K.; Stallworth, A.; Delompré, P.; Goss, G.; Fowler, L., Environmental and Human Health Impacts of Spreading Oil and Gas Wastewater on Roads. Environmental science & technology 2018, 52, (12), 7081-7091.
15. Echchelh, A.; Hess, T.; Sakrabani, R., Reusing oil and gas produced water for irrigation of food crops in drylands. Agricultural Water Management 2018, 206, 124-134.
16. Hladik, M. L.; Focazio, M. J.; Engle, M., Discharges of produced waters from oil and gas extraction via wastewater treatment plants are sources of disinfection by-products to receiving streams. Science of the Total Environment 2014, 466, 1085-1093.
17. Skalak, K. J.; Engle, M. A.; Rowan, E. L.; Jolly, G. D.; Conko, K. M.; Benthem, A. J.; Kraemer, T. F., Surface disposal of produced waters in western and southwestern Pennsylvania: Potential for accumulation of alkali-earth elements in sediments. International Journal of Coal Geology 2014, 126, 162-170.
18. Lauer, N. E.; Warner, N. R.; Vengosh, A., Sources of Radium Accumulation in Stream Sediments near Disposal Sites in Pennsylvania: Implications for Disposal of Conventional Oil and Gas Wastewater. Environmental science & technology 2018, 52, (3), 955-962.
19. Kassotis, C. D.; Tillitt, D. E.; Davis, J. W.; Hormann, A. M.; Nagel, S. C., Estrogen and androgen receptor activities of hydraulic fracturing chemicals and surface and ground water in a drilling-dense region. Endocrinology 2014, 155, (3), 897-907.
20. Elliott, E. G.; Ettinger, A. S.; Leaderer, B. P.; Bracken, M. B.; Deziel, N. C., A systematic evaluation of chemicals in hydraulic-fracturing fluids and wastewater for reproductive and developmental toxicity. Journal of Exposure Science and Environmental Epidemiology 2017, 27, (1), 90.
21. Shih, J.-S.; Saiers, J. E.; Anisfeld, S. C.; Chu, Z.; Muehlenbachs, L. A.; Olmstead, S. M., Characterization and analysis of liquid waste from Marcellus Shale gas development. Environmental science & technology 2015, 49, (16), 9557-9565.
22. Kolesar Kohl, C. A.; Capo, R. C.; Stewart, B. W.; Wall, A. J.; Schroeder, K. T.; Hammack, R. W.; Guthrie, G. D., Strontium isotopes test long-term zonal isolation of injected and
Page 40 of 53Environmental Science: Processes & Impacts
123456789101112131415161718192021222324252627282930313233343536373839404142434445464748495051525354555657585960
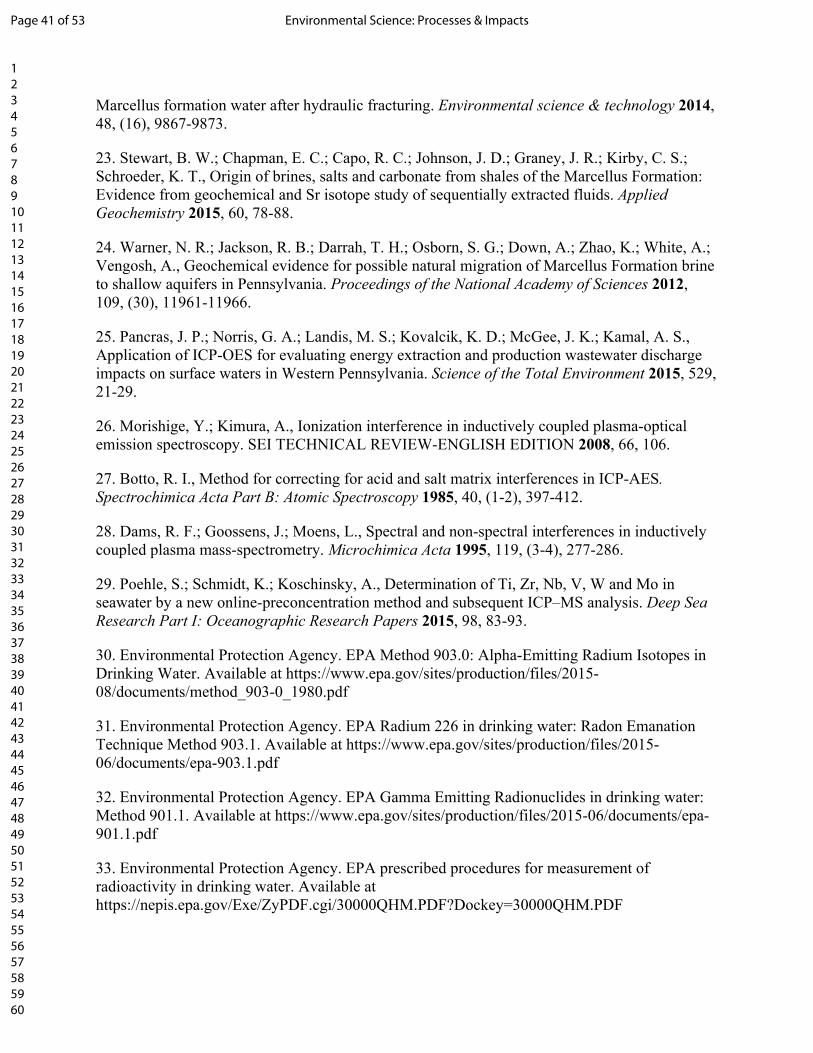
Marcellus formation water after hydraulic fracturing. Environmental science & technology 2014, 48, (16), 9867-9873.
23. Stewart, B. W.; Chapman, E. C.; Capo, R. C.; Johnson, J. D.; Graney, J. R.; Kirby, C. S.; Schroeder, K. T., Origin of brines, salts and carbonate from shales of the Marcellus Formation: Evidence from geochemical and Sr isotope study of sequentially extracted fluids. Applied Geochemistry 2015, 60, 78-88.
24. Warner, N. R.; Jackson, R. B.; Darrah, T. H.; Osborn, S. G.; Down, A.; Zhao, K.; White, A.; Vengosh, A., Geochemical evidence for possible natural migration of Marcellus Formation brine to shallow aquifers in Pennsylvania. Proceedings of the National Academy of Sciences 2012, 109, (30), 11961-11966.
25. Pancras, J. P.; Norris, G. A.; Landis, M. S.; Kovalcik, K. D.; McGee, J. K.; Kamal, A. S., Application of ICP-OES for evaluating energy extraction and production wastewater discharge impacts on surface waters in Western Pennsylvania. Science of the Total Environment 2015, 529, 21-29.
26. Morishige, Y.; Kimura, A., Ionization interference in inductively coupled plasma-optical emission spectroscopy. SEI TECHNICAL REVIEW-ENGLISH EDITION 2008, 66, 106.
27. Botto, R. I., Method for correcting for acid and salt matrix interferences in ICP-AES. Spectrochimica Acta Part B: Atomic Spectroscopy 1985, 40, (1-2), 397-412.
28. Dams, R. F.; Goossens, J.; Moens, L., Spectral and non-spectral interferences in inductively coupled plasma mass-spectrometry. Microchimica Acta 1995, 119, (3-4), 277-286.
29. Poehle, S.; Schmidt, K.; Koschinsky, A., Determination of Ti, Zr, Nb, V, W and Mo in seawater by a new online-preconcentration method and subsequent ICP–MS analysis. Deep Sea Research Part I: Oceanographic Research Papers 2015, 98, 83-93.
30. Environmental Protection Agency. EPA Method 903.0: Alpha-Emitting Radium Isotopes in Drinking Water. Available at https://www.epa.gov/sites/production/files/2015-08/documents/method_903-0_1980.pdf
31. Environmental Protection Agency. EPA Radium 226 in drinking water: Radon Emanation Technique Method 903.1. Available at https://www.epa.gov/sites/production/files/2015-06/documents/epa-903.1.pdf
32. Environmental Protection Agency. EPA Gamma Emitting Radionuclides in drinking water: Method 901.1. Available at https://www.epa.gov/sites/production/files/2015-06/documents/epa-901.1.pdf
33. Environmental Protection Agency. EPA prescribed procedures for measurement of radioactivity in drinking water. Available at https://nepis.epa.gov/Exe/ZyPDF.cgi/30000QHM.PDF?Dockey=30000QHM.PDF
Page 41 of 53 Environmental Science: Processes & Impacts
123456789101112131415161718192021222324252627282930313233343536373839404142434445464748495051525354555657585960

34. Zhang, T.; Bain, D.; Hammack, R.; Vidic, R. D., Analysis of radium-226 in high salinity wastewater from unconventional gas extraction by inductively coupled plasma-mass spectrometry. Environmental Science & Technology 2015, 49, (5), 2969-2976.
35. Jia, G.; Jia, J., Determination of radium isotopes in environmental samples by gamma spectrometry, liquid scintillation counting and alpha spectrometry: a review of analytical methodology. Journal of environmental radioactivity 2012, 106, 98-119.
36. Nelson, A. W.; May, D.; Knight, A. W.; Eitrheim, E. S.; Mehrhoff, M.; Shannon, R.; Litman, R.; Schultz, M. K., Matrix complications in the determination of radium levels in hydraulic fracturing flowback water from Marcellus Shale. Environmental Science & Technology Letters 2014, 1, (3), 204-208.
37. Purkl, S.; Eisenhauer, A., A rapid method for α-spectrometric analysis of radium isotopes in natural waters using ion-selective membrane technology. Applied radiation and isotopes 2003, 59, (4), 245-254.
38. Diab, H. M.; Abdellah, W. M., Validation of 226Ra and 228Ra measurements in water samples using gamma spectrometric analysis. Journal of Water Resource and Protection 2013, 5, (08), 53.
39. Rovenská, K.; Jiránek, M., Radon diffusion coefficient measurement in waterproofings–A review of methods and an analysis of differences in results. Applied Radiation and Isotopes 2012, 70, (4), 802-807.
40. Jodłowski, P., Self-absorption correction in gamma-ray spectrometry of environmental samples-an overview of methods and correction values obtained for the selected geometries. Nukleonika 2006, 51, 21-25.
41. Robu, E.; Giovani, C., Gamma-ray self-attenuation corrections in environmental samples. Romanian Reports in Physics 2009, 61, (2), 295-300.
42. Semkow, T. M.; Mehmood, G.; Parekh, P. P.; Virgil, M., Coincidence summing in gamma-ray spectroscopy. Nuclear Instruments and Methods in Physics Research Section A: Accelerators, Spectrometers, Detectors and Associated Equipment 1990, 290, (2-3), 437-444.
43. Hoaglin, D. C.; Mosteller, F.; Tukey, J. W., Understanding robust and exploratory data anlysis. Wiley Series in Probability and Mathematical Statistics, New York: Wiley, 1983, edited by Hoaglin, David C.; Mosteller, Frederick; Tukey, John W. 1983.
44. United States Geological Survey. Inter-laboratory comparison study results: Spring 2018. Available at https://bqs.usgs.gov/srs_study/reports/index.php (2018).
45. Environmental Protection Agency. EPA Method 200.7: Determination of Metals and Trace Elements in water and wastes by Inductively Coupled Plasma-Atomic Emission Spectrometry. Availabe at https://www.epa.gov/sites/production/files/2015-08/documents/method_200-7_rev_4-4_1994.pdf
Page 42 of 53Environmental Science: Processes & Impacts
123456789101112131415161718192021222324252627282930313233343536373839404142434445464748495051525354555657585960

46. National Institute of standards and technology. Certificate of analysis for standard reference material 2711. Available at https://clu-in.org/conf/tio/xrf_082808/cd/NIST-Standard-Reference-Materials/NIST_SRM_2711.pdf (2018).
47. Epstein, M. S.; Diamondstone, B. I.; Gills, T. E., A new river sediment standard reference material. Talanta 1989, 36, (1-2), 141-150.
48. Blondes, MS.; Gans, KD.; Thordsen, JJ.; Reidy, ME.; Thomas, B.; Engle, MA.; Kharaka, YK.; Rowan, EL. US Geological Survey National Produced Waters Geochemical Database v2.3 (PROVISIONAL). United States Geological Survey. Available at https://energy.usgs.gov/EnvironmentalAspects/EnvironmentalAspectsofEnergyProductionandUse/ProducedWaters.aspx (2014).
49. Knoll, G. F., Radiation detection and measurement. John Wiley & Sons: 2010.
50. Harris, D. C., Quantitative chemical analysis. Macmillan: 2010.
51. Novič, M.; Lečnik, B.; Hudnik, V.; Pihlar, B., Carbonate interferences by ion chromatographic determination of anions in mineral waters. Journal of Chromatography A 1997, 764, (2), 249-256.
52. Environmental Protection Agency. EPA Consent agreement for Pennsylvania Brine Treatment. Available at https://www.epa.gov/sites/production/files/2015-06/documents/pennsylvania_cafo.pdf (2018).
53. Good, K. D.; VanBriesen, J. M., Power Plant Bromide Discharges and Downstream Drinking Water Systems in Pennsylvania. Environmental Science & Technology 2017, 51, (20), 11829-11838.
54. Johnson, B. M.; Kanagy, L. E.; Rodgers, J. H.; Castle, J. W., Chemical, physical, and risk characterization of natural gas storage produced waters. Water, air, and soil pollution 2008, 191, (1-4), 33-54.
55. Dresel, P. E.; Rose, A. W., Chemistry and origin of oil and gas well brines in western Pennsylvania. Open-File Report OFOG 2010, 10, (01.00).
56. Barbot, E.; Vidic, N. S.; Gregory, K. B.; Vidic, R. D., Spatial and temporal correlation of water quality parameters of produced waters from Devonian-age shale following hydraulic fracturing. Environmental science & technology 2013, 47, (6), 2562-2569.
57. Rowan, E. L.; Engle, M. A.; Kraemer, T. F.; Schroeder, K. T.; Hammack, R. W.; Doughten, M. W., Geochemical and isotopic evolution of water produced from Middle Devonian Marcellus shale gas wells, Appalachian basin, Pennsylvania. Aapg Bulletin 2015, 99, (2), 181-206.
58. Miller, J.; Miller, J. C., Statistics and chemometrics for analytical chemistry. Pearson Education: 2018.
Page 43 of 53 Environmental Science: Processes & Impacts
123456789101112131415161718192021222324252627282930313233343536373839404142434445464748495051525354555657585960

59. Sohrin, Y.; Urushihara, S.; Nakatsuka, S.; Kono, T.; Higo, E.; Minami, T.; Norisuye, K.; Umetani, S., Multielemental determination of GEOTRACES key trace metals in seawater by ICPMS after preconcentration using an ethylenediaminetriacetic acid chelating resin. Analytical Chemistry 2008, 80, (16), 6267-6273.
60. Jackson, S. L.; Spence, J.; Janssen, D. J.; Ross, A.; Cullen, J., Determination of Mn, Fe, Ni, Cu, Zn, Cd and Pb in seawater using offline extraction and triple quadrupole ICP-MS/MS. Journal of analytical atomic spectrometry 2018, 33, (2), 304-313.
61. Szabo, Z.; Vincent, T.; Fischer, J. M.; Kraemer, T. F.; Jacobsen, E., Occurrence and geochemistry of radium in water from principal drinking-water aquifer systems of the United States. Applied geochemistry 2012, 27, (3), 729-752.
62. Eaton, A.; Cha, Y.; Geddes, L.; Morley, K. M., Evaluation of variability in radionuclide measurements in drinking water. Journal‐American Water Works Association 2011, 103, (5), 119-134.
63. Charette, M. A.; Dulaiova, H.; Gonneea, M. E.; Henderson, P. B.; Moore, W. S.; Scholten, J. C.; Pham, M. K., GEOTRACES radium isotopes interlaboratory comparison experiment. Limnology and Oceanography: Methods 2012, 10, (6), 451-463.
64. Rowan, E.; Engle, M.; Kirby, C.; Kraemer, T., Radium content of oil-and gas-field produced waters in the Northern Appalachian Basin (USA): Summary and discussion of data. US Geological Survey Scientific Investigations Report 2011, 5135, (2011), 31.
65. Warner, N. R.; Kresse, T. M.; Hays, P. D.; Down, A.; Karr, J. D.; Jackson, R. B.; Vengosh, A., Geochemical and isotopic variations in shallow groundwater in areas of the Fayetteville Shale development, north-central Arkansas. Applied Geochemistry 2013, 35, 207-220.
66. Fares, S., Measurements of natural radioactivity level in black sand and sediment samples of the Temsah Lake beach in Suez Canal region in Egypt. Journal of Radiation Research and Applied Sciences 2017, 10, (3), 194-203.
67. Cutshall, N. H.; Larsen, I. L.; Olsen, C. R., Direct analysis of 210Pb in sediment samples: self-absorption corrections. Nuclear Instruments and Methods in Physics Research 1983, 206, (1-2), 309-312.
68. IAES. Report on worldwide intercomparisons exercise IAES-385: Radionuclides in Irish Sea Sediment. Available at https://nucleus.iaea.org/rpst/Documents/IAEA_AL_151.pdf.69. Bolivar, J.; Garcia-Leon, M.; Garcia-Tenorio, R., On self-attenuation corrections in gamma-ray spectrometry. Applied radiation and isotopes 1997, 48, (8), 1125-1126.
70. USGS. Inter-laboratory comparison study results. Available at https://bqs.usgs.gov/srs_study/reports/index.php
Page 44 of 53Environmental Science: Processes & Impacts
123456789101112131415161718192021222324252627282930313233343536373839404142434445464748495051525354555657585960

Figure 1. Data quality for major cation, minor cation, and anion concentrations reported in sample 1, 2, and 3. Acceptable, questionable, and unacceptable quality were based on z-score calculations when the number of values were ≥ 7 for a given analyte. When 5 or 6 values were reported, no z score was calculated but is noted with an asterisk as a MPV and Fpseudosigma were still calculated (i.e., Table 1). When less than 5
values were reported, no statistics were calculated.
158x110mm (96 x 96 DPI)
Page 45 of 53 Environmental Science: Processes & Impacts
123456789101112131415161718192021222324252627282930313233343536373839404142434445464748495051525354555657585960

Figure 2. Range in accuracy of reported values with acceptable quality for major cation, minor cation, and trace cation concentrations based on comparisons to the MPV. Values with a z score that was between -2
and 2 were considered of acceptable quality. No accuracy calculations were performed for SO4 or Al due to the low number of detectable values and are represented as not calculable (n.c.).
129x110mm (192 x 192 DPI)
Page 46 of 53Environmental Science: Processes & Impacts
123456789101112131415161718192021222324252627282930313233343536373839404142434445464748495051525354555657585960

Figure 3. Data quality for trace metal(loid) concentrations reported in sample 1, 2, and 3. Acceptable, questionable, and unacceptable designations were based on z-score calculations when the number of
reported values was ≥ 7 for a given analyte. When 5 or 6 values were reported, no z score was calculated but is noted with an asterisk as a MPV and Fpseudosigma were still calculated (Table 2). When less than 5
values were reported, no statistics were calculated.
95x98mm (192 x 192 DPI)
Page 47 of 53 Environmental Science: Processes & Impacts
123456789101112131415161718192021222324252627282930313233343536373839404142434445464748495051525354555657585960

Figure 4. Range in accuracy of reported values with acceptable quality for trace metal(loid)s based on comparisons to the MPV. No accuracy calculations were performed for sample 1 due to the low number of
detectable concentrations. Other metal(loid)s where statistics were not calculable (n.c.) due to the low number of detectable values (n < 7) are shown for sample 2 and 3.
82x81mm (192 x 192 DPI)
Page 48 of 53Environmental Science: Processes & Impacts
123456789101112131415161718192021222324252627282930313233343536373839404142434445464748495051525354555657585960
Figure 5. Data quality for Ra concentrations reported in sample 1, 2, and 3. Acceptable, questionable, and unacceptable quality were based on z-score calculations when the number of values were ≥ 7 for a given
analyte.
80x110mm (192 x 192 DPI)
Page 49 of 53 Environmental Science: Processes & Impacts
123456789101112131415161718192021222324252627282930313233343536373839404142434445464748495051525354555657585960

Figure 6. The % difference of measured Ra activities by individual labs based on comparisons to the MPV. A summarized description of each labs methods is included in Table S5.
154x118mm (192 x 192 DPI)
Page 50 of 53Environmental Science: Processes & Impacts
123456789101112131415161718192021222324252627282930313233343536373839404142434445464748495051525354555657585960
Figure 7. Data quality for Ra activities reported in solid samples 1, 2, 3, and 4. Acceptable, questionable, and unacceptable designations were based on z-score calculations when the number of values were ≥ 7 for
a given analyte.
85x110mm (192 x 192 DPI)
Page 51 of 53 Environmental Science: Processes & Impacts
123456789101112131415161718192021222324252627282930313233343536373839404142434445464748495051525354555657585960

Figure 8. Range in the % difference of reported Ra activities with acceptable quality based on comparisons to the MPV.
157x134mm (192 x 192 DPI)
Page 52 of 53Environmental Science: Processes & Impacts
123456789101112131415161718192021222324252627282930313233343536373839404142434445464748495051525354555657585960

TOC art
254x142mm (72 x 72 DPI)
Page 53 of 53 Environmental Science: Processes & Impacts
123456789101112131415161718192021222324252627282930313233343536373839404142434445464748495051525354555657585960