accounts ppt (final)
TRANSCRIPT

8/7/2019 Accounts ppt (final)
http://slidepdf.com/reader/full/accounts-ppt-final 1/30

8/7/2019 Accounts ppt (final)
http://slidepdf.com/reader/full/accounts-ppt-final 2/30
In relation toSALES
In relation toINVESTMENT
1. Gross Profit Ratio2. Operating Expense ratio
3. Operating profit ratio
4. Net Profit ratio
1. Return on Investment2. Return on capital employed
3. Return on shareholders fund
4. Return on Total Assets

8/7/2019 Accounts ppt (final)
http://slidepdf.com/reader/full/accounts-ppt-final 3/30
Mar 2010 Mar 2009 Mar 2008 Mar 2007 Mar 2006
Gross ProfitRatio 31.36 33.69 37.7 39.84 38.81
Operating
Expense ratio 64.6 62.46 58.24 60.6 61.13
Operating Profit
ratio 35.7 37.68 41.94 39.61 38.88
Net Profit Ratio 19.96 21.09 23.43 23.53 22.78
8/7/2019 Accounts ppt (final)
http://slidepdf.com/reader/full/accounts-ppt-final 4/30
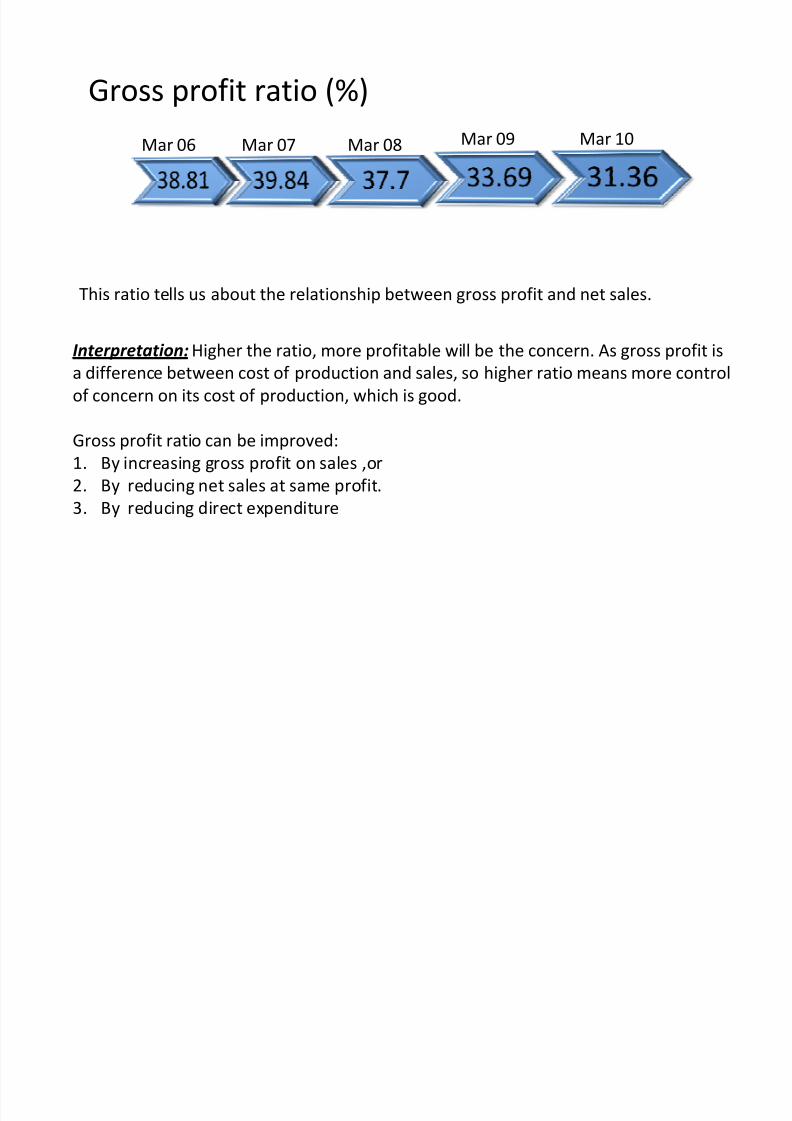
Gross profit ratio (%)
This ratio tells us about the relationship between gross profit and net sales.
Interpretation:Higher the ratio, more profitable will be the concern. As gross profit is
a difference between cost of production and sales, so higher ratio means more control
of concern on its cost of production, which is good.
Gross profit ratio can be improved:
1. By increasing gross profit on sales ,or
2. By reducing net sales at same profit.
3. By reducing direct expenditure
Mar 06 Mar 07 Mar 08 Mar 09 Mar 10

8/7/2019 Accounts ppt (final)
http://slidepdf.com/reader/full/accounts-ppt-final 5/30
Gross profit ratio
From 2006 to 2007, Gross profit ratio increases
from 38.81 % to 39.84 % but after 2007 it is
continuously declining i.e. 39.84% (2007) to
31.36% (2010).
It is not a good sign of profitability means company
is losing its control over cost of production.
Companys COP is increasing every year but salesare not increasing at same rate as that of COP.

8/7/2019 Accounts ppt (final)
http://slidepdf.com/reader/full/accounts-ppt-final 6/30
Operating Cost ratio (%):
T is ratio tells s a o t t e relations ip et een Operating cost an net sales
Interpretation: Lo er t e ratio, profita le ill e t e concern.
B t in t is case, Operating cost is ig i.e. Profita ility of t e company is not p to
t e mark.
Mar 09 Mar 10Mar 06 Mar 07 Mar 08
Operating Cost = Cost of goo sol + office exp. + a ministration exp.
+ selling an istri tion expenses

8/7/2019 Accounts ppt (final)
http://slidepdf.com/reader/full/accounts-ppt-final 7/30
Operating Cost ratio
Initially Operating cost ratio was declining (2006
to 2008), but after 2008 it again startedincreasing which shows poor profitability of
the concern.

8/7/2019 Accounts ppt (final)
http://slidepdf.com/reader/full/accounts-ppt-final 8/30
Operating Profit ratio:
This ratio tells us about relationship between Operating profit and net sales.
Interpretation:Higher the ratio, more profitable will be the concern.
In this case, ratio initially was increasing, then started declining which shows poor
profitability of concern.
Mar 06 Mar 07 Mar 08 Mar 09 Mar 10
Operating Profit = Sales Operating cost (i.e. Cost of good sold + office exp. +
administration exp. + selling and distribution expenses)

8/7/2019 Accounts ppt (final)
http://slidepdf.com/reader/full/accounts-ppt-final 9/30
Net Profit ratio (%):
This ratio shows the relationship between net profit and net sales.
Interpretation: Higher the ratio, more profitable will be the concern. Net profit
should be enough to pay dividends and make necessary appropriations.
Net profit ratio can be improved by:
Increasing gross profit Increasing sales
Reducing Indirect expenses (Office exp.+ administrative exp. + selling exp.)
ar arar 8ar 7ar 6
8/7/2019 Accounts ppt (final)
http://slidepdf.com/reader/full/accounts-ppt-final 10/30

8/7/2019 Accounts ppt (final)
http://slidepdf.com/reader/full/accounts-ppt-final 11/30
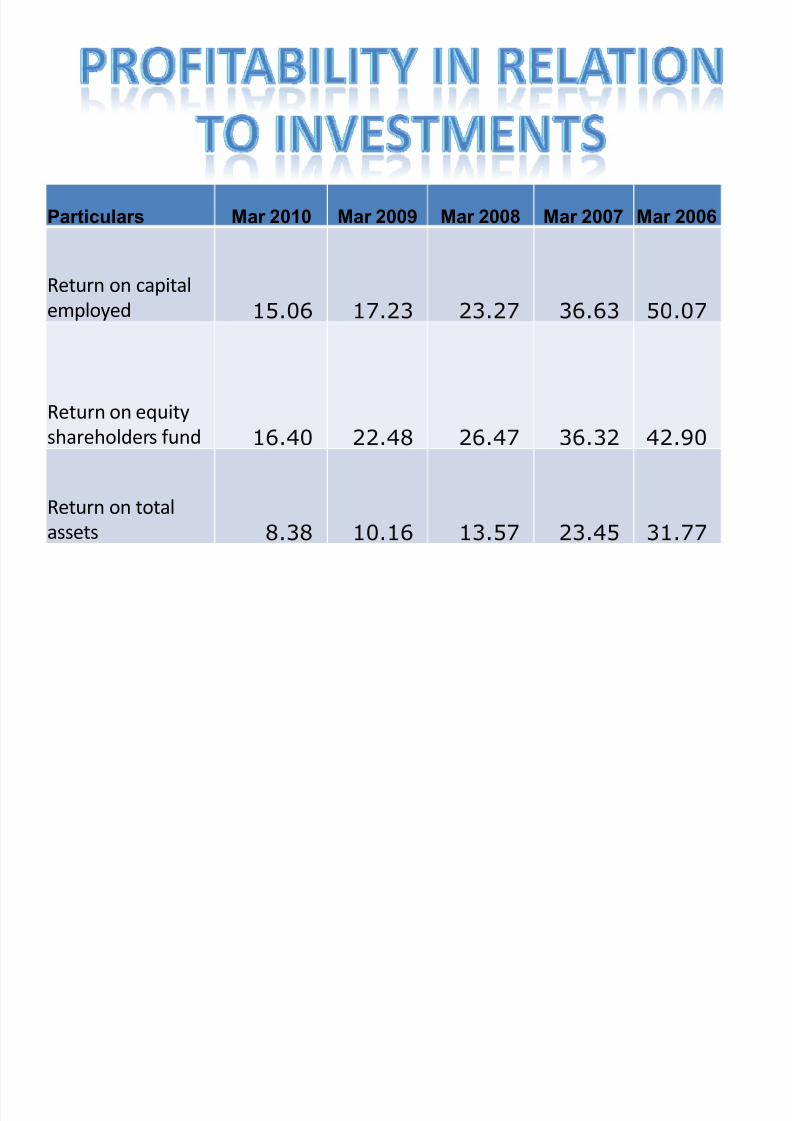
Return on capital Employed (%):
ar
ar 1ar 9ar 8ar 7
This ratio tells us about relationship between adjusted profit and capitalemployed.
Net capital employed = Fixed Assets + Current Assets Current liabilities
Adjusted Profit = Profit for the year + Non-operating expenses Non
operating Incomes.
Significance: Higher the ratio, more profitable will be the concern.
8/7/2019 Accounts ppt (final)
http://slidepdf.com/reader/full/accounts-ppt-final 12/30
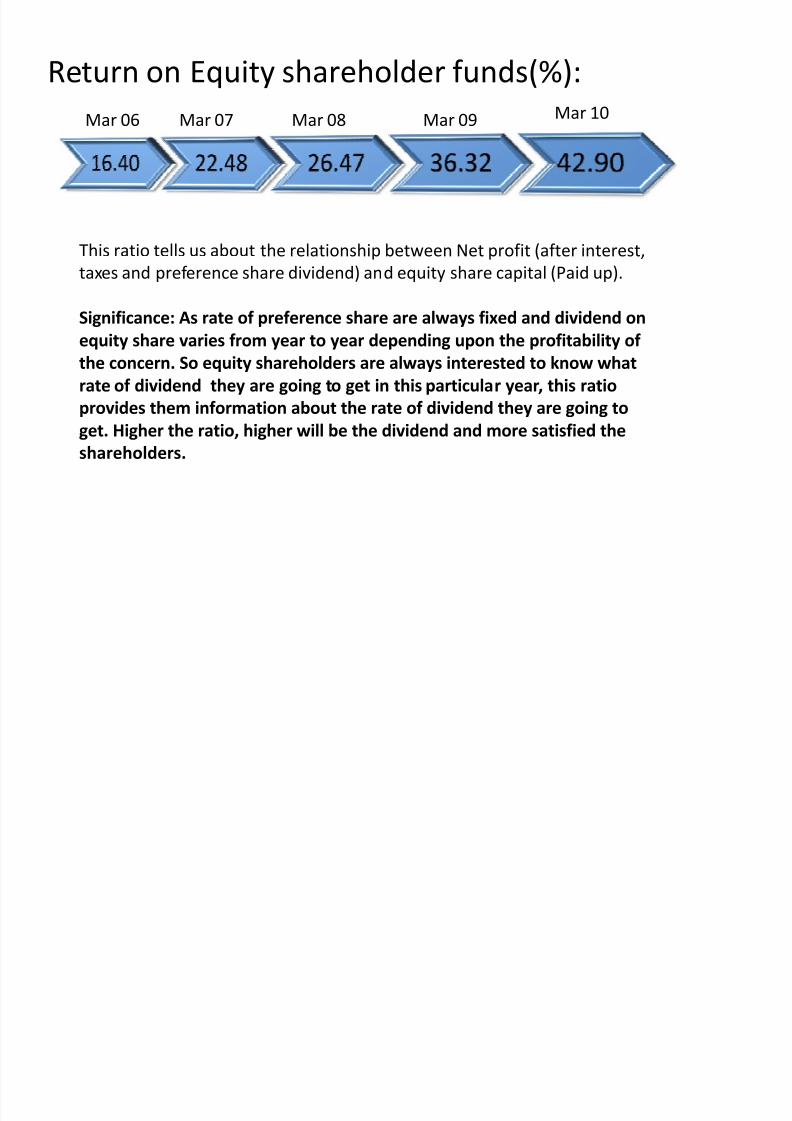
Return on Equity shareholder funds(%):Mar 10Mar 09Mar 08Mar 07Mar 06
This ratio tells us about the relationship between Net profit (after interest,
taxes and preference share dividend) and equity share capital (Paid up).
Significance: As rate of preference share are always fixed and dividend on
equity share varies from year to year depending upon the profitability of
the concern. So equity shareholders are always interested to know what
rate of dividend they are going to get in this particular year, this ratio
provides them information about the rate of dividend they are going toget. Higher the ratio, higher will be the dividend and more satisfied the
shareholders.
8/7/2019 Accounts ppt (final)
http://slidepdf.com/reader/full/accounts-ppt-final 13/30
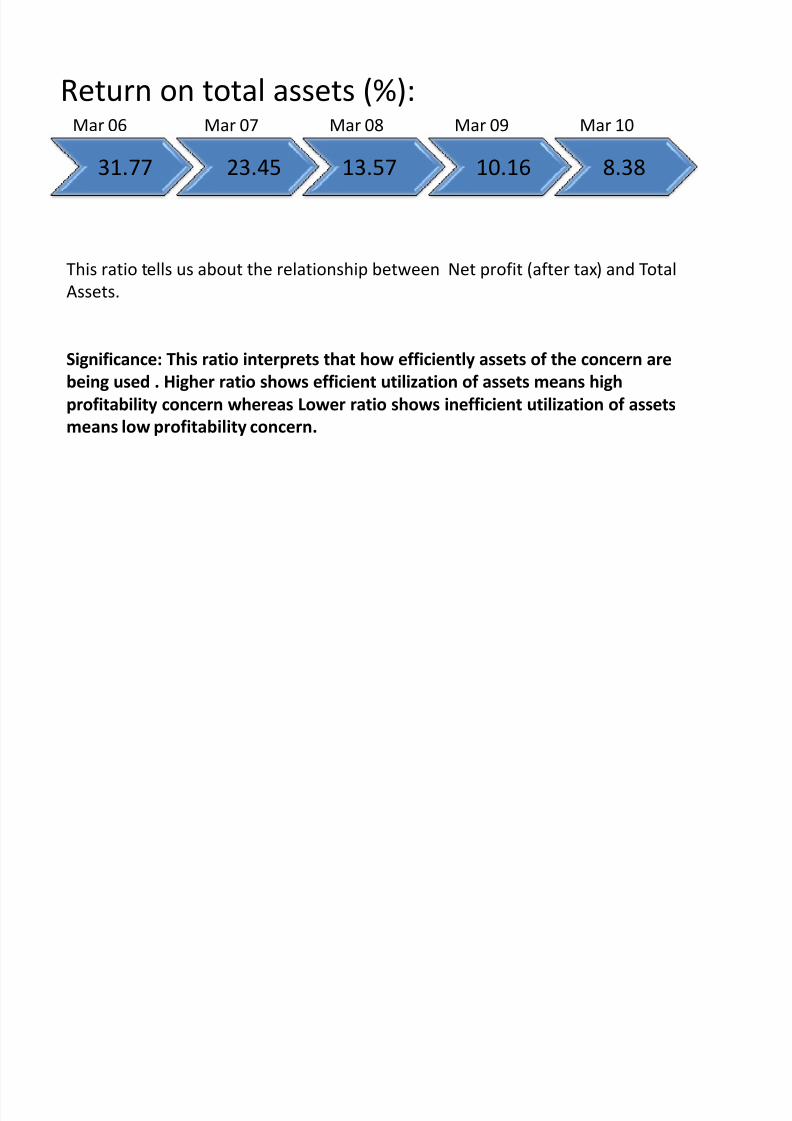
Return on total assets (%):
31.77 23.45 13.57 10.16 8.38
Mar 10Mar 09Mar 08Mar 07Mar 06
This ratio tells us about the relationship between Net profit (after tax) and TotalAssets.
Significance: This ratio interprets that how efficiently assets of the concern are
being used . Higher ratio shows efficient utilization of assets means high
profitability concern whereas Lower ratio shows inefficient utilization of assets
means low profitability concern.

8/7/2019 Accounts ppt (final)
http://slidepdf.com/reader/full/accounts-ppt-final 14/30
Particulars Mar 2010 Mar 2009 Mar 2008 Mar 2007 Mar 2006
Working capital turnover ratio 51.07 -226.06 1.73 7.21 -19.91
Fixed Asset ratio 1.12 1.22 1.2 1.68 1.6
Debtors turnover ratio 46.58 41.29 33.45 29.81 26.99
Debtors collection period 7.84 8.84 10.91 12.24 13.52
Creditors turnover ratio 6.51 6.77 5.67 5.63 6.64
Creditors payment ratio 56.07 53.91 64.37 64.83 54.97
Stock turnover ratio 10.9 9.36 10.84 7.69 7.08

8/7/2019 Accounts ppt (final)
http://slidepdf.com/reader/full/accounts-ppt-final 15/30
Working Capital Turnover Ratio
Following formula is used to calculate working capital
turnover ratio:
[Working Capital Turnover Ratio = Cost of Sales / NetWorking Capital]
Net working capital is found by deduction from the total of
the current assets the total of the current liabilities.

8/7/2019 Accounts ppt (final)
http://slidepdf.com/reader/full/accounts-ppt-final 16/30
Interpretation:
The working capital turnover ratio measure the
efficiency with which the working capital is beingused by a firm. A high ratio indicates efficient
utilization of working capital and a low ratio indicates
otherwise. But a very high working capital turnover
ratio may also mean lack of sufficient working capitalwhich is not a good situation.

8/7/2019 Accounts ppt (final)
http://slidepdf.com/reader/full/accounts-ppt-final 17/30
Fixed Assets Ratio
Fixed ratio is also known as sales to fixed assets ratio. This
ratio measures the efficiency and profit earning capacity of the concern.
Fixed assets ratio ratio is calculated by the following formula:
Fixed Assets Ratio = Cost of Sales / Net Fixed Assets

8/7/2019 Accounts ppt (final)
http://slidepdf.com/reader/full/accounts-ppt-final 18/30
Interpretation:
Higher the ratio, greater is the intensive
utilization of fixed assets. Lower ratio means
under-utilization of fixed assets.

8/7/2019 Accounts ppt (final)
http://slidepdf.com/reader/full/accounts-ppt-final 19/30
Debtors turnover ratio
Debtors turnover ratio or accounts receivable turnover ratio indicates
the velocity of debt collection of a firm. In simple words it indicates the
number of times average debtors (receivable) are turned over during ayear.
[Debtors Turnover Ratio = Net Credit Sales / Average Trade Debtors]
8/7/2019 Accounts ppt (final)
http://slidepdf.com/reader/full/accounts-ppt-final 20/30
Interpretation:
The higher the value of debtors turnover themore efficient is the management of debtors
or more liquid the debtors are. Similarly, lowdebtors turnover ratio implies inefficientmanagement of debtors or less liquid debtors.It is the reliable measure of the time of cashflow from credit sales
8/7/2019 Accounts ppt (final)
http://slidepdf.com/reader/full/accounts-ppt-final 21/30
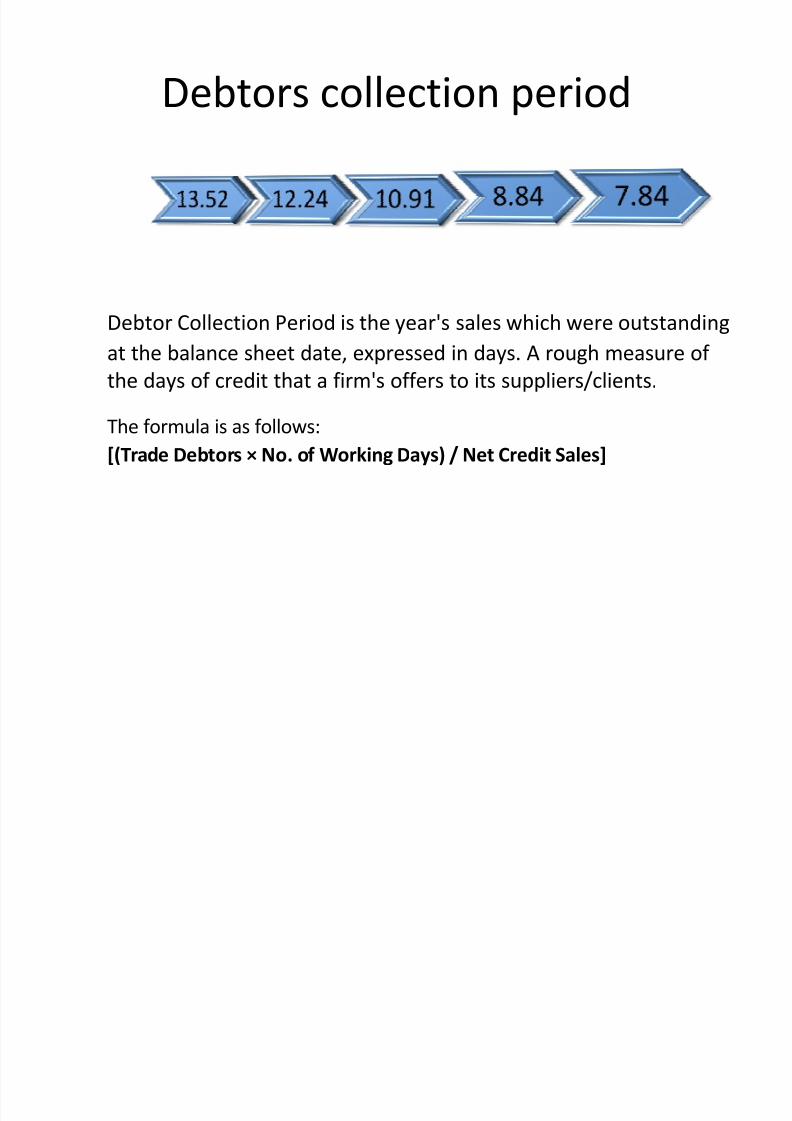
Debtors collection period
Debtor Collection Period is the year's sales which were outstanding
at the balance sheet date, expressed in days. A rough measure of
the days of credit that a firm's offers to its suppliers/clients.
The formula is as follows:
[(Trade Debtors × No. of Working Days) / Net Credit Sales]

8/7/2019 Accounts ppt (final)
http://slidepdf.com/reader/full/accounts-ppt-final 22/30
Interpretation:This ratio measures the quality of debtors. A
short collection period implies prompt payment
by debtors. It reduces the chances of bad debts.
Similarly, a longer collection period implies too
liberal and inefficient credit collection
performance. It is difficult to provide a standard
collection period of debtors.

8/7/2019 Accounts ppt (final)
http://slidepdf.com/reader/full/accounts-ppt-final 23/30
Creditors Turnover ratio
This ratio is similar to the debtors turnover ratio. It compares
creditors with the total credit purchases.
It signifies the credit period enjoyed by the firm in paying
creditors. Accounts payable include both sundry creditors and
bills payable.
8/7/2019 Accounts ppt (final)
http://slidepdf.com/reader/full/accounts-ppt-final 24/30
I
nterpretation:A high creditors turnover ratio or a lower credit
period ratio signifies that the creditors are being
paid promptly. This situation enhances the credit
worthiness of the company. However a veryfavorable ratio to this effect also shows that the
business is not taking the full advantage of credit
facilities allowed by the creditors.

8/7/2019 Accounts ppt (final)
http://slidepdf.com/reader/full/accounts-ppt-final 25/30
Creditors payment ratio
This ratio tells us about the number of days or month
or week, a concern has to wait before its creditors are
paid off.
Creditor Velocity/ Payment period =
(Average trade creditors/Net credit annual
purchases)* No. of days in a year

8/7/2019 Accounts ppt (final)
http://slidepdf.com/reader/full/accounts-ppt-final 26/30
Interpretation:
Lower the number of days, more efficient is the
management regarding creditors turnover. Too much
lower number of days means concern is enjoying
benefit of discount policy and ignoring the benefits of
credit policy whereas too much higher number of days
means concern is enjoying the benefits of credit policy
but ignoring the benefits of credit policy.

8/7/2019 Accounts ppt (final)
http://slidepdf.com/reader/full/accounts-ppt-final 27/30

8/7/2019 Accounts ppt (final)
http://slidepdf.com/reader/full/accounts-ppt-final 28/30
Interpretation:
Inventory turnover ratio measures the velocity of
conversion of stock into sales. Usually a high inventoryturnover indicates efficient management of inventorybecause more frequently the stocks are sold, thelesser amount of money is required to finance the
inventory. A low inventory turnover ratio indicates aninefficient management of inventory. A low inventoryturnover implies over-investment in inventories, dullbusiness, poor quality of goods. The inventory
turnover ratio is also an index of profitability, where ahigh ratio signifies more profit, a low ratio signifieslow profit.

8/7/2019 Accounts ppt (final)
http://slidepdf.com/reader/full/accounts-ppt-final 29/30
Conclusion
From above ratios, we can conclude that:
Concerns profitability is not good.
Concern is at risk
Shareholders risk is more than outsiders risk.
Efficient use of Working Capital
Under utilization of fixed assets
Enjoying credit policy from suppliers for 2months (app.)

8/7/2019 Accounts ppt (final)
http://slidepdf.com/reader/full/accounts-ppt-final 30/30