accident analysis and preventionaging.wisc.edu/pdfs/2512.pdf · effects of rainfall on the severity...
TRANSCRIPT

Rr
Sa
b
c
a
ARRA
KCOSRR
1
wciTtwdfhc
n
0d
Accident Analysis and Prevention 42 (2010) 213–224
Contents lists available at ScienceDirect
Accident Analysis and Prevention
journa l homepage: www.e lsev ier .com/ locate /aap
ainfall effect on single-vehicle crash severities using polychotomousesponse models
oyoung Junga,∗, Xiao Qinb,1, David A. Noycec,2
University of Wisconsin-Madison, Department of Civil and Environmental Engineering, 1241 Engineering Hall, 1415 Engineering Drive, Madison, WI 53706-1691, United StatesUniversity of Wisconsin-Madison, Department of Civil and Environmental Engineering, B239 Engineering Hall, 1415 Engineering Drive, Madison, WI 53706-1691, United StatesUniversity of Wisconsin-Madison, Department of Civil and Environmental Engineering, 1210 Engineering Hall, 1415 Engineering Drive, Madison, WI 53706-1691, United States
r t i c l e i n f o
rticle history:eceived 6 March 2009eceived in revised form 25 July 2009ccepted 29 July 2009
eywords:rash severityrdinal logistic regressionequential logistic regressionainfall effectoad weather safety
a b s t r a c t
As part of the Wisconsin road weather safety initiative, the objective of this study is to assess theeffects of rainfall on the severity of single-vehicle crashes on Wisconsin interstate highways utilizingpolychotomous response models.
Weather-related factors considered in this study include estimated rainfall intensity for 15 min priorto a crash occurrence, water film depth, temperature, wind speed/direction, stopping sight distance anddeficiency of car-following distance at the crash moment. For locations with unknown weather infor-mation, data were interpolated using the inverse squared distance method. Non-weather factors suchas road geometrics, traffic conditions, collision types, vehicle types, and driver and temporal attributeswere also considered. Two types of polychotomous response models were compared: ordinal logistic andsequential logistic regressions. The sequential logistic regression was tested with forward and backwardformats. Comparative models were also developed for single vehicle crash severity during clear weather.
In conclusion, the backward sequential logistic regression model produced the best results for pre-dicting crash severities in rainy weather where rainfall intensity, wind speed, roadway terrain, driver’sgender, and safety belt were found to be statistically significant. Our study also found that the seasonal fac-tor was significant in clear weather. The seasonal factor is a predictor suggesting that inclement weathermay affect crash severity. These findings can be used to determine the probabilities of single vehiclecrash severity in rainy weather and provide quantitative support on improving road weather safety via
s, hig
weather warning system. Introduction
Driving in rainy conditions is more challenging than in cleareather due to low visibility and slippery road conditions. These
hallenges contribute to a sizable portion of severe crashes includ-ng fatalities and injuries in Wisconsin. According to Wisconsinraffic Crash Facts from the Wisconsin Department of Transporta-ion (WisDOT), there are 3047 injury and fatal crashes in rainyeather, the greatest number of all kinds of inclement weather con-
itions from 1999 to 2005. In addition, the proportion of injury andatal crashes to total crashes in rainy weather is 0.37, the secondighest during the same period. Despite the fact that fog-relatedrashes have the highest injury and fatal crash proportion, the total∗ Corresponding author. Tel.: + 1 608 262 2524.E-mail addresses: [email protected] (S. Jung), [email protected] (X. Qin),
[email protected] (D.A. Noyce).1 Tel.: +1 608 262 3649; fax: +1 608 262 5199.2 Tel.: +1 608 265 1882; fax: +1 608 262 5199.
001-4575/$ – see front matter © 2009 Elsevier Ltd. All rights reserved.oi:10.1016/j.aap.2009.07.020
hway facility improvements, and speed limit management.© 2009 Elsevier Ltd. All rights reserved.
number of injury and fatal crashes in foggy weather is merely 249from 1999 to 2005, less than 10% of injury and fatal crashes thatoccurred in rainy weather.
In Wisconsin, rainy weather-related crash severity is distributeddifferently between single and multi-vehicle crashes. From 1999to 2006, 659 single-vehicle crashes and 899 multi-vehicle crashesoccurred on Wisconsin interstate highways in rainy weather. Theproportion of serious crashes including fatalities and incapacitatinginjuries to total crashes is 10% for single-vehicle crashes while itis only 4% for multi-vehicle crashes. Since the consequence of asingle-vehicle crash is more serious, there is a need to investigatethe contributing factors to single-vehicle crash severity, especiallyfatal or incapacitating injury severity.
Crash consequences can be minimized through the improve-ments in roadway and roadside design, appropriate use of safety
devices, and changes in driver behavior. Numerous studies havebeen conducted by safety researchers and practitioners in hopesof identifying the contributing factors to crash severities (Abdel-Aty and Pemmanaboina, 2006a; Dissanayake and Lu, 2002; Donnelland Mason, 2004; Golob and Recker, 2003; Khan et al., 2008; Qin
2 s and P
eYsdlsesmbrpw
2
cWttt
ra
oatclotsgvdduWirs
ieswsthacb(tmisntrss
i
14 S. Jung et al. / Accident Analysi
t al., 2006; Savolainen and Tarko, 2005; Shankar et al., 1995;au, 2004; Yau et al., 2006). Overall, research demonstrates thatuch factors as weather, roadway geometries, traffic conditions,river, and temporal-related predictors as well as their interaction
ead to different injury severities. In many crash severity-basedtudies, weather is just one of the contributing factors, not nec-ssarily the focus. Using only rainy weather related crashes, thistudy identified a variety of significant predictors that contributeore serious crash consequences. Furthermore, a comparison
etween rainy weather and clear weather crash prediction modelsevealed important factors that may potentially lead to appro-riate countermeasures against severe crash occurrences in rainyeather.
. Literature review
The topic of crash severity has been of interest to traffic safetyommunity because of the direct impact on occupants involved.
eather is frequently cited and found as one of the factors con-ributing to either a more or less severe crash. The approaches usedo model injury severities vary from one to another, depending onhe purpose of the study and data availability.
Based on the purpose of this research, the focus of this literatureeview will be specifically on factors caused by rain precipitationt the time of the crash.
For crash severity models, the crash outcome of a single vehicler multi-vehicle crash is usually modeled separately. Malyshkinand Mannering (2009) explained unobserved heterogeneity relatedo variant weather conditions over time for single- and two-vehiclerash severity potentials using a Markov switching multinomialogit model. In their study, daily averaged or maximal weather dataver one week were used as follows: rain precipitation, tempera-ure, snowfall, visibility, gust wind, and fog/frost. Weather variablesuch as rain precipitation, low visibility, gust wind were key factorsenerating time-related two-state nature of severities in single-ehicle accidents on high-speed roads, but not in two-vehicle acci-ents on high-speed roads. Savolainen and Mannering (2007) pre-icted motorcyclists’ injury severities in single and multiple crashessing nested logit and multinomial logit models, respectively.et pavement was significant to increase no injury severity only
n single-vehicle motorcycle crashes while none of the weatherelated factors were found to be significant to motorcyclists’ injuryeverities in multi-vehicle crashes involving motorcyclists.
Rainfall-related effect on crash severity outcomes has been alsodentified along with roadway characteristics. Ordered probit mod-ls were used in a Abdel-Aty’s study (2003) to predict driver injuryeverity in Central Florida, with crashes occurring in specific road-ay sections, signalized intersections and toll plazas in expressway
ystems. It was found that crashes happening in signalized intersec-ions with bad weather and dark street lighting had a significantlyigher probability of severe injury. Abdel-Aty stated that an anglend turning collision in the adverse weather and dark street lightonditions was a possible reason to contribute higher proba-ility of injuries in signalized intersections. Donnell and Mason2004) employed ordinal and nominal logistic regression modelso predict interstate highway crash severity in cross-median and
edian-barrier collisions, respectively. Researchers found wet orcy pavement surface to be significant factor in decreasing crasheverity. In contrast, in a study by Lee and Mannering (2002), theested logit analysis showed that wet roadway surfaces increasedhe likelihood of evident and disabling injury/fatality in run-off-
oadway accidents. The conflicting results from these two studiesuggest the need for a detailed analysis for weather-related crasheverity by collision type.Special attention was given to crash severities by vehicle typesn several studies. Shankar and Mannering (1996) used a multi-
revention 42 (2010) 213–224
nomial logit model to predict five-level rider injury severitiesfrom statewide single-vehicle motorcycle crashes in Washington.In their study, pavement surface and weather interaction weresignificant factors to increase the likelihood of being injured. Inter-estingly, the crash severity on wet pavement without rainfall waslimited only to property damage and possible injury crashes. Sim-ilarly, wet pavement for single-vehicle motorcycle crashes wasmore likely to result in no injury according to a study by Savolainenand Mannering (2007). The authors argued that it could be aresult of lower speeds or longer headway maintained by rid-ers in these conditions as they adjust for the perceived higherrisk. Khorashadi et al. (2005) also utilized the multinomial logitmodel to analyze driver injury severities involving large-truckaccidents. Results in their study showed that rainy weather wassignificant to increase injuries in urban area accidents. Ulfarssonand Mannering (2004) showed that wet roads led to increasingrelatively higher injury severities involved in single sport utilityvehicle (SUV)/minivan accidents using multinomial logit model. Ina study by Kim et al. (2007), bicyclist injury severities in bicycle-motor vehicle accidents were predicted by the same method.Inclement weather including rain, snow, and fog was found toincrease the probability of fatal injury approximately by 129%.The authors stated that the inclement weather effect was largelydue to increased slipperiness which reduced both the vehicle’sand bicycle’s maneuverability and visibility. Pai and Saleh (2008)used ordered logit model to assess motorcyclist injury severities.In their study, on the contrary, fine weather was a statistically sig-nificant factor to increase the most severe category of motorcyclistinjury.
Driver characteristics such as age or gender also play impor-tant roles in the likelihood of injury severity associated withweather conditions. Hill and Boyle (2006) utilized a logistic regres-sion model in the fatality and incapacitating injury prediction.In their study, females in the older age groups (age of 54 orolder) were more likely to suffer severe injuries in poor weather.Ulfarsson and Mannering (2004) found that rainy weather sig-nificantly affected the increase of property damage only level infemale single SUV/minivan accidents but not in male driver singleSUV/minivan accidents.
Weather impact was also evaluated in crash count-based mod-els with the emphasis on severity counts. Abdel-Aty et al. (2006b)used a seemingly unrelated Negative Binomial regression model toestimate the number of property damage only and injury crashes,respectively. The result showed that crash severity in adverseweather conditions causing wet pavement surface was more likelyto increase at curves or ramps. Caliendo et al. (2007) groupedcrashes by total, fatal and injury crashes on curves and tangentroadways sections, and compare them using Poisson, NegativeBinomial and Negative Multinomial regression models. In theirstudy, rain was found to be a highly significant variable increas-ing the expected number of severe crashes for curves by a factorof 3.26 and for tangents by a factor of 2.81. Their study sug-gests wet-skidding for the higher number of severe crashes oncurves.
Compared with previous studies, our study applied a rain-related crash dataset and included microscopic data at the crashmoment to predict crash severity outcomes. To be specific, vari-ables used in this study were real-time information at the crashmoment, such as momentary weather and traffic data, and othernon-weather data such as driver characteristics and roadwaygeometries. Additionally, rain-related single-vehicle crash sever-
ity models were compared to clear weather models to identifythe common factors that contributed to crash severity regardlessof weather. Research findings from this study will provide guid-ance on countermeasures to prevent severe crashes related to rainyweather and improve overall safety.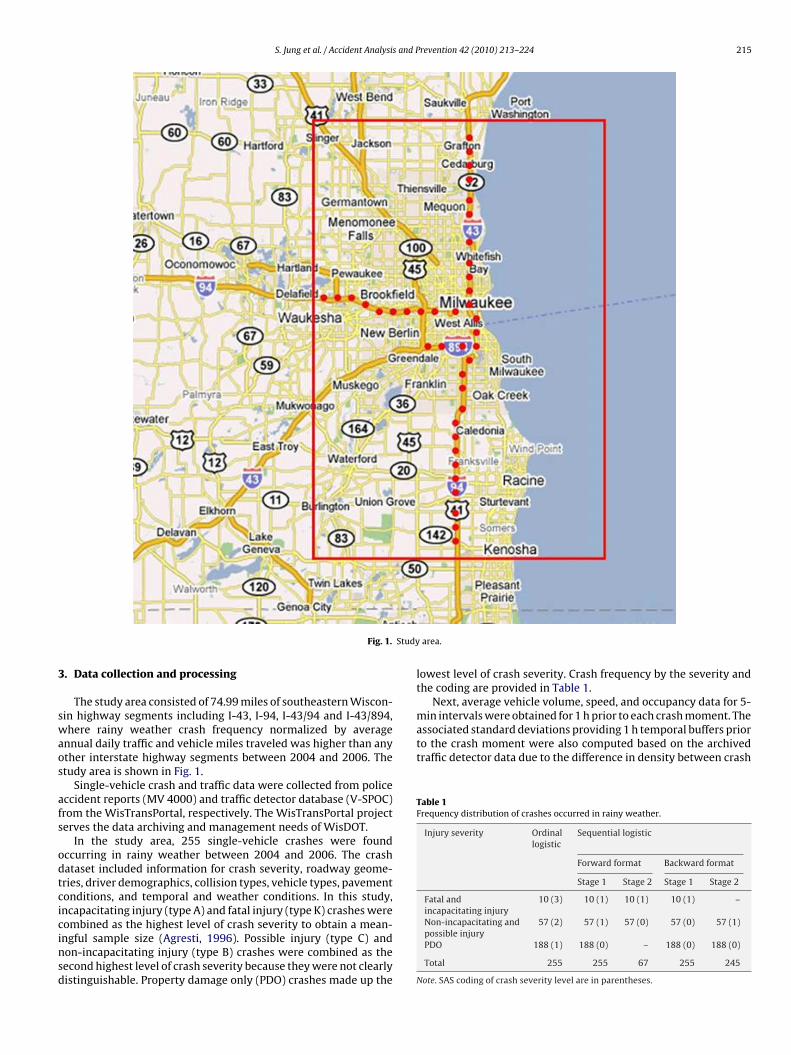
S. Jung et al. / Accident Analysis and Prevention 42 (2010) 213–224 215
Study
3
swaos
afs
odtcicinsd
min intervals were obtained for 1 h prior to each crash moment. Theassociated standard deviations providing 1 h temporal buffers priorto the crash moment were also computed based on the archivedtraffic detector data due to the difference in density between crash
Table 1Frequency distribution of crashes occurred in rainy weather.
Injury severity Ordinallogistic
Sequential logistic
Forward format Backward format
Stage 1 Stage 2 Stage 1 Stage 2
Fatal andincapacitating injury
10 (3) 10 (1) 10 (1) 10 (1) –
Fig. 1.
. Data collection and processing
The study area consisted of 74.99 miles of southeastern Wiscon-in highway segments including I-43, I-94, I-43/94 and I-43/894,here rainy weather crash frequency normalized by average
nnual daily traffic and vehicle miles traveled was higher than anyther interstate highway segments between 2004 and 2006. Thetudy area is shown in Fig. 1.
Single-vehicle crash and traffic data were collected from policeccident reports (MV 4000) and traffic detector database (V-SPOC)rom the WisTransPortal, respectively. The WisTransPortal projecterves the data archiving and management needs of WisDOT.
In the study area, 255 single-vehicle crashes were foundccurring in rainy weather between 2004 and 2006. The crashataset included information for crash severity, roadway geome-ries, driver demographics, collision types, vehicle types, pavementonditions, and temporal and weather conditions. In this study,ncapacitating injury (type A) and fatal injury (type K) crashes were
ombined as the highest level of crash severity to obtain a mean-ngful sample size (Agresti, 1996). Possible injury (type C) andon-incapacitating injury (type B) crashes were combined as theecond highest level of crash severity because they were not clearlyistinguishable. Property damage only (PDO) crashes made up thearea.
lowest level of crash severity. Crash frequency by the severity andthe coding are provided in Table 1.
Next, average vehicle volume, speed, and occupancy data for 5-
Non-incapacitating andpossible injury
57 (2) 57 (1) 57 (0) 57 (0) 57 (1)
PDO 188 (1) 188 (0) – 188 (0) 188 (0)
Total 255 255 67 255 245
Note. SAS coding of crash severity level are in parentheses.

2 s and P
ltac
rfUt
rwiIdawoisid
ptba
TE
16 S. Jung et al. / Accident Analysi
ocations and detector locations in study area. The traffic detec-ors were installed at approximately 0.7 mile interval in the studyrea. Real-time average vehicle volume, speed and occupancy wereollected at short-time (5-min) intervals.
State Trunk Network (STN) highway log from WisDOT containsoadway geometric attributes, including the number and widthor travel lane and shoulder as well as pavement surface material.sing the STN highway log, the geometric attributes were linked to
he crash dataset.One of the keys to the success of this study was to obtain accu-
ate weather data at a crash moment. However, there were feweather data sources that can provide minute-based measurement
nterval. After a thorough investigation, Weather Undergroundnc. was found to deliver the most reliable and real-time weatherata for Wisconsin. Considering crash distribution in study areand weather station proximity to each crash location, six airporteather stations and ten private weather stations were selected to
btain microscopic weather data measured by the minute basednterval in this study. For each crash observation, three weathertations out of the 16 weather stations were used by their prox-mity to the crash location to estimate the microscopic weatherata.
From the four databases, the following explanatory variables
rovided in Table 2 were utilized in the crash severity predic-ion models. The category coding in each explanatory variable wasased on sample size and characteristic for each category, which islso shown in Table 2.able 2xplanatory variables used in prediction models.
Variable Minimum Maximum Mean Category c
Driver’s sex – – – Female = 1Alcohol or drug – – – Sobriety = 1Safety belt – – – Use of safeDriver action – – – Going straiCurve direction – – – Curve to thInjury transport – – – Injured peoTerrain – – – HorizontalFirst harmful spot – – – Ramp/gorePavement surface – – – Asphaltic cLighting condition – – – Daylight =Collision type – – – Median relVehicle type – – – Car = 1, truTime of day – – – Peak-hourDay of week – – – Tuesday toQuarter of year – – – DecemberWind direction – – – No wind =Driver’s age 16 80 34 –Number of lanes 1 4 3 –Lane width (ft) 12 17 12 –Shoulder width (ft) 0/0a 16/20 7/11 –Speed limit (min/h) 45 65 56 –Average 5-min Vb 2 129 51 –Average 5-min SPDc 16 99 53 –Average 5-min Od (%) 0.08 41.02 5.77 –S.D.e of V 0.69 61.23 9.26 –S.D. of SPD 0.27 29.33 6.25 –S.D. of O 0.13 19.96 1.86 –SSDf (ft) 71 1305 447 <330 = 1, [3DCDg (ft) 0 363 68 <16 = 1, [16Wind speed (km/h) 0 48 12.8 <6 = 1, [6,1Temperature (◦C) 0.9 24.1 12.1 <7 = 1, [7,1Water film (mm/h) 0 0.74 0.15 <0.04 = 1, [RIh (mm/15 min) 0 9.53 0.79 <0.06 = 1, [
a Left shoulder width/right shoulder width.b V: volume.c SPD: vehicle speed.d O: occupancy.e S.D.: standard deviation.f SSD: stopping sight distance.g DCD: deficiency of car-following distance.h RI: rainfall intensity.
revention 42 (2010) 213–224
3.1. Weather parameter estimation
Weather data directly collected from a weather station includetemperature, wind speed/direction, rainfall precipitation and rain-fall duration. To reflect real-time weather conditions at the crashmoment, some weather data can be estimated by interpolatingbetween weather stations because weather data such as rainfallintensity or wind speed show geometrical and temporal variety. Inother words, rainfall precipitation for 15 min (rainfall intensity) canbe calculated using rainfall precipitation and the duration at eachof the three weather stations near the crash location and the esti-mated 15-min rainfall intensities are interpolated for each crash.Water film depth, stopping sight distance (SSD), and deficiencyof car-following distance (DCD) are estimated by hourly rainfallprecipitation, traffic, and road geometry data.
3.1.1. Rainfall intensityRainfall intensity is defined as the rainfall precipitation divided
by measurement interval. The rainfall intensity reflects visibility onhighway in rainy weather conditions. Using three weather stationdata for each crash location, the average measurement interval ofrainfall precipitation was 15 min. Therefore, rainfall precipitation
for 15 min prior to a crash was adopted as the real-time rain-fall intensity at the crash moment. Compared to the weather datameasurement intervals mentioned in the previous studies, 15-minmeasurement interval used in this study was a more microscopicreflection of the real-time rainfall intensity at a crash moment.oding
, male = 2, under alcohol/drug effect = 2
ty belt = 1, non-used = 2ght = 1, others = 2, negotiating curve = 3e right = 1, curve to the left = 2ple transported to hospital = 1, others = 2curve = 1, vertical curve = 2, horizontal/vertical curve = 3, tangent/flat = 4= 1, Shoulder/outside shoulder = 2, median = 3, On roadway = 4ement plant mix/rigid base = 1, others = 21, dusk/dawn/dark = 2, night but street light = 3ated = 1, Non-collision = 2, Fixed object = 3ck (straight)/truck-tractor = 2, motor cycle = 3(6–8 a.m. and 3–5 p.m.) = 1, off-peak = 2Thursday = 1, Monday/Friday = 2, Saturday/Sunday = 3
to February = 1, March to May = 2, June to August = 3, September to November = 41, North = 2, East = 3, South = 4, West = 5
30,546] = 2, >546 = 3,130] = 2, >130 = 3
8] = 2, >18 = 38] = 2, >18 = 30.04, 0.24] = 2, >0.24 = 30.06, 0.83] = 2, >0.83 = 3

s and P
3
sdit
D
S
wSm
3
Tsf
S
wa
(fsNaFw
Woidb
ct
D
w
S. Jung et al. / Accident Analysi
.1.2. Water film depthWater film is created by rainfall between the tire and pavement
urface, causing a decrease in skid resistance. Therefore, water filmepth in this study was used as an explanatory variable for measur-
ng the slippery pavement condition. Russam and Ross (1968) gavehe following empirical method to estimate the water film depth:
= 0.046(W · S/Sc · I)1/2
S1/5(1)
= (S2l + S2
c )1/2
(2)
here D = water film depth (mm/h); I = rainfall intensity (mm/h);= flow path slope (%); Sl = longitudinal slope (%); Sc = slope of pave-ent cross section (%); W = width of pavement (m).
.1.3. SSD and DCDIn this study, there were not direct visibility data for highways.
herefore, SSD and DCD were considered as the surrogate mea-ures for highway visibility at the time of the crash. First of all, SSDormula is as follows.
SD = 1.47V · t + 1.075V2
a(3)
here V = vehicle speed (min/h); t = brake reaction time (2.5 s);= deceleration rate (ft/s2).
According to a detailed study about pavement conditionsKokkalis and Panagouli, 1998), the coefficient of wet pavementriction is associated with water film depth and vehicle speedhown in Fig. 2. In Fig. 2, vertical axis is Skid Number (or Frictionumber) representing longitudinal friction force and horizontalxis is vehicle slip speed given a specific water film depth. That is,ig. 2 combines relations among friction force, vehicle speed andater film depth.
Using Fig. 2 and pavement surface material information fromisconsin STN highway log, deceleration rate in SSD formula can be
btained by multiplying wet pavement friction coefficient by grav-ty acceleration. Consequently, SSD was calculated by the obtainedeceleration rate, vehicle speed from traffic detector data, andrake reaction time.
DCD represents the risk of losing control caused by driver overorrection for avoiding any potential conflict. DCD is calculated by
he following formula.CD = SSD − AVG (4)
here SSD = stopping sight distance; AVG = average vehicle gap.
Fig. 2. Influences of water film depth and vehicle speed on skid resistance.
revention 42 (2010) 213–224 217
In Eq. (4), AVG is the average vehicle spacing obtained by sub-tracting average vehicle length from vehicle density data calculatedby traffic detector data (Roess et al., 2004).
Strictly speaking, vehicle speed in SSD formula should be indi-vidual vehicular speeds, so is the gap between every pair of cars.In this study, the average of 5-min traffic detector data contain-ing the crash occurrence time was used to surrogate the real-timeprevailing traffic conditions at the crash moment.
3.2. Weather data interpolation
To estimate weather data at a crash location, a study (Patrickand Stephenson, 1990) regarding the comparison of interpolationmethods concludes that the inverse squared distance method isstable and appropriate for the localized field with short spatialcorrelation length scale and large variability, and the minimumnumber of weather stations to apply the inverse squared distanceinterpolation is three (Press et al., 2007). Therefore, the inversesquared distance interpolation was utilized to estimate localizedweather data at the crash moment:
Zk = ˙wiZi (5)
wi =(
1/dik)2
˙(1/dik)2(6)
where Zk = weather data estimated at a crash location, k;Zi = weather data measured by each weather station, I;wi = weighting for each weather station, I; dik = distance betweeneach weather station i and a crash location k; i = one of the threenearest weather stations, i = 1–3.
In Eqs. (5) and (6), the larger weight is applied to a closerweather station data. According to the weather database used inthis study, rainfall precipitation and wind speed from weather sta-tions showed spatial and temporal variety in the values. Hence,15-min rainfall intensity, hourly rainfall precipitation for water filmdepth, and wind speed were interpolated between three weatherstations near to each crash location by the inverse squared dis-tance interpolation method. However, temperature data in theweather station nearest to each crash location was used withoutdata interpolation because temperature was spatially and tempo-rally consistent at the crash time.
4. Methodology
To model discrete outcome data, several alternative modelingtechniques such as ordered probability, multinomial and nestedlogit models can be considered but the application to the datasetvaries from one to another due to their limitations. For example, themultinomial and nested logit models do not account for the order-ing of crash severities, which was stated in several previous studies(Abdel-Aty, 2003; Milton et al., 2008; Wang and Abdel-Aty, 2008).Note that the crash severities are not only multiple discrete out-comes but also inherently ordered. Therefore, neither multinomialnor nested logit analysis would be able to account for the ordi-nal nature of the crash severities. Moreover, traditional orderedprobability approaches impose a critical restriction that regressionparameters have to be the same for different crash severity levels, socalled proportional odds. Since it is not clear whether the distancebetween adjacent crash severity levels is equal, it is rather arbitraryto assume that all coefficients of ordered probability models are the
same. This restriction was also mentioned in other studies (Miltonet al., 2008; Wang and Abdel-Aty, 2008).Alternatively, a generalized version of the standard ordered logitmodel was introduced to relax the restrictions of the same param-eters for explanatory variables across the response levels imposed

2 s and P
beupiatitaEpet
sisAtwsammrced
sroaepitpt
4
to
tedtil
l
wYp
iotas
18 S. Jung et al. / Accident Analysi
y the standard ordered logit model (Eluru et al., 2008). The gen-ralized standard ordered logit model allows the treatment of thetility thresholds across the ordered response levels by separatearameter coefficients for explanatory variables and heterogeneity
n the effects of injury severity determinants. However, the gener-lized ordered response model is recommended only to concludehat the proportional odds assumption is valid because the models very anti-conservative (Peterson and Harrell, 1990). Based onhe purpose of this study, the difference in the set of predictorscross various severity levels is one of the most important issues.ven though the generalized ordered logit model allows a separatearameter for each explanatory variable across crash severity lev-ls, the set of significant explanatory variables is invariant over allhe crash severity comparisons.
Furthermore, crash data used in this study were filtered througheveral criteria: rainy weather, wet pavement, single vehiclencluded in a crash, interstate highway divided by barrier, no con-truction zone, no hit and run and no pedestrian involved in a crash.dditionally, microscopic weather and traffic attributes at the crash
ime as well as roadway geometries, vehicle, and driver attributesere used in this study. Therefore, the conditions restricted by
everal criteria at the crash moment and detailed explanatory vari-bles can reduce moderate influence of unobserved factors thatay cause heterogeneity in the effects of crash severity deter-inants. Specifically, eight crashes out of 255 total crashes were
elated to intoxicated drivers and seven crashes out of the eightrashes by the intoxicated drivers were property damage only lev-ls in this study, which implies a certain level of homogeneity inrivers’ alertness.
Consequently, given the certain level of data homogeneity,equential logistic regression approach was selected to predictainy weather crash severities in this study because this method notnly accounts for the inherent ordering of crash severities but alsollows different regression parameters for the severity levels. Nev-rtheless, as a comparison, ordinal logistic regression was used toredict rainy weather crash severities with the inclusion of only the
ndependent variables satisfying the proportional odds assump-ion. Since sequential logistic regression model does not require theroportional odds, all the independent variables can be included inhe model.
.1. Model structure
The functional form of a logistic is S-shaped, making it possibleo deal with the multi-level response outcomes and the probabilityf a certain outcome (Keinbaum and Klein, 2002).
An interpretation of the logistic regression model is based onhe odds and the odds ratio of an event. The odds of an event arexpressed as a ratio of the probability that the event will occurivided by the probability that it will not. The odds ratio is a ratio ofhe predicted odds for a one-unit change in Xi with other variablesn the model held constant. Logarithm of the odds ratio is called asogit and it is shown as follows.
n[
P(X)1 − P(X)
]= logit P(X) = ˛ + ˇX (7)
here P(X) = P(Y = y|X) = probability of a response outcome,= response variable, y = 0 or 1, X = set of variables, ˛ = interceptarameter, ˇ = set of parameter estimates for X.
Crash severity can be fitted to a proportional odds model mean-
ng that the odds ratio assessing the effect of a predictor for anyrdinal response categories is equal regardless of where cut-pointo classify the response categories is made. The logistic modelssuming the proportional odds is called an ordinal logistic regres-ion model. In this study, the ordinal logistic regression fits therevention 42 (2010) 213–224
following equations:
logitP1 = ln[
P1
1 − P1
]= ˛1 +
∑ˇiXi (8)
logit(P1 + P2) = ln[
P1 + P2
1 − P1 − P2
]= ˛2 +
∑ˇiXi (9)
where P1 = probability of PDO severity; P2 = probability of non-incapacitating/possible injury severity; P3 = probability of fatal-ity/incapacitating injury severity.
The LOGISTIC procedure was used to fit logistic regression mod-els. To reverse the default ordering of the response variable ina statistical program used for this study, accordingly, the ordinallogistic regression can be refitted in the following way:
logitP3 = ln[
P3
1 − P3
]= ln
[P3
P1 + P2
]= ˛1 +
∑ˇiXi = h1 (10)
logit(P2 + P3) = ln[
P2 + P3
1 − P2 − P3
]= ln
[P2 + P3
P1
]
= ˛2 +∑
ˇiXi = h2 (11)
Combining Eqs. (10) and (11), the probability of each crashseverity is written as follows:
P3 = exp(h1)[1 + exp(h1)]
(12)
P2 = [exp(h1) − exp(h2)][1 + exp(h1)][1 + exp(h2)]
(13)
P1 = 1 − P2 − P3 (14)
If the proportional odds assumption is not satisfied in the crashdataset, the probability of a crash severity can be estimated bythe sequential logistic regression model. The primary differencebetween ordinal logistic regression and sequential logistic regres-sion is that the sequential logistic regression handles a set ofpredictors at each stage independent of the set used at the previousstage.
In this study, the standard logistic regression concept is appliedat both stages to fit the sequential logistic regression model. At thesecond stage, a sub-sample is used after removing observations of acertain crash severity used in the previous stages (Maddala, 1983).In order to explore whether there is an impact in the developmentof the sequential structure, forward and backward formats wereconducted in this study as follows:
Forward format:
Stage 1: Crash types K, A, B, and C vs. PDO.Stage 2: Crash types K and A vs. Crash types B and C.
Backward format:
Stage 1: Crash types K and A vs. Crash types B, C, and PDO.Stage 2: Crash types B and C vs. PDO.
Using the standard logistic regression concept at each stage ofboth formats, the probabilities of crash severity levels can be writ-ten as follows:
Forward format:
Stage 1 :(P2 + P3)
P1= exp
(˛1 +
∑ˇiXi
)= g1 (15)
Stage 2 :P3
P2= exp
(˛2 +
∑ˇjXj
)= g2 (16)
P1 = 11 + g1
(17)

s and P
P
P
S
S
P
P
P
4
prcw
hefit
atnaaspsa
fetmac
aocimfwipppd
S. Jung et al. / Accident Analysi
2 = g1(1 + g1)(1 + g2)
(18)
3 = g1 · g2(1 + g1)(1 + g2)
(19)
Backward format:
tage 1 :P3
(P1 + P2)= exp
(˛1 +
∑ˇiXi
)= g1 (20)
tage 2 :P2
P1= exp
(˛2 +
∑ˇjXj
)= g2 (21)
1 = 1(1 + g1)(1 + g2)
(22)
2 = g2(1 + g1)(1 + g2)
(23)
3 = g11 + g1
(24)
.2. Measures of model performance
Typical measures of model performance for goodness of fit andrediction accuracy are likelihood ratio test and classification table,espectively. These measures of model performance are syntheti-ally considered to assess crash severity prediction models in rainyeather condition.
The likelihood ratio (LR) test reveals whether or not global nullypothesis for a specific model is rejected. In other words, anstimated model containing at least one non-zero parameter coef-cient is better fit than constant only model when P-value of LRest is less than a conventional criterion.
Standard logistic regression model classifies an observation asn event if the estimated probability of this observation is greaterhan or equal to a given cut-point. Otherwise, it is classified as aon-event. In the statistical term, the rate of actual events that arelso predicted to be events is called sensitivity. Similarly, the rate ofctual non-events that are also predicted to be non-events is calledpecificity. The overall predictive power of a model depends on theroportion of correctly predicted observations (i.e., the sum of sen-itivity and specificity). The classification table for the predictionccuracy is as follows.
Predicted event Predicted non-event
Actual event Sensitivity False negativeActual non-event False positive Specificity
Even though the predictive power of a model can be measuredor all severity levels, sensitivity and false negative rate are oftenmphasized for the highest crash severities (fatal and incapaci-ating injuries) because of their resulting economic loss. Hence, a
odel that produces high sensitivity and low false negative ratet the classification stage for fatal and incapacitating injuries isonsidered as a good one.
Note that the classification accuracy is dependent on the prob-bility cut-point since the model classifies an observation basedn the given probability cut-point. The probability cut-point of 0.5an be considered first assuming an equal opportunity for observ-ng event or non-event. However, the value of 0.5 may yield low
odel accuracy. In reality, more severe crashes (event) do notrequently occur compared with less severe crashes (non-event),hich implies the probability cut-point of 0.5 is too high to be used
n the prediction model. From this perspective, the probability cut-oint may be determined by practical consideration. Since desirablerediction models should fit the field data well, the probability cut-oint used in this study is the proportion of actual events in the fieldata.
revention 42 (2010) 213–224 219
5. Results and discussion
In this study, PROC LOGISTIC statement in SAS 9.1 was used toestimate ordinal logistic regression and sequential logistic regres-sion models on the basis of rain-related single-vehicle crashes witha significance level of 0.10 for retaining explanatory variables in themodels. The modeling process is as follows.
First of all, bivariate logistic regression of each explanatoryvariable was performed to choose an individual predictor oneby one which correlated to crash severity. Especially for ordinallogistic regression model, the individual predictor that was alsosatisfied with proportional odds assumption was selected in thestep of bivariate logistic regression. In this study, six continuousweather-related variables were considered: 15-min rainfall inten-sity, wind speed, temperature, water film depth, SSD, and DCD.Since weather effect on crash severity is the primary interest ofthis study, the continuous weather data were specifically trans-formed to a categorical variable by quantile if any continuousweather variable was not selected by the bivariate logistic regres-sion.
Next, correlation between predictors selected by the bivariatelogistic regression was identified by Pearson’s correlation coef-ficient or likelihood ratio chi-squared test in order not to omitsignificant predictors in multiple logistic regression models. Afterthe correlation test, several combinations that contain the maxi-mum number of uncorrelated predictors were constructed for thenext step.
Finally, stepwise variable selection was conducted to select thebest multiple logistic regression model. Using the best-fitted model,a classification table by the model was produced at a given prob-ability cut-point to check prediction power of the fitted model.Given an appropriate probability cut-point, the fitted model pro-duces reasonable prediction accuracies for both actual events andactual non-events. In this study, the probability cut-point is deter-mined by the proportion of actual events to total observations ateach modeling stage because desirable prediction models shouldfit the field data well and the probability cut-point should reflectthe field data condition.
5.1. Ordinal logistic regression model
The proportional odds assumption in the best model provided inTable 3 was not rejected, which means that ordinal logistic regres-sion is appropriate to the response outcomes. P-value of LR testrevealed quite small value in Table 3, indicating the global nullhypothesis is rejected.
The odds of response categories for types K and A vs. types B, Cand PDO or for injury vs. PDO were 0.041 times higher for wear-ing safety belt than for not wearing safety belt, implying crashseverity reduction by the safety belt. The odds ratio for postedspeed limit was positive, but close to 1, indicating slight effecton increasing crash severity at higher posted speed limit. All thesignificant parameter effects were consistent to general expecta-tion.
The probability cut-point to classify the predicted event wasbased on the proportion of actual event observations to total obser-vations. That is, the probability cut-point was 0.26 to predict injurycrash severity (event) while the probability cut-point was 0.04 topredict the fatal and incapacitating injury crash severity (event).For two event comparisons, reasonable overall prediction accura-cies for total observations were produced. However, sensitivity was
50% particularly for fatal and incapacitating injury crashes vs. oth-ers at the reasonable overall prediction accuracy of 65%, whichmeans that the prediction power of ordinal logistic regressionwas not sufficiently strong for the highest level of crash sever-ity.
220 S. Jung et al. / Accident Analysis and Prevention 42 (2010) 213–224
Table 3Multiple ordinal logistic regression model.
ChiSq D.F. Pr > ChiSq
Score test 4.5793 2 0.1130LR test 48.3070 2 <0.0001
Parameter Estimate S.E. Odds ratio Pr > ChiSq
MLE
Intercept 3 −4.2021 1.4022 – 0.0027Intercept 2 −1.4351 1.0581 – 0.3037Safety belt −3.1990 0.5345 0.041 <0.0001Speed limit 0.0580 0.0233 1.060 0.0130
Classification Event Non-event Overall accuracy
Others vs. PDO (Pcutoff = 0.26)Correct = 41 Incorrect = 26 Correct = 135 Incorrect = 53 69%Sensitivity Specificity False POS False NEG61% 72% 56% 16%
Correct = 5 Incorrect = 5 Correct = 161 Incorrect = 84 65%
N false n
5
wbraPmf
TM
Nf
K + A vs. Others (Pcutoff = 0.04) Sensitivity Specificity50% 66%
ote. MLE: maximum likelihood estimate; false POS: false positive rate; false NEG:
.2. Sequential logistic regression model
The modeling process of sequential logistic regression modelas identical to that of ordinal logistic regression. The differences
etween the sequential logistic regression and the ordinal logisticegression were the use of sub-sample and variant sets of predictors
cross stages for the sequential logistic regression. In other words,DO crashes were removed at the second stage in the forward for-at while fatal and injury crashes were removed in the backwardormat.
able 4ultiple model for forward format of sequential logistic regression.
Stage 1
ChiSq D.F.
LR test 22.4048 3
Parameter Estimate
MLE
Intercept 1 −3.5445FD 2.6658LSW 0.2436FD × LSW −0.2247
Event
Classification (Pcutoff = 0.26)Correct = 48 Incorrect = 19Sensitivity Specificity72% 56%
Stage 2
ChiSq D.F.
LR test 12.8808 3
Parameter Estimate
MLE
Intercept −2.3430SSD 0.0050Wind speed 2 −1.4784Vehicle type 1 −1.5171
Event
Classification (Pcutoff = 0.17)Correct = 8 Incorrect = 2Sensitivity Specificity80% 78%
ote. FD: female driver; LSW: left shoulder width; FD × LSW: interaction of female driverrom 6 km/h to 18 km/h; Vehicle type 1: passenger car.
False POS False NEG94% 3%
egative rate.
5.2.1. Forward formatBased on low P-values of LR test in Table 4, the global null
hypothesis was rejected at both stages, indicating the estimatedmodels were better to predict crash severities than constant onlymodel.
At the first stage, female drivers were much more likely to be
involved in more severe crashes than PDO crashes based on the highodds ratio. An interesting effect of left shoulder width was identi-fied. The odds ratio for left shoulder width was approximately 1.3,implying wide left lane was more likely to increase crash sever-Pr > ChiSq
<0.0001
S.E. Odds ratio Pr > ChiSq
0.7718 – <0.00010.9072 14.3794 0.00160.0769 1.2758 0.00150.0950 0.7987 0.0180
Non-event Overall accuracy
Correct = 105 Incorrect = 83 60%False POS False NEG63% 15%
Pr > ChiSq
0.0049
S.E. Odds ratio Pr > ChiSq
1.5934 – 0.14140.0027 1.005 0.08960.8929 0.228 0.09780.8156 1.085 0.0629
Non-event Overall accuracy
Correct = 44 Incorrect = 13 78%False POS False NEG62% 4%
with left shoulder width; SSD: stopping sight distance; Wind speed 2: wind speed

S. Jung et al. / Accident Analysis and Prevention 42 (2010) 213–224 221
Table 5Multiple model for backward format of sequential logistic regression.
Stage 1
ChiSq D.F. Pr > ChiSq
LR test 34.5496 4 <0.0001
Parameter Estimate S.E. Odds ratio Pr > ChiSq
MLE
Intercept −0.4724 0.4839 – 0.4866RI 0.5806 0.1655 1.787 0.0005Wind speed 2 −2.5170 1.0440 0.081 0.0159Terrain 3 2.7768 1.1082 16.067 0.0094Safety belt −4.2795 1.0090 0.014 <0.0001
Event Non-event Overall accuracy
Classification (Pcutoff = 0.04)Correct = 9 Incorrect = 1 Correct = 214 Incorrect = 31 88%Sensitivity Specificity False POS False NEG90% 87% 78% 0.5%
Stage 2
ChiSq D.F. Pr > ChiSq
LR test 41.8949 2 <0.0001
Parameter Estimate S.E. Odds ratio Pr > ChiSq
MLEIntercept 1.6464 0.7680 – 0.0321Female driver 1.1858 0.3419 3.273 0.0005Safety belt −3.6222 0.7986 0.027 <0.0001
Event Non-event Overall accuracy
Classification (Pcutoff = 0.23)Correct = 39 Incorrect = 18 Correct = 128 Incorrect = 60 68%Sensitivity Specificity False POS False NEG
N /h; Te
iHld
fsihlcblt
itOcts
5
ltg
icft
68% 68%
ote. RI: 15-min rainfall intensity; Wind speed 2; wind speed from 6 km/h to 18 km
ty from PDOs to injuries, which is opposite to general expectation.owever, the odds ratio for the interaction with female drivers was
ess than 1, which implies that wide left shoulder can be helpful toecrease injury crashes especially for female drivers.
Weather factors were more explicitly identified at stage two oforward sequential logistic regression than ordinal logistic regres-ion. At the second stage, severe crashes including types K and Ancreased slightly as stopping sight distance increased. On the otherand, the second class of wind speed from 6 km/h to 18 km/h was
ikely to decrease the most severe crashes. The effect of wind speedould be caused by drivers’ cautions due to low visibility derivedy moderately strong wind in the rainfall. Passenger cars were also
ess likely to be involved in the most serious crashes than otherypes of vehicles.
The probability cut-point was 0.26 to predict injury crash sever-ty (event) at the first stage while the probability cut-point was 0.17o predict the fatal and incapacitating injury crash severity (event).verall prediction accuracies were reasonable at both stages. Espe-ially, sensitivity at the second stage was 80%, which is much higherhan the sensitivity for the fatal and incapacitating injury crasheverity in ordinal logistic regression.
.2.2. Backward formatTable 5 shows the best model selected by backward sequential
ogistic regression. Small P-values in LR test at both stages revealshat the selected model provided in Table 5 is better fit than thelobal null model.
Weather-related factors were identified to predict fatal andncapacitating injury crash severity at stage one. The most severerashes were 1.787 times more likely to occur as rainfall intensityor 15 min was getting stronger. This result implies that driversend to less sensitively perceive the risk of driving by the rainfall
61% 12%
rrain 3: horizontal/vertical curve.
intensity. However, wind speed effect on the highest crash severityin backward format was consistent to the effect in forward for-mat. That is, the odds ratio for the second class of wind speedfrom 6 km/h to 18 km/h was less than 1, indicating moderatelystrong wind speed is likely to decrease the fatal and incapacitatinginjury crashes. Also note that the odds ratio for horizontal/verticalcurves was extremely higher than 1, which indicates that the hor-izontal/vertical curves increases the likelihood of the most severecrashes in rainy weather. At stage two, female driver was morelikely to be involved in types B and C crashes in rainy weather thanmale driver based on the positive parameter estimate and the cor-responding odds ratio. At both stages, wearing safety belt decreasedmore severe crashes.
At stage one, 0.04 was used as the probability cut-point to pre-dict fatal and incapacitating injury crash severity (event) while 0.23was used to predict non-incapacitating and possible injury crashseverity (event) at stage two. According to Table 5, overall predic-tion accuracies were 88% at the first stage and 68% at the secondstage, which are reasonable. In particular, the first stage shows thehighest sensitivity (90%) and overall prediction accuracy of all therates provided by ordinal and sequential logistic regression models.Additionally, false negative rate at stage one was found to be thelowest of all false negative rates from ordinal and sequential logis-tic regression models. These prediction accuracy rates at the firststage imply that backward format is the most desirable to predictcrash severity levels especially for fatal and incapacitating injurycrash severity.
Comparing multiple regression results based on goodness of fit,parameter significance and prediction accuracies, on the whole, thebackward sequential logistic regression model outperforms ordi-nal and forward sequential logistic regression models in predictingcrash severity levels in rainy weather. Specifically, the backward

222 S. Jung et al. / Accident Analysis and P
Table 6Crash frequencies and coding in study area in clear weather.
Crash severity Frequency Category coding
Stage 1 Stage 2
Fatal and incapacitating injury 30 1 –Non-incapacitating and possible injury 175 0 1PDO 350 0 0
storwwfberih
5
utton
Additionally, median related collisions increased the likelihood of
TM
N
Total 555 555 525
equential logistic regression model was found to be compara-ively effective to predict the highest level of crash severity basedn the overall prediction accuracy, sensitivity and false negativeate. Moreover, 15-min rainfall intensity impact on crash severityas significantly identified in the backward format and wind speedas more significant in the backward format than in the forward
ormat. In addition, the estimated parameter coefficients in theackward sequential model consistently agree with the commonxpectations. Therefore, the backward format of sequential logisticegression model is recommended as the final model for predict-ng all levels of single vehicle crashes that occurred on high-speedighways in rainy weather.
.3. Comparison of clear weather crash severity
The goal of comparing rainy and clear weather conditionssing the best crash severity prediction model is to identify fac-
ors that are independent of weather conditions. In this study,he clear weather condition indicates dry pavement under clearr cloudy weather, when rainfall and other weather factors doot exist. Crash data in clear weather condition only were sepa-able 7ultiple model for backward sequential logistic regression (clear weather).
Stage 1
ChiSq D.F.
LR test 38.7058 4
Parameter Estimate
MLE
Intercept −10.1080Speed limit 0.1316LGT 3 2.3159Safety belt −1.1575SFTB × LGT 3 −1.7601
Event
Classification (Pcutoff = 0.05)Correct = 23 Incorrect = 7Sensitivity Specificity77% 63%
Stage 2
ChiSq D.F.
LR test 15.2776 2
Parameter Estimate
MLEIntercept −0.9102Spring season −0.5682Collision type 1 0.5936
Event
Classification (Pcutoff = 0.33)Correct = 89 Incorrect = 86Sensitivity Specificity51% 63%
ote. LGT 3: night but street light; SFTB: safety belt; Collision type 1: median related coll
revention 42 (2010) 213–224
rately collected. In other words, crash data used in rainy weathermodel were not included in modeling clear weather crash severity.Study area, data sources, data collection duration, variable coding,and modeling process were the same as those of the backwardsequential logistic regression model that was selected as the bestmodel format to account for rainy weather effect on crash sever-ity levels. Crash frequency for the clear weather is presented inTable 6.
The best multiple regression model for clear weather conditionis provided in Table 7. At the first stage, the odds ratio for postedspeed limit was greater than 1, indicating that higher posted speedlimit increased the likelihood of fatal and incapacitating injurycrashes. In particular, the odds ratio for street lighting at night wasapproximately 10, implying street light condition at night has highpotential to increase fatal and incapacitating injury crashes in clearweather. At night, glaring caused by street lighting might affectthe strong street light effect on increasing the most severe crashes.However, interaction of the street lighting at night with safety beltwas significantly identified to decrease the most severe crashes,which implies that safety belt can be effective to improve high-way safety under the street lighting at night. The effect of wearingsafety belt on decreasing crash severity was consistent regardlessof weather conditions.
At the second stage, the odds ratio of possible/non-incapacitating injury crashes to being PDO crashes was 0.567for spring season. Intuitively, this seasonal factor is expected tobe an excellent indicator representing weather conditions. It isplausible that crash severity is affected by weather conditions.
possible/non-incapacitating injury crashes.The overall prediction accuracies were reasonable at both
stages: 64% with event classification probability cut-point of 0.05 atstage one and 60% with event classification probability cut-point of
Pr > ChiSq
<0.0001
S.E. Odds ratio Pr > ChiSq
2.6479 – 0.00010.0421 1.141 0.00170.7182 10.134 0.00130.5665 0.314 0.04100.8779 0.172 0.0450
Non-event Overall accuracy
Correct = 332 Incorrect = 193 64%False POS False NEG89% 2%
Pr > ChiSq
0.0005
S.E. Odds ratio Pr > ChiSq
0.1496 – <0.00010.2460 0.567 0.02090.1902 1.811 0.0018
Non-event Overall accuracy
Correct = 222 Incorrect = 128 60%False POS False NEG59% 28%
isions.

s and P
0amc
6
gsprrcitcpccdtsii
mmfsspwfiibwhbci
acacflabsoclaasri
A
M
S. Jung et al. / Accident Analysi
.33 at stage two. In addition to the overall accuracies, sensitivitiest both stages were also reasonable, implying backward sequentialodel are effective to predict more severe crashes (event) even in
lear weather.
. Conclusions
Even though rainfall effect on crash severity has been investi-ated in previous studies, the rainy weather-related factors in thetudies lack the accuracy and sophistication to reflect real-timeavement surface conditions and visibility practically during theainfall. For instance, wet or dry pavement surface, average annualainfall precipitation, and even hourly rainfall are not sufficient toapture the real-time rainy weather conditions prior to or dur-ng the crash occurrence. Using more microscopic weather data,his study assessed rainfall effect on the severities of single vehiclerashes on the selected Wisconsin interstate highways. To com-rehensively characterize weather conditions and their effects onrash occurrences, this study used several novel variables at therash moment, in particular, 15-min rainfall intensity, water filmepth, stopping sight distance, and deficiency of car-following dis-ance that have not been frequently considered in the previoustudies. In addition, estimated or measured weather factors werenterpolated between three weather stations by inverse squarednterpolation method for each crash location.
In this study, both ordinal and sequential logistic regressionodels were applied to predict crash severity that is a polychoto-ous response. The sequential logistic regression models were
urther divided into the forward format from the lowest injuryeverity to the highest one and the backward format reversing theequence. Additionally, the severity of crashes occurring on dryavement in cloudy or clear weather was estimated to compareith its counterpart in rainy condition. As a result, the backward
ormat of sequential logistic regression model outperformed othersn predicting crash severity levels, especially fatal and incapacitat-ng injuries, and detected rainfall effect on the severities. In theackward sequential logistic regression model, following variablesere significantly identified: 15-min rainfall intensity, wind speed,orizontal/vertical curve, female driver, and safety belt usage. Theackward format produced the highest prediction accuracy andlearly significant weather effect especially on fatal and incapac-tating injury prediction.
Note that ordinal logistic regression imposes restrictions thatll parameter estimates have to be the same and only the inter-ept is allowed to be different while sequential logistic regressionsllows variant parameter estimates for different response out-omes. In other words, the sequential logistic regression is moreexible to reflect variant predictor effects on response categoriesnd to predict the response accurately for this study. Thus, theackward sequential logistic regression model, specifically, is con-idered to be the most appropriate for determining the probabilityf crash severity in rainy weather. In addition, a seasonal indi-ator was significant in the clear weather backward sequentialogistic regression model. This implies that weather condition mayffect crash severity outcomes because the weather condition isssociated with the seasonal factor. The resultant findings in thistudy can be used to provide quantitative support on improvingoad weather safety via weather warning systems, highway facilitymprovements, and speed limit management.
cknowledgement
The authors thank Andrea Bill at the University of Wisconsin-adison for her contribution to this paper.
revention 42 (2010) 213–224 223
References
Abdel-Aty, M., 2003. Analysis of driver injury severity levels at multiple locationsusing ordered Probit models. Journal of Safety Research 34 (5), 597–603.
Abdel-Aty, M., Pemmanaboina, R., 2006a. Calibrating a real-time traffic crash pre-diction model using archived weather and ITS traffic data. IEEE Transactions onIntelligent Transportation Systems 7 (2), 167–174.
Abdel-Aty, M., Pemmanaboina, R., Hsia, L., 2006b. Assessing crash occurrence onurban freeways by applying a system of interrelated equations. TransportationResearch Record 1953, 1–9.
Agresti, A., 1996. An Introduction to Categorical Data Analysis. John Wiley & Sons,Inc., New York.
Caliendo, C., Guida, M., Parisi, A., 2007. A crash-prediction model for multilane roads.Accident Analysis and Prevention 39 (4), 657–670.
Dissanayake, S., Lu, J., 2002. Analysis of severity of young driver crashes: sequen-tial binary logistic regression modeling. Transportation Research Record 1784,108–114.
Donnell, E.T., Mason Jr., J.M., 2004. Predicting the severity of median-related crashesin Pennsylvania by using logistic regression. Transportation Research Record1897, 55–63.
Eluru, N., Bhat, C.R., Hensher, D.A., 2008. A mixed generalized ordered responsemodel for examining pedestrian and bicyclist injury severity level in trafficcrashes. Accident Analysis and Prevention 40 (3), 1033–1054.
Friction coefficient: http://www.engineershandbook.com/Tables/frictioncoefficients.htm.
Golob, T.F., Recker, W.W., 2003. Relationships among urban freeway accidents, trafficflow, weather, and lighting conditions. Journal of Transportation Engineering129 (4), 342–353.
Hill, J.D., Boyle, L.N., 2006. Assessing the relative risk of severe injury in automotivecrashes for older female occupants. Accident Analysis and Prevention 38 (1),48–154.
Keinbaum, D.G., Klein, M., 2002. Logistic Regression: A Self-Learning Text, 2nd edi-tion. Springer, New York.
Khan, G., Qin, X., Noyce, D.A., 2008. Spatial analysis of weather crash patterns, ASCE.Journal of Transportation Engineering 134 (5), 191–202.
Kim, J., Kim, S., Ulfarssonb, G.F., Porrello, L.A., 2007. Bicyclist injury severitiesin bicycle–motor vehicle accidents. Accident Analysis and Prevention 39 (2),238–251.
Khorashadi, A., Niemerier, D., Shankar, V., Mannering, F.L., 2005. Differences inrural and urban driver-injury severities in accidents involving large-trucks: anexploratory analysis. Accident Analysis and Prevention 37 (5), 910–921.
Kokkalis, A.G., Panagouli, O.K., 1998. Factual evaluation of pavement skid resistancevariation: surface wetting from chaos. Chaos, Solitons and Fractals 9 (11), 1875–1890.
Lee, J., Mannering, F.L., 2002. Impact of roadside features on the frequency and sever-ity of run-off-roadside accidents: an empirical analysis. Accident Analysis andPrevention 34 (2), 149–161.
Maddala, G.S., 1983. Limited-Dependent and Qualitative Variables in Econometrics.Cambridge University Press, New York.
Malyshkina, N.V., Mannering, F.L., 2009. Markov switching multinomial logit model:an application to accident-injury severities. Accident Analysis and Prevention 41(4), 829–838.
Milton, J.C., Shankar, V.N., Mannering, F.L., 2008. Highway accident severities andthe mixed logit model: an exploratory empirical analysis. Accident Analysis andPrevention 40 (1), 260–266.
Pai, C., Saleh, W., 2008. Modeling motorcyclist injury severity by various crash typesat T-junctions in the UK. Safety Sciences 46, 1234–1247.
Patrick, N.A., Stephenson, D., 1990. Spatial variation of rainfall intensities for shortduration storms. Hydrological Science 35, 667–680.
Peterson, B., Harrell Jr., F.E., 1990. Partial proportional odds model for ordinalresponse variables. Applied Statistics 39 (2), 205–217.
Press, W.H., Teukolsky, S.A., Vetterling, W.T., Flannery, B.P., 2007. Numerical Recipes:The Art of Scientific Computing, 3rd edition. Cambridge University Press, NewYork.
Qin, X., Noyce, D.A., Lee, C.Y., 2006. Snowstorm event-based crash analysis. Trans-portation Research Record 1948, 135–141.
Roess, R.P., Prassas, E.S., Mcshane, W.R., 2004. Traffic Engineering, 3rd edition. Pear-son Education, Inc., New Jersey.
Russam, K., Ross, N.F., 1968, The Depth of Rain Water on Road Surfaces, Ministry ofTransport Report No. LR 236. Road Research Laboratory.
SAS Institute Inc., 1998. Logistic Regression Examples Using the SAS System. Publi-cations Division of SAS Institute Inc., SAS Campus Drive, Cary, NC 27513.
Savolainen, P.T., Tarko, A.P., 2005. Safety impacts at intersections on curved seg-ments. Transportation Research Record 1908, 130–140.
Savolainen, P., Mannering, F.L., 2007. Probabilistic models of motorcyclists’ injuryseverities in single- and multi-vehicle crashes. Accident Analysis and Prevention39 (5), 955–963.
Shankar, V., Mannering, F.L., Barfield, W., 1995. Effect of roadway geometrics andenvironmental factors on rural freeway accident frequencies. Accident Analysisand Prevention 27 (3), 371–389.
Shankar, V., Mannering, F.L., 1996. An explanatory multinomial logit analysis ofsingle-vehicle motorcycle accident severity. Journal of Safety Research 27 (3),183–194.
Ulfarsson, G.F., Mannering, F.L., 2004. Differences in male and female injury sever-ities in sport-utility vehicle, minivan, pickup and passenger car accidents.Accident Analysis and Prevention 36 (2), 135–147.

2 s and Prevention 42 (2010) 213–224
W
WW
24 S. Jung et al. / Accident Analysi
ang, X., Abdel-Aty, M., 2008. Analysis of left-turn crash injury severity by con-flicting pattern using partial proportional odds models. Accident Analysis andPrevention 40 (5), 1674–1682.
eather Underground Inc., 2009. http://www.wunderground.com/US/WI/.isconsin Traffic Crash Facts, 1999–2005, Wisconsin Department of Transportation.
Yau, K.K.W., 2004. Risk factors affecting the severity of single vehicle traffic accidentsin Hong Kong. Accident Analysis and Prevention 36 (3), 333–340.
Yau, K.K.W., Lo, H.P., Fung, S.H.H., 2006. Multiple-vehicle traffic accidents in HongKong. Accident Analysis and Prevention 38 (6), 1157–1161.