access to housing finance in africa: exploring · pdf fileaccess to housing finance in africa:...
TRANSCRIPT

ACCESS TO HOUSING FINANCE IN AFRICA: EXPLORING THE ISSUES
KENYA
Overview of the housing finance sector in Kenya, commissioned by the FinMark Trust with support from
Dr J G Mutero1 Matrix Development Consultants
December 2007
1 This report, prepared by Dr J. G. Mutero, draws in part from previous reports co-authored with Mr Graham Alder of Matrix Development
Consultants.
ACCESS to
housing
finance in
Africa

Access to housing finance in Africa: exploring the issues Kenya
J G Mutero, Matrix Development Consultants, for the FinMark Trust (December 2007) 2
BACKGROUND TO THE SERIES Since 2002, the FinMark Trust has been pursuing its mission, “Making Financial Markets Work for the Poor”, first in the Southern African Customs Union (SACU) countries and now throughout Africa. An independent trust with core funding from the UK Department for International Development (DFID), FinMark Trust aims to promote and support policy and institutional development towards the objective of increasing access to financial services by the un- and under-banked in Africa. A key product developed by the FinMark Trust is FinScope™, a national-level survey of individual usage of
financial services, now being undertaken in eleven African countries.2 FinScope™ will provide baseline data to
stimulate policy change and support innovation by commercial providers seeking to deliver products and services sustainably to consumers who are currently outside the formal financial system. FinMark Trust will
build on the impact of FinScope™ by promoting and supporting change processes across the continent.3
FinMark Trust’s Housing Finance theme area
4 conducts research and engages with sector stakeholders in the
promotion of innovative housing finance mechanisms to enhance access to housing finance for the poor. Broadly, the housing finance theme’s activities can be separated into the following categories: - Understanding the housing asset - Exploring housing finance innovation - Understanding issues relating to housing finance in Africa This report is the third of a series of studies which will explore access to housing finance in various African countries (earlier reports consider housing finance sectors in Zambia and Botswana). It is meant as an input into a larger debate about how to enhance access to housing poor by low and moderate income earners throughout Africa. Comments and contributions can be sent to the FinMark Trust’s Housing Finance Theme Champion, Kecia Rust on [email protected]. The FinMark Trust hopes that its research into access to housing finance in Africa will begin to shed some light on the key issues facing the poor as they seek to mobilise the finance necessary to access adequate and affordable housing.
Country Profile: Kenya5
! Population: 34,3 million (World Bank 2005) ! Capital: Nairobi ! Area: 582 646 sq km (224 961 sq miles) ! Major language: Swahili, English ! Major religions: Christianity ! Monetary unit: 1 Kenya shilling = 100 cents ! Main exports: Tea, coffee, horticultural products, petroleum products ! GNI per capita: US $580 (World Bank 2005)
2 FinScope™ is a nationally representative study of consumers’ perceptions on financial services and issues, which creates
insight to how consumers source their income and manage their financial lives. The sample covers the entire adult population, rich and poor, urban and rural, in order to create a segmentation, or continuum, of the entire market and to lend perspective to the various market segments. FinScope™ explores consumers’ usage of informal as well as formal products and builds a picture of the role that the informal sector can play in the financial markets of developing countries. Since FinScope™ is a perceptual study, it also encompasses attitudes, behaviours, quality of life factors and consumption patterns. See www.finscope.co.za 3 By 2012 it is intended that some 20 countries in Africa will have the survey. Repeat studies will take place on 2-3 year
cycles, enabling trends within countries to be monitored and providing the basis for cross-country comparison especially around access to finance. FinScope™ data will provide financial service providers and regional integration initiatives with comparable, standard and reliable data about demand for financial services across borders. (FinScope™ Africa Brochure) 4 To go to the housing finance theme page, go to www.finmark.org.za, click on “themes” and then click on “housing finance”.
5 From FinScope™ website.

Access to housing finance in Africa: exploring the issues Kenya
J G Mutero, Matrix Development Consultants, for the FinMark Trust (December 2007) 3
Exploring housing finance in KENYA For its level of development, Kenya has a well-developed and regulated financial system and, in recent years, the mortgage finance sector has become competitive and innovative. But this sector serves only those households at the top of the income pyramid. The most critical challenges in housing finance lie in developing ways to make finance accessible to the poor. NGOs such as NACHU have built the capacity to mobilize low income groups to organize into legally recognized bodies, to save regularly, to repay in loans in a timely fashion and, with some technical assistance, to act as housing developers. With these in place the main challenge is to supply sufficient finance as effective demand by far outstrips supply. Although some efforts have been made in this direction, they remain modest and of limited impact. To go to scale, it is important to develop institutional mechanisms for expanding substantially the volume of housing microfinance, primarily through the capital market. Dr J G Mutero of Matrix Development Consultants in Kenya, prepared this report in the latter half of 2007. The report is largely based on a desk review of existing sources and draws in part from previous reports co-authored with Mr Graham Alder of Matrix Development Consultants. The intent of this document is to provide a general overview of Kenya’s housing finance sector with a particular emphasis on how it functions with respect to the needs of low income earners. The report is neither definitive nor exhaustive – but rather a basis for engaging in further discussion regarding the housing finance sector in Kenya. Comments, challenges and perspectives are welcome. Comments or questions should be directed to the FinMark Trust’s Housing Finance Theme Champion, Kecia Rust, by email to [email protected], or on +27-83-785-4964. EXPLORING HOUSING FINANCE IN KENYA ......................................................................................................3 OVERVIEW OF KENYA’S MACRO ECONOMY....................................................................................................4 KENYA’S REGULATORY FRAMEWORK FOR FINANCE ...................................................................................7 EMPLOYMENT, HOUSEHOLD INCOMES AND INCOME INEQUALITY.............................................................8 HOUSING DEMAND AND SUPPLY.......................................................................................................................9 OVERVIEW OF THE HOUSING FINANCE SECTOR..........................................................................................14 CONCLUSIONS....................................................................................................................................................26 REFERENCES......................................................................................................................................................28 ANNEX 1: INFORMAL HOUSING FINANCE IN NAIROBI.................................................................................30 Acronyms and Abbreviations
AGM Annual general Meeting
CDC Commonwealth Development Corporation
CMA Capital Markets Authority
EABS East African Building Society
EIU Economist Intelligence Unit
GDP Gross Domestic Product
HFCK Housing Finance Company of Kenya (now Housing
Finance)
HFI Housing Finance Institution
IMF International Monetary Fund
JB Jamii Bora
KASP Kenya Affordable Shelter Project
KBS Kenya Building Society
KENSUP Kenya Slum Upgrading Programme
LAs Local Authorities
MESPT Micro-Enterprise Support Programme Trust
NACHU National Cooperative Housing Union
NBFIs Non-Bank Financial Institutions
NCC Nairobi City Council
NHC National Housing corporation
NSSF National Social Security Fund
RBA Retirement Benefits Authority
SACCOs Savings and Credit Cooperatives
SDR Special Drawing Rights
S&L Savings and Loan
SME Small and Medium enterprise
UN-HABITAT United Nations Human Settlements Programme
USAID United States Agency for International
Development.
Access to housing finance in Africa: exploring the issues Kenya
J G Mutero, Matrix Development Consultants, for the FinMark Trust (December 2007) 4
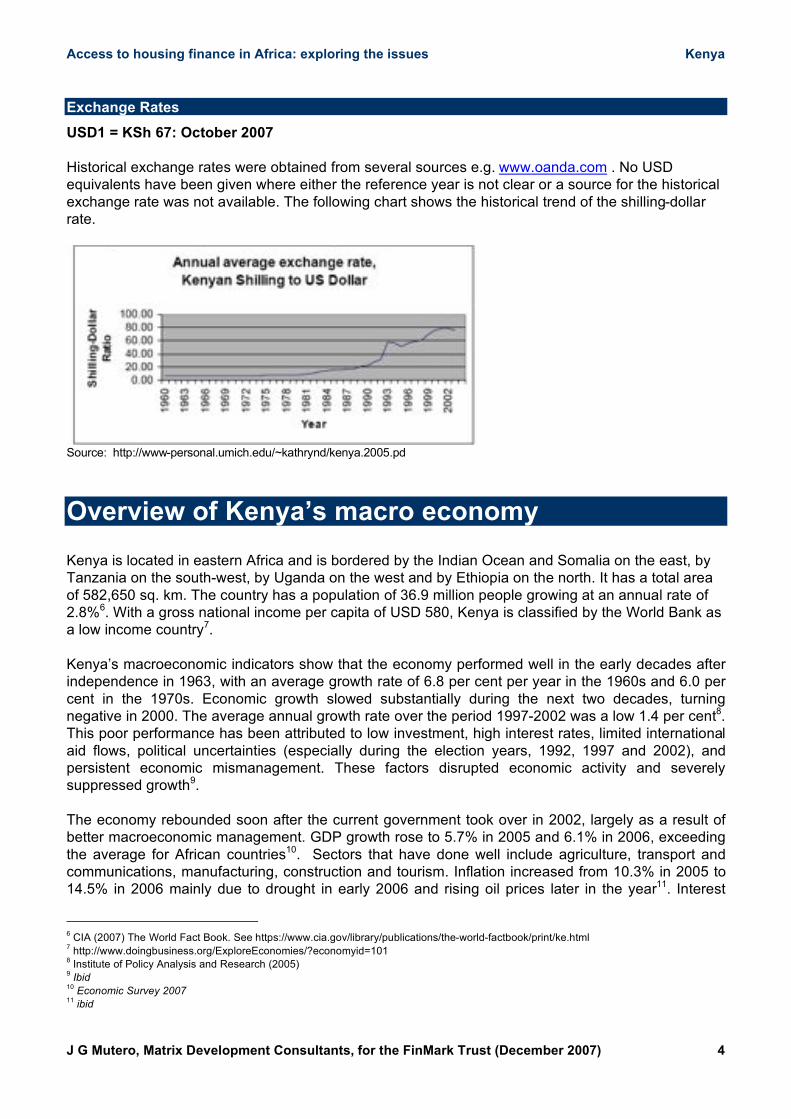
Exchange Rates
USD1 = KSh 67: October 2007
Historical exchange rates were obtained from several sources e.g. www.oanda.com . No USD equivalents have been given where either the reference year is not clear or a source for the historical exchange rate was not available. The following chart shows the historical trend of the shilling-dollar rate.
Source: http://www-personal.umich.edu/~kathrynd/kenya.2005.pd
Overview of Kenya’s macro economy
Kenya is located in eastern Africa and is bordered by the Indian Ocean and Somalia on the east, by Tanzania on the south-west, by Uganda on the west and by Ethiopia on the north. It has a total area of 582,650 sq. km. The country has a population of 36.9 million people growing at an annual rate of 2.8%6. With a gross national income per capita of USD 580, Kenya is classified by the World Bank as a low income country7. Kenya’s macroeconomic indicators show that the economy performed well in the early decades after independence in 1963, with an average growth rate of 6.8 per cent per year in the 1960s and 6.0 per cent in the 1970s. Economic growth slowed substantially during the next two decades, turning negative in 2000. The average annual growth rate over the period 1997-2002 was a low 1.4 per cent8. This poor performance has been attributed to low investment, high interest rates, limited international aid flows, political uncertainties (especially during the election years, 1992, 1997 and 2002), and persistent economic mismanagement. These factors disrupted economic activity and severely suppressed growth9. The economy rebounded soon after the current government took over in 2002, largely as a result of better macroeconomic management. GDP growth rose to 5.7% in 2005 and 6.1% in 2006, exceeding the average for African countries10. Sectors that have done well include agriculture, transport and communications, manufacturing, construction and tourism. Inflation increased from 10.3% in 2005 to 14.5% in 2006 mainly due to drought in early 2006 and rising oil prices later in the year11. Interest
6 CIA (2007) The World Fact Book. See https://www.cia.gov/library/publications/the-world-factbook/print/ke.html
7 http://www.doingbusiness.org/ExploreEconomies/?economyid=101
8 Institute of Policy Analysis and Research (2005)
9 Ibid
10 Economic Survey 2007
11 ibid
Access to housing finance in Africa: exploring the issues Kenya
J G Mutero, Matrix Development Consultants, for the FinMark Trust (December 2007) 5
rates have risen in tandem with inflation. Tax reforms have substantially raised domestic revenues but the public sector wage bill remains high. The Kenyan shilling continued to rally in 2007, with substantial gains against the dollar and other major currencies. Although the outlook for 2007 and beyond is one of even higher growth, economic performance continues to be hampered by poor transport infrastructure which has deteriorated significantly in the last decade. Financial sector reforms
Government continues to pursue financial sector reforms to strengthen the financial system and to increase the predictability of the business environment. Thus, government has prepared a comprehensive financial sector strategy aimed at improving efficiency in financial intermediation. A part of the strategy is to restructure and privatise state-owned banks. In 2005, a Bank Restructuring and Privatisation Unit was set up in the Ministry of Finance to develop and implement reforms in state-owned banks. Other measures include amendments to the Banking Act and the Central Bank Act to transfer all supervisory and regulatory roles from the Ministry of Finance to the central bank12. The financial intermediation sector grew by 5.5% in 2006, almost double the rate for the previous year (2.8%), driven by the growth of loans and advances by financial institutions, by large investments in banking and insurance, and by a buoyant stock market.13 The Nairobi Stock Exchange
The Nairobi Stock Exchange, though small by international standards, has expanded substantially in recent years, driven by an increasing number of Initial Public Offerings, some the result of privatisation. Market capitalization has grown strongly in the last four years, standing at US$ 11.3 billion in 2006, largely reflecting the recent economic upturn. Performance indicators of the stock exchange are given in Tables 1 and 2. Table 1: Nairobi Stock Exchange: Performance Indicators
Amounts Raised in the Primary Market (Ksh Million)
Year Amount Raised Rights Issue Privatization
1992 496.10 358.00
1993 62.48 62.48
1994 2,600.04 61.90 400.00
1995 124.00 22.00
1996 5,108.00 1,200.00 3,842.00
1997 1,944.60 1,500.00 168.00
1998 1,800.00 1,800.00
1999
2000 997.63 619.63 378.00
2001 1,155.00 30.00 1,125.00
2002 331.21 331.21
2003
2004 2,450.00 2,450.00
2005 2,011.00 2,011.00
2006 9,119.55 9,119.55
Source: Dyer and Blair Investment Bank
12
ibid 13
Ibid p 26.

Access to housing finance in Africa: exploring the issues Kenya
J G Mutero, Matrix Development Consultants, for the FinMark Trust (December 2007) 6
Table 2: Secondary Market: Performance Indicators
Year ‘93 ‘94 ‘95 96 ‘97 ‘98 ‘99 ‘00 ‘01 ‘02 ‘03 ‘04 ‘05 ‘06
Turnover
(US $ Mn)
14.2 84.5 65.1 69.3 104.6 75.6 72.1 46.2 39.7 193.7 201.2 286.2 478.2 1,064.0
Market
Cap. (US $
Mn)
1,056 3,058 1,896 1,800 1,824 2,024 1,409 330 1,200 400 4,200 3,923 6,055 11,338
BONDS
Ksh Bn
0 0 0 0.9 11.5 8.2 6.9 5.9 14.1 33.6 42.0 34.1 13.6 45.5
NSE Index 2513 4559 3468 3114 3115 2962 2303 1913 1355 1363 2738 2956 3973 5670
Source: Dyer and Blair Investment Bank
Banking system: asset growth
Consolidated accounts of the banking system are shown in Table 314. Assets and liabilities grew strongly by 17.8% in 2006, far higher than the 6.7% growth achieved the previous year. Asset expansion was due to a 32.6% growth in net foreign assets, attributable to increased foreign inflows in the form of export earnings, transfers from abroad, foreign investments and increased donor funding. Domestic credit grew by 13.3% as government sought to meet its budgetary obligations. Table 3: Consolidated Accounts of the Banking System 2002-2006 (Ksh million)
14
Source: Economic survey 2007
Access to housing finance in Africa: exploring the issues Kenya
J G Mutero, Matrix Development Consultants, for the FinMark Trust (December 2007) 7
Kenya’s regulatory framework for finance For its level of development, Kenya has a competitive and well-regulated financial market and leads the rest of the region in terms of its banking infrastructure, growth and depth of the capital market, and financial legislation. Financial institutions are regulated by the Central Bank which is the licensing and supervising authority. But building societies are regulated by the registrar of building societies through the Building Societies Act. A recent trend has seen building societies convert into commercial banks, a notable case being the East African Building Society (EABS). By converting into a bank, EABS has been able to engage in business hitherto outside its remit, such as foreign exchange transactions, considered a highly profitable activity. The Capital Markets Authority (CMA), the regulator of the capital market was reinforced in 2005 to strengthen investor confidence. Legislation to regulate microfinance institutions has recently been enacted and regulations for issuing asset-backed securities are in the pipeline, laying the foundation for introducing a secondary mortgage market. A critical drawback is the fragmentation of legislation governing deposit-taking institutions: the Banking Act, to regulate financial institutions, including mortgage institutions; the Microfinance Act, for microfinance businesses; the Building Societies Act; and the Cooperative Act, for savings and credit cooperatives (SACCOs). Although SACCOs are not supposed to take in deposits from non-members, there are many which do as a part of their front office services. For all practical purposes, especially in rural areas, SACCOs act as banks with the exception that they are not members of the clearing house and cannot engage in foreign exchange transactions. A SACCO bill has been mooted to introduce more effective regulation. There is also a proposal to consolidate financial legislation, as is the case in Uganda15.
The Banking Act
(CAP 488)
This Act regulates the conduct and licensing of financial institutions and deposit-taking businesses. It determines which businesses can set up as financial institutions, and sets out licensing conditions especially in term of levels of capitalization in relation to deposits. Further, the Act imposes restrictions on trading and investments by financial institutions, and on the levels of lending relative to capital. The Banking (Amendment) Act of 2006 gives more regulatory powers to the Central Bank relative to the Minister for Finance, a reflection of a policy shift towards greater autonomy for the Central bank.
The Micro-
Finance Act,
2006
This Act provides for the licensing, regulation and supervision of the microfinance business. The Act distinguishes between deposit-taking and non-deposit taking microfinance business, sets out the conditions for licensing by the Central Bank, and describes at length the governance framework for microfinance institutions, as well as how regulation by the Central bank shall be carried out.
The Cooperative
Act, 1998
The object of this legislation is to regulate cooperatives, both primary and secondary. It sets out the conditions of registration, the appointment of a registrar, and rules that a cooperative union or an apex society shall not be registered except with limited liability. The Act also defines the rights and liabilities of members, and defines the duties of cooperatives, for instance in regard to the maintenance of financial records and audit.
Investigations indicate that the regulation of cooperatives, which has seen a number of lapses in the past, has now been tightened. The Co-operative Societies (Amendment) Act, 2004, repeals quite a number of provisions in the earlier Act, but the import of these changes has not been investigated.
15
Discussion with the CEO, MESPT.
Access to housing finance in Africa: exploring the issues Kenya
J G Mutero, Matrix Development Consultants, for the FinMark Trust (December 2007) 8
Building
Societies Act
Building societies are regulated by means of this statute. Historically, the supervisory framework for building societies has been satisfactory, although its application has been neither consistent nor effective. First, the supervision of Housing Finance Institutions (HFIs) appears to have been given a lower priority than that of commercial banks ostensibly because the latter are considered more strategic. Second, the Registrar of Building Societies has generally been short of qualified staff. Third, there is some ambiguity as to how the responsibility of building society supervision is being shared between CBK and the Registrar of Building Societies.
The Capital
Markets Act
(CAP 485A)
The object of the Capital Markets Act is to promote and facilitate the development of an orderly, fair and efficient capital market in Kenya. This is the legislation which created the Capital Markets Authority, giving it the power to promote the development of the capital market.
The Insurance
Act (CAP 487)
The Act regulates the insurance industry and determines the assets that insurance companies may invest in. Because the insurance sector holds substantial funds well-suited for long-term investment, for instance in bonds, the provisions of the Act have important implications for capital mobilization.
Retirement
Benefits Act,
1999
This Act established a Retirement Benefits Authority (RBA) for the regulation, supervision and promotion of retirement benefits schemes, the development of the retirement benefits sector and for connected purposes. The Act allows the Authority to invest in securities. Retirement benefits schemes may also invest in various financial instruments subject to maxima consistent with guidelines issued by the Authority e.g. not more than 70% in quoted securities and 30% in fixed income securities i.e. bonds
16.
Employment, household incomes and income inequality The labour force in the modern sector consists of nearly 2 million people, with most of them in agriculture (75%).17 Total employment outside rural small-scale agriculture and pastoral activities stood at 8.7 million in 200618 but there is a high level of unemployment, estimated to have been 40% in 2001. About a half of the population live below the poverty line although this figure has fallen in recent years especially in urban areas. Box 1, with text adapted from the 2007 Economic Survey, summarises recent trends in employment and earnings. The main message is that the vast majority of jobs are created by the informal sector, a feature that has important implications for housing finance as we see later in the discussion of housing microfinance. Box 1: Recent trends in employment and earnings Analysis of the labour market in 2006 indicates that the economy experienced improved performance in various sectors. Overall, the economy generated 469 000 new jobs (both formal and informal) in the year under review, an increase of 5.7% from the 2005 level. The informal sector created the vast majority of these jobs (87.0% ). In the modern private sector, there was a significant expansion of 4.8% in wage employment mainly attributed to the improved economic environment that prevailed in the year. On the other hand, wage employment in the public sector continued to decline in spite of selective recruitment in the civil service. Employment in the modern sector increased from 1.87 million in 2005 to 1.93 million jobs in 2006, an increase of 2.7%. The additional 51 000 jobs created in this sector arose from improved economic performance mainly in the transport and communications industry. However, there was a decline in employment within the Export Processing Zones (EPZs) of about 2,000 jobs due to closures. The number of jobs created in the private sector went up from 48 000 in 2005 to 55 000 in 2006. This was by far the largest increase in private sector job creation experienced in the last decade and was mainly attributed to a favourable business environment and improved access to credit among other factors. Public sector employment, however, went down from 654
16
Odundo, E. (2003) 17
CIA (2007) 18
Economic Survey 2007

Access to housing finance in Africa: exploring the issues Kenya
J G Mutero, Matrix Development Consultants, for the FinMark Trust (December 2007) 9
000 in the previous year to 650 000 in 2006. The overall growth recorded in modern sector wage employment was 51 000, an increase of 2.8%. Average nominal wages rose by 14.6% in 2006 compared to an increase of 14.4% in 2005. Real average earnings rose marginally by 0.2% in 2006. Source: Economic Survey 2007
There is considerable income inequality, with the highest decile (10%) of the population accounting for 37.3% of incomes and the lowest decile for only 2%19. The Lorenz curve for Kenya and other countries is given in Chart 1, showing the distribution of shares of income by population. Chart 1: Lorenz curve for Kenya and other countries
Source: http://are.berkeley.edu/~rafert/docs/PS2_Answer_Key.pdf
Housing demand and supply Housing demand
Housing demand, commonly referred to as effective demand, seeks to measure the willingness and ability of households to pay for housing. It is a function of many factors: household income, the price (or rent) of a dwelling, financing arrangements (including interest rate and the loan term), and household preferences for different attributes of a dwelling, such as location. There is empirical evidence that households are willing to spend more on housing if they are buying their own house than if they are renting. Housing demand is often contrasted with housing need, a socially derived concept that measures the number of dwellings required to house a population above an arbitrarily determined standard or norm, with no regard for the ability to pay. Estimates of housing need are commonly computed on the basis of the following:
19
CIA (2007)

Access to housing finance in Africa: exploring the issues Kenya
J G Mutero, Matrix Development Consultants, for the FinMark Trust (December 2007) 10
! Housing standards that are considered socially or politically acceptable, e.g. the number of rooms per household of a given size or the minimum floor area per person;
! The existing housing shortfall, measured as the difference between the existing stock and the number of households. More sophisticated estimates also compute the number of rooms needed to decongest the existing housing stock to desirable densities in terms of the number of persons per room or some other measure;
! An allowance for obsolescence, to replace ageing dwellings, commonly set at about 2% of the existing stock; and,
! Projected housing need arising from population growth. This is typically the largest component in rapidly growing cities.
Government has estimated a housing need of 150,000 dwellings per year in Kenya’s urban areas but it is not clear what assumptions underlie this estimate.20 Government further estimates that formal production by the public and private sectors is not more than 30,000 units per year and concludes that the annual deficit of more than 120,000 housing units is met by slum housing.21 The demand for urban housing in Kenya is severely constrained by low incomes relative to housing costs, and the limited financing options available to most households. In Nairobi, with a population of around 3 million people, nearly 60% of households live in slum areas. A recent survey of these settlements showed that 73% of households live below the poverty line.22 Moreover, around 90%23 are tenants, forced into this type of tenure by poor access to land and, in some cases, by the deliberate choice to invest in their rural homes. Slums in Mombasa, the second largest town, are also characterised by high levels of poverty, and renting is the predominant tenure. In the other principal towns the poorest people typically live as tenants in slums except in Kisumu, the third largest town, where the degree of owner-occupation is relatively high24. There are no readily available data on the distribution of household income in urban areas25, the localities where housing markets are typically found, making it difficult to determine what types of housing are affordable26. But income data from the Nairobi slums survey referred to above allow a limited analysis of affordability27. The median household income of the non-poor in these slums was just over Ksh 10,000 (USD 125) in 200428. Households earning this income can afford a dwelling costing Ksh 175,00029 (USD 2,600), equivalent to two rooms built of permanent materials (see Annex 1)30. Tables 4 and 531 set out some of the characteristics of households in Nairobi slums, illustrating the factors that estimates of housing demand by the majority would need to take into account. The information is based on the Nairobi slums survey, already noted.
20
See estimate in http://www.housing.go.ke/kensup.html 21
It must be the case that overcrowding in the existing formal housing stock also helps meet the housing shortage. 22
Gulyani et al. (2006), using an expenditure-based poverty line -- defined as an expenditure of Ksh 3,174 (US$42) per adult equivalent per
month, excluding rent -- find that about 73 percent of the slum households in Nairobi are “poor” and 27 percent are “non-poor.” 23
Mutero, J. et al (2004) 24
A large part of the land in Kisumu’s slums was at one time owned communally, held in trust by the municipal council. Later, this land was
adjudicated and demarcated, and freehold titles issued. 25
The 2006 Kenya Integrated and Household Budget Survey, currently being analysed by the Kenya National Bureau of statistics, should
be able to provide urban income distribution data. 26
As argued later, in reference to Jorgensen (2006), affordability should take future income into account, especially income from subletting 27
In the survey, 1,755 households were randomly drawn for interview from Nairobi’s slums. 28
Gulyani et al. (2006). On page 24 the authors give the monthly per capita income of the non-poor as Ksh 5,500. This is multiplied by
1.88, the average size of non-poor slum households, to obtain household income. 29
Assuming a loan term of 15 years, 15% annual interest and no down payment. 30
In Mwiki, a Nairobi settlement described in Annex 1, a standard sized room of 10’x10’ built of permanent materials would cost roughly
Ksh 85,000 (USD 1,300). 31
Both tables adapted from Gulyani, S. et al. (2006) p. 27

Access to housing finance in Africa: exploring the issues Kenya
J G Mutero, Matrix Development Consultants, for the FinMark Trust (December 2007) 11
Table 4: Slum dwellers in Nairobi: Employment32
%
Unemployed 26
Regular employee 24
Casual employee 25
Own business/own account worker 19
Student/apprentice 4
Pension/investor/sick/handicapped 0.6
Other/don’t know 0.5
Total 100.0
Table 5: Slum Dwellers in Nairobi: Incomes and Expenditures Mean Median
Per capita income per month (Ksh) 3,705 (USD 48.6) 3,000 (USD 39.3)
Per capita expenditure on basic needs in a typical month (Ksh) 2,493 (USD 32.7) 2,000 (USD 26.2)
Rent per month (Ksh) 797 (USD 10.4) 700 (USD 9.2)
Rent as a % of basic household expenditure per month 17.0% 14.6%
Food as a % of basic household expenditure per month 58.8% 52.9%
Water as a % of basic household expenditure per month 4.4% 3.6%
As previously noted, a household would be prepared to pay more for housing were the option to purchase to be offered. But given the very low incomes of the majority of slum dwellers, the bulk of which is spent on food, it is impossible for such households to afford conventional dwellings if only current income is considered. Jorgensen (2006) has demonstrated that where a strong subletting market exists, for instance in Nairobi, even households with virtually no income can afford a housing loan, serviced from subletting income. Housing demand in low-income markets should therefore take into account, not just current income, but future income from subletting. Where other income generating activities are integrated into housing programmes, still more income would be available to service housing loans. That said, it does not appear as if any lenders have responded to this, suggesting an area for future growth.
As in most developing countries, only a small proportion of urban households – probably not more than 10%33 - have traditionally qualified for mortgage loans from HFIs, with the majority ruled out by their low incomes. Banks typically do not offer mortgage loans smaller than Ksh 500,000 (USD 7,500) and borrowers generally consist of high net worth individuals. Even with the fall in interest rates since the 1990s, and the recent extension of lending terms to 25 years by some HFIs, access to mortgage loans is still very limited, although it has improved.
Subsidies and housing demand
In principle, housing subsidies boost demand as they increase the ability of a household to pay for better housing34. In Kenya, there is not a well-thought-out system of subsidies. Indeed, as shown later (Table 8), there are virtually no subsidies for housing that is affordable by the poor, with the exception of technical assistance in upgrading sites. But local authorities own a substantial stock of rental dwellings, whose rents are lower than those of equivalent houses in the private sector. The Nairobi City Council (NCC) at one time owned around 18,000 units35. Although rents of housing owned by NCC have been raised in recent years, they are still well below market levels and tenants therefore enjoy a subsidy not available to other tenants. Other major urban local authorities also manage subsidized rental housing, but their housing stocks are much smaller. On the whole, the public rental stock is not well maintained, largely as a result of the low rents charged and the poor financial health of most local authorities.
32
Individuals 15 years of age or more. Percentages may not add up to 100 due to rounding. 33
There are no statistics on this. This estimate is based on casual evidence from discussions with housing finance officials. 34
This may not turn out to be the case if housing suppliers anticipate such subsidies and raise their prices accordingly. See for instance
Robinson R. (1981) for a discussion of the formal and actual incidence of housing subsidies. 35
Mutero, J. (1988). This number has fallen off, but not substantially, as a result of the divestiture of some units and the transfer of others to
the NHC following NCC’s failure to service housing loans from the NHC.
Access to housing finance in Africa: exploring the issues Kenya
J G Mutero, Matrix Development Consultants, for the FinMark Trust (December 2007) 12
Housing supply
Informal housing
In Nairobi, roughly 60% of residents live in slums, a grim illustration of the central role that informal housing plays in urban centres. In most towns, slum housing is built on either public or private land. In both cases the actual housing is of poor quality and dangerously overcrowded. The investments in superstructures are normally made through private investment, albeit investment operating on the fringes of, or beyond, the law. Infrastructure barely exists. Although dwellings vary in quality from one settlement to another, they are generally built of temporary materials.
In terms of supply, housing markets in slums are severely constrained by the limited availability of land. Access to land in these settlements has historically been “managed” by gatekeepers consisting of officials in the provincial administration and municipal councillors. These gatekeepers are members of an urban elite that derives substantial income from rent seeking, at the expense of the urban poor. Gulyani et al. (2006) have drawn attention to the high rates of return in Nairobi slums, emphasizing that from this standpoint, slums provide “high cost” housing to the urban poor. These authors go on to point out that urban slums in Nairobi do not fit into the stylised account of slums whereby squatter-owners invest to upgrade their housing36. On the contrary: “the vast majority of Nairobi’s slum dwellers are tenants. The majority of landlords are ‘absentee’ in that they
live outside the settlement and often use intermediaries to collect rent. In other words, this is a case of housing
for the poor but not by the poor. Second, there appear to be few incentives for either residents or absentee
landlords to invest in improving housing and community-level infrastructure in these settlements. The tenants
are mobile—the data show that they move both their residences and settlements fairly frequently. This,
combined with lack of ownership, means that they have almost no incentive to invest. As non-residents
themselves, the landlords do not suffer personally from the poor housing and infrastructure conditions and this
eliminates at least one of their incentives for investment. Arguably, competitive pressure should make the
landlords invest, but it appears that there are severe barriers to entry that have reduced any such pressures”.
Slum upgrading
Throughout the last three decades only limited resources have gone into slum upgrading. The main source has been the NGO community, but interventions have been small and uncoordinated. Urban local authorities, and the public sector at large, have traditionally not financed upgrading. Indeed, until comparatively recently, slums were looked upon as illegal and slum housing was commonly pulled down, thus ruling out public budgets for upgrading. In recent years, however, Government has shown great interest in improving living conditions in the rapidly growing slums, especially in view of the pressing agenda to tackle poverty and to achieve the Millennium Development Goals. As a result, Government has embarked upon a slum upgrading programme, the Kenya Slum Upgrading Programme (KENSUP). UN-HABITAT has provided some technical assistance and limited financial support for this programme. Initial activities have centred on social and physical mapping, and community mobilization in a small part of the sprawling Kibera slum in Nairobi, which has a population of approximately 500,000 people37, but physical works are progressively being phased in. One component is the construction of flats in a ‘decanting zone’ and questions are being raised about the affordability and viability of this approach amid fears, as has happened so often in the past, that these valuable units will eventually be absorbed into the middle-
36
Gulyani, S. et al. (2006) p. 35 37
Since being mapped by Matrix Development Consultants in 1993, showing a population of 250,000, Kibera’s population estimates have
varied, some claiming as many 700,000. Kibera has become an emblematic slum for Africa and no visit to Nairobi by prominent politicians
and high ranking officials from donor institutions is complete without touring the settlement - with substantial press coverage.

Access to housing finance in Africa: exploring the issues Kenya
J G Mutero, Matrix Development Consultants, for the FinMark Trust (December 2007) 13
income housing market and will not serve the poor. Other slum upgrading projects are planned for Mombasa and Kisumu, the second and third largest towns, respectively. Formal private housing
Private developers, consisting of firms and individual builders, produce the bulk of formal housing in Kenya’s urban centres. There are limited statistics on the output from this sector but there is evidence that the majority of new houses by private developers are in upmarket areas. However, new housing developments in eastern Nairobi and the satellite town of Mavoko have started to produce a substantial number of dwellings in the Ksh 2-4 million (USD 30,000 – 60,000) range, generally affordable by lower-middle and middle-income groups38. Still, the supply of dwellings by private developers for this segment of the market is far from adequate. But individual builders are also active in this submarket, building in inner city locations as well as in the peri-urban belt where households have purchased plots from land buying companies. Some of this construction takes place incrementally on the fringes of the formal sector and is not always captured in official statistics. According to the Economic Survey 2007, “The improved performance in the housing sector which started in 2002/2003 continued during 2005/2006 with
most of the activities being undertaken by the private sector. In the year under review, the private sector
commenced construction of 3,243 housing units worth KSh 7.8 billion39
in Nairobi. However, most new housing
units constructed were costing KSh 4.0 million 40
and above mainly in the up-market areas”.
Housing by the public sector
Formal housing by the public sector, typically housing for lower-middle and middle-income groups41, has traditionally been financed by government through two main channels: the National Housing Corporation (NHC), a parastatal; and local authorities such as municipal councils. Even at the height of their housing production, in the 1970s, these institutions were able to meet only a small proportion of demand in Nairobi, but in some of the smaller towns public rental housing accounted for a substantial proportion of the housing stock. In Nakuru, for instance, it has been estimated that this proportion was at one time as high as 33%42. With rapid urbanization, diminishing public investments in shelter, and divestiture of part of the rental stock, public housing no longer plays an important role both in terms of annual supply and as a proportion of the total housing stock. Indeed, local authorities no longer supply new housing. The sharp drop in public housing output is illustrated in the following chart, which shows that over the period 1995-2004, production by NHC in Nairobi was a mere fraction of what it had been two decades earlier43. As the chart shows, sites and services projects constituted the main “housing” type (over the period 1965-1984), typically consisting of serviced plots and building loans to households to build starter houses.
38
Economic Survey 2007 39
USD 116.4 million 40
USD 59.7 thousand 41
Roughly, households between the 4th and 7
th deciles on the income distribution.
42 Mwangi, I. K. (1997)
43 Figures represent housing output financed directly by NHC or indirectly via loans to the Nairobi City Council.

Access to housing finance in Africa: exploring the issues Kenya
J G Mutero, Matrix Development Consultants, for the FinMark Trust (December 2007) 14
Chart 2: Housing Production by the National Housing Corporation
Nairobi: 1965-2004
0
10002000
30004000
50006000
70008000
9000
1965-
1974
1975-
1984
1985-
1994
1995-
2004
Total
Tenant Purchase
Rental
Site and Service
Mortgage
Other
Source: NHC
NHC has expanded its output recently and, in 2006, it had 230 units of mortgage flats under construction in Langata, Nairobi at a cost of KSh 462.8 million (USD 6.3 million) and 69 units of tenant purchase bungalows in Mamboleo, Kisumu at a cost of KSh 11.0 million (USD 150,000)44 Over the same period NHC planned for the construction of 2,800 units across the county at an estimated cost of KSh 5.1 billion (USD 69.4 million), out of which 96 units have already gone to tender.45 Government expenditure on housing, primarily for its own employees but also to finance the NHC, has gone up in recent years. Actual expenditure on housing increased substantially from KSh 480.7 million (USD 6.1 million) in 2004/05 to KSh 1,057.0 million (USD 14.6 million) in 2005/06. Moreover, approved government expenditure on housing increased sharply from KSh 542.6 million (USD 6.9 million) in 2004/05 to KSh 1,616.0 million (USD 22.3 million) in 2005/06 following the revival of several stalled projects, falling back to KSh 1,426.0 million (USD 20.6 million) in 2006/07. Approved expenditure as a percentage of development expenditure went down to 0.65 per cent in 2005/06 compared to 0.89 per cent in 2004/0546.
Overview of the housing finance sector
Mortgage finance
In the years immediately preceding independence in 1963, the housing finance sector was marked by instability as a result of political uncertainty. In the event, HFI deposits plunged from KSh 208 million in 1959 to KSh 90 million in 1962. However, this period soon gave way to a phase of consolidation and the mortgage industry expanded substantially from 1964 onwards.47 The principal HFIs were the Housing Finance Company of Kenya, Kenya Building Society (KBS), and Savings and Loan (S&L). HFCK was incorporated in 1965 as a joint venture between government and the Commonwealth Development Corporation (of the United Kingdom), taking over the assets of First Permanent of East Africa and those of KBS.
44
The cost per bungalow, at USD 2,170, looks unrealistically low and is probably wrong. 45
Economic Survey 2007. p. 219 46
Ibid 47
See Jorgensen, N.O. (1970)

Access to housing finance in Africa: exploring the issues Kenya
J G Mutero, Matrix Development Consultants, for the FinMark Trust (December 2007) 15
S&L, the largest HFI at the time, experienced substantial setbacks around the time of independence and was taken over, initially by Pearl Assurance and, in 1970, by Kenya Commercial Bank, a parastatal. East African Building Society, a relatively small HFI which had opened for business in 1959, weathered the political uncertainties of the day and expanded rapidly in the years that followed.
HFCK, EABS and S&L, the principal HFIs, achieved fast growth during the 1970s. Between 1975 and 1980, for instance, HFCK deposits increased at an annual average rate of 20% and those of the EABS by 24%.48 In mid-1981, following a general decline in the growth of deposits, tax-free housing development bonds were introduced to enable HFCK and S&L to attract additional savings. These institutions also benefited from deposits by the National Social Security Fund (NSSF) and from loans by the government. Starting in the mid-1980's the mortgage industry witnessed major changes and upheavals. By 1986, the number of HFIs had grown to about 36, comprising four limited liability companies and 32 building societies but only 15 of the latter were active.49 Taking into account that the country had for many years been served by only one building society, the growth in numbers of this type of HFI had been nothing short of dramatic. Gardner et al. (1986) have advanced two reasons for this growth. The first is that the coffee price boom of 1976-77 provided the financial impetus for the rapid increase in the number of such institutions. Second, licensing of financial institutions under the Banking Act was tightened in 1985 following the collapse of a financial company (see below). Thus, building societies remained the principal avenue for the entry of firms into the financial sector. Notwithstanding the proliferation of HFIs, the industry continued to be dominated by HFCK, EABS and S&L. Still, the newer institutions competed aggressively for savings. In 1984, the country experienced its first post-independence failure of a financial institution, that of the Rural and Urban Credit Finance Company. In response, the government tightened the regulatory and supervisory regime. More specifically, a number of steps were taken via an amendment to the Banking Act (Cap. 488). First, stricter conditions were imposed on the level of paid-up capital, as well as that of unimpaired reserves relative to deposit liabilities. For instance, paid-up capital for local non-bank financial institutions (NBFIs) was raised from Ksh 5 million to Ksh.7.5 million. Second, NBFIs were prohibited from owning shares in commercial banks. Third, a Deposit Protection Fund was created at the Central Bank. These measures notwithstanding, a group of financial institutions, several building societies among them, failed in due course. A combination of factors led to this failure, some political, others management-related. First, a good number of building societies had invested heavily in property development, an activity that was considered more profitable but which naturally carried a higher risk. A notable example was Pioneer Building Society which collapsed largely because of delayed house sales. Second, major institutional investors, such as the NSSF, withdrew their deposits from the new building societies, partly out of the need to comply with political directives but also as a result of genuine concern for the security of their deposits. Third, the number of building societies had expanded too rapidly relative to the volume of available deposits. Fourth, the regulatory and supervisory regime was weak and potential problems could therefore not be arrested in time. In particular, the Registrar of Building Societies did not possess the staff needed to assure effective supervision.50 Government intervened and re-organised some of the failed institutions under the umbrella of a new bank, the Consolidated Bank of Kenya. Potential crises were averted in the years that followed but, in the first half of 1993, a number of financial institutions were placed under receivership including one HFI.
48
World Bank (1983) 49
Gardner et al. (1986) 50
Gardner et al. ibid.
Access to housing finance in Africa: exploring the issues Kenya
J G Mutero, Matrix Development Consultants, for the FinMark Trust (December 2007) 16
In spite of these setbacks, the mortgage industry registered some expansion. HFCK saw its public deposits grow, in nominal terms, from Ksh.1.89 billion in 1987 to Ksh.3.4 billion (USD 120.9 million) in 1992. However, in real terms -- that is, after making adjustments for inflation -- growth was marginal. As for mortgage lending, advances increased from Ksh.204.5 million in 1984 to Ksh.614.0 million in 1992 (USD 21.8 million). Even so, there was stagnation between 1986 and 1988 but lending rebounded in 1989 and 1990, registering nominal growth rates of 34.2% and 52.3%, respectively. Stagnation set in once again in 1991. With some variations, EABS and S&L shared a similar experience. Arguably the most important historical development was the freeing of interest rates in July, 1991, a measure taken to ensure a more efficient allocation of resources.51 Although interest rates had hitherto been controlled by the Central Bank they had nevertheless remained positive in the years leading up to 1990. However, the liberalisation of interest rates was overshadowed by the very high rate of inflation in 1993, conservatively estimated to have averaged around 40%52 but to have peaked at roughly 100% during the year.53 Since HFIs are not able to lend at nominal rates exceeding 30% -- because there is little demand at that level -- real interest rates turned sharply negative. The response of HFIs was to suspend new mortgage lending altogether, choosing instead to invest in high yielding treasury bills. Although inflation fell substantially in subsequent years, and with it interest rates, mortgage interest rates remained above 20% per annum for the rest of the decade. Towards the end of the 1990s, the housing finance market in Kenya went through a transformation from being predominantly public-sector oriented, to a more market-driven enterprise.54. With interest rate decontrol and privatization, those institutions that were previously controlled and sheltered by government, became exposed to market forces. Recent trends in mortgage finance
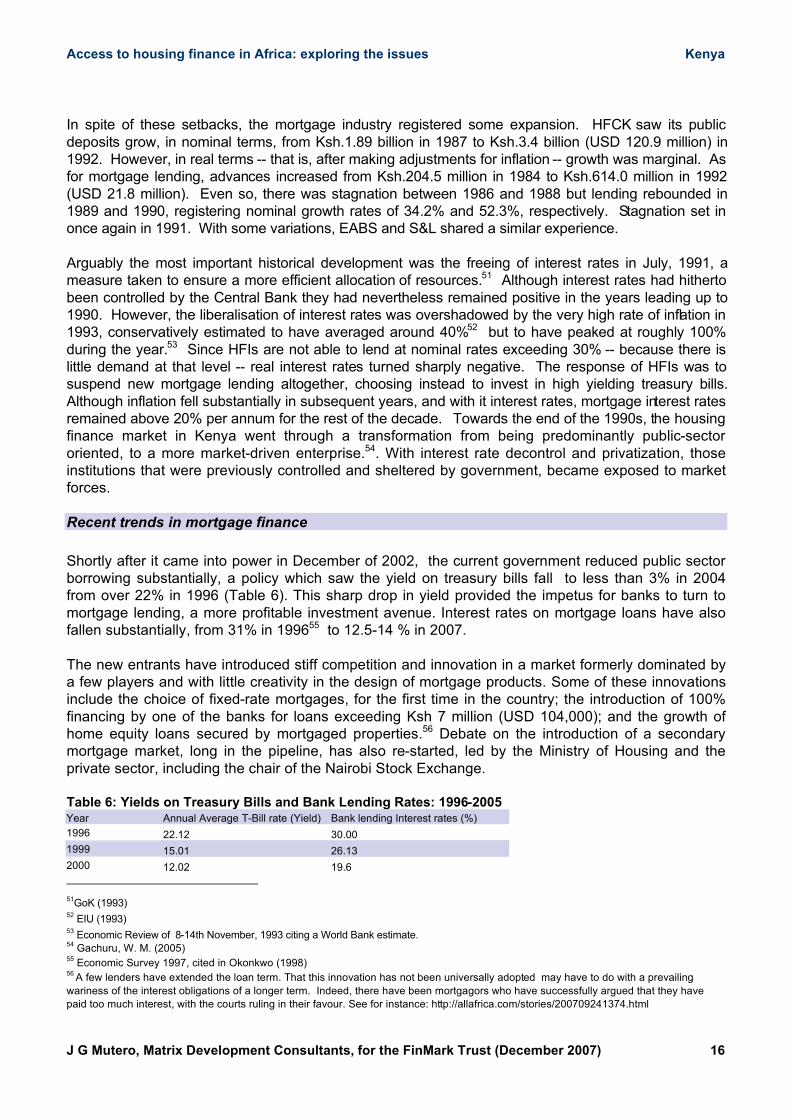
Shortly after it came into power in December of 2002, the current government reduced public sector borrowing substantially, a policy which saw the yield on treasury bills fall to less than 3% in 2004 from over 22% in 1996 (Table 6). This sharp drop in yield provided the impetus for banks to turn to mortgage lending, a more profitable investment avenue. Interest rates on mortgage loans have also fallen substantially, from 31% in 199655 to 12.5-14 % in 2007. The new entrants have introduced stiff competition and innovation in a market formerly dominated by a few players and with little creativity in the design of mortgage products. Some of these innovations include the choice of fixed-rate mortgages, for the first time in the country; the introduction of 100% financing by one of the banks for loans exceeding Ksh 7 million (USD 104,000); and the growth of home equity loans secured by mortgaged properties.56 Debate on the introduction of a secondary mortgage market, long in the pipeline, has also re-started, led by the Ministry of Housing and the private sector, including the chair of the Nairobi Stock Exchange. Table 6: Yields on Treasury Bills and Bank Lending Rates: 1996-2005 Year Annual Average T-Bill rate (Yield) Bank lending Interest rates (%)
1996 22.12 30.00
1999 15.01 26.13
2000 12.02 19.6
51GoK (1993)
52 EIU (1993)
53 Economic Review of 8-14th November, 1993 citing a World Bank estimate.
54 Gachuru, W. M. (2005)
55 Economic Survey 1997, cited in Okonkwo (1998)
56 A few lenders have extended the loan term. That this innovation has not been universally adopted may have to do with a prevailing
wariness of the interest obligations of a longer term. Indeed, there have been mortgagors who have successfully argued that they have
paid too much interest, with the courts ruling in their favour. See for instance: http://allafrica.com/stories/200709241374.html

Access to housing finance in Africa: exploring the issues Kenya
J G Mutero, Matrix Development Consultants, for the FinMark Trust (December 2007) 17
2001 12.73 19.49
2001 8.94 19.49
2001 8.94 19.29
2002 8.94 18.34
2004 2.86 11.25
2005 8.60 13.09
Source: Capital Markets Authority
Mortgage lending is common only in the principal towns, with Nairobi accounting for around 90% of the loans originated each year57. The following financial institutions are presently the main providers of mortgage finance:
• Housing Finance (previously Housing Finance Company of Kenya) • Savings and Loans (S&L) • East African Building Society Bank • Standard Chartered Bank • Barclays Bank • Stanbic Bank
Unfortunately, data regarding lenders’ total and annual book size, including the number of loans and their value, is not published. There are no guarantees currently available in the mortgage market and the demand for such appears to be limited. The resale market is buoyant and enables defaulters to sell their properties via private treaty and thus repay the outstanding principal amount etc. Foreclosure is also an option although it can be quite protracted.
Other formal finance from the banking sector
Anecdotal evidence suggests that there are many individual households and builders who borrow from the commercial banking sector to build houses for rental or for their own occupation. Such loans, usually of short maturity, are commonly taken out as personal loans to support incremental building or outright construction. There are no published statistics on this type of finance, but the recent survey by FinScope™ could be analysed to yield relevant information.58
Housing microfinance
Housing microfinance, structured to provide both technical assistance and micro-loans, is a relatively new product in Kenya and is offered primarily by the National Cooperative Housing Union (NACHU) and the Kenya Affordable Shelter Project (KASP) of the K-REP Development Agency (Box 2). Pamoja Trust, through their Akiba Mashinani Trust, has also started to offer small loans to groups in upgrading sites. Savings and credit cooperatives (SACCOs), of which there are many, also help their members acquire housing, typically by financing plot acquisition and house construction. There is little systematic information on financing by SACCOs as the majority of loans are taken out as personal loans, and diverted to housing without the direct knowledge of lenders59. Another source of housing microfinance is Jamii Bora, (JB) a micro-finance institution which lends to poor borrowers who have saved with the institution (see Box 4). It uses classic micro-finance procedures, with borrowers forming small groups so that loans are in part secured by peer pressure. It claims to have 140,000 members. Some years ago JB decided to develop a housing project for
57
Okonkwo, O. (1998). A more recent estimate is not available but the figure in this source is unlikely to have changed appreciably. 58
See www.finscope.co.za 59
Discussion with the Kenya Union of Savings and Credit Cooperatives (KUSCCO)

Access to housing finance in Africa: exploring the issues Kenya
J G Mutero, Matrix Development Consultants, for the FinMark Trust (December 2007) 18
members and acquired 300 acres of land outside Nairobi. The plan is to construct 2,000 houses over 3 years at a cost of Ksh 900 million (USD 13.6 million). The units will have 2 bedrooms, a sitting room and a kitchen. Members will be expected to participate directly in the project by producing their own building materials. Box 2: Kenya Affordable Shelter Project
Started in 2001 in Nakuru60
, the Kenya Affordable Shelter Project (KASP) sought to develop sustainable mechanisms for integrating financial services and building technology to help the poor acquire affordable shelter for commercial or home ownership. The project was initiated through the collaboration of Intermediate Technology Development Group (ITDG)
61,
acting as a technical partner, and K-Rep Development Agency, the financier and owner of the project.
KASP mainly targets poor urban and rural communities who have identified housing as a priority need. Several loan products are offered, including group and individual loans. Collateral comprises advance savings, personal pledges and co-guarantees by group members. KASP has demonstrated that housing microfinance is feasible if well-managed, and presently has 192 active loans; an expanded programme is in the pipeline. Some of the problems that have beset the project, now being addressed, include:
! Portfolio quality: 192 out of 214 current loans are performing on time. The 22 defaulting groups were inherited from the first or pilot phase of the project.
! Loan diversion: This problem was common during the pilot phase and is the main cause of defaulting in the early years.
! Stalled houses: This is a common problem mainly caused by under-funding. Stalled houses have bred customer dissatisfaction and defaulting.
! Clients’ dropout: This is the biggest threat to the project. So far 210 clients (52.5%) have dropped out or become dormant out of 400 of those enrolled.
In contrast, enterprise microfinance is now well-established, catering for small (mainly informal) enterprises such as petty trading (although often in a modern sector such as telecommunications), and small artisans. This is because small enterprises turn over cash quickly, often in one day, compared to the housing sector where, however modest the investment, the capital cost is still large compared to the income and other financial resources of the low-income borrower. The amount of loans sufficient for housing investment, whether it be for rehabilitation/improvement, new-build or infrastructure, are significantly higher than normal microfinance and require a longer period to pay back. For the lender this means that the loans are lent for a longer period and that they are recovered more slowly, limiting the ability to re-lend. Longer lending periods in turn mean a higher credit risk, the erosion of resources through inflation (if nominal interest rates are lower than inflation), and a higher interest rate risk where fixed rates are offered. For the poor, direct access to finance from banks is extremely difficult as they cannot provide security, administration costs of small loans are high and profit margins are perceived by lenders to be low (although rental returns on investments in Kenyan slums are extremely rapid!). This mirrors the situation in many other countries. Moreover, interest rates, although they have reduced in recent years from a high of 26% in 1999 (but are now rising again) still make borrowing expensive at current retail rates. In view of the limited capital being channelled into housing microfinance, in spite of the substantial demand for this product, greater effort should go into mobilizing finance from the capital market. Bonds offer one way of raising private capital and can also attract companies who wish to demonstrate corporate responsibility without making a financial loss on investments that support the poor. The priority is to initiate these mechanisms in the housing sector – it has already been done in the SME sector in Kenya.
60
Kenya’s fourth largest town 61
Now called Practical Action
Access to housing finance in Africa: exploring the issues Kenya
J G Mutero, Matrix Development Consultants, for the FinMark Trust (December 2007) 19
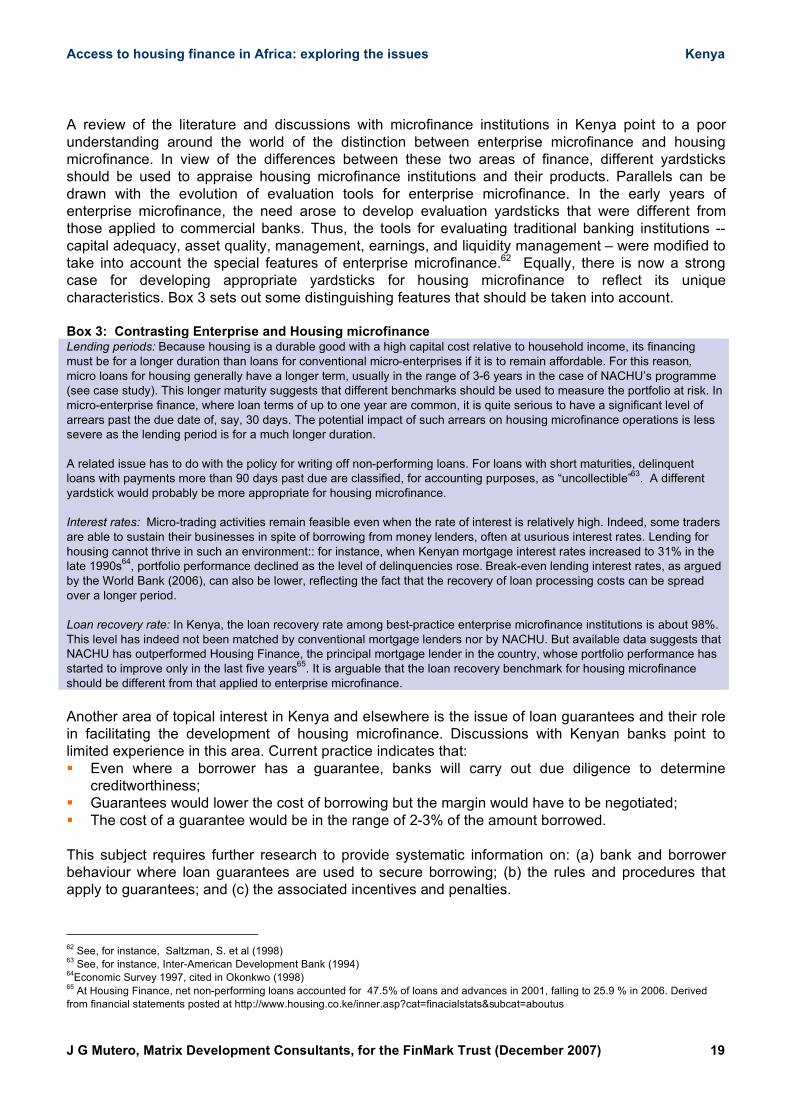
A review of the literature and discussions with microfinance institutions in Kenya point to a poor understanding around the world of the distinction between enterprise microfinance and housing microfinance. In view of the differences between these two areas of finance, different yardsticks should be used to appraise housing microfinance institutions and their products. Parallels can be drawn with the evolution of evaluation tools for enterprise microfinance. In the early years of enterprise microfinance, the need arose to develop evaluation yardsticks that were different from those applied to commercial banks. Thus, the tools for evaluating traditional banking institutions -- capital adequacy, asset quality, management, earnings, and liquidity management – were modified to take into account the special features of enterprise microfinance.62 Equally, there is now a strong case for developing appropriate yardsticks for housing microfinance to reflect its unique characteristics. Box 3 sets out some distinguishing features that should be taken into account. Box 3: Contrasting Enterprise and Housing microfinance Lending periods: Because housing is a durable good with a high capital cost relative to household income, its financing must be for a longer duration than loans for conventional micro-enterprises if it is to remain affordable. For this reason, micro loans for housing generally have a longer term, usually in the range of 3-6 years in the case of NACHU’s programme (see case study). This longer maturity suggests that different benchmarks should be used to measure the portfolio at risk. In micro-enterprise finance, where loan terms of up to one year are common, it is quite serious to have a significant level of arrears past the due date of, say, 30 days. The potential impact of such arrears on housing microfinance operations is less severe as the lending period is for a much longer duration.
A related issue has to do with the policy for writing off non-performing loans. For loans with short maturities, delinquent loans with payments more than 90 days past due are classified, for accounting purposes, as “uncollectible”
63. A different
yardstick would probably be more appropriate for housing microfinance.
Interest rates: Micro-trading activities remain feasible even when the rate of interest is relatively high. Indeed, some traders are able to sustain their businesses in spite of borrowing from money lenders, often at usurious interest rates. Lending for housing cannot thrive in such an environment:: for instance, when Kenyan mortgage interest rates increased to 31% in the late 1990s
64, portfolio performance declined as the level of delinquencies rose. Break-even lending interest rates, as argued
by the World Bank (2006), can also be lower, reflecting the fact that the recovery of loan processing costs can be spread over a longer period.
Loan recovery rate: In Kenya, the loan recovery rate among best-practice enterprise microfinance institutions is about 98%. This level has indeed not been matched by conventional mortgage lenders nor by NACHU. But available data suggests that NACHU has outperformed Housing Finance, the principal mortgage lender in the country, whose portfolio performance has started to improve only in the last five years
65. It is arguable that the loan recovery benchmark for housing microfinance
should be different from that applied to enterprise microfinance.
Another area of topical interest in Kenya and elsewhere is the issue of loan guarantees and their role in facilitating the development of housing microfinance. Discussions with Kenyan banks point to limited experience in this area. Current practice indicates that: ! Even where a borrower has a guarantee, banks will carry out due diligence to determine
creditworthiness; ! Guarantees would lower the cost of borrowing but the margin would have to be negotiated; ! The cost of a guarantee would be in the range of 2-3% of the amount borrowed.
This subject requires further research to provide systematic information on: (a) bank and borrower behaviour where loan guarantees are used to secure borrowing; (b) the rules and procedures that apply to guarantees; and (c) the associated incentives and penalties.
62
See, for instance, Saltzman, S. et al (1998) 63
See, for instance, Inter-American Development Bank (1994) 64
Economic Survey 1997, cited in Okonkwo (1998) 65
At Housing Finance, net non-performing loans accounted for 47.5% of loans and advances in 2001, falling to 25.9 % in 2006. Derived
from financial statements posted at http://www.housing.co.ke/inner.asp?cat=finacialstats&subcat=aboutus

Access to housing finance in Africa: exploring the issues Kenya
J G Mutero, Matrix Development Consultants, for the FinMark Trust (December 2007) 20
Experience from South Africa provides a number of useful lessons66. First, if used imprudently, a loan guarantee could undermine the negotiating power of a borrower as it might signal to the lender that the borrower is financially weak. This suggests that the borrower should fall back on guarantees only where these are specifically required by the lender. Second, the opening position of the lender might be to ask for guarantees that cover the entire amount of the loan and, in some cases, a higher cover could be demanded, raising the costs of guarantees unduly. This is an unreasonable request if the borrower is financially healthy, and should be rejected. Generally, not more than 75% of the loan should be guaranteed, but 50% is a more appropriate level. Third, a portable guarantee is to be preferred as it gives the borrower greater leeway in shopping for a loan. Some development agencies such as USAID67 through their Development Credit Authority, provide such guarantees,.
Informal finance
The majority of slum residents in Kenyan towns are tenants, as already pointed out. Housing in slums is typically financed by well-to-do landlords, whether resident or absentee, using their own sources. Were tenants to have the opportunity to acquire land and build their own houses, they would almost certainly resort to informal finance, consisting of finance supplied primarily by relative and friends, as well as by savings groups or “merry-go-rounds”. A recent survey of 1,775 households in Nairobi, already referred to, is illustrative as it shows the main sources of loans for slum dwellers (Table 7). Although nearly 30% of households have a bank account the majority borrow from relatives and friends (62%) and a smaller proportion from NGOs, savings groups or cooperatives (21%). In contrast, more than 45% of the adult population in Nairobi as a whole has access to banks.68 Table 7: Slum dwellers in Nairobi: Selected Financial Characteristics Households %
No. of households in the survey
No. of households with bank accounts
1755
494
28.1%
Households with a loan 297 17.4%
Of those with a loan, primary source of loan:
Relatives or friends
NGOs/Savings Group/Credit Cooperative
Bank
Informal lender
Other
183
61
25
7
21
62.2%
20.9%
7.9%
2.5%
6.6%
Source: Gulyani, S. et al. (2006)
Limited fieldwork conducted for this study, consisting of focus group discussions in three sites in Nairobi, generated some interesting insights on how poor households access informal finance for housing as well as how links have been formed with microfinance institutions (Box 4 and Annex 1) Box 4: Informal Housing Finance in Nairobi Three low-income settlements in Nairobi (Mwiki, Kiambiu and Huruma), illustrate how the urban poor access informal finance to improve their housing conditions. Mwiki, on the outskirts of Nairobi, is an example of the newer settlements that have developed in the city’s peri urban belt, built primarily on land acquired from private owners by land buying companies. Kiambiu and Huruma are inner-city slums which accommodate some of the poorest households in Nairobi on land which is owned by public authorities. In all three sites, household incomes were roughly estimated to be not more than USD 100 per month. In Mwiki, the early plot owners approached quarry owners in the vicinity to agree how much they would be required to pay, in instalments, for quarry stone. Typically, a quarry owner would open a register to record the installments received from the plot owner, until materials enough to build a minimum dwelling had been paid for. Other plot owners save with hardware
66
Drawn from the experience of Kuyasa Fund as reported at a NACHU- organised workshop in Nairobi in June 2007. 67
Reported at a NACHU- organised workshop in Nairobi in June 2007. 68
See www.finscope.co.za. The comparison between the two sets of data is not straightforward as on uses “household” as the survey unit
and the other, members of the adult population. Still, the data strongly suggest, as one would expect, that slum residents have more limited
access to banks than the Nairobi population as a whole.
Access to housing finance in Africa: exploring the issues Kenya
J G Mutero, Matrix Development Consultants, for the FinMark Trust (December 2007) 21
shops, following a similar procedure. Installments are affordable as they range from Ksh 50 (USD 0.75) to Ksh 500 (USD 7.5). Depositing money with these “intermediaries” protects savings from being diverted to other uses. The majority of plot owners construct their houses incrementally and it can take up to 4 years to construct two to three rooms. A standard sized room of 10’x10’ built of permanent materials would roughly cost Ksh 85,000 (USD 1,270) and a semi-permanent room Ksh 45,000 (USD 670). Informal savings groups in Mwiki generally do not use their resources to finance housing and do not seem to have links with formal micro-finance institutions. But in both Kiambiu and Huruma, what started as informal savings groups have, in time, established links with micro-finance institutions, Jamii Bora and Akiba Mashinani, respectively. At Jamii Bora, the interest rate on loans is 10%, and for a loan of Ksh.10,000 (USD 150), enough to build an improved temporary structure
69, the
repayment period is 50 weeks. Loan defaulting is low and groups assume the responsibility to pay when their members default. Huruma residents, through facilitation by Pamoja Trust, formed Muungano wa Kampi ya Moto, a registered self-help group. The group has been able to borrow for housing from Akiba Mashinani
70 Trust, a fund formed by Pamoja Trust after saving
up to 10% of the loan amount in advance.
Housing finance: summing up
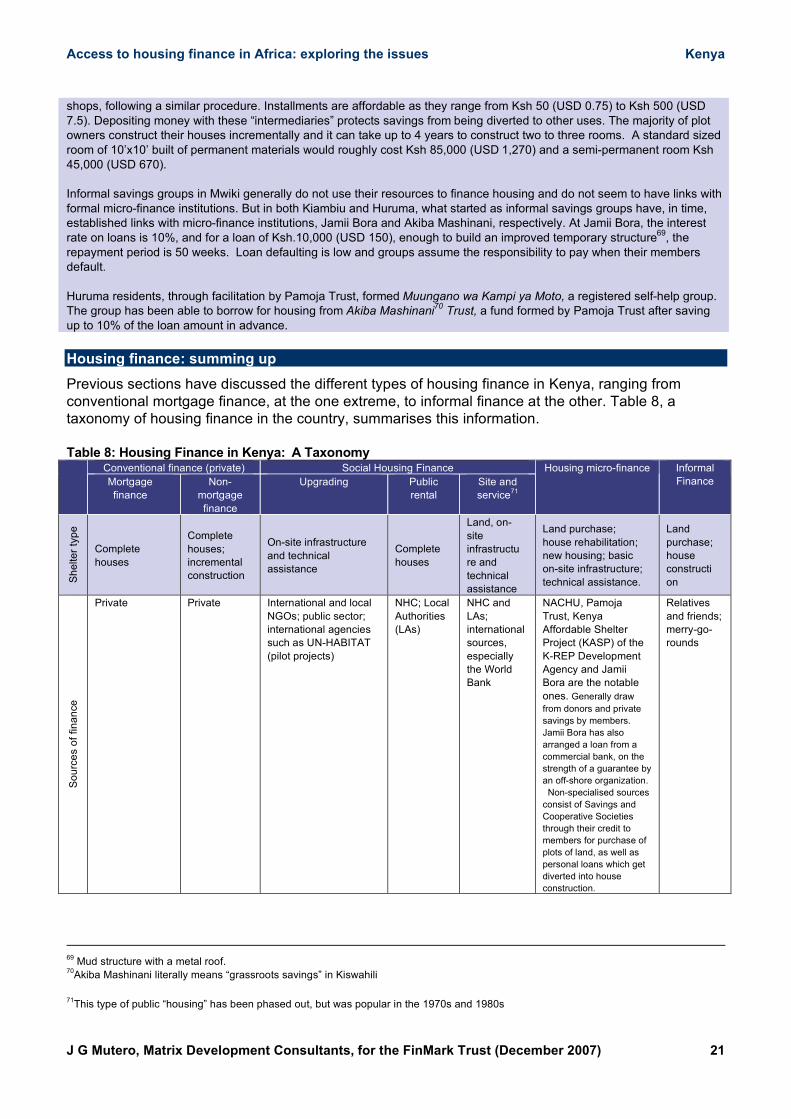
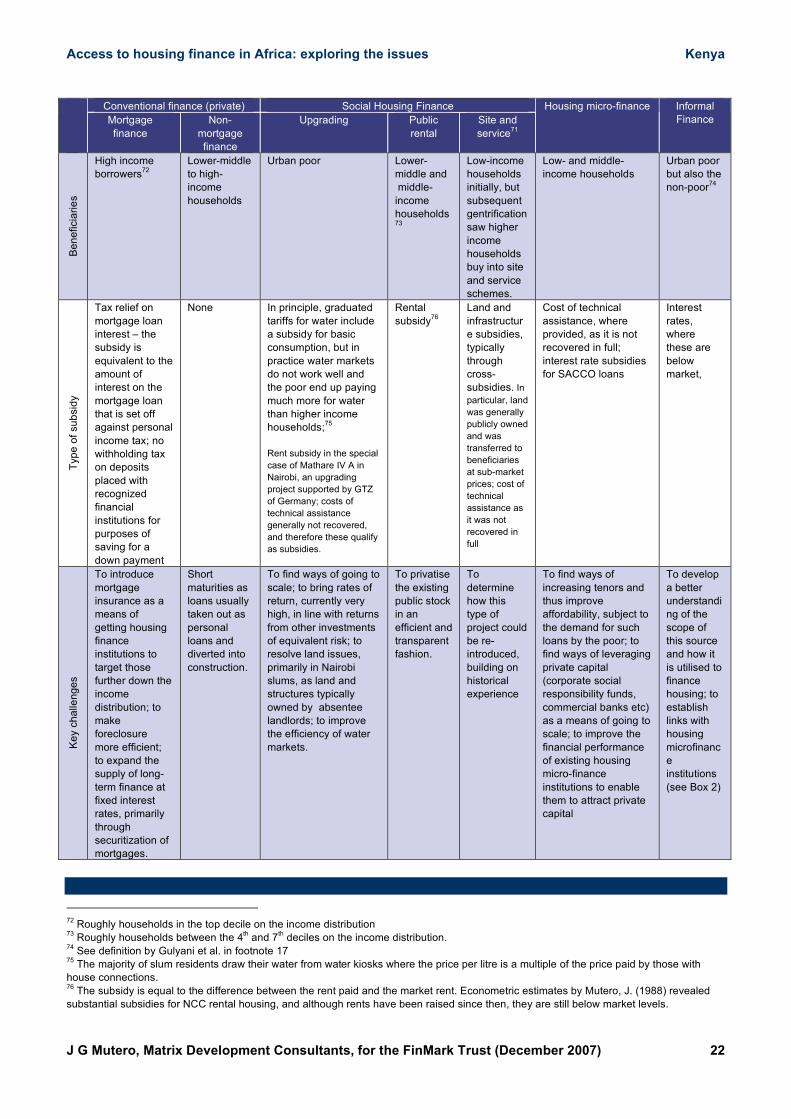
Previous sections have discussed the different types of housing finance in Kenya, ranging from conventional mortgage finance, at the one extreme, to informal finance at the other. Table 8, a taxonomy of housing finance in the country, summarises this information. Table 8: Housing Finance in Kenya: A Taxonomy
Conventional finance (private) Social Housing Finance
Mortgage
finance
Non-
mortgage
finance
Upgrading Public
rental
Site and
service71
Housing micro-finance Informal
Finance
Sh
elte
r ty
pe
Complete
houses
Complete
houses;
incremental
construction
On-site infrastructure
and technical
assistance
Complete
houses
Land, on-
site
infrastructu
re and
technical
assistance
Land purchase;
house rehabilitation;
new housing; basic
on-site infrastructure;
technical assistance.
Land
purchase;
house
constructi
on
So
urc
es o
f fin
an
ce
Private Private International and local
NGOs; public sector;
international agencies
such as UN-HABITAT
(pilot projects)
NHC; Local
Authorities
(LAs)
NHC and
LAs;
international
sources,
especially
the World
Bank
NACHU, Pamoja
Trust, Kenya
Affordable Shelter
Project (KASP) of the
K-REP Development
Agency and Jamii
Bora are the notable
ones. Generally draw
from donors and private
savings by members.
Jamii Bora has also
arranged a loan from a
commercial bank, on the
strength of a guarantee by
an off-shore organization.
Non-specialised sources
consist of Savings and
Cooperative Societies
through their credit to
members for purchase of
plots of land, as well as
personal loans which get
diverted into house
construction.
Relatives
and friends;
merry-go-
rounds
69
Mud structure with a metal roof. 70
Akiba Mashinani literally means “grassroots savings” in Kiswahili
71
This type of public “housing” has been phased out, but was popular in the 1970s and 1980s
Access to housing finance in Africa: exploring the issues Kenya
J G Mutero, Matrix Development Consultants, for the FinMark Trust (December 2007) 22
Conventional finance (private) Social Housing Finance
Mortgage
finance
Non-
mortgage
finance
Upgrading Public
rental
Site and
service71
Housing micro-finance Informal
Finance
Be
ne
ficia
rie
s
High income
borrowers72
Lower-middle
to high-
income
households
Urban poor Lower-
middle and
middle-
income
households73
Low-income
households
initially, but
subsequent
gentrification
saw higher
income
households
buy into site
and service
schemes.
Low- and middle-
income households
Urban poor
but also the
non-poor74
Typ
e o
f su
bsid
y
Tax relief on
mortgage loan
interest – the
subsidy is
equivalent to the
amount of
interest on the
mortgage loan
that is set off
against personal
income tax; no
withholding tax
on deposits
placed with
recognized
financial
institutions for
purposes of
saving for a
down payment
None
In principle, graduated
tariffs for water include
a subsidy for basic
consumption, but in
practice water markets
do not work well and
the poor end up paying
much more for water
than higher income
households;75
Rent subsidy in the special
case of Mathare IV A in
Nairobi, an upgrading
project supported by GTZ
of Germany; costs of
technical assistance
generally not recovered,
and therefore these qualify
as subsidies.
Rental
subsidy76
Land and
infrastructur
e subsidies,
typically
through
cross-
subsidies. In
particular, land
was generally
publicly owned
and was
transferred to
beneficiaries
at sub-market
prices; cost of
technical
assistance as
it was not
recovered in
full
Cost of technical
assistance, where
provided, as it is not
recovered in full;
interest rate subsidies
for SACCO loans
Interest
rates,
where
these are
below
market,
Ke
y c
ha
llen
ge
s
To introduce
mortgage
insurance as a
means of
getting housing
finance
institutions to
target those
further down the
income
distribution; to
make
foreclosure
more efficient;
to expand the
supply of long-
term finance at
fixed interest
rates, primarily
through
securitization of
mortgages.
Short
maturities as
loans usually
taken out as
personal
loans and
diverted into
construction.
To find ways of going to
scale; to bring rates of
return, currently very
high, in line with returns
from other investments
of equivalent risk; to
resolve land issues,
primarily in Nairobi
slums, as land and
structures typically
owned by absentee
landlords; to improve
the efficiency of water
markets.
To privatise
the existing
public stock
in an
efficient and
transparent
fashion.
To
determine
how this
type of
project could
be re-
introduced,
building on
historical
experience
To find ways of
increasing tenors and
thus improve
affordability, subject to
the demand for such
loans by the poor; to
find ways of leveraging
private capital
(corporate social
responsibility funds,
commercial banks etc)
as a means of going to
scale; to improve the
financial performance
of existing housing
micro-finance
institutions to enable
them to attract private
capital
To develop
a better
understandi
ng of the
scope of
this source
and how it
is utilised to
finance
housing; to
establish
links with
housing
microfinanc
e
institutions
(see Box 2)
72
Roughly households in the top decile on the income distribution 73
Roughly households between the 4th and 7
th deciles on the income distribution.
74 See definition by Gulyani et al. in footnote 17
75 The majority of slum residents draw their water from water kiosks where the price per litre is a multiple of the price paid by those with
house connections. 76
The subsidy is equal to the difference between the rent paid and the market rent. Econometric estimates by Mutero, J. (1988) revealed
substantial subsidies for NCC rental housing, and although rents have been raised since then, they are still below market levels.
Access to housing finance in Africa: exploring the issues Kenya
J G Mutero, Matrix Development Consultants, for the FinMark Trust (December 2007) 23
Housing microfinance: A case study of NACHU
Thus far, innovations in housing finance for the poor in Kenya have been led mainly by NGOs. This section presents a case study of the National Cooperative Housing Union (NACHU), an NGO that has pioneered micro-finance for housing in the country. NACHU was initially established in the early 1980s to provide technical services and small housing loans (supported by member savings) for trade union members. It made some modest achievements but was hampered at different times by political interference and indifferent management (elected and staff) and by an unhelpful policy context. More recently since the beginning of the millennium NACHU, with modest donor assistance, has become more innovative and has put in place a system that has the potential to be scaled-up to serve significant numbers of the poor. But there is some way to go. Through its programmes, NACHU offers micro loans for housing, and subsidises technical services for those with modest incomes. As the only institution of its kind, both in the wider housing market and in the cooperative sector, NACHU’s role is of special interest in an analysis of institutional mechanisms for housing delivery.
Structure and governance of NACHU
NACHU was first registered in 1979 under the Cooperative Societies Act (CAP 490) to facilitate housing for trade union members. NACHU currently has 212
77 primary cooperative housing societies as members, of which
approximately122 are active, i.e. they hold regular meetings, hold shares in NACHU and participate in NACHU activities, including attendance at the Annual General Meeting. Each member cooperative contributes minimum share capital of KSh 10,000 (USD 150) as a condition of membership. Members are entitled to participate in the AGM, responsible for electing a Board that is composed of one member from each of Kenya’s seven Provinces. The Board then elects its Chairperson.
Membership groups
For operational purposes NACHU has defined its different classes of membership as78
: ! Lower paid employees of formal institutions. They are mainly interested in new build housing. ! Rural cooperatives, frequently based on agricultural marketing cooperatives. ! Middle income earners. ! Informal settlement dwellers (over 60% of NACHU’s clients). These members are primarily interested in the
micro-finance products and particularly loans for upgrading. Each category has its own characteristics so that NACHU has necessarily a different approach or product for each in terms, for example, of the location and types of housing and infrastructure to be facilitated. The micro-finance programme
NACHU has introduced an innovative micro-finance programme tailored to housing cooperatives including new housing, rehabilitation, infrastructure loans for groups, resettlement loans, and group loans for commercial purposes such as constructing a building for commercial or residential rental. The programme has borrowed from general micro-finance experience (including for example forming solidarity sub-groups of five, ‘watano’, to exert peer pressure) and adapted it to the requirements of the housing market and in particular the demand for longer-term loans. One example of the use of this is Upendo wa Jirani in Nakuru. Members have saved with NACHU and then taken loans to buy land and then build or more usually improve housing. The cost for two rooms is approximately KSh 220,000 (USD 3,300) if built of stone and using self-help. Housing units are normally blocks of approximately 10 rooms with a reasonable level of construction (plastered walls and floors) and services (water available on site, good quality pit latrines, electricity). The members take some rooms for themselves and their families and sub-let the remainder to provide income. The rent for a room is approximately KSh 1,000 per
77
There are approximately 429 registered housing cooperatives in Kenya but a number of these are dormant. 78
NACHU (2004)

Access to housing finance in Africa: exploring the issues Kenya
J G Mutero, Matrix Development Consultants, for the FinMark Trust (December 2007) 24
month (USD 15) or KSh 1,200 (USD 18) with electricity. NACHU does not record the incomes of tenants but they should have a minimum income of KSh 4,000 (USD 60) per month although some share rooms to reduce cost and therefore could have lower incomes. Thus NACHU funding facilitates not only housing and an income for the members but provides much needed rental housing to a reasonable standard. Letting and sub-letting are a fact of life in the Kenyan housing market. Since 2003 NACHU has facilitated the construction of 185 units for low-income groups and a further 80 for other cooperative clients. It has also facilitated the acquisition of close to 1,000 plots for members. While the housing process comprises much more than building housing units the number of units facilitated by NACHU provides one measure of NACHU’s effectiveness, particularly in terms of overall demand and in comparison with other providers/facilitators
79. This delivery is a small proportion
of national demand, most of which is met by the informal sector. However similar social housing organisations face the same challenges in scaling-up delivery. As the micro-finance programme grows more units are in the pipeline with 1,000 units scheduled in the 2007 – 2009 business plan although this does depend on the availability of finance. Sources of finance have traditionally included members’ savings (see below) and donors. To go to scale, NACHU is exploring the prospects of leveraging capital from corporate social responsibility funds and from the banking sector.
Sustainability of micro-finance operations
NACHU is the only institution of its kind since other micro-lenders, such as SACCOs, typically focus on trading and consumer loans, with limited lending, often indirect, for housing. There are other NGOs that are organising savings for slum dwellers leading to construction but as yet they are not attempting to establish sustainable systems but seek to manage grant funds linked to savings. Savings mobilization
Savings mobilization is especially critical for micro-finance institutions that operate without donor assistance. It is less so for NACHU as the organization has historically depended on donor grants to finance operational costs and to capitalize its revolving fund. All the same, the ability to mobilize savings is important for any financial intermediary that intends to become self-sustaining in the long-term, especially if a decline in external support is anticipated. Members’ deposits have grown considerably over the last six years and, as Table 9 shows, the increase between 2003
80 and 2005 was nearly three-fold.
Table 9: Growth of Members’ Deposits: 2001 – 2006 (KSh million)81
Year 2006 2005 2004 2003 2002 2001
Amount 18.478
USD 276,000
14.372
USD 214,500
5.323
USD 79,400
5.135
USD 76,600
3.083
USD 46,000
2.552
USD 38,100
% change + 28.6 +170.0 + 3.7 + 66.5 + 20.8 -
To be eligible for a loan one must have saved with NACHU for at least six months. Until 2006, members did not earn interest on their savings and this has probably dampened the incentive to save. Still, the expectation of obtaining a loan equal to five times one’s savings is quite appealing to members, even though NACHU may not always have the money to lend.
79
In the 40 years 1965 – 2005 NHC built a total of 42,128 units. The majority were built in the period up to 1984. 80
This is the year ending 30 June 2003, as NACHU financial years run from 1 July 1 to 30 June. 81
In the table, converted into USD at the current rate of Ksh=USD67
Upgraded housing in Nakuru. Very simple dwellings but
note the impermeable walls, the step to prevent water penetration – and the plants show a pride in the dwelling!

Access to housing finance in Africa: exploring the issues Kenya
J G Mutero, Matrix Development Consultants, for the FinMark Trust (December 2007) 25
Since July 2006, members’ savings have earned interest at the average rate paid by commercial banks during the year, published by the Central Bank of Kenya. As of 30
th September 2006, this average was 1.4%, the rate
applied to refunds to withdrawing members.82
Payment of interest on deposits is a positive development which, together with the expectation of a loan after six months, should encourage members to save and thus raise the organization’s ability to expand its lending programme. Table 10 shows the distribution of savers by the amount saved. Around 50% of the individuals have savings of not more than Ksh 20,000 (USD 270).
Table 10: Distribution of Savers by Amount Saved, as of June 2006 Savings amount: Ksh Number of savers (individuals) %
Up to 10,000 295 28.9
>10,001 – 20,000 229 22.4
>20,001 – 30,000 206 20.2
>30,001 – 50,000 212 20.7
>50,001 80 7.8
Total 1022 100.0
Loan products and terms
NACHU provides short-term housing loans for a variety of purposes: new housing and rehabilitation, resettlement loans, infrastructure loans, and some commercial (housing) loans. Interest rates are presently 15% per year for all loan products, down from 19% a few years back. This rate is based on technical advice and consultations with members at their AGM but should NACHU evolve into a market-driven organization, management will increasingly be guided by the market in setting the rate. The lending period for new housing and rehabilitation loans varies from 3 to 6 years, generally quite short for new housing but quite long relative to traditional micro-credit for business.
Delivery and management of credit
NACHU has a well-structured system for client outreach and orientation, and loans are processed quite quickly (within a month) once all conditions for eligibility are met. Several measures are taken to safeguard loans: ! A member wishing to borrow writes to his/her society which in turn applies for a loan from NACHU; ! Loan applications should be channelled through the society and loans must be guaranteed by five
members of the society; ! Borrower gives power of attorney to NACHU to hold the plot title until the loan is repaid; ! Where there is no plot title, the local municipal council/local authority must confirm that a letter of allotment
has been issued to the intending borrower; ! For rehabilitation loans, technical officers assess the cost of repair to ensure the amount applied for is
appropriate; ! Members are trained to ensure that they understand the loan process.
Loan portfolio and revolving loan fund
From previous donor grants and loans, NACHU has been able to capitalize a revolving loan fund which presently stands at Ksh 37.7 million (USD 563,000), up from Ksh 25.2 million in 2005 (USD 348,000).
Loan recovery
In examining its loan recovery record, NACHU distinguishes between old loans (i.e. more than four years old) and the more recent loans. The overall loan recovery rate is now around 86% but it varies by loan product: 69% in 2006 for new housing
82
Commercial bank interest rates on savings are very low: 1.36% in February 2006 and 1.41% in February 2007. Inflation at the end of
2006 was 15.6%, but underlying inflation (i.e. non-food items only) was 5.9%. See
http://www.cbs.go.ke/sectoral/energy/lei032007.pdf?SQMSESSID=1dec88081f33125c98cca255b5290ec4

Access to housing finance in Africa: exploring the issues Kenya
J G Mutero, Matrix Development Consultants, for the FinMark Trust (December 2007) 26
loans; 94% for rehabilitation loans; 129% for group loans83
(indicating pre-payment); 55% for resettlement loans; and 69% for infrastructure loans. The pre-payment of group loans is consistent with the commercial character of the rental housing financed by these loans. NACHU aims to achieve an overall repayment rate of 95%, a target which compares well with best practice for micro-finance operations. A loan ageing analysis shows progressive improvement in the management of arrears. The organization has started to make substantial progress in loan recovery as a result of three recent measures: recruitment of highly qualified finance staff, consisting of a finance manager and two micro-finance officers; the installation of loan tracking software; and the use of auctioneers to recover loans long overdue.
In strict terms, a micro-finance operation is sustainable only if the organization is able to cover all of its expenses with operational income, and generate sufficient surplus to maintain the real value of is equity base. In these terms, NACHU’s operations are not sustainable in that they have not attained bench marks set by best practice but there is consistent improvement.
Growing demand for loans and capital shortage
NACHU faces a greater demand for loans than it is able to meet from available resources (Table 11). The unmet demand (about 65%) was roughly estimated at Ksh 25-30 million (USD 373,000 – 448,000), a conservative amount as some potential borrowers probably do not come forward, restrained by the knowledge that NACHU has limited funds The mobilization of membership is running far ahead of the availability of resources for lending. Yet NACHU has found it difficult to raise funds from commercial banks or the capital market. Access to these sources is constrained by the relatively small size of the organization and the limited availability of mechanisms, such as guarantees, to enhance the credit standing of small organizations. NACHU is exploring ways of obtaining additional resources to expand its revolving fund, from both local and external sources.
Table 11: Measuring Unmet Demand: Loans Granted compared with Eligible Loan Applications 2006 2005 2004 2003 Total
Number of housing & rehab loan applications by individuals during the year (i.e.
loans that met NACHU conditions) 130 104 88 53 375
Number of housing & rehab loans (individuals) granted during the year 27 31 33 37 128
Loans granted as a % of eligible loans 20.8 29.8 37.5 69.8 34.1
Gender dimensions
Available data provides some insights into gender dimensions of access to loans, and savings mobilization. When active loans for new housing and rehabilitation are considered, male borrowers are twice as many as female borrowers. But the number of new female borrowers has grown over the last three years to equal that of men, suggesting a trend towards gender parity.
Conclusions
For its level of development, Kenya has a well-developed and regulated financial system and, in recent years, the mortgage finance sector has become competitive and innovative. But this sector serves only those households at the top of the income pyramid. This paper has argued that the most critical challenges in housing finance lie in developing ways to make finance accessible to the poor. Although some efforts have been made in this direction, they remain modest and of limited impact. To go to scale, it is important to develop institutional mechanisms for expanding substantially the volume of housing microfinance, primarily through the capital market. The
83
Group loans are typically made to a cooperative (often with a majority of women members) which then constructs a commercial building
for rent. The net profits are distributed to the members.

Access to housing finance in Africa: exploring the issues Kenya
J G Mutero, Matrix Development Consultants, for the FinMark Trust (December 2007) 27
potential for mobilising resources from corporate social responsibility funds needs to be tested, initially via private placement of housing microfinance bonds. This would pave the way for housing microfinance bonds to be listed at the stock exchange. Scaling up (increasing the volume of delivery by whatever strategy) has for many decades been the Holy Grail sought by those involved in low-income shelter. Throughout Africa a variety of demonstration/pilot approaches have been tried through many projects in urban areas with the objective of delivering significant numbers of units to meet demand. They have included sites and service, upgrading, core housing and many more. The reasons that they have not been mainstreamed are many. They include:
! The urban poor (and rural) have a weak political voice which often can only be expressed at elections (when they are courted by politicians who then rarely deliver on promises) or through violence – e.g. riots triggered by unemployment and poverty. In many cases the state is adept at managing concentrations of the poor through patronage and exploiting ethnic divisions.
! Improved shelter requires land. In Kenya land is largely privately owned and can only be obtained at market rates. Public land has been used by the state (particularly until 2003) as an asset to fuel the patronage system. Politicians have provided land to supporters who, in the case of slums, build housing for rental. To provide at the scale required requires political will which so far has not been in evidence.
! Effective physical planning is an underrated investment and Kenya has suffered from a lack of capacity, political interference and inadequate planning education.
! Financial resources are scarce: for acquiring land, surveying and titling (or less costly alternatives), providing infrastructure (access, water, sanitation), and construction or upgrading of superstructures – the houses. Certainly public resources financed through taxation can not meet demand and have been shown to be utterly inadequate in the past three decades.
To scale up requires appropriate policies followed by implementation in all the above segments of the shelter package. The key to financing, based on experience, is to mobilize financial resources from both public and private sectors – working in partnership. Approaches can include:
! NGOs such as NACHU have built the capacity to mobilize low income groups to organize into legally recognized bodies, to save regularly, to repay in loans in a timely fashion and, with some technical assistance, to act as housing developers. With these in place the main challenge is to supply sufficient finance as effective demand by far outstrips supply.
! The public sector has a responsibility to plan for low-income developments including upgrading, new-build, and other approaches. It should also seek to provide infrastructure finance. This can be approached in a number of ways – through municipal taxes, government taxes (both not very likely but which do provide the opportunity for transfers from richer to poorer). However, although finance could be raised through municipal bonds, the poor financial health of municipal authorities bars access to the capital market. Multilateral and bilateral institutions are also be an important source of finance for infrastructure but the accompanying conditionalities, such as good governance, are often not met by national and municipal authorities.
! Private sector finance has been lacking as formal financial institutions have been wary of lending to the poor and have also been uncertain about the high retail costs (many small loans). If it can be demonstrated that mechanisms can be developed to attract private finance (from financial institutions) a promising source of capital could be tapped. At the moment Kenyan financial institutions are seeking for opportunities to lend.
! Bonds offer one way of mobilising private capital and can also attract companies who wish to demonstrate corporate social responsibility.
Access to housing finance in Africa: exploring the issues Kenya
J G Mutero, Matrix Development Consultants, for the FinMark Trust (December 2007) 28
! The issue of who takes the lead – who initiates – is interesting. The Kenya experience indicates that it is NGOs but with some donor input. This is not necessarily a heavy input – the NACHU case shows that a partnership with a similar organisation, in NACHU’s case housing cooperative federations in Canada and Scandinavia, over a considerable time can build capacity effectively.
! Livelihoods are an essential component of pro-poor housing. Housing is not simply shelter and services but for many the means to an income leading to food security, education and other basic needs. The NACHU experience (albeit in the highly commercialized Kenyan shelter context) demonstrates this.
Finally, the paper has pointed out that there is a poor understanding of the differences between microfinance for enterprise and for housing. It is important, therefore, to develop evaluation yardsticks that are appropriate to housing microfinance.
Recommendations for FinMark Trust engagement
Recommendations for FinMark Trust engagement naturally follow from the conclusions that highlight the areas most in need of attention. Areas in which the Trust could engage include:
! Funding research on the development of evaluation benchmarks for housing micro-finance institutions and their products;
! Supporting, through technical assistance, the mobilization of resources for housing micro-finance from the capital market, including the use of guarantees;
! Supporting the compilation, updating and dissemination of data on housing microfinance.
References 1. Alder, G. and Mutero, J. (2007) Housing Micro-finance in Kenya, background paper for meeting of the Rockefeller
Foundation Global Urban Summit. 2. Banking Act (Cap 488) 3. Building Societies Act (Cap 489) 4. Central Bank of Kenya Act (Cap 491) 5. Central Bank and IFC (1984) "Report and Recommendations on the Development of the Money and Capital Markets in
Kenya." 6. CIA (2007) “The World Factbook” 7. Economic Review dated 8 - 14th November, 1993. 8. EIU (1993) Kenya: Country Report, 3rd Quarter 1993. London:EIU 9. Gachuru, W. M. (2005) “ Mortgage Default: A Case Study of the Kenyan Mortgage Market”. Doctoral dissertation.
Virginia Commonwealth University, Richmond VA USA 10. Gardner, et al. (1986) "The Housing Finance System in Kenya". A Report to USAID. 11. Government of Kenya (2007) Economic Survey 2007 12. Government of Kenya (1993) Economic Survey 1993 13. Gulyani, S. et al. (2006) “Inside Informality: Poverty, Jobs, Housing and Services in Nairobi’s Informal settlements”.
Report No. 36347-KE. The World Bank. 14. HFCK (various years) Annual Reports 15. Institute of Policy Analysis and Research (2005) “Capital Market Policies in Kenya: Historical challenges and Trends”.
Policy brief, Vol II, Issue 4, 2005 16. Inter-American Development Bank (1994) “Technical Guide for the Analysis of Microenterprise Finance Institutions” 17. Jorgensen, N. O. (2006) “Housing the No-income Group: The role of Housing Finance in Alleviating Urban Poverty”.
Draft paper for Housing finance International 18. Jorgensen, N. O. (1970) "The Mortgage Market in Kenya". Economic Study No. 7. Housing Research and
Development Unit, University of Nairobi. 19. Mutero, J. et al (2004) “Upgrading of Low-Income Settlements in Sub-Saharan Africa - Assessing the Impacts of Formal
and Informal Interventions”. Report prepared for the World Bank
Access to housing finance in Africa: exploring the issues Kenya
J G Mutero, Matrix Development Consultants, for the FinMark Trust (December 2007) 29
20. Mutero, J. (1988) “Housing Subsidies in Nairobi and their Implications for Equity” MPhil thesis, University of Cambridge 21. Mwangi, I. K. (1997) “The Nature of Rental Housing in Kenya” Environment and Urbanization, Vol. 9, No. 2. 22. NACHU (2004) “The Report on the Finance Management and the Strategic Plan”. 23. NHC (various years) Annual Reports 24. NHC (various years) Annual Accounts 25. Odundo, E. 2003 “The Perspective of the Retirement Benefits Authority” paper by the CEO at a Sub-Saharan Africa
seminar held at the World Bank headquarters. 26. Okonkwo, O. (1998). “Housing Finance and Housing Delivery Sysytems in Kenya: Bottlenecks, Recent Developments
and the Way Forward”. Housing Finance International. 27. Robinson R. (1981) “Housing Tax Expenditures , Subsidies and the Distribution of Incomes” The Manchester School of
Economics and Social Studies, 1981, pp. 91-110. 28. Saltzman, S. et al (1998) “The ACCION CAMEL. Technical Note”, a manual on the financial and managerial evaluation
of microenterprises. 29. S&L (various years) Annual Reports 30. World Bank (2006) Making Finance Work for Africa 31. World Bank (1983) "Kenya: Economic Development and Urbanization Policy" Vol. II, Report NO. 4148-KE.
Websites
1. www.oanda.com
2. www-personal.umich.edu/~kathrynd/kenya.2005.pdf 3. www.cia.gov/library/publications/the-world-factbook/print/ke.html 4. www-personal.umich.edu/~kathrynd/kenya.2005.pdf 5. www.doingbusiness.org/ExploreEconomies/?economyid=101 6. www.housing.go.ke/kensup.html 7. www.finscope.co.za 8. www.housing.co.ke/inner.asp?cat=finacialstats&subcat=aboutus 9. www.cbs.go.ke/sectoral/energy/lei032007.pdf?SQMSESSID=1dec88081f33125c98cca255b5290ec4

Access to housing finance in Africa: exploring the issues Kenya
J G Mutero, Matrix Development Consultants, for the FinMark Trust (December 2007) 30
Annex 1: Informal Housing Finance in Nairobi
There is a major gap in our understanding of how poor households access informal finance to improve their housing conditions. Informal finance includes loans and grants from relatives and friends, as well as from rotating savings and credit associations, commonly referred to as merry-go-rounds in Kenya and elsewhere. In view of this limited knowledge, a small-scale field study was carried out in October 2007 in three low-income settlements in Nairobi: Mwiki, Kiambiu and Huruma. Mwiki, on the outskirts of Nairobi, is an example of the newer settlements that have developed in the city’s peri urban belt, built primarily on land acquired from private owners by land buying companies. Kiambiu and Huruma are inner-city slums which accommodate some of the poorest households in Nairobi on land which belongs to public authorities (either government or the City Council of Nairobi). In Mwiki, the savings groups do not seem to have links with formal micro-finance institutions. But in both Kiambiu and Huruma, what started as informal savings groups have, in time, established links with micro-finance institutions, Jamii Bora and Akiba Mashinani, respectively. Interviews in these locations consisted of focus group discussions (FGDs) with house owners, primarily to draw out information on how they access finance to buy land and build their houses. Because the investigation was limited to a small number of FGDs84, it is difficult to generalize from the results. Significant differences from one situation to the next appear to exist. Still, the outcomes of the survey provide some useful insights into how the poor access informal housing finance. More detailed descriptions follow the summary tables, below.
Mwiki Kiambiu Huruma
Ge
ne
ral d
esc
rip
tion
Mwiki, in Kasarani Division of Nairobi, lies 25 km from the Central Business District. The land initially belonged to the Kenyatta
85 family but it was later
sold to land buying companies and cooperatives. One of these, Karura land buying company, later bought most of the area to settle their landless from Karura village on the outskirts of Nairobi. Some of the land was previously a quarry, but the site now accommodates shanties, semi permanent and permanent structures, shops, churches, private schools and clinics.
Kiambiu lies approximately 12 km East of Nairobi’s Central Business District. Administratively, it is in Eastleigh South sub-location in Pumwani Division. It is linked to Eastleigh and other parts of the city by a murram road. The settlement derives its name from a former prominent politician, Mbiu Koinange, who frequently used the adjacent Eastleigh Airbase during Kenya’s war of independence. Most of the houses are built of temporary materials such as mud and timber under an iron roof. A few individuals have managed to use quarry stone. There are neither access roads nor electricity in the slum. Water is provided by individuals and Maji na Ufanisi, an NGO, which also runs a pay-as-you-use public bathroom and toilet. Toilets generally consist of pit latrines, some of which are constructed on top of a sewer pipe illegally breached for this purpose. There are drainage channels constructed by Kiambiu youth groups. Between the houses there are cowsheds.
The area is called Kampi ya Moto and it is in the Kiamaiko area of Huruma about 7 km from the Central Business District. Pamoja Trust is assisting in upgrading the area which previously had no roads, water and decent houses.
84
Three FGDs in Mwiki, and two each in Kiambiu and Huruma 85
The first president of Kenya

Access to housing finance in Africa: exploring the issues Kenya
J G Mutero, Matrix Development Consultants, for the FinMark Trust (December 2007) 31
Re
aso
ns fo
r se
ttlin
g
Households gave the following reasons for settling in Mwiki: ! Land prices in the area were
low as the site is rocky and not many people were interested in it.
! Deposits for plots of land, each Ksh 11,000 in 1998, were affordable as they were payable over a long period;
! They had no other land on which to settle;
Households gave the following reasons for settling in Kiambiu ! Proximity to town ! It was an open area behind the Eastleigh
Air Base ! Residents settled illegally but the Chief86,
in 1999, allocated them temporary occupation licences for plots of 10’x14’ for which they paid Ksh 5,000.
! Most of the people are casuals and are able to walk to work in town, Buru Buru and the industrial area.
Initially it was a parking area for people who lived in surrounding government quarters. Through the Chief’s intervention people put up temporary structures in 1977. In 2001 the City Council, through intervention by Pamoja Trust, allowed them to put up permanent structures. Each member got a plot of 14’x14’.
Ow
ne
rsh
ip
do
cu
me
nts
a
va
ilable
The majority of households have share certificates from the land buying company but there are some who have title deeds. Obtaining a title deed costs Ksh 18,500 (USD 280) which most of them cannot afford.
The people have temporary ownership certificates and allotment numbers, given by the Chief and the Nairobi City Councillor for the area.
There is only one block temporary certificate of ownership, communally owned to stop members from selling their plots.
MWIKI
Price of plots
Prices were Ksh11,000 per share87 in 1998 for a 50’x75’ plot. Today the same plot costs between Ksh 300,000 and Ksh 500,000 (USD 4,500 - 7,500), depending on the actual location. Plots nearer the main road are more expensive Financing purchase of plots
Individuals used their wages from casual labour (in coffee plantations) to buy plots. With as little as Ksh 20 one could register to buy shares in the land buying company. Financing also came from merry-go-rounds and savings built up over a long time. Financing of house construction
The original plot owners approached quarry owners to determine how much they would be required to pay, in instalments, for a lorry-load of quarry stone. Typically, a quarry owner would open a register to record the installments received from a plot owner, until enough materials had been paid for. Other plot owners save with hardware shops, following a similar procedure. Installments are affordable as they range from Ksh 50 to Ksh 500 (USD 0.75-7.5). Depositing money with these “intermediaries” protects savings from diversion to other purposes Establishment of savings and credit groups
There are merry-go-round groups organized by women each consisting of 5 to 10 people. Members save an average of Ksh 50 (USD 0.75) per person per week. Borrowing is based on the amounts saved and it is normally rotational. Savings are mainly used for buying household items such as furniture and cutlery. When these groups grow, some get registered by the Department of Social Services (NCC). Examples of the strongest groups in Mwiki are:
86
A civil servant in the provincial administration. 87
When they first acquire unsurveyed land, land buying cooperatives sell shares to their members, convertible into title deeds upon
completion of cadastral surveying.
Access to housing finance in Africa: exploring the issues Kenya
J G Mutero, Matrix Development Consultants, for the FinMark Trust (December 2007) 32
! Mwangaza Self Help Group ! Kasarani Development Initiative Self Help Group ! Karura Women Self Help group Savings groups in Mwiki, unlike in the other two sites, generally do not use their savings to finance housing, and do not appear to have developed links with housing micro-finance institutions. Borrowing from banks
The study estimated that the proportion of residents with bank accounts is about 10% composed of newcomers who mainly work in the CBD or elsewhere. As they have established businesses these residents are able to borrow from Equity Bank or Family Finance Bank. The original owners, who mainly live further away from the main road, have no bank accounts as their incomes are very low and they are not able to meet the stringent requirements for account opening. Banks have not established themselves in Mwiki. House construction stages
The majority of owners construct their houses in stages. The first stage is to accumulate enough savings for the purchase of construction materials to build one room. Once enough materials have been purchased, they are taken to the site. The second stage is to look for construction workers to build the foundation and cast the floor slab. Building proceeds in stages as money becomes available to pay the workers, and it can take up to 4 years to construct two to three rooms. A standard sized room of 10’x10’ built of permanent materials would roughly cost Ksh 85,000 (USD 1,300) while a semi-permanent room would cost Ksh 45,000 (USD 670). The cost varies due to changes in the price of construction materials and the time taken to complete one room. Household Income
Household income ranges from Ksh.3,000 to Ksh.6,000 (USD 45-90) per month88. Generally, the main source of income for men is work on construction sites or quarries, while women earn their livelihoods from selling vegetables, working as house-helps or washing clothes. Household incomes are erratic as they are derived primarily from casual employment. Household Expenditure
The study established that, on average, a typical household spends Ksh 200 (USD 3) on food per day if three meals are taken, or Ksh 6,000 (USD 90) per month. To save money for house building, households skip meals and cut down on other expenditures.
KIAMBIU
Prices of Plots
Originally owners saved gradually until they raised the required Ksh 5,000. Today a structure goes for Ksh 30,000 (USD 450) and the plot Ksh 120,000 (USD 1,800). Financing purchase of plots
! Savings over time from casual labour up to 3 years ! Others joined merry-go-rounds
88
The higher figure is about USD 90
Access to housing finance in Africa: exploring the issues Kenya
J G Mutero, Matrix Development Consultants, for the FinMark Trust (December 2007) 33
! Yet others joined Jamii Bora Trust that gave them loans in the form of construction materials. Residents buy shares and depending on the number one has, one is eligible for a loan of between Ksh.1,000 and Ksh.5,000 (USD 15-75), payable at Ksh.50 (USD 0.75) per week.
Financing of house construction
Residents get loans from Jamii Bora Trust which are given out in the form of materials. A room of 10’x10’ costs Ksh.10,000 (USD 150) which takes about 3 years to pay back. Establishment of Savings and Credit Groups
! Some people are members of Jamii Bora Trust ! There are church-based merry-go-rounds. The members are usually 10-15 and they pay about
Ksh.50 (USD 0.75) per week. ! Loans given to members range from Ksh.1,000 to Ksh.10,000 (USD 15-150) depending on one’s
shares. Borrowing from Groups
! Jamii Bora Trust loans carry an annual interest rate of 10%. For Ksh.10,000 (USD 150) one is given 50 weeks to pay.
! The default rate is very low and where people are not able to pay the groups take up the responsibility to do so.
Borrowing from Banks
! A few people (10%) have accounts in Equity Bank ! The rest save with Jamii Bora Trust House Construction Stages
! Jamii Bora Trust gives the materials to construct depending on one’s savings ! A 10’x10’ structure costs Ksh 10,000 (USD 150). If materials are readily available it takes 2
weeks to build a temporary structure but 3 months if there is no consistent supply of materials
Household Income
It is very hard to determine household incomes as these vary quite a lot. An average household will take home about Ksh.2,500-4,500 (USD 37-67) per month. But it is not unusual for some households to have incomes as large as Ksh.10,000 (USD 150), especially those that work in the industrial area. Some men work in the industrial area as casual workers whilst others sell clothes in Gikomba market. Yet others are hawkers and businessmen (kiosk owners). Women work in the adjacent estates as house-helps, casual workers, hawkers and in businesses (operating small kiosks in the slum). In a day a household can spend at least Ksh.180 (USD 2.6) on breakfast, lunch and supper, which translates to Ksh.5,400 (USD 80) per month. Most of the household income is spent on food and education.
HURUMA
Price of a Plot
To acquire a plot from the Nairobi City Council every member was supposed to pay Ksh.7,500 for subdivision and property rates. The deposit for the plot was Ksh.1,000 followed by a monthly contribution of Ksh 154 (USD 2.3) for about 20 years. The whole process started back in 1977. Financing Purchase of Plots
The residents, through facilitation by Pamoja Trust, formed Muungano wa Kampi ya Moto, a self- help

Access to housing finance in Africa: exploring the issues Kenya
J G Mutero, Matrix Development Consultants, for the FinMark Trust (December 2007) 34
group registered by the Department of Social Services. This self-help group then became a member of Akiba Mashinani Trust, a countrywide fund of Pamoja Trust. Muungano wa Kampi ya Moto raised 10% from its members and then Akiba Mashinani Trust loaned the remaining 90%. Members pay Ksh 50 per week (USD 0.75) and after paying the equivalent of 10% they start getting building materials. Borrowing from Groups
Akiba Mashinani Trust has made available construction loans amounting to Ksh.4.9 million (USD 73,000). Already, 62 rooms are ready. The project has 321 members and each member is expected to own 2 to 3 rooms. Borrowing from Banks
People do not borrow from banks but from the Trust through the group facility. House Construction Stages
Through Pamoja Trust the members open a project account which deals with all building requirements. After saving at least 10%, Pamoja Trust gives members papers to apply for the remaining 90% for house construction. The money is transferred to Muungano wa Kampi Moto Trust which has the technical capacity to manage project activities. Household Income and Expenditure
Most men and women are casual workers, some of whom sell vegetables whilst others work in kiosks. Yet others work in construction sites as masons. Household incomes range from Ksh.3,500 to Ksh.6,500 (USD 52-100) per month. Most households spend about Ksh.100 (USD 1.5) per day.