housing finance in africa botswana final · access to housing finance in africa: exploring the...
TRANSCRIPT

ACCESS TO HOUSING FINANCE IN AFRICA: EXPLORING THE ISSUES
BOTSWANA
Overview of the housing finance sector in Botswana, commissioned by the FinMark Trust with support from
Lex von Rudloff
October1 2007
1 This paper updates an earlier version published on FinMark Trust’s website in July. Changes were minor.
ACCESS to
housing
finance in
Africa
Access to housing finance in Africa: exploring the issues Botswana
BACKGROUND TO THE SERIES Since 2002, the FinMark Trust has been pursuing its mission ‘to make financial markets work for the poor’ in the Southern African Customs Union (SACU) countries: South Africa, Botswana, Namibia, Lesotho and Swaziland (BNLS). Based in Johannesburg, the. FinMark Trust is an independent trust provided with core funding by the South African office of the UK Department for International Development (DFID).
2 In September 2006, FinMark
Trust received a three year extension to its mandate, to continue with its work in SA but also to broaden its operations and services into the rest of Africa. FinMark Trust’s goal is still focused: To support systemic change in the way Africa’s financial markets operate so that they work more effectively for the poor, whether consumers or producers. As a first step, FinMark Trust has already promoted the application of FinScope™, its survey of individual usage
of financial services, in nine African countries.3 FinScope™ will provide baseline data to stimulate policy
change and support innovation by commercial providers seeking to deliver products and services sustainably to consumers who are currently outside the formal financial system. FinMark Trust will build on the impact of
FinScope™ by promoting and supporting change processes across the continent.4
For FinMark Trust’s housing finance theme
5, understanding the nature of an ‘access to housing finance’
question on the wider African continent, and targeting what areas of enquiry are relevant in an African context, has been challenging. Certainly, there are many local and international players already operating throughout Africa. What role can the FinMark Trust play in this environment? This report is the second of a series of studies which will explore access to housing finance in various African countries. It is meant as an input into a larger debate about how to enhance access to housing poor by low and moderate income earners throughout Africa. Comments and contributions can be sent to the FinMark Trust’s Housing Finance Theme Champion, Kecia Rust on [email protected]. The FinMark Trust hopes that its research into access to housing finance in Africa will begin to shed some light on the key issues facing the poor as they seek to mobilise the finance necessary to access adequate and affordable housing.
Country Profile: Botswana6
! Population: 1,8 million (UN, 2005) ! Capital: Gaborone ! Area: 581 730 sq km (224 607 sq miles) ! Major language: English (official), Setswana ! Major religions: Christianity, indigenous beliefs ! Monetary unit: 1 Pula = 100 thebe ! Main exports: Diamonds, copper, nickel, beef ! GNI per capita: US $4,340 (World Bank, 2005)
2 For more information, visit www.finmark.org.za. Also visit the FinScope™ website: www.finscope.co.za and the Financial
Diaries website: www.financialdiaries.com. 3 FinScope™ is a nationally representative study of consumers’ perceptions on financial services and issues, which creates
insight to how consumers source their income and manage their financial lives. The sample covers the entire adult population, rich and poor, urban and rural, in order to create a segmentation, or continuum, of the entire market and to lend perspective to the various market segments. FinScope™ explores consumers’ usage of informal as well as formal products and builds a picture of the role that the informal sector can play in the financial markets of developing countries. Since FinScope™ is a perceptual study, it also encompasses attitudes, behaviours, quality of life factors and consumption patterns. See www.finscope.co.za 4 By 2012 it is intended that some 20 countries in Africa will have the survey. Repeat studies will take place on 2-3 year
cycles, enabling trends within countries to be monitored and providing the basis for cross-country comparison especially around access to finance. FinScope™ data will provide financial service providers and regional integration initiatives with comparable, standard and reliable data about demand for financial services across borders. (FinScope™ Africa Brochure) 5 To go to the housing finance theme page, go to www.finmark.org.za, click on “themes” and then click on “housing finance”.
6 From FinScope™ website.

Access to housing finance in Africa: exploring the issues Botswana
for the FinMark Trust (October 2007) 3
Exploring housing finance in BOTSWANA The housing finance sector in Botswana continues to expand in all sectors of the market, with high-end mortgage borrowing showing particular growth. All the major commercial banks and the Botswana Building Society continue to increase the book value of their mortgage portfolios, and construction of private housing, particularly in the mid- and high-cost brackets continues to grow. However, the low end of the housing finance market, particularly with regard to employed people in the lower income brackets and among the informally self-employed or under-employed, is not adequately addressed, and it is in this area that development efforts could make a substantial impact. This report outlines key findings of a study into the housing finance sector in Botswana. It outlines key findings relating to the status of housing finance and the general availability of housing in Botswana. Lex von Rudloff of EMANG PROFESSIONAL SERVICES conducted a survey of financial institutions and housing-related government agencies during May 2007. Financial and economic data from a number or sources, particularly the Bank of Botswana and the Central Statistics Office, are included in the report and supplement information garnered from interviews with a range of people in the banking, housing and housing finance sectors, as well as general information garnered during the course of the researcher’s permanent presence in the country. The intent of this document is to provide a general overview of economic and housing conditions in Botswana, and specifically the performance of the housing finance sector, in order to contextualise a set of recommendations for potential areas of intervention for FinMark Trust. To this end, this report is neither definitive nor exhaustive – but rather a basis for engaging in further discussion regarding the housing finance sector in Botswana. Comments, challenges and perspectives are welcome. Comments or questions should be directed to the FinMark Trust’s Housing Finance Theme Champion, Kecia Rust, by email to [email protected], or on +27-83-785-4964.
EXPLORING HOUSING FINANCE IN BOTSWANA .............................................................................................3
OVERVIEW OF BOTSWANA’S MACRO ECONOMY...........................................................................................4
EMPLOYMENT & HOUSEHOLD INCOMES .......................................................................................................13
ACCESS TO FINANCIAL SERVICES IN BOTSWANA.......................................................................................15
HOUSING FINANCE – OVERVIEW .....................................................................................................................19
HOUSING DEMAND & SUPPLY..........................................................................................................................26
KEY PLAYERS AND POSSIBLE INTERVENTIONS...........................................................................................28
PROPOSED AREAS FOR POSSIBLE INTERVENTION.....................................................................................30
Acronyms and Abbreviations
BBS Botswana Building Society BDC Botswana Development Corporation BEDIA Botswana Export Development and Investment Authority BHC Botswana Housing Corporation BoB Bank of Botswana BoBCs Bank of Botswana Certificates BPOHF Botswana Public Officers’ Housing Fund BSB Botswana Savings Bank BSE Botswana Stock Exchange BSM Botswana Share Market BTP Build Together Programme C.S.O. Central Statistics Office CEDA Citizen Entrepreneurial Development Agency CLG Customary Land Grant
CLL Common Law Leasehold COR Certificate of Rights CPI Consumer Price Index DCI Domestic Companies Index FDI Foreign Direct Investment FNB First National Bank FPSG Fixed Period State Grants GEMVAS Government Employee Motor Vehicle Advance Scheme H.I.E.S. Household Income and Expenditure Survey IMF International Monetary Fund NDB National Development Bank NDP 9 Botswana Government National Development Plan 9 SHHA Self-Help Housing Association VDC Village Development Committee

Access to housing finance in Africa: exploring the issues Botswana
for the FinMark Trust (October 2007) 4
Overview of Botswana’s macro economy The Republic of Botswana is situated in Southern Africa between South Africa in the south and east, Namibia to the west, Zimbabwe to the north-east and Zambia and Angola to the north. Some important facts:
! Size and Population: Though approximately the same size as France or Texas, the population is only about 1.8 million people, roughly 80% of the population of the city of Durban, South Africa.
! Currency: The national currency is the Pula (100 Thebe = 1 Pula) and at current rates a Euro equals about P 8.33, a US dollar about P 6.15 and a South African Rand P 0.87.
! Unemployment: According to the 2005/2006 Labour Force Survey, a total of 114,422 persons out of a total labour force of 651,465 were unemployed, representing an unemployment rate of 17.6% (15.3% male; 19.9% female).7
! Education: 2004 statistics showed that 328,692 children were enrolled in primary schools, 158,839 in secondary schools and a total of 22,276 young adults were enrolled in tertiary institutions. In total, 519,807 persons (about 32% of the total (2004) population) were enrolled in educational facilities.
Since independence, Botswana has had one of the fastest growth rates in per capita income in the world. Botswana has transformed itself from one of the poorest countries in the world to a middle-income country with a per capita GDP of $6 500 in 2005-068, the highest in sub-Saharan Africa. Economic growth averaged over 9% per year from 1966 to 1999. The very successful mineral sector (38% of GDP in 2005-06) has provided the financial base for rapid infrastructural development, and the Government has invested heavily in health, education as well as in security. Development (investment) expenditure (P9.04bn ($1.47bn) in 2005-06) has averaged 28% of total Government expenditure since 1995-96, although the current level (21% in 2005-06) is considerably lower than during the previous decade (37% in 1996-97 and 36% in 1997-98). Botswana’s economy is stable, has shown strong positive growth, relatively modest inflation, increasing capital market activity and illustrates the benefits of prudent macroeconomic and regulatory policies over the years. The government has maintained a sound fiscal policy, despite consecutive budget deficits in 2002 and 2003, and a negligible level of foreign debt. It earned the highest sovereign credit rating in Africa and has accumulated foreign exchange reserves (over $7bn in 2005/2006) amounting to almost two and a half years of current imports. Botswana's impressive economic record has been built on the foundation of wisely using revenue generated from diamond mining to fuel economic development through prudent fiscal policies and a cautious foreign policy. Debswana, the only diamond mining company currently operating in Botswana, is 50% owned by the government and generates about half of all government revenues. Copper-nickel and gold are also mined in the country. There is an active programme of mineral prospecting in place, with further discoveries of diamonds, copper, nickel, silver and uranium which are likely to lead to new mining operations in the next few years. Botswana also has extensive coal deposits, which are likely to provide the basis for a greatly expanded generation of electricity to meet domestic and regional needs. Development Spending
Trends in Botswana’s development expenditure are illustrated below:
7 Source: Central Statistics Office
8 Source: IMF ($5 000 at current 2007 exchange rates)

Access to housing finance in Africa: exploring the issues Botswana
for the FinMark Trust (October 2007) 5
Figure 1: Development Expenditure 1995 - 2006
Development Expenditure 1995 - 2006
02
46
810
1214
1618
20
1995
/96
1996
/97
1997
/98
1998
/99
1999
/00
2000
/01
2001
/02
2002
/03
2003
/04
2004
/05
2005
-06
Pu
la b
n
Total Expenditure
Development expenditure
Source: Bank of Botswana
Based on mineral revenues, Government development spending has been equivalent to 30-40% of GDP in recent years, and provides an important driver of economic activity. However, development spending was cut by 10% in 2002-2003 as a result of recurring budget deficits and rising expenditure on healthcare services. Botswana has been hit very hard by the AIDS pandemic: the average life expectancy in Botswana at birth, fell from 64 years in 1990 to 40 years in 2005. This is well below the 59-year average for low-income countries, and Botswana residents, along with those of Swaziland, have the shortest average lifespan in the world. Approximately 17%9 of Batswana are HIV positive, giving Botswana the second highest HIV prevalence rate in the world after Swaziland. The government recognizes that HIV/AIDS will affect the economy and is trying to combat the epidemic, including free Antiretroviral (ARV) drug treatment and a nation-wide Prevention of Mother-to-Child Transmission program. Some of Botswana's budget deficits in recent years can be traced to relatively high health (P2.056bn ($334m) - about 3% of GDP in 2005-06) and military expenditures (P1.446bn ($-235m) about 2.5%%), though the budget has since returned to a surplus situation. The Botswana government is respected internationally for its successful multilateral peacekeeping operations and assistance efforts.10 Economic Growth
Botswana continues to show sustained economic growth, with stable economic fundamentals. The economy has continued to grow, averaging 6,5% over the last 10 years. The trend line indicates a declining tendency over the decade. Figure 2: GDP Growth at Constant Market Prices [Source: Bank of Botswana]
- 2.0
0.0
2.0
4.0
6.0
8.0
10.0
12.0
14.0
16.0
1996/97 1997/98 1998/99 1999/00 2000/01 2001/02 2002/03 2003/04 2004/05 2005/06
9 Higher figures are routinely published, but these are generally based on antenatal surveys of pregnant women, not on
general population studies. 10
Source: Wikipedia

Access to housing finance in Africa: exploring the issues Botswana
for the FinMark Trust (October 2007) 6
Inflation
According to the Bank of Botswana, annual inflation, as measured by the Consumer Price Index (CPI), was 7.2% in February 2007, a marginal fall from 7.4% in January. This is 0.2% above the upper end of the Bank of Botswana’s inflation objective for 2007 of 4 – 7%. Since March 2007 inflation has fallen within this range at 6.3-6.5%. Although Botswana inflation has generally been kept below 10%, it has nonetheless been higher than that of South Africa and other trading partners, which has led to concerns about international competitiveness, and in turn required a relatively tight monetary policy and high interest rates. The inflation trend for the previous decade is illustrated below: Figure 3: Annual Inflation: 1997 - 2006
Source: Bank of Botswana
Table 1: Key Economic Data
BOTSWANA (Pula million, unless otherwise stated)
(US$ 1.00 = P6.15) 1998-1999
1999-2000
2000-2001
2001-2002
2002-2003
2003-2004
2004-2005
Population (millions) 1.60 1.64 1.68 1.73 1.77* 1.81 1.86
Nominal GDP at current prices 28 244.8 34 787.1 35 693.3 39 398.3 42 573.0 49 620.9 57 137.4
GDP at Constant (1993/94) prices 15 581.6 16 718.6 18 242.3 18 530.4 20 297.7 20 985.3 22 742.2
Real GDP growth rate (%) 7.13 7.30 9.11 1.58 9.54 3.39 8.37
GDP per capita (Pula) 17 653.0 21 211.7 21 246.0 22 773.6 24 052.5 27 414.9 30 719.1
Household Final Consumption (% GDP) 29.2 27.8 24.3 26.1 26.7 28.2 27.8
Average exchange rate: USD to BWP 0.2243 0.2159 0.1865 0.1432 0.1829 0.2251 0.2142
Inflation rate (%) 7.2 8.9 7.1 5.9 12.2 6.7 7.1
Prime lending rate (average for year) % 14.81 15.75 15.75 16.75 15.75 15,75 15.74
Domestic credit to government 14.5 14.9 2.3 0.7 0 1.0 1.8
Domestic Credit to Parastatals 266.7 527.6 458.1 479.9 462.0 411.4 395.5
Domestic credit to private sector 2682.0 3648.2 4467.7 4978.8 6159.1 6561.6 7471.2
Merchandise exports (as % of GDP) 51.7 48,3 38.9 41.6 38.7 40.7 46.4
Merchandise imports (as % of GDP) 36.5 32.0 26.9 29.0 27.2 31.6 29.6
Financial account of balance of payments -1127.6 -1029.8 -2976.1 -1374.5 -1874.8 -1556.2 -295.6
Overall balance on balance of payments 1829 1941 1023 336 797 -272 7036
Forex reserves (USD millions) 6229 6317 5897 5474 5339 5660 6309
* C.S.O. H.I.E.S 2002/2003 figure is lower: 1.63m
0%
2%
4%
6%
8%
10%
12%
14%
1997 1998 1999 2000 2001 2002 2003 2004 2005 2006
Average annual inf lation Linear (Average annual inf lation)

Access to housing finance in Africa: exploring the issues Botswana
for the FinMark Trust (October 2007) 7
Total external debt 2422.8 2425.3 2426.2 2917.4 2194.7 1989.4 2189.2
Total external debt (as % of GDP) 10.2 8.6 7.0 8.2 5.7 4.7 4.5
Commercial Banks: FCA - total deposits 6756.5 6912.3 9233.5 8982.9 10574.2 11875.9 13238.2
Commercial Banks: FCA as% of total deposits
16.2 17.2 21.4 17.1 14.4 11.8 22.1
Source: Bank of Botswana
Exchange Rates
The Pula is pegged to a currency basket comprising the Rand and major international currencies (the US dollar, euro, British pound and Japanese yen); the Rand has the largest weight, although the precise weights are not disclosed. Due to the operation of the Pula basket, exchange rate movements against the Rand and major international currencies tend to offset each other. However, there were devaluations of the Pula against all currencies in 2004 and 2005, totalling 20%, and since mid-2005 a crawling peg mechanism has been in place which has caused the Pula to weaken further. In general terms, the Pula has weakened gradually against major currencies over the last decade, while the trend against the South African Rand has been marginally positive. Figure 4: Exchange Rate movements: US Dollar and SA Rand
Source: Bank of Botswana
The Banking Sector
The Commercial Bank Sector comprises Barclays Bank of Botswana, Standard Chartered Bank Botswana, First National Bank of Botswana, Stanbic Bank, Bank Gaborone and Bank of Baroda (Botswana), the last two being relatively recent entrants into the Botswana market. As at the end of 2006, the shares of banking sector assets held by Barclays, Standard Chartered and FNB were 33%, 27% and 24% respectively, with most of the remaining 17% held by Stanbic. In addition there are a number of government or quasi-government-owned financial institutions, including the Botswana Savings Bank (BSB), the Botswana Building Society (BBS), the National Development Bank (NDB), the Botswana Development Corporation (BDC), and the Citizen Entrepreneurial Development Agency (CEDA), which have specific, development-oriented objectives within the financial sector. The total assets of the state-owned financial institutions were approximately P5 billion as at December 2006, compared to some P29 billion for the commercial banks.
! Total Deposits: Total deposits held by commercial banks increased by P9.85bn ($1.6bn) (75.4%) from P13.065bn ($2.124bn) in December 2005 to P22.9bn ($3.72bn) in December 2006. This very significant increase was due mainly to the fact that from mid-2006 Bank of Botswana Certificates (BoBCs) were no longer available to investors other than commercial banks, with the result that
0.1000
0.1500
0.2000
0.2500
0.3000
0.3500
1996 1997 1998 1999 2000 2001 2002 2003 2004 2005 2006
US
Do
lla
r
0.8000
0.9000
1.0000
1.1000
1.2000
1.3000
1.4000
1.5000
1.6000
1.7000
1.8000
SA
Ra
nd
USD ZAR

Access to housing finance in Africa: exploring the issues Botswana
for the FinMark Trust (October 2007) 8
assets of Pension and Provident funds which had previously been invested in BoBCs were diverted and invested in commercial banks.
! Credit Growth: Total lending by commercial banks totaled P10 587 million at the end of 2006, an increase of 18.8% over the year. The growth rate is above the Bank of Botswana credit growth target range for 2007 of 11-14%. Annual growth in credit to the household sector rose 1.1% to 17.6% from 16.7% and the share of credit to households was 57.5% in December 2006. Year-on-year, property loans from commercial banks to households rose by 22.5% in the year December
2006, and accounted for 23.6% of all lending to households.11
There has been a shift in the structure of bank lending to households, with property loans accounting for an increasing share. Whereas in the past Batswana appeared to be keener on borrowing for the purchase of motor vehicles than for the purchase of property, this may no longer be the case. As recently as 2002, banks lent twice as much to households for the purchase of motor vehicles as for the purchase of residential property. By the end of 2006, however, the proportions were reversed, with property lending amounting to nearly double the level of vehicle lending. As these figures demonstrate, the banks are highly liquid, with a significant excess of deposits over loans; the rapid expansion of the deposit base in 2006 led the loan-to-deposit ratio to fall below 50%. This excess liquidity is generally held in the form of BoBCs, an instrument introduced by the Bank of Botswana to absorb liquidity, facilitate control of interest rates and implement monetary policy. A high level of excess liquidity means that the banks have considerable capacity to increase lending where opportunities arise, although these have to offer a risk-adjusted return that exceeds the interest rate paid on (risk-free) BoBCs. The possible expansion of housing finance provision by the banks is not, at this stage, limited by the availability of financial resources within the banking system. Nevertheless, the BoB’s monetary policy aims to restrict the rate of credit growth in order to prevent the emergence of excessive domestic demand pressures that might lead to higher inflation. Net Foreign Assets and Monetary Aggregates
Net foreign assets grew by P12.8bn ($2.08bn) (35.84%) from P35.8bn ($5.82bn) in December 2005 to P48.62bn ($7.9bn) in December 2006. This resulted from an increase in claims on non-residents of P13.24bn ($2.15bn) (35.21%) against an increase of P409.1m ($66.5m) (22.58%) in liabilities to nonresidents. With very low foreign debt, Botswana has a significantly higher level of foreign assets than foreign liabilities, resulting in a positive international investment position. This strong position means that residents can, if they wish, borrow offshore relatively easily. Between December 2005 and December 2006 money supply growth was rapid; M1 and M2 rose by P1.12bn ($181.9m) (28.19%) and P9.85bn ($1.6bn) (67.29%), respectively. The very large increase in M2 was influenced chiefly by significant increases in the value of fixed deposit and call accounts held by pension funds who were no longer eligible to purchase BoBCs as alluded to above.12 Balance of Payments
Preliminary balance of payments estimates for 2006 show a surplus of P11.9bn ($1.93bn) on the current account, 55% higher than the P7.68bn ($1.25bn) recorded in 2005. The increase in the current account surplus reflected the combined effect of a decrease in the income account deficit and a widening of the trade surplus, where export growth of P3.9bn ($634m) to P26.56bn ($4.32bn) far outstripped growth in imports of only P696m ($113m) to P15.14bn ($2.46bn) in 2006, which ultimately increased the balance of trade surplus by P3.23bn ($525m). There was a deficit of P1.7bn ($276m) on the financial account, which continued the trend of large net outflows evident since 1998, much of
11
Source: Bank of Botswana 12
Source: Bank of Botswana

Access to housing finance in Africa: exploring the issues Botswana
for the FinMark Trust (October 2007) 9
which is due to the banks and pension funds investing assets offshore. The overall balance increased by 46% to P10.26bn ($1.67bn), from P7.0bn ($1.14bn) recorded in 2005. Foreign Exchange Reserves
Reflecting this balance of payments surplus, official foreign exchange reserves increased by P13.37bn ($2.17bn) (38,6%) from P34.6bn ($5.63bn) in December 2005 to P47.98bn ($7.8bn) at the end of December 2006, continuing the trend since 2003. Figure 5: Botswana Foreign Exchange Reserves – Pula bn
Source: Bank of Botswana
Foreign Direct Investment Strategy
Foreign Direct Investment is an important element in achieving Botswana’s objectives of sustainable growth, diversification and employment creation. The Botswana Export Development and Investment Authority (BEDIA) is spearheading the development of the national FDI Strategy. In this context diversification of the manufacturing sector into diamond cutting and polishing, glass manufacturing, secondary beef processing, amongst others, bode well for the future. Table 2: Level of Foreign Investment in Botswana by Industry (Pula m) As at December 2005 Direct Investment Other Investment
Industry Equity Non-Equity Total Equity Non-Equity Total
Mining 2 522 126 2 648 0 2 732 2 732 Manufacturing 98 48 146 0 212 212 Real estate
13 and business services 94 0 94 2 54 56
Finance 1 040 250 1 290 3 1 328 1 331 Transport, storage and communication 30 67 97 0 32 32 Hospitality 15 8 23 0 1 1 Retail and Wholesale 9 120 129 0 239 239 Other 1 16 1 0 38 38 Electricity, gas and water 0 0 0 0 176 176 Construction 0 1 1 0 4 4 Public administration 0 0 0 0 2 189 2 189 Total 3 809 636 4 445 5 7 105 7 110 Source: Bank of Botswana
Interest Rates and Bank of Botswana Certificate Yields
Prime lending rates rose from 14,0% in 1998 to 15,75% in 2000. Since then, the prime rate remained relatively static until the end of 2005, rising to 16,5% in January 2007, before being reduced to 16% in
13
Foreign financed real estate development is chiefly commercial developments: office and shopping complexes
0.00
10.00
20.00
30.00
40.00
50.00
60.00
1997 1998 1999 2000 2001 2002 2003 2004 2005 2006

Access to housing finance in Africa: exploring the issues Botswana
for the FinMark Trust (October 2007) 10
June 2007. A quick review of the yield rates for Bank of Botswana Certificates (BoBCs) over the last three years indicates the essentially stable nature of the economy: Table 3: Lending Rates and Bank of Botswana Certificate Yields Indicator 2005 Avg 2006 Avg 2007 (June)
Prime Lending Rate 15.74% 16.46% 16.0% Commercial Bank: Av. Return 17.03% 17.60% N/A Commercial Bank: Mortgages 17.36% 17.15% N/A BoB Certificates (91 day) 12.02% 12.69% 12.03% BoB Certificates (364-day) N/A N/A 11.34% Source: Bank of Botswana
Due to concerns about the level of inflation, and in particular the fact that it exceeds comparable international levels of inflation, interest rates have been kept relatively high in recent years. As at June 2006, the real (inflation adjusted) prime lending rate was around 9%. This obviously affects the general costs of borrowing and the affordability of bank loans, whether for housing finance or other purposes. Notwithstanding the generally high level of Botswana’s interest rates, competition between the banks for lending opportunities means that in practice mortgage borrowers have considerable scope to negotiate relatively favourable (below prime) rates. Interest rates are the main monetary policy instrument used by the Bank of Botswana, and in this BoBCs play a crucial role. Not only are they used to absorb excess liquidity from the banking system (which would otherwise drive interest rates down below desired levels), BoBC interest rates provide a key signal to the banks as to the BoB’s interest rate intentions. The total value of BoBCs in issue has increased steadily over the years, and amounted to P14.3bn ($2.32bn) at the end of 2006 – substantially larger than the total lending of the banking sector. This represents a resource that could in part, on the right terms, be used to finance an increase in lending to the housing sector. However, while the banks have been criticized in some quarters for buying BoBCs rather than increasing their lending further, the main point is that they do not have, at present, adequate lending opportunities that provide a more attractive return than BoBCs – otherwise, fairly obviously, they would be undertaking that lending rather than buying BoBCs. A more reasonable criticism is that the high level of interest rates, maintained for monetary policy purposes, results in fewer such lending opportunities. Figure 6: BoBCs and Government Bond Performance
As the chart shows, the yield curve is downward sloping, with interest rates on longer-term government bonds below short-term BoBC rates. This provides an indication that interest rates are expected to decline in future years.

Access to housing finance in Africa: exploring the issues Botswana
for the FinMark Trust (October 2007) 11
The Stock Market
The principal capital market institution in Botswana is currently the Botswana Stock Exchange (BSE), where company shares and bonds are listed and traded. When the BSE was established in 1989 (originally as the Botswana Share Market (BSM)), it started with only five listed companies and by the end of 2006, a total of 31 companies and 23 non-government bonds were listed. Figure 7: Market Capitalisation and BSE Index
Source: Bank of Botswana
The BSE has continued to show exceptional performance. The total value of market capitalisation has increased at an annual average of 23%, while the BSE index has also risen steadily. The domestic companies index (DCI) of the Botswana Stock Exchange (BSE) rose sharply in 2006, as the already strong demand for shares (the index rose by 23 percent in 2005) was fuelled by funds previously held in BoBCs. Trading was very active by historical standards, with 87.2 million shares valued at P415m ($67.5m) traded, compared to only 44.1 million at a total value of P239m ($38.9m) in the previous year. It is important to appreciate that the number and range of companies listed on the BSE should not be used as the only criterion for its effectiveness and importance in the Botswana economy. A standard measure that is widely used is the ratio of market capitalisation to gross domestic product (GDP). At the end of 2005, this ratio was approximately 25% in Botswana, up from 8% in 1995, and this growth indicates the growing relative influence of stock market activity in the country. However, the effective capitalisation is considerably less, as most of the listed companies allow only a proportion of their shares (‘free-float’) to be traded on the exchange, and this is a reflection of the original owners’ desire to maintain control and their share of profits. Often this proportion is small. For example, the three largest companies traded on the exchange, all of which are commercial banks, have an average free-float of only 27%, while for the most recently listed domestic company the free-float is just 5%. Partly as a result, market liquidity (turnover relative to capitalisation), is low. The long ‘bull run’ on the BSE is largely due to the impact of pension funds in the early 2000s, while the combination of increased demand and limited supply may have led to some of the BSE stocks becoming overvalued at some points over the period.14 BSE capitalisation is dominated by the three listed banks (Barclays, Standard Chartered and FNB). Two of the listed companies are primarily property companies (RDC and Turnstar), although they invest in commercial rather than residential property.
14
Source: Bank of Botswana
0.0
5,000.0
10,000.0
15,000.0
20,000.0
25,000.0
19951996 19971998 1999200020012002 200320042005 2006
Vo
lum
e (
P'0
00
)
0.0
1000.0
2000.0
3000.0
4000.0
5000.0
6000.0
7000.0
Ind
ex
(J
un
e 1
98
9 =
10
0)
Volume Index

Access to housing finance in Africa: exploring the issues Botswana
for the FinMark Trust (October 2007) 12
Pension and Provident Funds
Pension Funds are not permitted, as a prudential measure, to invest more than 70% of their portfolio offshore: Until the first quarter of 2006, total pension fund assets were considerably larger than those of the commercial banks. At the end of 2005, pension fund assets were P22bn ($3.58bn) compared to nearly P18bn ($2.93bn) for commercial banks. The introduction of the defined contribution pension scheme for public officers had a major impact on the capital market. This development saw a total of P4.9bn ($795bn) being transferred from government deposits at the Bank of Botswana to the Botswana Public Officers’ Pension Fund (BPOPF) in 2001. As of September 2005, the scheme covered over 75 000 members and, with assets having risen to more than P16bn ($2.6bn), it accounted for over 70% of total pension funds in Botswana. On the downside, the growth of the BPOPF led to a significant increase in excess liquidity in the domestic financial system, with the total stock of BoBCs increasing by more than 200% since the end of 2000. This was against the background of the relatively tight stance of monetary policy which is attractive to domestic investors. Figure 8: Pension Fund Assets (2002 – 2006)
However, since mid-2006, only the commercial banks have been permitted to hold BoBCs, and pension fund assets, previously invested in BoBCs have been largely transferred to call accounts and other commercial bank investments, resulting in commercial bank assets rising to a total of approximately P29.26bn ($4.76bn) and pension fund assets totalling P29.02bn ($4.72bn) at the end of 2006.

Access to housing finance in Africa: exploring the issues Botswana
for the FinMark Trust (October 2007) 13
Figure 9: Commercial Bank Assets
Source: Bank of Botswana
The existence of this vast capital base, 30% of which must be invested within Botswana, raises the question of how pension fund assets could be employed to secure housing loans. The legal aspects of this notion and the mechanisms to achieve it with suitable intermediaries would need to be closely examined in a separate study.
Employment & Household Incomes Employment
Of a total population (Est. 2002-03) of 1,632,992, 606,826 (37.16%) were economically active. The unemployment rate was officially stated as 23.81%, with 144,460 persons seeking work. Employment data for 2002-03 (most recent available) is summarised below: Table 4: Employment (2002-03)
% of total
pop
Economically active* 606,286 100.0% 37.1%
A: Employment for cash, of which 337,983 55.7% 20.7%
Formal sector 281,915 46.5% 17.3%
Informally employed for cash 56,068 9.2% 3.4%
B: Self-employed, of which: 123,843 20.4% 7.6%
Self-employed - own business 56,328 9.3% 3.4%
Subsistance: lands 10,370 1.7% 0.6%
Subsistance: cattle posts 57,145 9.4% 3.5%
C: Unemployed 144,460 23.8% 8.8%
*Includes potentially economically active Source: H.I.E.S 2002/2003 - Central Statistics Office
More recent employment data (preliminary, from the 2005/06 Labour Force Survey) suggests that unemployment was somewhat lower 17.6% (15.3% male; 19.9% female).
Jan Feb Mar Apr May Jun Jul Aug Sep Oct Nov Dec
0.0
5.0
10.0
15.0
20.0
25.0
30.0P
ula
bn
Bank of Botswana Certificates TOTAL ASSETS
Pension fund sell-off
of BoBCs purchased by commercial banks 2006
Access to housing finance in Africa: exploring the issues Botswana
for the FinMark Trust (October 2007) 14
From a housing finance perspective, few self-employed people earn sufficient to qualify for a home loan. This leaves the 17,3% of all Batswana that are formally employed (281,915) as the potential market for conventional housing finance. Household Income
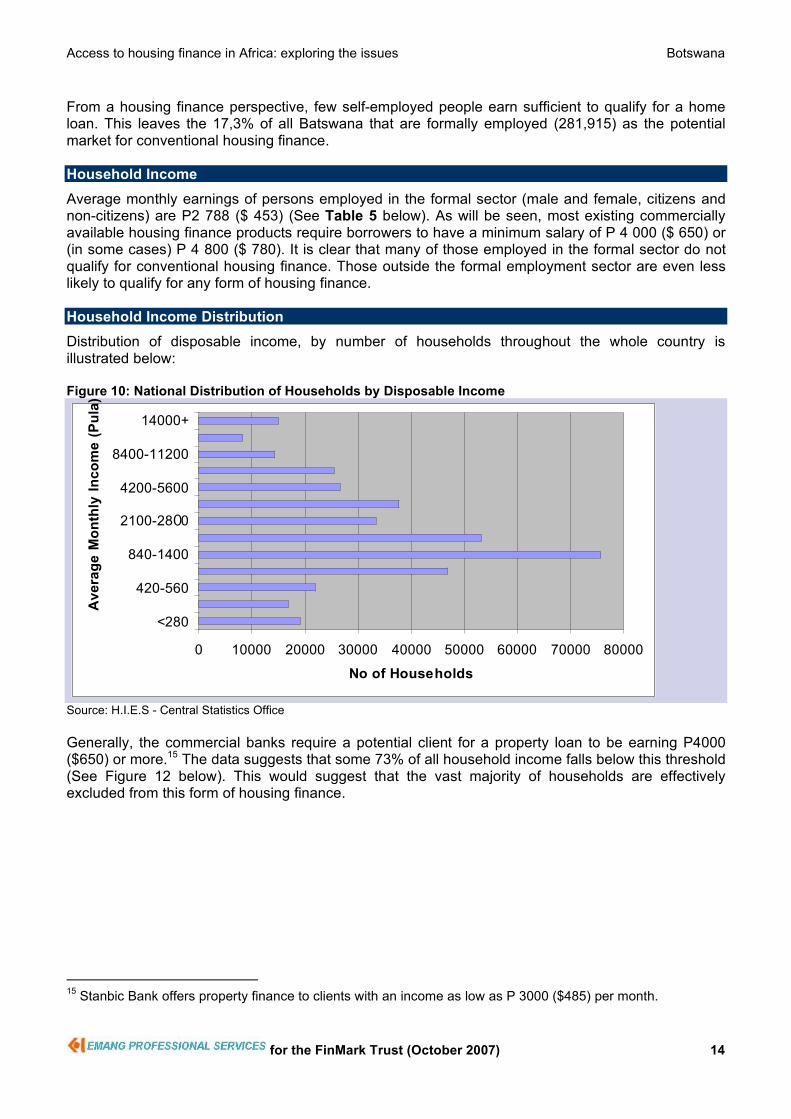
Average monthly earnings of persons employed in the formal sector (male and female, citizens and non-citizens) are P2 788 ($ 453) (See Table 5 below). As will be seen, most existing commercially available housing finance products require borrowers to have a minimum salary of P 4 000 ($ 650) or (in some cases) P 4 800 ($ 780). It is clear that many of those employed in the formal sector do not qualify for conventional housing finance. Those outside the formal employment sector are even less likely to qualify for any form of housing finance. Household Income Distribution
Distribution of disposable income, by number of households throughout the whole country is illustrated below: Figure 10: National Distribution of Households by Disposable Income
0 10000 20000 30000 40000 50000 60000 70000 80000
<280
420-560
840-1400
2100-2800
4200-5600
8400-11200
14000+
Av
era
ge
Mo
nth
ly I
nc
om
e (
Pu
la)
No of Households
Source: H.I.E.S - Central Statistics Office
Generally, the commercial banks require a potential client for a property loan to be earning P4000 ($650) or more.15 The data suggests that some 73% of all household income falls below this threshold (See Figure 12 below). This would suggest that the vast majority of households are effectively excluded from this form of housing finance.
15
Stanbic Bank offers property finance to clients with an income as low as P 3000 ($485) per month.

Access to housing finance in Africa: exploring the issues Botswana
for the FinMark Trust (October 2007) 15
Figure 11: Average Household Monthly Disposable Income [Source: H.I.E.S - Central Statistics Office]
Table 5 below provides a more detailed breakdown of average earnings by sex and citizenship. Table 5: Average Earnings Average Earnings by Industry, Sex and Citizenship, March 2005 (Values in Pula)
Male Female Total Male Female Total Male Female Total
Agriculture 658 767 697 669 472 602 660 707 677
Mining & Quarrying 4,405 5,312 4,518 12,624 11,565 12,503 4,958 5,694 5,049
Manufacturing 1,608 720 1,219 5,659 3,578 5,139 1,997 823 1,476
Water & Electricity 6,256 5,512 6,124 27,257 9,194 24,246 6,729 5,589 6,527
Construction 1,204 974 1,138 5,227 6,883 6,012 1,532 1,424 1,532
Wholesale & Retail 1,874 1,548 1,725 7,971 7,068 7,771 2,432 1,730 2,122
Hotels & Restaurant 1,166 880 1,015 4,386 4,709 4,734 1,409 1,002 1,194
Transport &Comm. 3,503 3,653 3,585 7,331 7,054 7,432 3,931 3,826 3,957
Financial Interm. 8,219 5,682 6,461 36,017 13,764 28,327 11,348 5,941 7,780
Real Estate 2,448 2,001 2,294 7,910 6,069 7,317 3,208 2,521 2,974
Education 5,807 4,317 5,010 10,708 6,597 8,892 7,190 4,851 6,009
Health & Social work 2,906 2,165 2,328 4,625 5,060 4,812 3,691 2,606 2,937
Other Community 2,786 2,356 2,629 4,224 5,985 4,590 3,016 2,466 2,795
Private & Parastatal 2,348 1,800 2,141 7,474 5,707 7,100 2,896 2,047 2,585
Private 1,953 1,455 1,765 6,789 5,489 6,544 2,491 1,721 2,210
Parastatal 6,729 6,652 6,702 23,005 15,404 21,738 7,668 6,843 7,382
Central Government 2,702 3,673 3,122 8,381 6,701 7,888 2,827 3,710 3,207
Local Government 2,569 2,515 2,545 7,761 5,172 6,564 2,650 2,560 2,610
All Sectors 2,483 2,521 2,508 7,564 5,786 7,163 2,855 2,657 2,788
Industry
Citizens Non-Citizens All Employees
Source: C.S.O.
Access to financial services in Botswana Access to financial services for many Batswana is constrained by income levels and geographical factors. Only around 45% of the Botswana population lives in settlements with a permanent banking presence, and many large population centres have no local access to banking services. Research published by the World Bank shows that Botswana, along with Namibia, has the lowest geographical penetration of bank branches out of a survey of 99 countries. This is not surprising, given that Botswana and Namibia have among the lowest population densities of any countries in the world. Of more relevance is that Botswana has a relatively low demographic penetration of bank branches; with 3.8 branches per 100 000 people, Botswana ranks 73 out of 99 countries – significantly better than most African countries but below South Africa (6.0), Mauritius (11.9) and Namibia (4.5). Botswana
0%
10%
20%
30%
40%
50%
60%
70%
80%
90%
100%
<280
420
560
840
1400
2100
2800
4200
5600
8400
1200
14000
14000+
Average Monthly Disposable Income (Pula)
Per
cen
tag
e o
f H
ou
seh
old
s
(Cu
mu
lativ
e)

Access to housing finance in Africa: exploring the issues Botswana
for the FinMark Trust (October 2007) 16
does better with ATM availability, ranked internationally at 59 out of 99 countries, with nine ATMs per 100 000 people.16 FinScope 2004 identified the following key data relating to financial inclusion:
! Overall, 54% of respondents surveyed are financially included
! Low usage of financial products/services among those aged 18-19 years
! Relatively higher usage of financial products/services among heads of households
! Higher usage of financial products/services among urban respondents compared to rural respondents: Urban 69% rural 47% financially included
Besides the unavoidable geographical limitations, there are also concerns about the effective exclusion of the low-income or unwaged segments of the population from access to banking services, due to product design and selection criteria. Essentially the structuring of banking products and services reflects a belief that there is little or no profit to be made from serving low-income and/or rural and peri-urban/semi-urban communities, given the size of population settlements in Botswana. One of the perennially controversial issues about the banking system is its profitability, especially given concerns about the level of bank charges and access issues. As shown clearly in Table 6 and Figure 13 below, Botswana banks are extremely profitable, even by African standards, where returns on assets and equity are high by world standards. In the banking sector in Africa, only Ghana, Zambia and Gabon have higher returns on assets than Botswana.17 Table 6: Banking Profitability
Figure 12: Banking Sector – Return on Assets
Source: Keith Jefferis: ‘Enhancing Access to Banking and Financial Services in Botswana.’ March 2007
16
Source: Keith Jefferis: ‘Enhancing Access to Banking and Financial Services in Botswana.’ March 2007 17
Source: IMF

Access to housing finance in Africa: exploring the issues Botswana
for the FinMark Trust (October 2007) 17
The high return on equity enjoyed by the Botswana commercial banks has been sustained over a number of years and reflects rapidly growing demand, a lack of competition and perhaps inadequate regulation of the sector. The high level of bank charges pose a barrier to the low-income group accessing banking services, effectively excluding this sector from the customer base. Access to Financial Services – Statistics
The FinScope™ 2004 survey in relation to access to financial services found the following:
! Slightly more than half of the population – 54% – is “financially served”, in the sense that they use financial services of some kind.
! About half the population - 49% – use financial services provided by formal sector entities (banks, insurance companies and formal microlenders such as Letshego). Compared to other countries in the region, this is similar to levels of financial inclusion in South Africa and higher than those in Namibia, Swaziland and Lesotho.
! 32% of the population uses informal financial products (cash loan shops, metshelo /savings clubs, credit unions and burial societies).
However, half of the financially included use both formal and informal products. Among the four types of products, the most popular are savings products (used by 51% of the population), followed by transaction products (43%), insurance products (33%), and credit/loan products (21%). Urban residents use significantly more products than rural residents across all product types. Figure 13: Overlap between Formal and Informal product use
41% 50% 9%
Total financially included n=646
Formal Service
Usage
Informal Service
Usage
45% 55%
Total formal usage n=588
Formal
Service
Usage
Informal
Service
Usage
15% 85%
Total informal usage n=382
Formal Service
Usage
Informal Service
Usage
Source: FinScope 2004
Of the 1200 respondents surveyed in FinScope 2004, 646 (54%) were ‘financially included’. The above diagrams illustrate that of these, approximately 50% used both formal and informal financial services. Of the 588 respondents using formal financial services, 45% used only formal services, while 55% accessed both formal and informal services. Of the 382 ‘informal service users’ surveyed, 85% used both formal and informal services while 15% accessed informal financial services only. There are a number of implications of the FinScope™ 2004 results for availability of and access to housing finance in Botswana. First, they show that nearly half of the population is financially excluded, in that they do not use any financial institutions, and that over half of the population is unbanked and hence are largely restricted to cash-based transactions and do not experience the benefits that various types of financial services (transactions, savings, insurance and credit) can

Access to housing finance in Africa: exploring the issues Botswana
for the FinMark Trust (October 2007) 18
provide. While it will never be feasible to aim for 100% coverage – even in developed economies there will always be some unbanked people – there is a strong case that a “financially developed” economy should be striving for much higher levels of banking coverage. The unbanked remain totally excluded from access to any kind of conventional housing finance.18 This issue is central to the housing finance predicament of the low-income sector in Botswana. Enhancing Access to Financial Services
Developing strategies to make the financial sector more inclusive – thereby increasing the benefits to the poor of participating in the formal economy – could follow a number of different courses (or a combination of them). Broadly, four main approaches could be considered:
! Encouraging institutions that already deal with the low-income market (e.g. the Botswana Savings Bank) to broaden their services.
! Encouraging private sector/market-led solutions, especially those that take advantage of emerging technological opportunities to provide low-cost banking services, perhaps making use of agents, such as retail stores.
! Changing the bank licensing regulations to provide more flexibility in the provision of banking services.
! Pushing the banks (whether by moral suasion or more formal pressure) in the direction of greater social inclusiveness.19
Regulatory overview
Financial institutions in Botswana operate in accordance with the Banking Act. The Bank of Botswana effectively implements the regulations stipulated in the Act. Through ongoing banking supervision and regulatory activities, the Bank seeks to achieve a sound and stable financial system. Accordingly, the Bank ensures that the mechanisms for sustaining the safety and soundness of licensed financial institutions are appropriate and that the institutions are managed in a prudent and safe manner. To this end, the Bank enforces prudential standards with respect to capital adequacy, liquidity, asset quality and corporate governance of the banks. In addition to its focus on the safety and soundness of licensed financial institutions, the Bank is responsible for ensuring that banks maintain high professional standards in their operations in order to provide efficient customer service in a transparent manner. The Bank also has a surveillance responsibility with regard to breaches of the Banking Act by the public, especially in the form of activities that involve unauthorised deposit taking and use of banking names. The financial services sector in Botswana is stable, generally transparent and well regulated. For the most part, the micro-loan industry is run responsibly and forms an essential part of the credit spectrum. Companies like Peo Micro and Letshego fill a need within a particular niche market. The lower-end micro-lending entities, however, are less well regulated and consequently dubious practices such as confiscation of identity and bank ATM cards, extortionate interest rates of up to 30% per month, ‘debt-trap’ loan agreements and strong-arm credit control tactics tend to characterise this segment of the industry.
18
Source: FinScope™ 2004 survey 19
Source: Keith Jefferis: ‘Enhancing access to banking and financial services in Botswana.’ March 2007

Access to housing finance in Africa: exploring the issues Botswana
for the FinMark Trust (October 2007) 19
HOUSING FINANCE – OVERVIEW Demand for Housing Finance
The demand for housing finance originates from four main sources:
! Construction of new housing units, either as primary dwelling or as speculative venture developments, financed through a mixture of wholesale and developer finance
! New housing purchase, similarly as primary dwelling or as speculative venture acquisition20
! Secondary market transactions: Upwardly mobile, middle- and upper income households changing their housing circumstances by selling existing accommodation and progressing up the ‘housing supply ladder’, and
! Construction / Refinancing Requirements: households that already own accommodation seek financing to release the equity in their accommodation, so as to improve their current housing conditions.
As will be described below most commercial banks require a client to have a minimum monthly income of P4 000 ($650) and impose a maximum debt-ratio of 40%.21 The following table illustrates the maximum housing loan available to the various income groups: Table 7: Housing Loan Affordability
Net Monthly Income 4000 5000 6000 7000 8000
Maximum Loan Value 115000 143755 172500 201250 230000
Monthly Instalment 1600 2000 2400 2800 3200
Net Monthly Income 9000 10000 12000 14000 16000
Maximum Loan Value 258760 287500 345000 402500 460000
Monthly Instalment 3600 4000 4800 5600 6400
Assumptions: Term: 20 years; Max debt ratio: 40%; Interest @ 16% (all values in Pula)
Conventional Housing Finance
The commercial banks and the Botswana Building Society (BBS) are the only conventional housing finance providers. These institutions finance all forms of property development, commercial, industrial and residential. While the commercial banks have largely mixed portfolios, BBS concentrates on the residential sector, and 80% of BBS mortgages are for residential properties. The commercial banks are answerable to their shareholders and consequently the granting of loans is subject to strict business risk mitigation principles22. Although there is some variation between the banks, and all loan conditions are often negotiable within certain limits, typical conditions include:
20
A proportion of this is purchased for rental, but exact data is unavailable. The vast majority is development for sale, some of which will be put on the rental market by the buyer. 21
Unlike in South Africa, borrowers are not legally obliged to establish their clients’ total indebtedness before granting a loan. 22
Government interventions such as the GEMVAS loan guarantee scheme have facilitated access to loans for low-income persons and subsequent high default rates may have made the banks more, rather than less risk-averse.

Access to housing finance in Africa: exploring the issues Botswana
for the FinMark Trust (October 2007) 20
Table 8: Typical Housing Loan Characteristics
Interest Rate Around Prime (currently 16%) - typically variable Customers with superior credit rating and / or larger deposit will often obtain reduced interest rates, and vice-versa
Deposit Requirement
Usually between 0 and 10% of loan value, particularly when the land is already owned
Deposit requirements have steadily declined over the years: 15 years ago, 20 – 25% was often required
Term Usually up to 20 years There is usually no early settlement penalty
Security Mortgage bond over the property and buildings Usually no other security is required
Insurance Credit insurance is typically required, and usually arranged by the bank and premiums often included in monthly payments
There is no longer any special insurance for HIV/AIDS infected borrowers, and there is no HIV test requirement when borrowing
Minimum housing loans for most banks are P100 000 ($16 260), though Stanbic now offers a minimum loan of P 50 000 ($8 130). Standard Charterd offers a minimum loan of P75 000 ($12 195) and Barclays may soon follow suit. Even a P100 000 ($16 260) loan would suffice to erect a only very basic structure with minimal finishes and only the most basic fittings and amenities.23 Barclays Prestige and Premier clients qualify for loans with repayments up to 50% of income, illustrating the very aggressive marketing currently being employed in the sector. BBS differs from the commercial banks in that there is no minimum value specified for property loans. Currently, 10% of mortgages in the BBS portfolio are below P50 000 ($8 130), and 30% are below P 100 000 ($16 260). Debt ratio limits of 40% of monthly income are typical for all banks, although Barclays has introduced a 45% debt ratio limit, increasing access to their home loans. It should be noted that non-housing household debt is often very high, and may include vehicle loans, unsecured personal loans, furniture hire-purchase debt and not infrequently micro-loans as well. The commercial banks experience major problems with repossessions in rural areas as such properties have limited saleability: in a forced-sale situation the properties seldom even realise the construction cost. This is because only rural tribes people would have an interest in residing in a rural village, and almost all would have access to their own free land through tribal land grants and would inevitably already possess their own house. As a result, most banks now limit the areas they will finance to the towns and cities and a few urban villages24, and in some cases will limit the size of the loan if the property in question is not urban. Only BBS is prepared to finance housing nationwide, though the maximum loan is restricted to P200 000 ($32 520) in rural areas and small villages. The proportion of property loans issued to individuals (as opposed to commercial developers) by the commercial banks as compared to BBS has risen steadily from 47% of total individual property loans in 1996 to 87% in 2005, dropping slightly to 83% in 200625. The total value of these individual (and therefore mostly residential) property loans in Botswana has increased dramatically from P396m ($64.4m) to P1.77bn ($288m) over the last ten years, as illustrated below:
23
A modest 3-bedroom home of 100m2 in Gaborone on a 900m2 plot with basic fittings and finishes would typically sell for around P300 000 ($48 780). 24
For example, in Mahalapye, a large village in the Central District along the main highway to Francistown, some banks will grant loans for developments along or close to the main road, but not for projects in outlying areas of the village. 25
The commercial banks are more aggressive in their marketing, more flexible in their loan structure and faster in approving loan applications than BBS.

Access to housing finance in Africa: exploring the issues Botswana
for the FinMark Trust (October 2007) 21
Figure 14: Property Loans 1996 - 2006 [Source: Bank of Botswana]
In overall property loan terms there has also been steady growth: One of the banks, FNB, had its book increase threefold between 2004 and 2007. BBS has also seen strong growth (coming after a dip in its portfolio) and the value of its property book has more than doubled in the past 3 years. Government Facilitation
The government guarantees bank loans for government employees to the tune of 80% through the Government Employee Motor Vehicle Advance Scheme (GEMVAS)26 that is available to permanent and pensionable civil servants for real property development. To be eligible for this scheme, employees must have at least P1 200 ($195) net take home pay after loan repayments and deductions. However, only approximately 7% of the loans taken out under this scheme in the last 5 years were used for property development, confirming that many Batswana place a higher premium on the status achieved through more publicly visible assets such as expensive cars, than on long-term investments27. Government also assists all Botswana citizens to purchase or develop properties by guaranteeing 25% of all loans secured through the Botswana Building Society (BBS)28. The Self Help Housing Agency (SHHA) – discussed below - and the Botswana Housing Corporation are further initiatives by government to address the low-income housing issue. However, a significant number of government employees fall below the minimum earning requirement for GEMVAS finance, as low-end government employees earn between P800 – P1200 ($130 - $195) per month.29 Default rates for the two government loan guarantee schemes mentioned above are unavailable. Self-Help Housing Agency (SHHA)
The Self-Help Housing Agency (SHHA) programme has operated in the urban centres and some urban villages since the early 1970’s. Initial funding was from foreign donors (particularly USAID) until responsibility for SHHA was given to the Housing Departments of the various Town Councils in 1978 from which date government has funded the scheme. The SHHA programme is not confined only to urban centres and the larger villages: rural SHHA programmes operate throughout Botswana, but in all rural SHHA, land is provided by the applicant (through the normal Tribal Land Grant process). The urban SHHA programme provides both land and housing finance to low-income urban dwellers. The SHHA land allocation procedure approximates the tribal land allocation process for tribes people in the tribal land areas, formerly executed by the chief or headman and latterly by the Land Boards. SHHA applicants, who must be citizens, and be formally
26
Despite its name the GEMVAS advance scheme can be used to finance property development, not only to purchase vehicles. 27
Although this may be slowly changing, as data cited earlier on the structure of bank lending to the household sector seems to suggest. 28
The cumulative benefits of the GEMVAS loan guarantee and the government’s BBS 25% guarantee can only be realised through taking out both loans. 29
Source: BPOHF Feasibility Study Final Report
0
500
1000
1500
2000
1996 1997 1998 1999 2000 2001 2002 2003 2004 2005 2006
End of
P m
illi
on
s
Commercial Banks Botswana Building Society

Access to housing finance in Africa: exploring the issues Botswana
for the FinMark Trust (October 2007) 22
employed or legitimately self-employed30 in the town or city where the application is lodged, must earn between P4 400 – P24 300 ($715 - $3 950) per annum to qualify for low-income plots, and between P 24 301 – P36 400 ($3 951 - $5 200) for middle lower income plots. Currently, the maximum SHHA loan is P20 000 ($3 250) at an interest rate of 10% (well below prime) repayable over 15 years. If the applicants qualify for a plot, they automatically qualify for a building loan. In Gaborone, some 12,000 plots have been allocated since the inception of the SHHA scheme in 1973, and approximately 6,000 applicants have received loans. The projected demand countrywide for SHHA loans is about 54,000 on the basis of maximum entitlement of P20 000 ($3 250). It is estimated that 1 in 5 households requires a loan (1 in 3 in urban areas).31 Default rates have been high, partly due to poor debtor management by councils. Currently in Gaborone, service levies are some P3m ($487 800), and SHHA loans P2.2m ($357 725) in arrears.32 Under NDP 9 It is envisaged that collection of loans will be undertaken by the Private Sector. While the SHHA scheme fills a vital role in providing land and housing finance to a segment of the low-income market, SHHA is not affordable to many urban dwellers. Those earning below P 4 400 ($715) pa or P366.67 ($60) pm are not covered by the scheme. This group includes domestic workers, gardeners, casual labourers and others earning below the minimum wage, as well as hawkers and new arrivals of the rural–urban migration component. For most of these persons, rented accommodation in SHHA areas or the informal settlements such as Gaborone’s Old Naledi is the only alternative. Urban rentals in Botswana are comparatively high, and most in the lowest income group spend appreciably more than the UN standard of 30% of income on their housing. Other basic needs like food, schooling, transport, utilities/energy, clothing, etc. consume all of the remaining cash, resulting in little or no disposable income. The SHHA middle lower income ceiling of P36 400 ($5 920) pa - P3 033 ($493) pm - falls below the minimum income requirement for housing finance of the commercial banks, which is generally P4 000 – P 4 800 ($650 - $780). However, it should be pointed out that Barclays Bank’s new minimum loan repayment (over20 years) of P1335.30 pm with the recently introduced 45% debt ratio requirement is just about accessible to this group, subject to levels of personal indebtedness and other factors. SHHA clients can borrow less than the P 20 000 ($3 250) maximum if they prefer. This maximum is regarded by many as being inadequate and has remained unchanged since 1998, with no adjustment for inflation. Recent studies suggest the mean construction price of a standard ‘two-and-a-half’ (two-roomed housed with kitchen and bathroom) in Gaborone to be in the region of P35 000 – P 47 000. ($5 690 - $7 640), though, by including owner-input in the form of labour and minimal finishes, a ‘two-and-a-half can be built for as little as P20 000 ($3 250 -the value of a SHHA loan). The SHHA policy is currently under review,33 and some observers suggest that a new maximum loan amount of P 45 00034 ($7 320) will be introduced, but these observations are speculative. There are major drawbacks of the SHHA scheme, however:
! There is a severe shortage of available plots, particularly in the key urban areas such a Gaborone, resulting in waiting periods as long as 10-15 years from date of application to plot allocation.
30
Self-employed applicants, usually hawkers or vendors, are required to furnish proof of income, either through bank statements or sworn affidavit. 31
National Development Plan 9: 2003/04 – 2008/09 32
Statistics for other urban centres were unavailable. 33
Although management for SHHA falls under individual local councils, the review is being conducted by the national Department of Housing, which is responsible for monitoring and coordinating SHHA. 34
The SHHA loan was increased from P3 600 ($585) to P6 000 $975) in 1998 and further increased to P20 000 ($3 250) in 2000.

Access to housing finance in Africa: exploring the issues Botswana
for the FinMark Trust (October 2007) 23
! A large number of plots remain undeveloped years after allocation.35
! The repayment rate on the service levy and construction loans is low and inadequately managed, resulting in the loan scheme not being self-sustaining.
Figure 15: Access to Sources of Housing Finance
0
10000
20000
30000
40000
50000
60000
70000
80000
<280
280-420
420-560
560-840
840-1400
1400-2100
2100-2800
2800-4200
4200-5600
5600-8400
8400-11200
11200-14000
14000+
Average Monthly Disposable Income (Pula)
Nu
mb
er o
f H
ou
seh
old
s
Eligible for
commercial bank
property loan
(P4200 min)
Excluded
from all except
BBS
Eligible for
SHHA loan
(P367-P3033)*
Excluded
* Applies to urban households only Source: H.I.E.S - Central Statistics Office
The SHHA scheme has primarily been a government investment in low-cost housing, and while complete self-sustainability may well not have been feasible (given the highly subsidised interest rate and liberal approval criteria, the financial performance of the scheme has nevertheless been below expectations. Future developments may well see the SHHA scheme being re-structured as a cost-recovery entity. Ad-Hoc Housing Finance
Clearly the very poor (those with household incomes below P367 per month – 9.3% of the population) are excluded from all forms of formal housing finance. Similarly those earning between P3 033 and P 4 200 per month (7.2% of the population) are effectively excluded from all forms of formal housing finance (other than a BBS loan, where applicable) earning too much to qualify for the SHHA programme yet falling below the generally applied minimum for a commercial bank loan. Furthermore, SHHA eligibility is largely rhetorical, as it applies only to urban applicants and has waiting periods of up to 15 years, effectively making it unavailable in the immediate sense.
35
Reasons for this include the death of the applicant, work transfers to other areas, poor health and financial constraints amongst others

Access to housing finance in Africa: exploring the issues Botswana
for the FinMark Trust (October 2007) 24
Figure 16: Average Household Income
Source: H.I.E.S - Central Statistics Office
Microfinance
Microfinance is a developing phenomenon in Botswana and there is relatively little information available on both supply and demand for such services (refer to “Access to Financial Services in Botswana”, FinMark Trust Research Paper No.1, Genesis Analytics; March 2003, for data on the supply of financial services to low-income clients in Botswana). Unlike in South Africa, in Botswana there currently is no microlending specifically geared towards housing. Although individuals do borrow from micro-lenders (either cash or term borrowing) to develop their properties, this practice is not widespread. Furthermore, in view of the fact that almost all microlending requires the borrower to be formally employed and to have a bank account, the very poor are excluded even from this source of housing finance. These ‘excluded’ groups therefore find themselves in a position where ad-hoc solutions to housing finance are the norm. Incremental building, where the homeowner adds a room at intervals, as finances permit, is probably the most common form of house construction in Botswana. Many of those who fail to qualify for conventional housing finance due either to insufficient income to meet minimum requirements or land tenure issues where the plot is not properly registered and does not qualify as collateral (e.g. Certificate of Rights (COR) or Fixed Period tribal land granted under Customary Land Grant – see below) find themselves developing their home in an ad-hoc fashion. A fairly common scenario is when a person is able to obtain small loans in the form of unsecured short-term personal bank loans, motshelo /savings club loans or to raise cash through the sale of cattle etc., building materials will be purchased piecemeal, and, after a time, when sufficient for a modest extension to the existing structure, a builder will be engaged to construct an additional room. A few years later, the homeowner will repeat the process, eventually creating a multi-roomed dwelling. Planning issues and Building Control Regulations are chiefly ignored in this process, but were these to be applied to the letter they would constitute a serious obstacle to this form of housing provision. Constraints
Access to affordable land in urban areas for low-income persons is major obstacle to home ownership. Land values have risen dramatically over recent years and unsubsidised land within the major towns and cities is beyond the reach of the lower income groups. The implementation of housing standards in Botswana has had the effect of further increasing housing costs. Many of the urban villages have been designated Planning Areas and in these areas houses have to comply with the Development Control Code and the Building Control Regulations. Traditional construction using locally available materials is therefore no longer possible. In SHHA
0.0%
5.0%
10.0%
15.0%
20.0%
25.0%
280
350
490
700
1120
1750
2450
3500
4900
7000
9800
12600
17000
Average Household Income
% H
ouse
hold
s

Access to housing finance in Africa: exploring the issues Botswana
for the FinMark Trust (October 2007) 25
areas, SHHA inspectors have been known to impose requirements even more stringent than required by the legislation, thereby further increasing building costs. Property transaction costs pose yet another obstacle to the low-income prospective homeowner. Transfer, bond and notarial fees are disproportionately high at the lower end of the property market, ranging from 13.6% or P 2 450 ($400) for a property valued under P 20 000 ($3 250) - a significant disincentive to the poorer aspirant - to only 7.3% or P 14 600 ($2 375) for a property of P200 000 (32 520). Challenges: Land Tenure
The present land tenure regime in Botswana is fraught with inherent problems: Three different land tenure systems co-exist within the same economy, each having distinctive characteristics: State land (23% of the total) covers wildlife and forest reserves and most urban areas. Urban land tenure is through Certificate of Rights (COR) – discontinued in 1992 due to transfer restrictions and consequent mortgage problems - or Fixed Period State Grants (FPSG), usually 50-99 year lease. Tribal land (71%) is granted under Customary Land Grant (for citizens) or Common Law lease (for foreigners or commercial properties). Tribal land Customary Land Grant can be converted to Common Law Leasehold (CLL), subject to the necessary cadastral survey (and sometimes not inconsiderable cost) and used as collateral. There is a distinct hesitancy in land registration. On many occasions tribal land that has been held for generations is forfeited because of the owners’ reluctance to obtain the correct certification. Furthermore, there is a disinclination to transfer to CLL – only 27% of homeowners have registered title deeds – mainly due to ignorance of the benefits of having transferable title and also because of the not inconsiderable costs involved. An added disincentive is the perception that land is an inheritance and somehow sacred to the family and should not be mortgaged and put in jeopardy. Freehold or leasehold land (6% of the total) is generally farming land, but some peri-urban developments fall under this regime, particularly new townships on the outskirts of the major centres. Sectional title has recently been added to the above land tenure formats, and is still in its infancy in Botswana. Townhouse and cluster dwelling projects now fall under this modified Fixed Period Grant title. One of the key concerns of land tenure for the housing finance provider is the feasibility of repossession in the event of delinquent loans. The limited commercial value of land in the more remote parts of the country is the chief limiting factor to the granting of loans in rural areas. For this reason none of the commercial banks will provide finance for rural property development unless secured by another form of collateral, e.g. where a second bond on a paid-up urban property is used to secure the loan (as in the case of secondary residential developments for retirement etc.) In Mahalapye, a large village in the Central District along the main highway to Francistown, some banks will grant loans for roadside developments, but not for projects in outlying areas of the village. BBS will provide limited financing for development of rural properties, but only if the land tenure has been converted to Common Law Leasehold, and then only to a maximum loan value of P 200 000 ($32 520).

Access to housing finance in Africa: exploring the issues Botswana
for the FinMark Trust (October 2007) 26
Housing Demand & Supply Housing Demand
Botswana’s Vision 2016 envisages that by 2016 all Batswana will have access to good quality basic shelter in both urban and rural areas. Nine years from that target the country still has a long way to go to achieve that goal. The growing numbers of urban homeless, the ongoing dispute between illegal squatters and the Kweneng Land board in and around Mogoditshane and elsewhere and the limited access to affordable land within the urban areas all indicate that much needs to be done if the Vision is to be achieved. Table 9: Number of Households and Persons (Est. 2002/03)
Source: C.S.O. H.I.E.S.
Assuming a continued year-on-year population growth rate of just below 2.5%, the number of households is likely to be between 530 000 and 550 000 in 2016. This means that an additional 130 000 – 150 000 households will need to be accommodated over the period. The majority of these households will fall into the low to low-middle income urban and peri-urban groups.
Figure 17: Population and No. of Households 2007 -2016 (Projected)
Source: Own Calculation
(Millions)
1.5
1.7
1.9
2.1
2.3
2.5
2007 2008 2009 2010 2011 2012 2013 2014 2015 2016
0.3
0.4
0.4
0.5
0.5
0.6
0.6
Population No. of Households
Cities /
Towns%
Urban
Villages%
Rural
Areas% National %
No of male-headed
households 65,730 60 57,880 48 87,793 54 211,403 54
No of female-headed
households 43,826 40 63,440 52 75,602 46 182,868 46
Total no. of
households 109,556 100 121,320 100 163,395 100 394,271 100
Total males 174,711 47 242,465 44 344,460 48 761,636 47
Total females 195,101 53 302,788 56 373,397 52 871,286 53
Total no. of persons 369,812 100 545,253 100 717,857 100 1,632,922 100

Access to housing finance in Africa: exploring the issues Botswana
for the FinMark Trust (October 2007) 27
Housing Supply
As illustrated below, the vast majority (75.5%) of housing units are either self-built for own occupation or built by individuals for rental. The purchase of pre-built housing units represents only 1.34% of the total. The present breakdown of housing type and mode of acquisition is illustrated in Table 10 below: Table 10: Mode of Acquisition of Housing Unit
*Free as in institutional housing related to employment (e.g. mining) Source: C.S.O. H.I.E.S
Because of the financial constraints experienced by low-income households and the lack of access to either conventional housing finance or commercial rented accommodation, most such households are accommodated in self-built (SHHA or informal) and rented – individually owned (also SHHA or informal) units. Self-built, own occupied housing units comprise some 55.7% of all housing types nationwide, and account for 18,5% of urban dwellings. Housing units rented from individuals comprise 19.7% (nationwide) and 45.4% (urban). Clearly these categories of housing unit will have to increase dramatically over the coming years if the desired outcome of universal access to good quality basic shelter is to be achieved. There is no measurable housing backlog per se in Botswana, as the shortage is reflected in the density of occupation of the existing housing stock. It can only be assumed that the estimated growth in the number of households (and therefore the additional number of housing units required) is skewed towards the lower spectra of the income pyramid as all poverty analysis research correlates poverty and larger household size. Housing Policy
The National Policy on Housing (as adopted in 1999) focuses on the provision of decent, affordable housing for all in a safe and sanitary environment. This housing policy seeks to:
! Change the emphasis of government’s role from being a housing provider to being a housing facilitator in partnership with other stakeholders.
! Apply government resources to low and lower middle income housing
! Promote housing and an instrument of economic empowerment and poverty alleviation
! Foster partnerships with the private sector and all major employers in home development and facilitating home ownership (in much the same way as the Botswana Development Corporation and other employers who offer loan guarantee schemes for their employees).
Mode of acquisitionCities /
Towns
Urban
Villages
Rural
AreasNational
Purchased 4,239 754 275 5,268
Rent - BHC 9,303 1,472 - 10,775
Rent - Government 4,900 7,354 2,982 15,236
Rent - Council 2,473 3,436 2,631 8,540
Rent - Individual 49,786 22,595 5,361 77,742
Rent - Company 8,585 1,140 568 10,293
Rent - VDC - 642 2,796 3,438
Free* 6,654 1,957 14,531 23,142
Inherited - own occupied 2,012 5,179 6,718 13,909
Self-built - own occupied 20,363 75,218 124,268 219,849
Other 1,241 1,574 3,267 6,082
Total 109,556 121,321 163,397 394,274
Number of households

Access to housing finance in Africa: exploring the issues Botswana
for the FinMark Trust (October 2007) 28
NDP 9 states: “Housing Delivery will be facilitated through the design and development of affordable housing schemes for all income groups. Home ownership will be promoted through the SHHA and other appropriate schemes.”36 Apart from the ‘Turnkey Projects’ mentioned in 6.4 below, which are too expensive for the lower income groups, nothing of note has so far emanated from this policy declaration. BHC
The Botswana Housing Corporation’s mandate of providing affordable housing to Batswana, initially as subsidised rental and later through tenant purchase schemes has long given way to mainstream commercial development. The Corporation is very active in the middle-income housing market, but although ‘low-cost’ units dating from the 1960’s and 1970’s still exist and accommodate a limited number of low-income households, the developments of the last decade have all been beyond the affordability of the lower income groups. That the Corporation has moved further and further from its capacity to house the low-income group, is illustrated in some of the latest “Turnkey Housing Scheme” projects originally intended to fall under the SHHA programme but taken over by BHC: A recent BHC tender for 88 ‘low-cost’ units for came in at P 6.7m ($1.09m), averaging P76 316 ($12 410) per unit. Even at a subsidised (hypothetical) interest rate of 10% (as in SHHA), the cost is too high for even the upper limit SHHA applicants. Such projects will benefit the middle income groups, but will are beyond the reach of low-income groups.
Key Players and possible interventions Suggestions from the Commercial Banks
In discussion with commercial banks regarding their attention to the low-end housing finance shortage, the following concerns, issues and suggestions were made.
Financial Issues
! Guarantees from employers could assist low-income earners ! Low-income people are usually highly indebted and have a poor debt-income ratio. Better
education is needed. Surely an organisation like FinMark is best placed to intervene. ! There is an urgent need for a housing finance product in the P40 000 – P100 000 ($6 500
- $16 260) range.
Regulatory and Tenure Issues
! Banks don’t finance incomplete structures; so incremental building can only be financed through personal loans, e.g. P20 000 at a time, every 3 years.
! Rural property has very limited transactional value, particularly in the more remote areas, hampering repossession.
! A major constraint to low-end housing finance is the lack of proper title deeds in urban areas.
General Issues
! Lack of proper data affects all decision-making. Most important is an accurate and well-maintained property index
! Banks never took proper advantage of FinScope™ ! Housing schemes should emanate from employers. ! An independent entity should drive the process to improve low-end access to housing
finance.
Department of Housing
The Department of Housing expressed keen interest in getting financial institutions to extend facilities to lower income groups. This will best be achieved through the involvement of all stakeholders. There
36
NDP 9 Chapter 17: Land Management, Housing and Settlement.

Access to housing finance in Africa: exploring the issues Botswana
for the FinMark Trust (October 2007) 29
is a need to reach some kind of understanding with the private sector on housing finance for lower income groups, and an outside agency would be best placed to facilitate such an arrangement. As has been illustrated above, not all low-income households qualify for SHHA land allocation or loans, and for those that do, the delivery of SHHA plots is extremely slow. Many SHHA recipients who have completed their initial SHHA building and paid off their loans have migrated upwards to commercial property loans, and today some properties in SHHA areas are valued up to P300 000 ($48 780) and above. A lot needs to be done to educate rural customary land grantees on the importance of converting tribal land granted under Customary Land Grant to Common Law lease so as to be able to use the land as collateral for housing finance as well as for commercial ventures. Pressure needs to be brought upon the risk-averse lending institutions, particularly the commercial banks, to recognise this collateral and to include the rural population in the housing finance ambit. Pension Funds
Active and innovative intervention should be initiated so as to bring the enormous capital reserves of the Pension and Provident Funds to bear on the question of low-income housing. The legislative framework needs to be examined and proposals made to government for the beneficial utilisation of this national asset. BBS
BBS is Botswana’s only dedicated building society. It offers long-term property loans and a variety of personal savings and investment products aimed at the broad-spectrum of society. BBS is probably the best placed of all the commercial financial service providers to assist with the resolution of the low-income housing finance dilemma. A number of key factors attest to this:
! BBS has no minimum housing loan, thus making it eminently suitable for incremental building, provided that issues of collateral can be adequately addressed.
! BBS is the only housing finance provider to finance projects throughout the country.
! Government’s 25% guarantee on all BBS loans can be exploited and extended to reach the poorest members of society.
Micro Lenders
Microlending is a rapidly growing sector in Botswana, and the respectable end of the microlending industry (e.g. Peo Micro, Letshego) must be examined for potential housing finance involvement. Currently these term lenders only lend to employed individuals and make use of salary deductions for loan repayment instalments. No mechanism exists in this sector for the granting medium- to long-term loans suitable for housing projects. Regulatory challenges
A number of interventions from government are needed to facilitate the provision of housing to the poor. Key amongst these is the relaxation of regulatory standards and building codes37 for the urban poor. Simpler, more affordable and appropriate health and safety regulations are required, and ‘first world’ building standards must be recognised as counter-productive for providing affordable housing to the urban poor. Inconsistencies between the various land tenure regimes need the attention of government. In many cases low-income persons are ignorant of the value of the land they possess, and are often exploited
37
All regulations emanate from Central Government and are generally administered locally.

Access to housing finance in Africa: exploring the issues Botswana
for the FinMark Trust (October 2007) 30
by land speculators for this reason. They are also unaware of the benefits of converting to the more commercially valuable tenure system and the consequent access to finance this can provide. Social challenges
The perception exists that the poor are not only poor but also highly indebted. They are seen as inherently being a poor credit risk. The profit-oriented ‘take it or leave it’ commercial banking sector simply does not need the aggravation of high-volume-low-value, high credit risk clientele which will do little for bottom-line profitability and divert service resources away from its existing high-value customer base. . The HIV/AIDS pandemic and its effect on the longevity of borrowers also poses a particular challenge. In the recent past, providers of credit insurance, mortgage protection insurance and most other forms of personal insurance required the applicant to undergo a an HIV test. Chiefly due to the very profound effect of the ARV programme, this is no longer the case, and in fact most banks now provide in-house mortgage insurance without enquiring after the applicants’ HIV status. Therefore risk to the lender in the middle and high-level market sectors is mitigated by the availability of adequate credit insurance in terms of which the lending institution is well protected against the untimely demise of the borrower. However, interventions are needed to provide an affordable credit insurance scheme for low-end borrowers.
Proposed areas for possible intervention This section proposes some general areas that FinMark Trust or other organisations seeking to address issues of access to housing finance in Botswana should consider for future intervention. It is important to note that the Botswana Government’s Housing policy states: ‘Foster partnerships with the private sector and all major employers in home development and facilitating home ownership’. FinMark must take an active role in singling out the correct partners that should engage with government to achieve this policy aim. The following table outlines possible areas of intervention:
Housing Fund such as the proposed Botswana Public Officer’s Housing Fund (BPOHF)
A Housing Fund approach to the low-end housing finance service need has a number of advantages. Corporate and / or financial structures make funds available which are usually partly liquid and partly invested, and which serve as the basis for mortgage lending to interested individuals. The fund is run on purely commercial terms, and profitability, albeit modest, is the aim. Funds that are not currently given out as loans are invested elsewhere. The Housing Fund structure would lend itself to Pension and Provident Fund management companies, given the necessary legislative instruments.
BBS and Incremental Building
Subject to re-examining the criteria for collateral, BBS with its existing open-ended loan structure could be well placed to finance incremental building projects, where the borrower could add one room at a time. Building Codes and regulations pertaining to he ‘unfinished’ structures would need to be revised to permit this form of development in urban areas. Affordability could be further enhanced by extending the repayment period though this would mean a higher gross interest charge: higher cost, but lower instalments.
SHHA Re-energised
The SHHA model for urban low-cost housing finance has all the necessary elements for success, as it addresses precisely the relevant social stratum. However, the scheme in its present form is beset with problems, and outside intervention is needed to revitalise and re-energise the programme. The following areas need attention:
! Urgent consideration needs to be given to the identification and allocation of suitable land in a timely manner. (Currently there are backlogs of up to 15 years)
! The plots need adequate serviced, including water-borne sewerage.
! Management issues pertaining to all aspects of the programme: selection criteria, material

Access to housing finance in Africa: exploring the issues Botswana
for the FinMark Trust (October 2007) 31
supply, loan disbursement, building inspections, services, record keeping and defaulter management need urgent intervention. With adequate management the loan scheme could be made to be self-sustaining.
! The maximum loan amount should be realistic and related to current building costs.
! Adequate protection of beneficiaries against aggressive speculators must be put in place.
! Tenure procedures must be suitable for applicants to be able to easily migrate to commercial loan providers for secondary development of their plots.
! Potential beneficiaries should be included in the consultative phase of planning, and they should participate in the proposal: “Planning should be with, not for the beneficiaries. They know what they need and they know and understand the constraints”
38.
! Interest rate subsidisation could be reduced in the long term.
Informal Credit A study into the informal credit sector is needed to explore the potential of unconventional methods of housing finance, e.g. metshelo / credit clubs, micro lenders etc
702 FNB Integrated Development
The various initiatives in South Africa (e.g. the Cosmo City development) where integrated community residential and commercial villages with community-based management structures and private / public partnerships in land and finance provision could present a viable model for Botswana. While each development is likely to be unique in character and structure, South Africa’s 702 FNB development approaches may offer lessons.
Build Together Programme – Namibia
Mutual Aid Housing programmes are successful in countries as diverse as the Philippines and Brazil. The Namibian Build Together Programme (BTP) has important lessons that Botswana could well heed. The BTP policy involves:
! Enabling and facilitating housing rather than providing it, promoting housing by the people
! Utilising all the potential resources of the people (materials, skills, labour, relationships)
! Involvement of all sectors in the housing process (Government, people, CBO’s, NGO’s and private sector)
! Initial finance is provided by government, but in the long term a revolving fund is established to make the programme self-sustainable
! Screening of applicants, allocation of finance and monitoring of building progress is done through Community Housing Groups.
! Government also relaxed building regulations in BTP areas to facilitate the programme.
Pension / Provident Fund-Backed Housing Finance
Specific interventions around pension and provident fund-backed housing lending are Without a doubt pension and provident fund resources offer the largest untapped source of capital that could be directly and relatively easily linked to housing purchase and the benefits that such mechanisms could offer pension and provident fund members is also significant. This is particularly relevant to the Housing Fund mode. Can pensions not be used to secure low-end loans - i.e. a guarantee from employers based on customers pension fund?
Future possibilities
The rapid growth of communication technologies, specifically in the area of mobile telephony, coupled with the very extensive penetration of cell phones into all strata of the Botswana population and the wide network footprints opens a host of possibilities for financial service provision which can only be guessed at while developments take place. Watch this space.
FinMark Knowledge Sharing
FinMark holds a lot of intellectual capital from its extensive experience in South Africa and elsewhere. FinMark can bring tried and tested solutions to bear on the Botswana housing finance situation.
38
Dizzy Mpoloka, Principal Housing Officer, Gaborone City Council

Access to housing finance in Africa: exploring the issues Botswana
for the FinMark Trust (October 2007) 32
Interviews
The author is most grateful to the following for their assistance in preparing this report.
Gaborone City Council: Mr D Mpoloka, Principal Housing Officer (+267) 3911172 / [email protected]
Standard Chartered Bank: Shathiso Choto, Value Centre General Manager
(+267) 3601585 [email protected]
Bank Gaborone: Andrews Sepako, Homeloans Sales Consultant (+267) 3904006 / [email protected]
First National Bank Botswana: Boiki Matema Wabo Tema, Head Property Finance Division
(+267) 3900610 / [email protected]
First National Bank of South Africa: Sibusiso Ndlovu, Housing Finance (Marketing)
(+27) 011 3710006 / [email protected]
Botswana Building Society: Thelma Ngwenya, Head Mortgages (+267) 3971396 / [email protected]
Department of Housing: Mr D Dumba, Principal Housing Officer (+267) 3906601 / [email protected]
John Hinchliffe Consultants: John P Hinchliffe, Managing Director (+267) 3900575 / [email protected]
Econsult Botswana (Pty) Ltd: Dr Keith Jefferis, Managing Director (+267) 3900575 / [email protected]
References
1. Bank of Botswana (2007), Botswana Financial Statistics, Research Department. March. 2. Bank of Botswana (2005) Bank of Botswana Annual Report 3. BEDIA (2006),BEDIA Annual Report, 4. Botswana Building Society (2005) Botswana Building Society Annual Report 5. Central Statistics Office (2003), 2001 Population and Housing Census: National Statistical Tables Report, ,
Republic of Botswana, December 6. FinMark Trust (2004), FinScope™ Botswana 2004. 7. Gaborone City Council, (Undated) Housing Department (SHHA) Information Guide, 8. Gardner, D (2007) Opportunities for FinMark Trust to Support Developments in Housing Finance in Zambia. 9. Genesis Analytics (2003),Access to Financial Services in Botswana, FinMark Trust Research Paper No.1. 10. Jeffries, K (2007) Enhancing Access to Banking and Financial Services in Botswana. 11. Ministry of Finance & Development Planning (2003) National Development Plan (NDP) 9 2003/4 – 2008/9. 12. Ministry of Lands and Housing, DCDM Botswana (Pty) Ltd (2006). Public Officer’s Housing Fund Feasibility
Study Final Report, Department of Housing, 13. Republic of Botswana (2004), Household Income and Expenditure Report, Central Statistics Office,
December. 14. The Kuyasa Fund, Delft Research Report, FinMark Forum, September 2005 Websites: 1. 702 FNB Housing Initiative - http://www.702fnbhouses.co.za/ 2. Bank of Botswana http://www.bankofbotswana.bw/ 3. Central Statistics Office http://www.cso.gov.bw/