accelerating growth - kinh do corporation · 44 corporate strategy. audited report 83 general...
TRANSCRIPT
ACCELERATING
GROWTH
ANNUALREPORT 2014
Establishing foundation
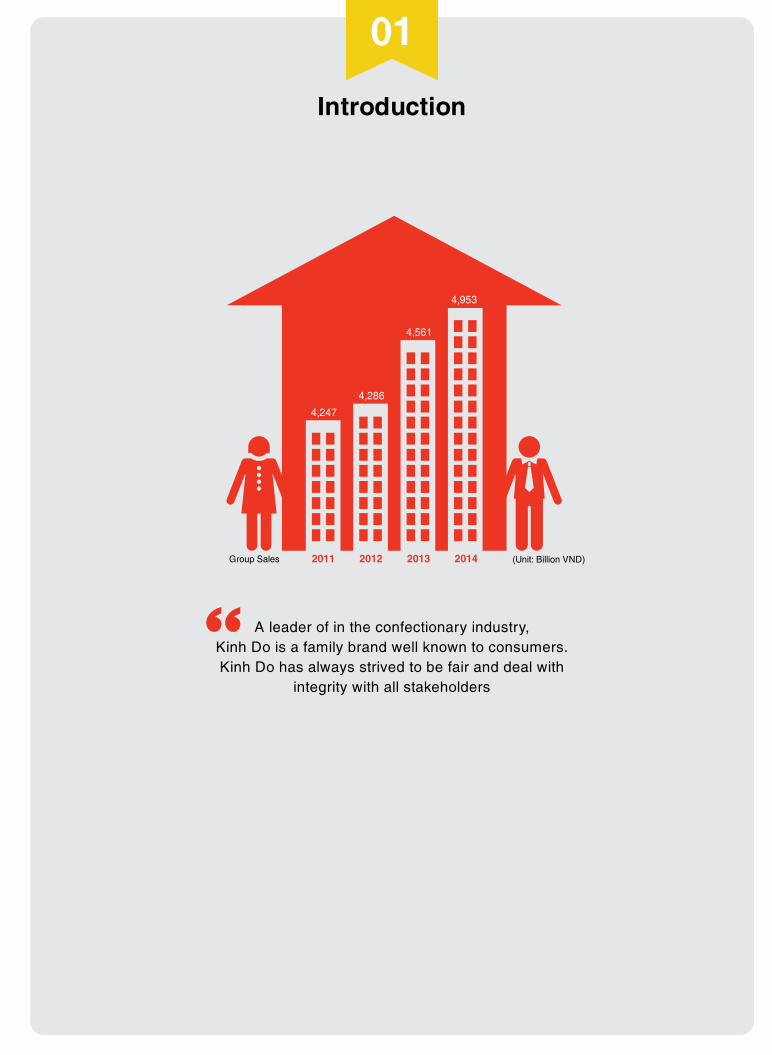
Introduction
A leader of in the confectionary industry, Kinh Do is a family brand well known to consumers. Kinh Do has always strived to be fair and deal with
integrity with all stakeholders
01
2011 2012 2013 2014
4,247
4,953
4,561
4,286
Group Sales (Unit: Billion VND)
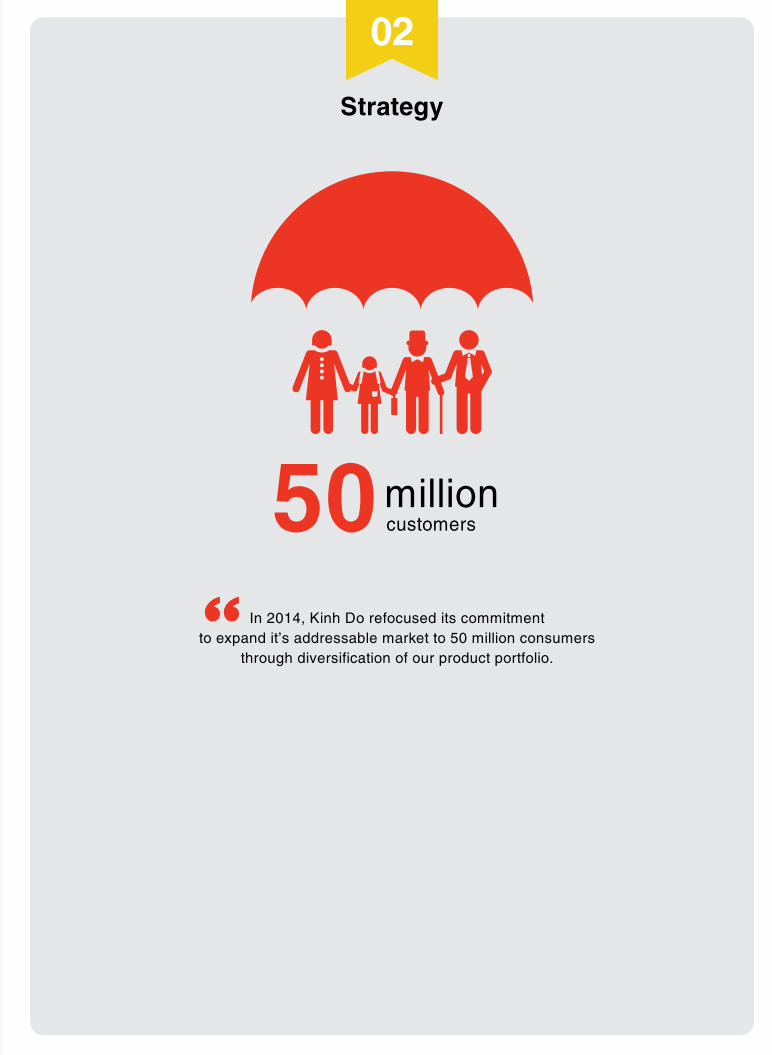
Strategy
In 2014, Kinh Do refocused its commitment to expand it’s addressable market to 50 million consumers
through diversification of our product portfolio.
02
7:30 AM 10:30 AM
7:00 PM9:00 PM
Innovative transition
50 millioncustomers
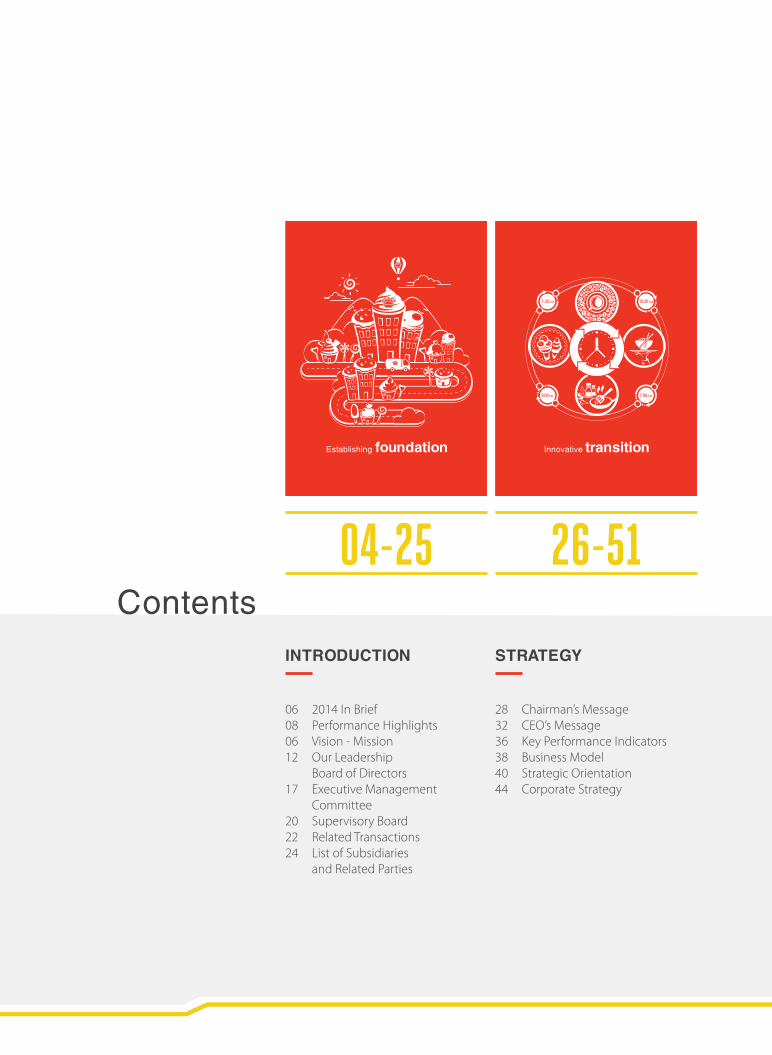
04-25Contents
26-51
IntroductIon
06 2014 In Brief08 Performance Highlights06 Vision - Mission 12 Our Leadership Board of Directors 17 Executive Management Committee 20 Supervisory Board 22 Related Transactions24 List of Subsidiaries and Related Parties
Strategy
28 Chairman’s Message 32 CEO’s Message 36 Key Performance Indicators 38 Business Model 40 Strategic Orientation 44 Corporate Strategy
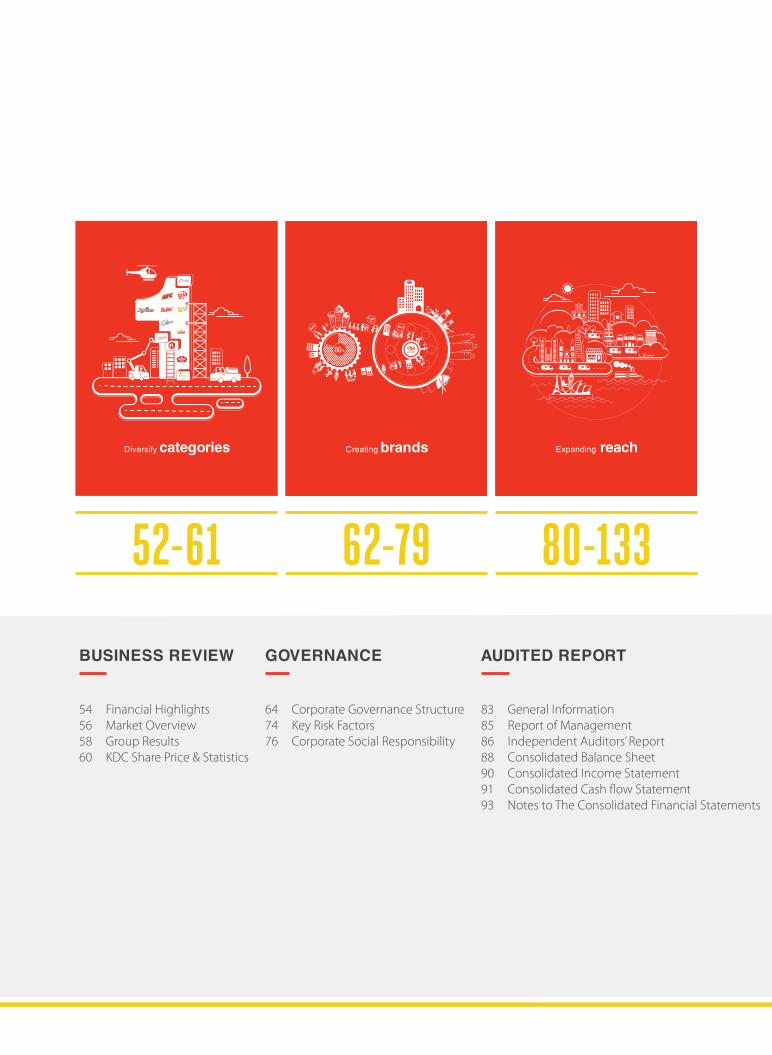
audIted report
83 General Information 85 Report of Management 86 Independent Auditors’ Report 88 Consolidated Balance Sheet 90 Consolidated Income Statement 91 Consolidated Cash flow Statement 93 Notes to The Consolidated Financial Statements
governance
64 Corporate Governance Structure 74 Key Risk Factors 76 Corporate Social Responsibility
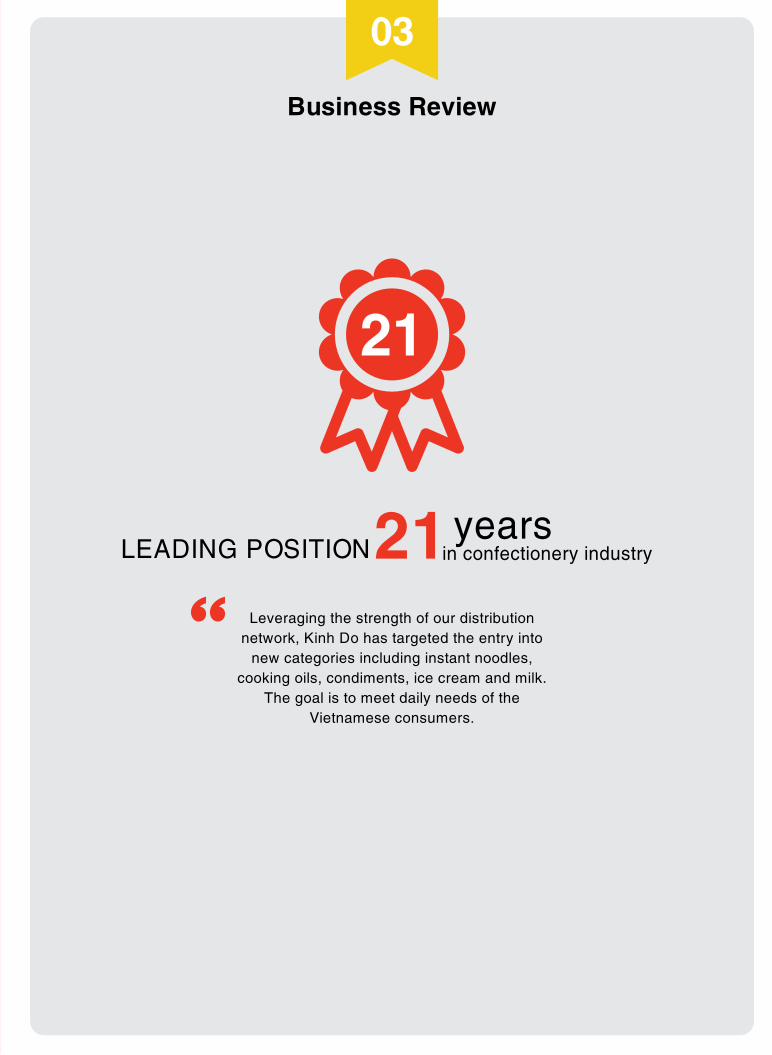
Leveraging the strength of our distribution network, Kinh Do has targeted the entry into
new categories including instant noodles, cooking oils, condiments, ice cream and milk.
The goal is to meet daily needs of the Vietnamese consumers.
21 years
LEADING POSITION in confectionery industry
Business Review
03
Diversify categories Creating brands
Governance
Kinh Do is a company with a long history and development. To sustain the future growth and expansion, we have targeted to operate with a
clear corporate governance structure that facilitates transparency and accountability.
04
WIN M&A
80 %
Expanding reach
Audited Report
05
Kinh Do's export markets
35 countries
Increasing our target markets through partnerships and alliances with the goal
of having our products reach the world.
52-61 62-79 80-133
BuSIneSS revIew
54 Financial Highlights 56 Market Overview 58 Group Results 60 KDC Share Price & Statistics

Establishing foundation
Introduction
A leader of in the confectionary industry, Kinh Do is a family brand well known to consumers. Kinh Do has always strived to be fair and deal with
integrity with all stakeholders
01
2011 2012 2013 2014
4,247
4,953
4,561
4,286
Group Sales (Unit: Billion VND)
Establishing foundation
Introduction
A leader of in the confectionary industry, Kinh Do is a family brand well known to consumers. Kinh Do has always strived to be fair and deal with
integrity with all stakeholders
01
2011 2012 2013 2014
4,247
4,953
4,561
4,286
Group Sales (Unit: Billion VND)
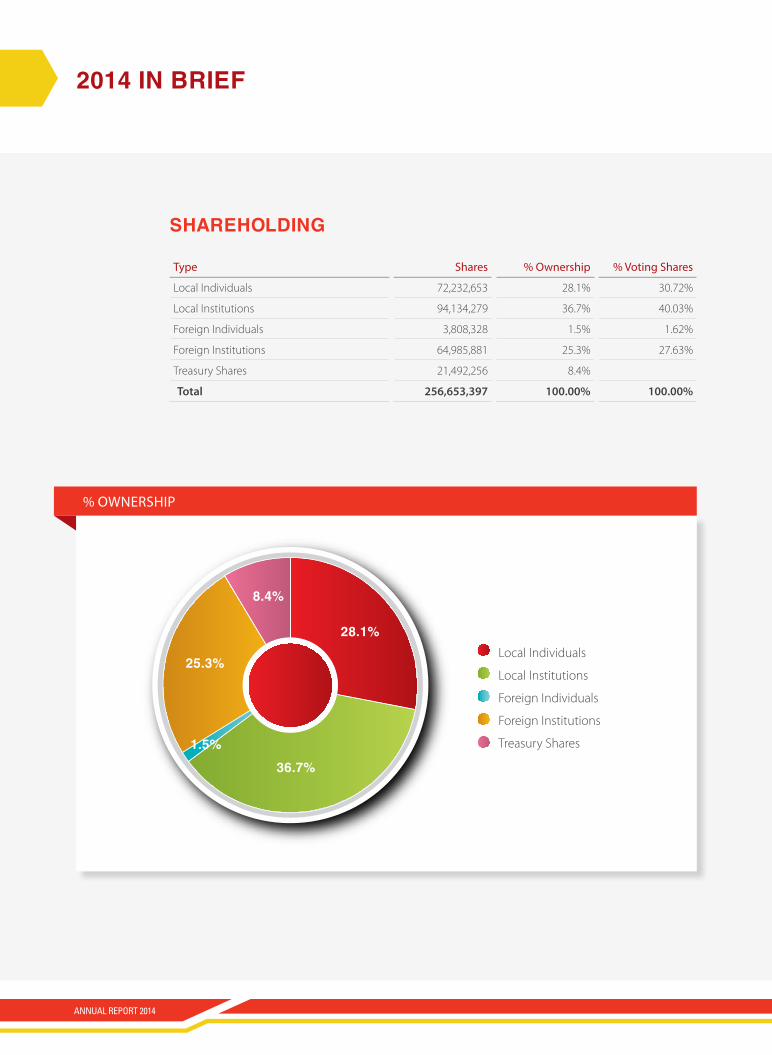
2014 In BrIef
Type Shares % Ownership % Voting Shares
Local Individuals 72,232,653 28.1% 30.72%
Local Institutions 94,134,279 36.7% 40.03%
Foreign Individuals 3,808,328 1.5% 1.62%
Foreign Institutions 64,985,881 25.3% 27.63%
Treasury Shares 21,492,256 8.4%
Total 256,653,397 100.00% 100.00%
ShareholdIng
28.1%
36.7%1.5%
25.3%Local Individuals
Local Institutions
Foreign Individuals
Foreign Institutions
Treasury Shares
% OwnerShip
8.4%
ANNUAL REPORT 2014
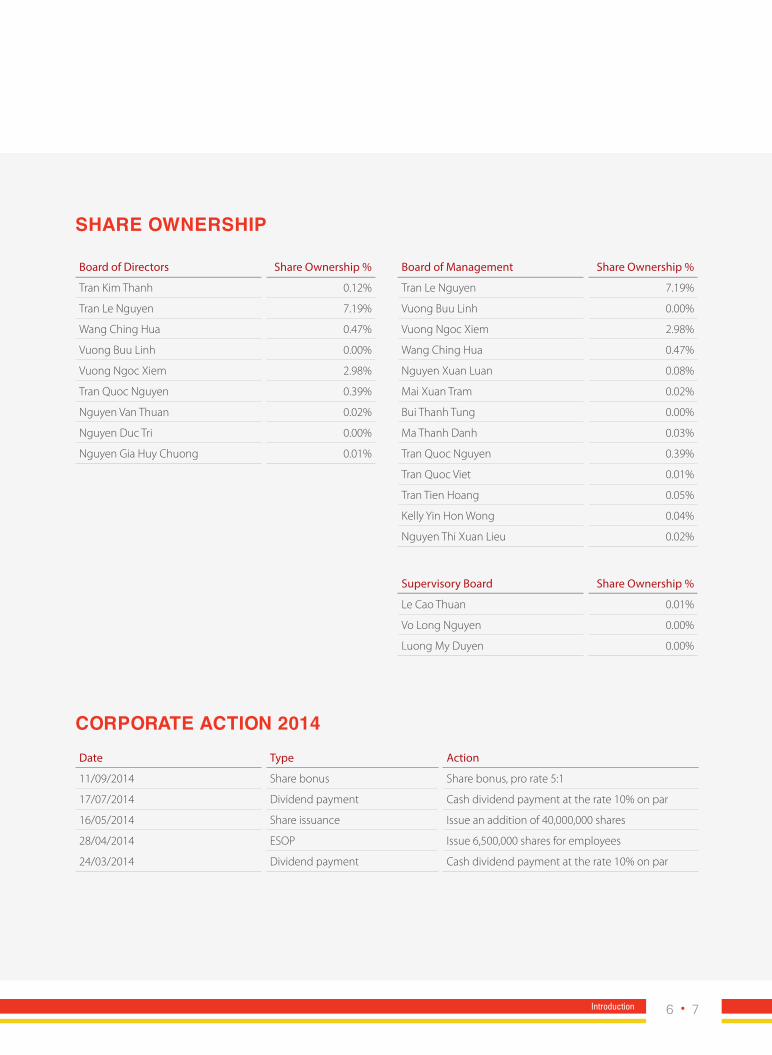
Board of Directors Share Ownership %
Tran Kim Thanh 0.12%
Tran Le Nguyen 7.19%
Wang Ching Hua 0.47%
Vuong Buu Linh 0.00%
Vuong Ngoc Xiem 2.98%
Tran Quoc Nguyen 0.39%
Nguyen Van Thuan 0.02%
Nguyen Duc Tri 0.00%
Nguyen Gia Huy Chuong 0.01%
Board of Management Share Ownership %
Tran Le Nguyen 7.19%
Vuong Buu Linh 0.00%
Vuong Ngoc Xiem 2.98%
Wang Ching Hua 0.47%
Nguyen Xuan Luan 0.08%
Mai Xuan Tram 0.02%
Bui Thanh Tung 0.00%
Ma Thanh Danh 0.03%
Tran Quoc Nguyen 0.39%
Tran Quoc Viet 0.01%
Tran Tien Hoang 0.05%
Kelly Yin Hon Wong 0.04%
Nguyen Thi Xuan Lieu 0.02%
Supervisory Board Share Ownership %
Le Cao Thuan 0.01%
Vo Long Nguyen 0.00%
Luong My Duyen 0.00%
corporate actIon 2014
Share ownerShIp
Date Type Action
11/09/2014 Share bonus Share bonus, pro rate 5:1
17/07/2014 Dividend payment Cash dividend payment at the rate 10% on par
16/05/2014 Share issuance Issue an addition of 40,000,000 shares
28/04/2014 ESOP Issue 6,500,000 shares for employees
24/03/2014 Dividend payment Cash dividend payment at the rate 10% on par
6 7Introduction
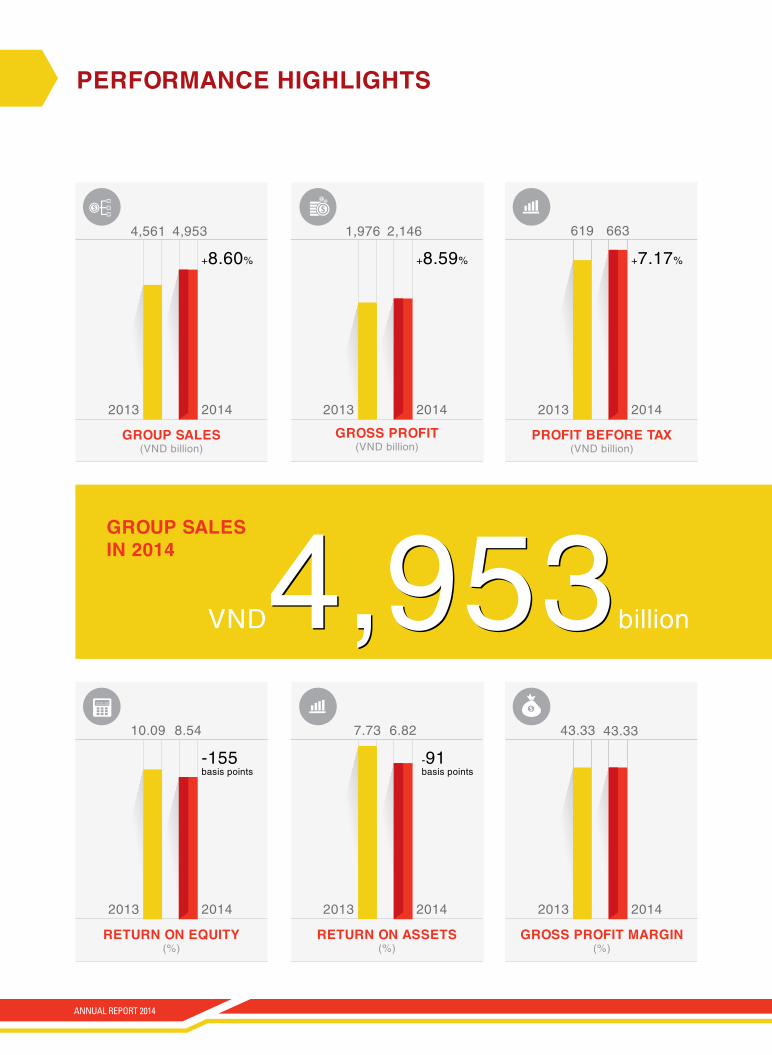
performance hIghlIghtS
group SaleS (VND billion)
return on equIty (%)
groSS profIt (VND billion)
return on aSSetS (%)
profIt Before taX (VND billion)
groSS profIt margIn (%)
4,953VND4,953billion
group SaleS In 2014
2014
2014
2014
2014
2014
2014
4,953
8.54
2,146
6.82
663
43.33
4,561
10.09
1,976
7.73
619
43.33
2013
2013
2013
2013
2013
2013
+8.60%
-155 basis points
-91 basis points
+8.59% +7.17%
ANNUAL REPORT 2014

2,146dIvIdendS (VND billion)
deBt equIty ratIo (x)
earnIngS per Share (VND)
current ratIo (x)
free caSh flowS (VND billion)
net caSh (VND billion)
VND2,146billion
groSS profIt In 2014
2014
2014
2014
2014
379
0.25
2,296
2.82
318
0.31
2,542
2.54
2013
2013
2013
2013
+19.2% -9.67%
2014
2,4671,958
2013
+26%
2014
5091,129
2013
-54.89%
8 9Introduction

vISIon - mISSIon
vISIon
flavor your lIfe Kinh Do creates life’s flavor through wholesome,healthy, nutritious and convenient foods.
8:00 am
10:30 am
1:30 pm6:30 pm
8:30 pm
ANNUAL REPORT 2014
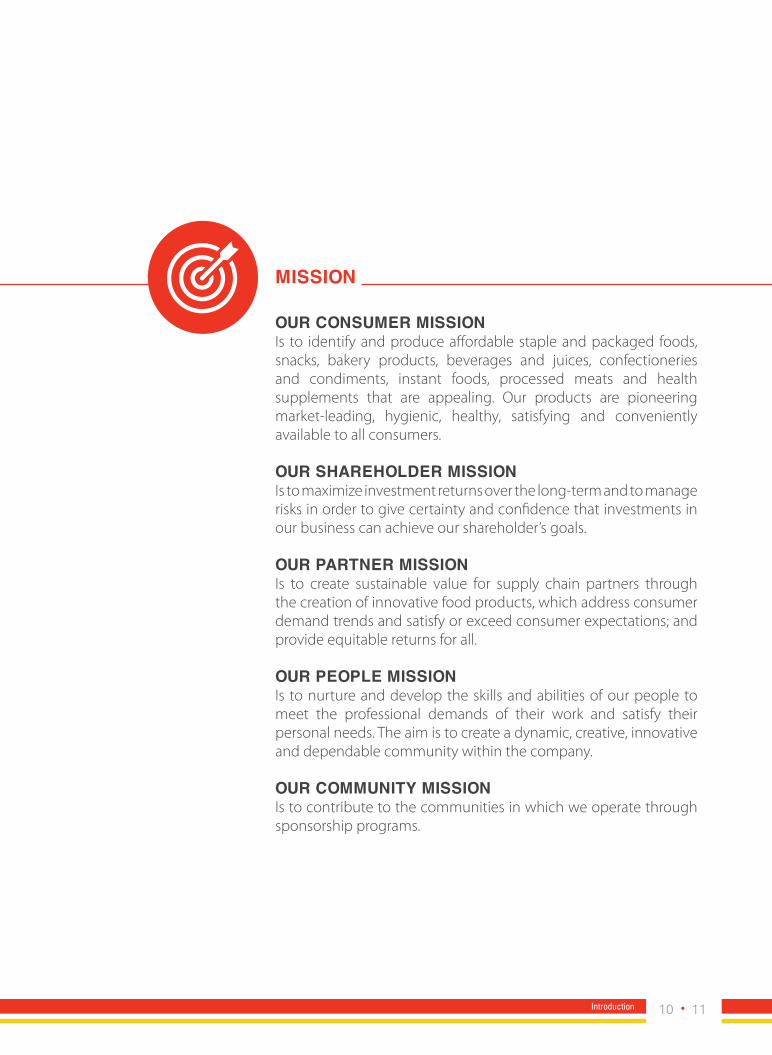
mISSIon
our conSumer mISSIonIs to identify and produce affordable staple and packaged foods, snacks, bakery products, beverages and juices, confectioneries and condiments, instant foods, processed meats and health supplements that are appealing. Our products are pioneering market-leading, hygienic, healthy, satisfying and conveniently available to all consumers.
our Shareholder mISSIonIs to maximize investment returns over the long-term and to manage risks in order to give certainty and confidence that investments in our business can achieve our shareholder’s goals.
our partner mISSIonIs to create sustainable value for supply chain partners through the creation of innovative food products, which address consumer demand trends and satisfy or exceed consumer expectations; and provide equitable returns for all.
our people mISSIonIs to nurture and develop the skills and abilities of our people to meet the professional demands of their work and satisfy their personal needs. The aim is to create a dynamic, creative, innovative and dependable community within the company.
our communIty mISSIonIs to contribute to the communities in which we operate through sponsorship programs.
10 11Introduction

ANNUAL REPORT 2014
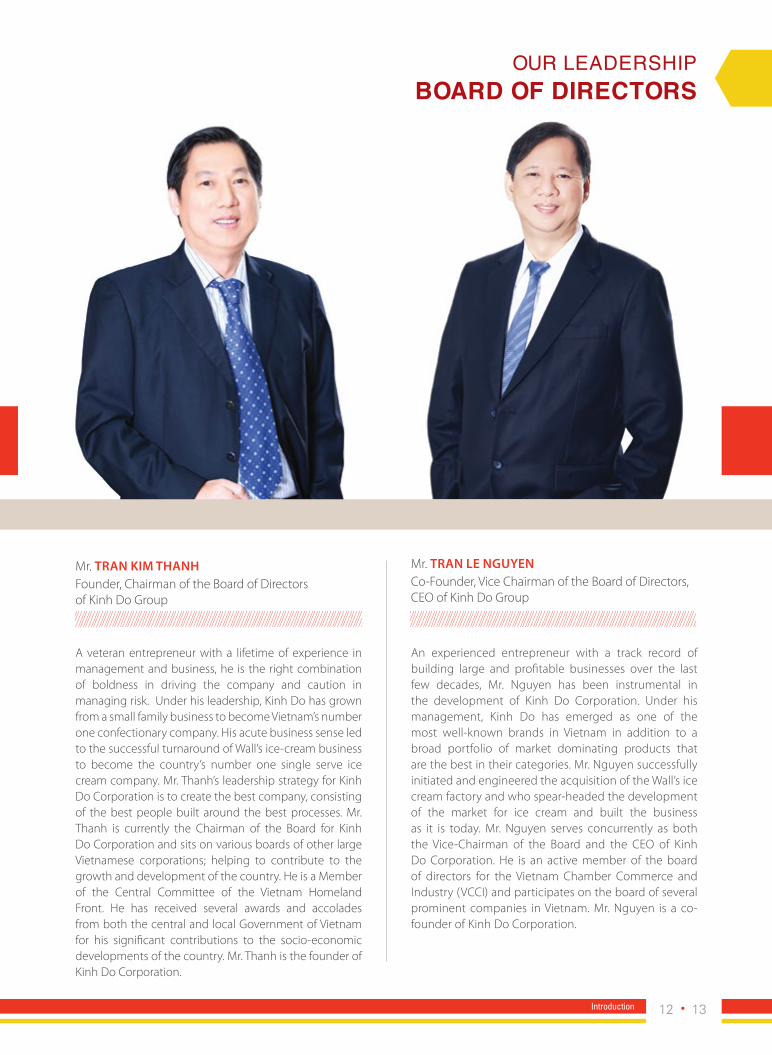
Our LeaDership Board of dIrectorS
Founder, Chairman of the Board of Directors of Kinh Do Group
Co-Founder, Vice Chairman of the Board of Directors, CEO of Kinh Do Group
A veteran entrepreneur with a lifetime of experience in management and business, he is the right combination of boldness in driving the company and caution in managing risk. Under his leadership, Kinh Do has grown from a small family business to become Vietnam’s number one confectionary company. His acute business sense led to the successful turnaround of Wall’s ice-cream business to become the country’s number one single serve ice cream company. Mr. Thanh’s leadership strategy for Kinh Do Corporation is to create the best company, consisting of the best people built around the best processes. Mr. Thanh is currently the Chairman of the Board for Kinh Do Corporation and sits on various boards of other large Vietnamese corporations; helping to contribute to the growth and development of the country. He is a Member of the Central Committee of the Vietnam Homeland Front. He has received several awards and accolades from both the central and local Government of Vietnam for his significant contributions to the socio-economic developments of the country. Mr. Thanh is the founder of Kinh Do Corporation.
An experienced entrepreneur with a track record of building large and profitable businesses over the last few decades, Mr. Nguyen has been instrumental in the development of Kinh Do Corporation. Under his management, Kinh Do has emerged as one of the most well-known brands in Vietnam in addition to a broad portfolio of market dominating products that are the best in their categories. Mr. Nguyen successfully initiated and engineered the acquisition of the Wall’s ice cream factory and who spear-headed the development of the market for ice cream and built the business as it is today. Mr. Nguyen serves concurrently as both the Vice-Chairman of the Board and the CEO of Kinh Do Corporation. He is an active member of the board of directors for the Vietnam Chamber Commerce and Industry (VCCI) and participates on the board of several prominent companies in Vietnam. Mr. Nguyen is a co-founder of Kinh Do Corporation.
Mr. Tran Kim Thanh Mr. Tran Le nguyen
12 13Introduction
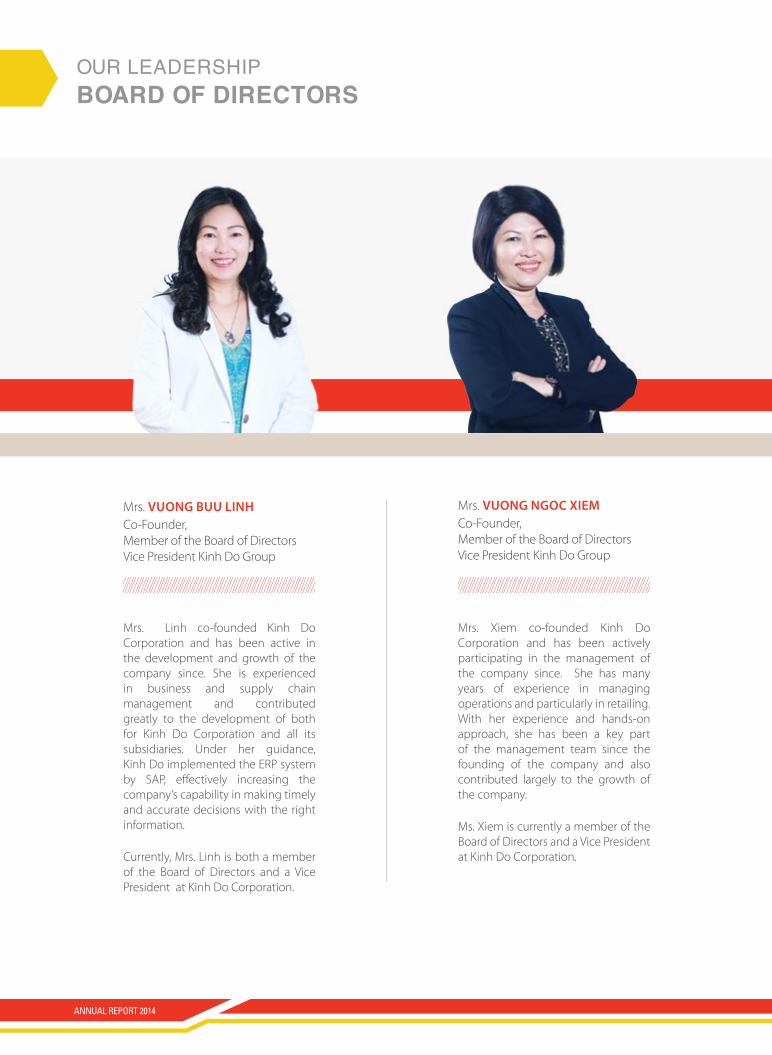
Mrs. Xiem co-founded Kinh Do Corporation and has been actively participating in the management of the company since. She has many years of experience in managing operations and particularly in retailing. With her experience and hands-on approach, she has been a key part of the management team since the founding of the company and also contributed largely to the growth of the company.
Ms. Xiem is currently a member of the Board of Directors and a Vice President at Kinh Do Corporation.
Co-Founder, Member of the Board of Directors Vice President Kinh Do Group
Mrs. Vuong ngoc Xiem
Mrs. Linh co-founded Kinh Do Corporation and has been active in the development and growth of the company since. She is experienced in business and supply chain management and contributed greatly to the development of both for Kinh Do Corporation and all its subsidiaries. Under her guidance, Kinh Do implemented the ERP system by SAP, effectively increasing the company’s capability in making timely and accurate decisions with the right information.
Currently, Mrs. Linh is both a member of the Board of Directors and a Vice President at Kinh Do Corporation.
Co-Founder, Member of the Board of Directors Vice President Kinh Do Group
Mrs. Vuong Buu Linh
Our LeaDership Board of dIrectorS
ANNUAL REPORT 2014
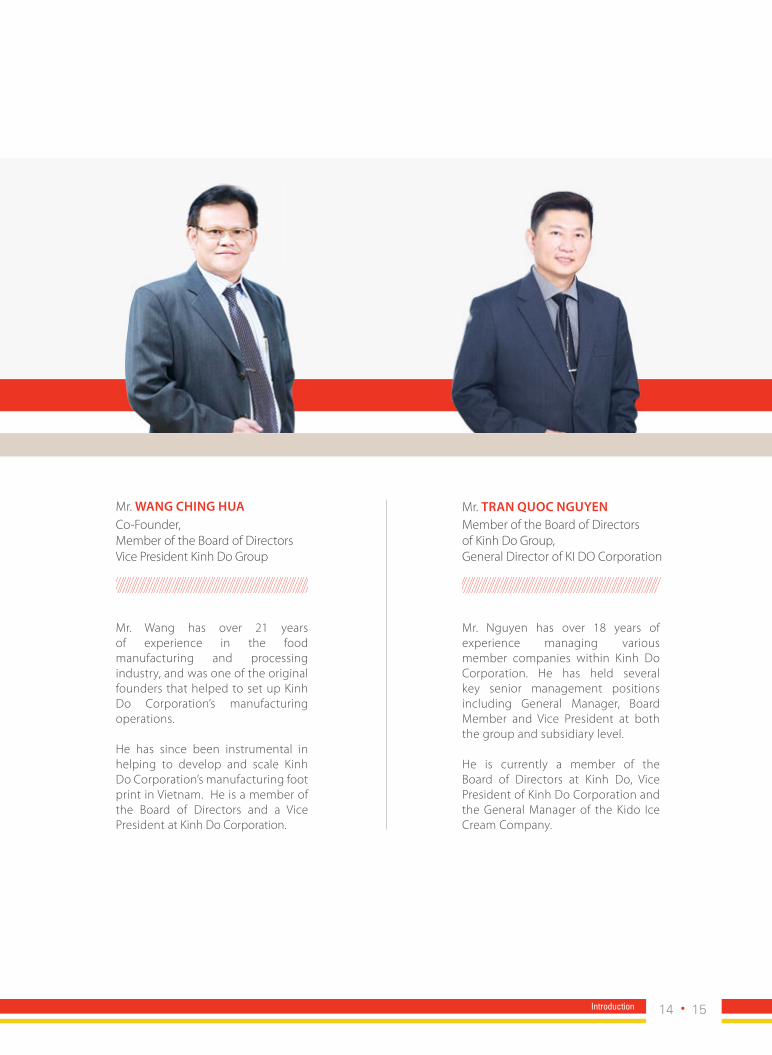
Mr. Wang has over 21 years of experience in the food manufacturing and processing industry, and was one of the original founders that helped to set up Kinh Do Corporation’s manufacturing operations.
He has since been instrumental in helping to develop and scale Kinh Do Corporation’s manufacturing foot print in Vietnam. He is a member of the Board of Directors and a Vice President at Kinh Do Corporation.
Co-Founder, Member of the Board of Directors Vice President Kinh Do Group
Member of the Board of Directors of Kinh Do Group, General Director of KI DO Corporation
Mr. Wang ching hua
Mr. Nguyen has over 18 years of experience managing various member companies within Kinh Do Corporation. He has held several key senior management positions including General Manager, Board Member and Vice President at both the group and subsidiary level.
He is currently a member of the Board of Directors at Kinh Do, Vice President of Kinh Do Corporation and the General Manager of the Kido Ice Cream Company.
Mr. Tran Quoc nguyen
14 15Introduction

Member of the Board of Directors of Kinh Do Group
Mr Tri was voted into the Board of Directors of Kinh Do since 2013. He holds a Phd in Business Management at Nanyang Technological University – Singapore.
He has been working for a sugar company under Agricultural Ministry and teach at Trident University (California, US), Faculty of Economics – Risho University (Tokyo, Japan), Ho Chi Minh Economic University, and other joint programs in Vietnam.
Mr. nguyen Duc TriMember of the Board of Directorsof Kinh Do Group
Member of the Board of Directors of Kinh Do Group
Mr. Thuan is a Member of the Board of Directors of Kinh Do Corporation. He has a Doctorate in economics, and is currently the Dean of Finance – Banking Department at Ho Chi Minh City Open University. He has over 30 years’ of experience as a lecturer in the field of banking and finance.
Besides his academic works at Ho Chi Minh Open University, he is also a financial consultant and advisor for many companies and foreign organizations operating in Vietnam.
Mr. nguyen Van Thuan
Mr. Chuong was voted into the Board of Directors of Kinh Do since 2013. He holds a Master of Law at Law University of Bristol (UK), specialized in International Commercial Law.
He is currently the consultant lawyer at Luat Viet lawyer office and a General Director/Managing Lawyer of Phuoc & Co. Office.
Mr. nguyen gia huy chuong
Our LeaDership Board of dIrectorS
ANNUAL REPORT 2014
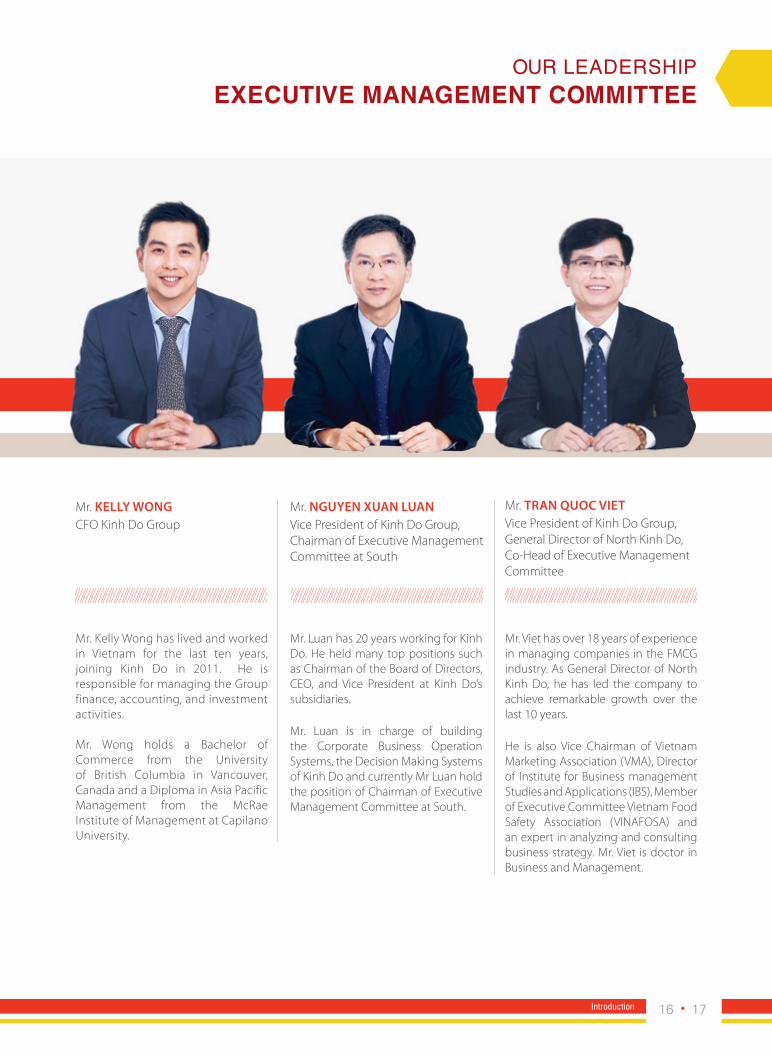
Our LeaDership eXecutIve management commIttee
Mr. Viet has over 18 years of experience in managing companies in the FMCG industry. As General Director of North Kinh Do, he has led the company to achieve remarkable growth over the last 10 years.
He is also Vice Chairman of Vietnam Marketing Association (VMA), Director of Institute for Business management Studies and Applications (IBS), Member of Executive Committee Vietnam Food Safety Association (VINAFOSA) and an expert in analyzing and consulting business strategy. Mr. Viet is doctor in Business and Management.
Vice President of Kinh Do Group, General Director of North Kinh Do, Co-Head of Executive Management Committee
Mr. Tran Quoc VieT
Mr. Kelly Wong has lived and worked in Vietnam for the last ten years, joining Kinh Do in 2011. He is responsible for managing the Group finance, accounting, and investment activities.
Mr. Wong holds a Bachelor of Commerce from the University of British Columbia in Vancouver, Canada and a Diploma in Asia Pacific Management from the McRae Institute of Management at Capilano University.
CFO Kinh Do GroupMr. KeLLy Wong
Mr. Luan has 20 years working for Kinh Do. He held many top positions such as Chairman of the Board of Directors, CEO, and Vice President at Kinh Do’s subsidiaries.
Mr. Luan is in charge of building the Corporate Business Operation Systems, the Decision Making Systems of Kinh Do and currently Mr Luan hold the position of Chairman of Executive Management Committee at South.
Vice President of Kinh Do Group, Chairman of Executive ManagementCommittee at South
Mr. nguyen Xuan Luan
16 17Introduction

Our LeaDership eXecutIve management commIttee
Mr. Hoang has over 18 years of experience in procurement management in the FMCG industry. He was appointed to Director of Supply Chain at Kinh Do Corporation in 2011. He currently leads the company’s COST TEAM and plays a significant role in developing the order management strategy for the entire group.
He holds a Bachelor of Economics from the University of Economics and Higher Leadership Skill Certificate from UCLA Anderson (Los Angeles, USA).
Director of Kinh Do GroupMr. Tran Tien hoang
Mr. Tung has over 17 years experience in manufacturing management and with in-depth knowledge on the SBU operating model. He is currently a SBU Director and Head of the Labor Union for Kinh Do Corporation.
He holds a degree from the University of Economics with a specialization in Business Administration.
Director of Kinh Do GroupMr. Bui Thanh Tung
Mr. Tram was among the first of the management team to help lay the foundation of the current group distribution system. He has been with Kinh Do since the early days and has developed a deep understanding of the company, its competitive environment and the Vietnamese market.
He holds an MBA from California Miramar University in the US.
Director of Kinh Do GroupMr. mai Xuan Tram
ANNUAL REPORT 2014
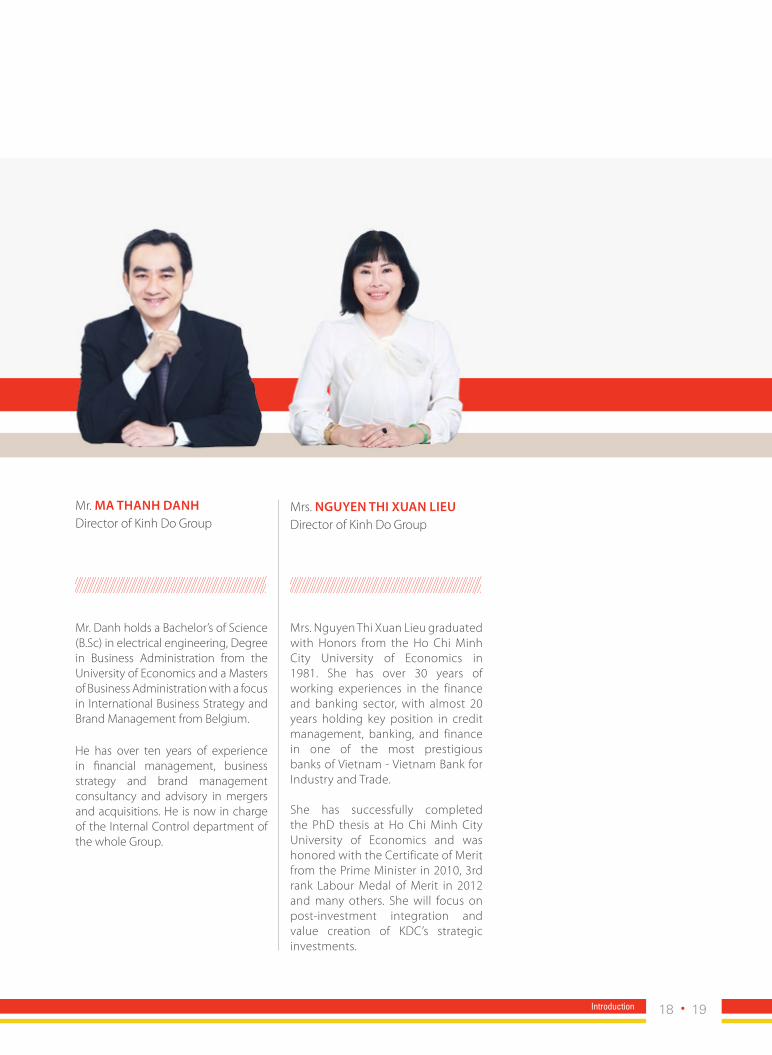
Mrs. Nguyen Thi Xuan Lieu graduated with Honors from the Ho Chi Minh City University of Economics in 1981. She has over 30 years of working experiences in the finance and banking sector, with almost 20 years holding key position in credit management, banking, and finance in one of the most prestigious banks of Vietnam - Vietnam Bank for Industry and Trade.
She has successfully completed the PhD thesis at Ho Chi Minh City University of Economics and was honored with the Certificate of Merit from the Prime Minister in 2010, 3rd rank Labour Medal of Merit in 2012 and many others. She will focus on post-investment integration and value creation of KDC’s strategic investments.
Director of Kinh Do GroupMrs. nguyen Thi Xuan Lieu
Mr. Danh holds a Bachelor’s of Science (B.Sc) in electrical engineering, Degree in Business Administration from the University of Economics and a Masters of Business Administration with a focus in International Business Strategy and Brand Management from Belgium.
He has over ten years of experience in financial management, business strategy and brand management consultancy and advisory in mergers and acquisitions. He is now in charge of the Internal Control department of the whole Group.
Director of Kinh Do GroupMr. ma Thanh Danh
18 19Introduction
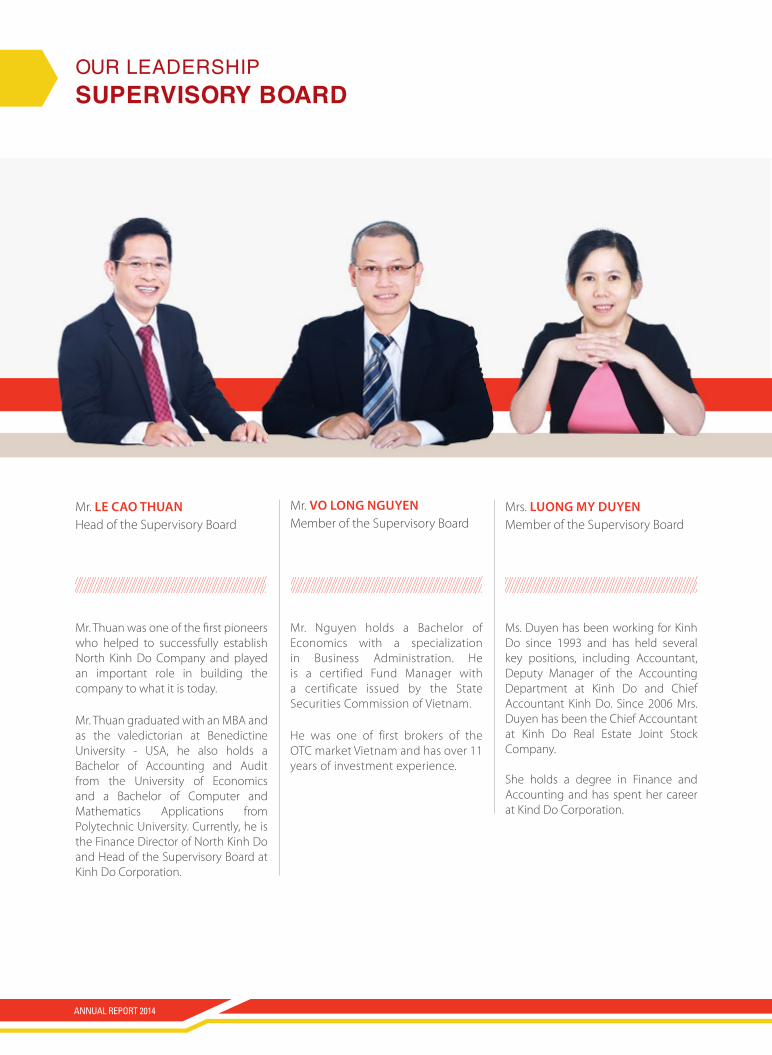
Ms. Duyen has been working for Kinh Do since 1993 and has held several key positions, including Accountant, Deputy Manager of the Accounting Department at Kinh Do and Chief Accountant Kinh Do. Since 2006 Mrs. Duyen has been the Chief Accountant at Kinh Do Real Estate Joint Stock Company.
She holds a degree in Finance and Accounting and has spent her career at Kind Do Corporation.
Member of the Supervisory BoardMrs. Luong my Duyen
Mr. Nguyen holds a Bachelor of Economics with a specialization in Business Administration. He is a certified Fund Manager with a certificate issued by the State Securities Commission of Vietnam.
He was one of first brokers of the OTC market Vietnam and has over 11 years of investment experience.
Member of the Supervisory BoardMr. Vo Long nguyen
Mr. Thuan was one of the first pioneers who helped to successfully establish North Kinh Do Company and played an important role in building the company to what it is today.
Mr. Thuan graduated with an MBA and as the valedictorian at Benedictine University - USA, he also holds a Bachelor of Accounting and Audit from the University of Economics and a Bachelor of Computer and Mathematics Applications from Polytechnic University. Currently, he is the Finance Director of North Kinh Do and Head of the Supervisory Board at Kinh Do Corporation.
Head of the Supervisory Board Mr. Le cao Thuan
Our LeaDership SupervISory Board
ANNUAL REPORT 2014
20 21Introduction
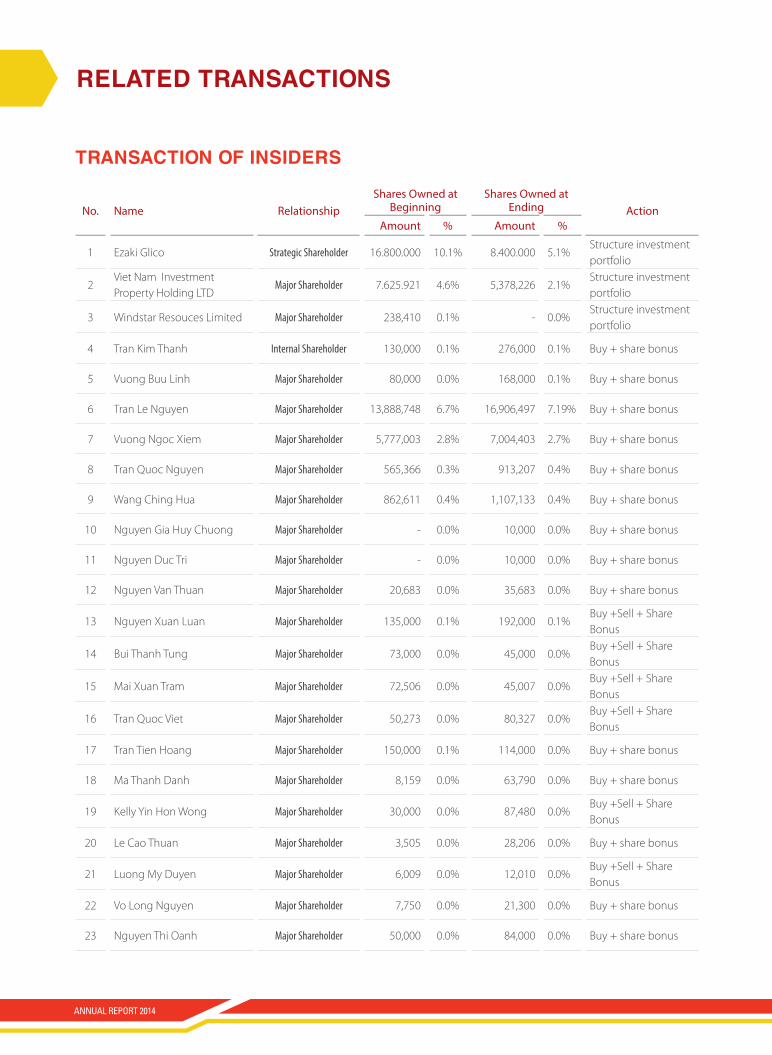
tranSactIon of InSIderS
related tranSactIonS
no. name relationshipShares Owned at
BeginningShares Owned at
ending ActionAmount % Amount %
1 Ezaki Glico Strategic Shareholder 16.800.000 10.1% 8.400.000 5.1%Structure investment portfolio
2 Viet Nam Investment Property Holding LTD
Major Shareholder 7.625.921 4.6% 5,378,226 2.1%Structure investment portfolio
3 Windstar Resouces Limited Major Shareholder 238,410 0.1% - 0.0%Structure investment portfolio
4 Tran Kim Thanh Internal Shareholder 130,000 0.1% 276,000 0.1% Buy + share bonus
5 Vuong Buu Linh Major Shareholder 80,000 0.0% 168,000 0.1% Buy + share bonus
6 Tran Le Nguyen Major Shareholder 13,888,748 6.7% 16,906,497 7.19% Buy + share bonus
7 Vuong Ngoc Xiem Major Shareholder 5,777,003 2.8% 7,004,403 2.7% Buy + share bonus
8 Tran Quoc Nguyen Major Shareholder 565,366 0.3% 913,207 0.4% Buy + share bonus
9 Wang Ching Hua Major Shareholder 862,611 0.4% 1,107,133 0.4% Buy + share bonus
10 Nguyen Gia Huy Chuong Major Shareholder - 0.0% 10,000 0.0% Buy + share bonus
11 Nguyen Duc Tri Major Shareholder - 0.0% 10,000 0.0% Buy + share bonus
12 Nguyen Van Thuan Major Shareholder 20,683 0.0% 35,683 0.0% Buy + share bonus
13 Nguyen Xuan Luan Major Shareholder 135,000 0.1% 192,000 0.1%Buy +Sell + Share Bonus
14 Bui Thanh Tung Major Shareholder 73,000 0.0% 45,000 0.0%Buy +Sell + Share Bonus
15 Mai Xuan Tram Major Shareholder 72,506 0.0% 45,007 0.0%Buy +Sell + Share Bonus
16 Tran Quoc Viet Major Shareholder 50,273 0.0% 80,327 0.0%Buy +Sell + Share Bonus
17 Tran Tien Hoang Major Shareholder 150,000 0.1% 114,000 0.0% Buy + share bonus
18 Ma Thanh Danh Major Shareholder 8,159 0.0% 63,790 0.0% Buy + share bonus
19 Kelly Yin Hon Wong Major Shareholder 30,000 0.0% 87,480 0.0%Buy +Sell + Share Bonus
20 Le Cao Thuan Major Shareholder 3,505 0.0% 28,206 0.0% Buy + share bonus
21 Luong My Duyen Major Shareholder 6,009 0.0% 12,010 0.0%Buy +Sell + Share Bonus
22 Vo Long Nguyen Major Shareholder 7,750 0.0% 21,300 0.0% Buy + share bonus
23 Nguyen Thi Oanh Major Shareholder 50,000 0.0% 84,000 0.0% Buy + share bonus
ANNUAL REPORT 2014

tranSactIon of related partIeS
no. name relationshipShares Owned at
BeginningShares Owned at
ending ActionAmount % Amount %
1 Tran Vinh Nguyen Tran Kim Thanh 458,941 0.2% 604,729 0.2% Buy + share bonus
2 Vuong Quoc Tru Vuong Buu Linh 3,643,572 1.7% 4,456,286 1.7% Buy + share bonus
3 Vuong Buu Ngoc Vuong Buu Linh 309,557 0.1% 383,468 0.2% Buy + share bonus
4 Vuong Ngan Hao Vuong Ngoc Xiem 6,000 0.0% 12,000 0.0% Buy + share bonus
5 Mai Thi Kim Phuong Mai Xuan Tram 549 - 9 0.0% Sell
6 Vuong Thu Binh Vuong Ngoc Xiem 12,500 0.0% 24,000 0.0% Buy +Sell + Share Bonus
7 Vuong Thu Le Vuong Ngoc Xiem 12,007 0.0% 11,008 0.0% Buy +Sell + Share Bonus
8 Vuong Buu Dinh Ma Thanh Danh 205,936 0.1% 271,123 0.1% Buy +Sell + Share Bonus
9 Ngo Phan Anh Dao Tran Tien Hoang 69,334 0.0% 19,204 0.0% Buy +Sell + Share Bonus
10 Nguyen Thi Hong Hanh Le Cao Thuan 3,501 0.0% 30,601 0.0% Buy + share bonus
11 Le Cao Tu Le Cao Thuan - 0.0% 1,800 0.0% Buy + share bonus
22 23Introduction
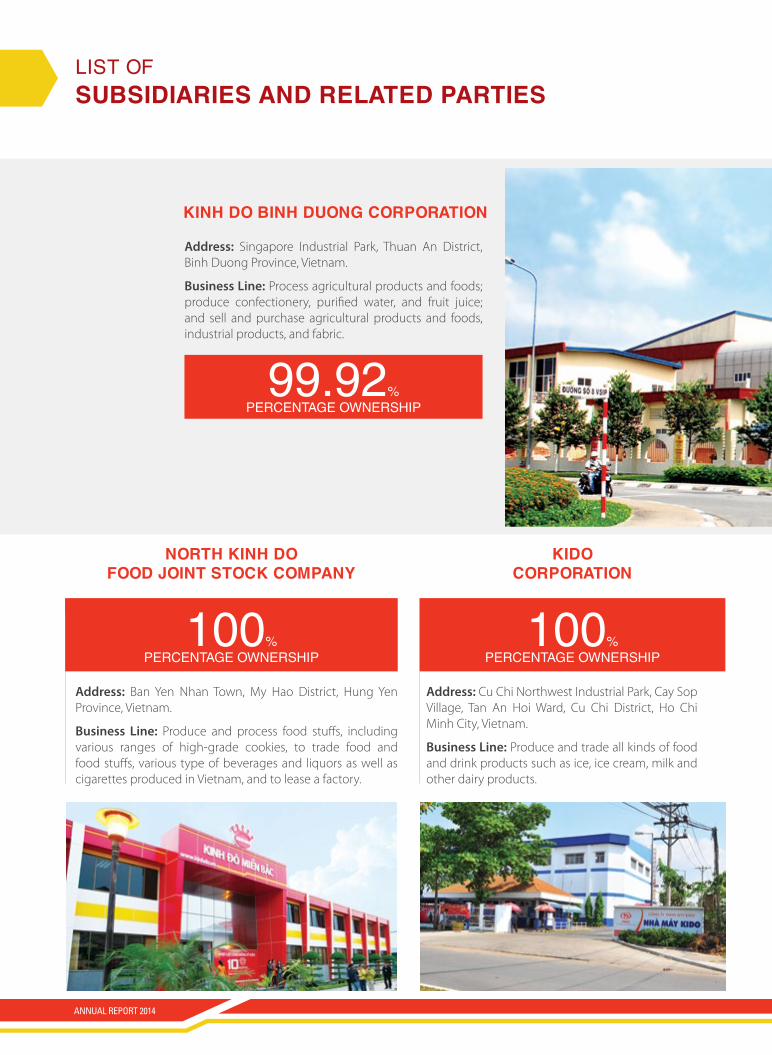
List Of SuBSIdIarIeS and related partIeS
KInh do BInh duong corporatIon
north KInh do food JoInt StocK company
KIdo corporatIon
address: Singapore Industrial Park, Thuan An District, Binh Duong Province, Vietnam.
Business Line: Process agricultural products and foods; produce confectionery, purified water, and fruit juice; and sell and purchase agricultural products and foods, industrial products, and fabric.
address: Ban Yen Nhan Town, My Hao District, Hung Yen Province, Vietnam.
Business Line: Produce and process food stuffs, including various ranges of high-grade cookies, to trade food and food stuffs, various type of beverages and liquors as well as cigarettes produced in Vietnam, and to lease a factory.
address: Cu Chi Northwest Industrial Park, Cay Sop Village, Tan An Hoi Ward, Cu Chi District, Ho Chi Minh City, Vietnam.
Business Line: Produce and trade all kinds of food and drink products such as ice, ice cream, milk and other dairy products.
100% Percentage ownershiP
100% Percentage ownershiP
99.92% Percentage ownershiP
ANNUAL REPORT 2014
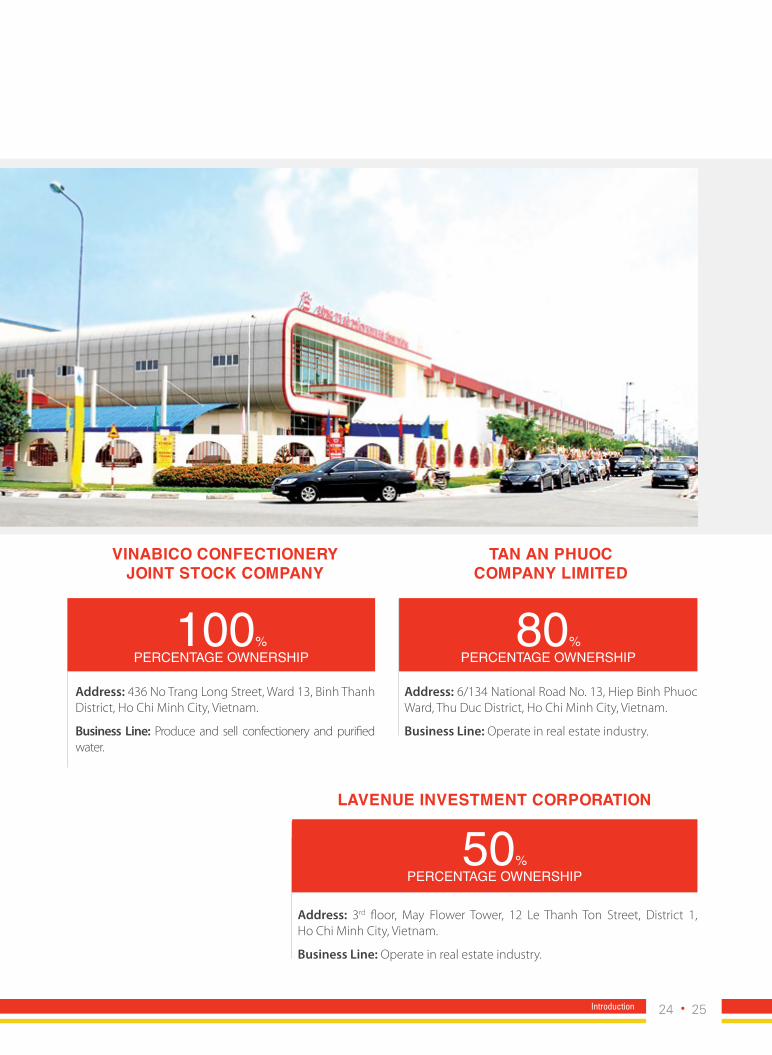
vInaBIco confectIonery JoInt StocK company
tan an phuoc company lImIted
lavenue InveStment corporatIon
address: 436 No Trang Long Street, Ward 13, Binh Thanh District, Ho Chi Minh City, Vietnam.
Business Line: Produce and sell confectionery and purified water.
address: 6/134 National Road No. 13, Hiep Binh Phuoc Ward, Thu Duc District, Ho Chi Minh City, Vietnam.
Business Line: Operate in real estate industry.
address: 3rd floor, May Flower Tower, 12 Le Thanh Ton Street, District 1, Ho Chi Minh City, Vietnam.
Business Line: Operate in real estate industry.
100% Percentage ownershiP
80% Percentage ownershiP
50% Percentage ownershiP
24 25Introduction
Strategy
In 2014, Kinh Do refocused its commitment to expand it’s addressable market to 50 million consumers
through diversification of our product portfolio.
02
7:30 AM 10:30 AM
7:00 PM9:00 PM
Innovative transition
50 millioncustomers
Strategy
In 2014, Kinh Do refocused its commitment to expand it’s addressable market to 50 million consumers
through diversification of our product portfolio.
02
7:30 AM 10:30 AM
7:00 PM9:00 PM
Innovative transition
50 millioncustomers

chaIrman’S meSSage
ANNUAL REPORT 2014
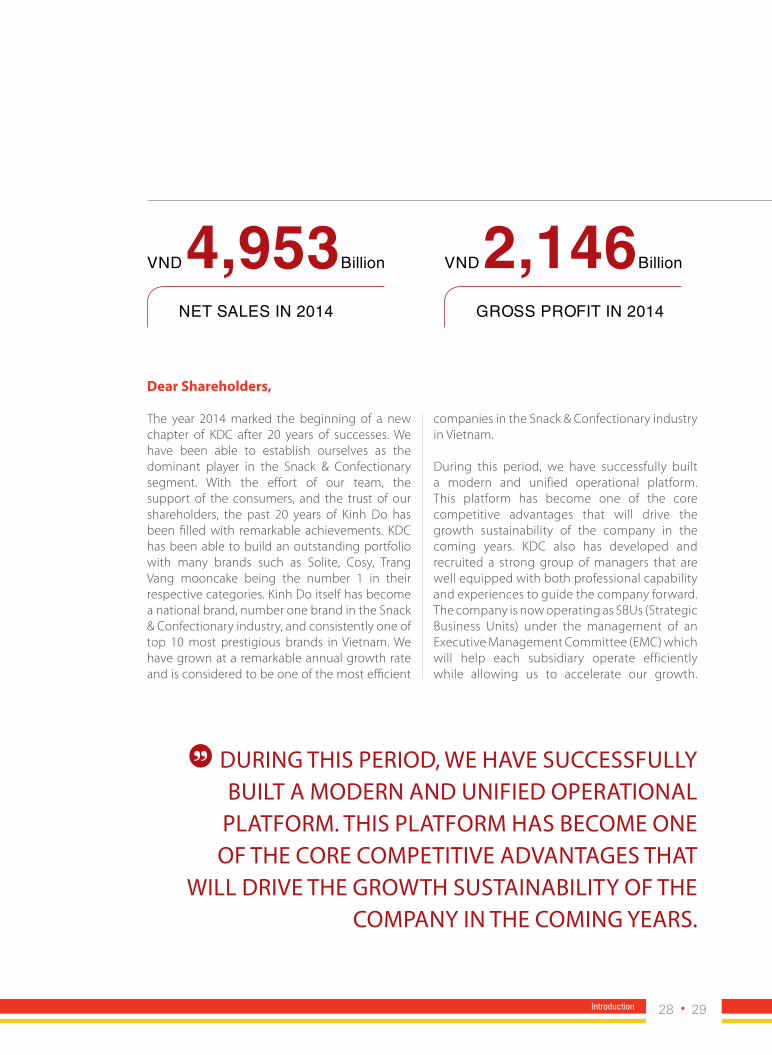
Dear Shareholders,
The year 2014 marked the beginning of a new chapter of KDC after 20 years of successes. We have been able to establish ourselves as the dominant player in the Snack & Confectionary segment. With the effort of our team, the support of the consumers, and the trust of our shareholders, the past 20 years of Kinh Do has been filled with remarkable achievements. KDC has been able to build an outstanding portfolio with many brands such as Solite, Cosy, Trang Vang mooncake being the number 1 in their respective categories. Kinh Do itself has become a national brand, number one brand in the Snack & Confectionary industry, and consistently one of top 10 most prestigious brands in Vietnam. We have grown at a remarkable annual growth rate and is considered to be one of the most efficient
companies in the Snack & Confectionary industry in Vietnam.
During this period, we have successfully built a modern and unified operational platform. This platform has become one of the core competitive advantages that will drive the growth sustainability of the company in the coming years. KDC also has developed and recruited a strong group of managers that are well equipped with both professional capability and experiences to guide the company forward. The company is now operating as SBUs (Strategic Business Units) under the management of an Executive Management Committee (EMC) which will help each subsidiary operate efficiently while allowing us to accelerate our growth.
During ThiS periOD, we hAVe SucceSSfully BuilT A MODern AnD unifieD OperATiOnAl
plATfOrM. ThiS plATfOrM hAS BecOMe One Of The cOre cOMpeTiTiVe ADVAnTAgeS ThAT
will DriVe The grOwTh SuSTAinABiliTy Of The cOMpAny in The cOMing yeArS.
VND 4,953Billion
Net saLes iN 2014
VND 2,146Billion
GrOss prOfit iN 2014
28 29Introduction
chaIrman’S meSSage
These factors together will help establish a firm foundation for the next growth phase of KDC.
As Vietnam is participating further into the globalization process, the country is being integrated further into the ASEAN economic group and by the end of this year it will also start to join the free trade pact with the EU. Within this context, KDC needs a breakthrough strategy in order to continue its success. KDC has been in the Snack & Confectionary industry for the past two decades and been considered as one of the pioneers in Vietnam. During this period, KDC has successfully built its reputation as the most renowned name in this industry. However, continued success required KDC to seek growth beyond just the confectionary space. There was a growing need for the company to find a new direction and a new area with a much larger playing field. Hence, a strategy was derived to extract the potentials from the Value Creation process and to re-direct the focus and resources into more larger segments. Make no mistake, KDC will continue to pursue the Food & Flavor strategy but looking at much larger categories and a much bigger space.. We will bring forward a new product portfolio that aims to increase (1) the number of potential consumers, (2) the consumption frequency of each consumer, and (3) reach towards overseas markets.
In order for us to concentrate and redirect our scarce resources to enter into a larger Food and Flavor space, in 2014, KDC made a landmark transaction to transfer a portion of the Snack & Confectionary business to a strategic partner, Mondelēz International. This cooperation will help to accelerate the development of Snack &
Confectionary segment in the future by placing it in the hands of the world’s number one confectionary company and allows us to focus on developing our presence in the much larger Food and Flavor space.
With the strategic orientation of moving toward being a food conglomerate, KDC has undergone a prolonged Transformative Change with our focus being shifted from Value Conversion to Value Creation. This means the consumer is placed at the heart of our entire operational focus. For the next phase, KDC will focus on two strategic goals: (1) developing KDC to become a leading food conglomerate with specialized distribution channels; (2) develop and upgrading our Value Creation process. As the economy continues to develop, the Vietnamese consumers have increasingly more access to a variety of options, and information about products. Hence, in order to succeed, company needs to understand its consumer behavior, it’s changing dynamics and bring appropriate products to meet the specific needs of individual consumer. Recognizing the growing importance of consumer’s behavior in the growth of our company, KDC has set our goals to align our entire operations to ensure that we are able to meet the needs of individual consumers. For the next chapter of growth, our strategy will be centered on 4C’s (Consumer, Category, Country, Channel). The 4C’s is the new corporate strategy, which will help guide us for the coming years. It’s also designed to help us focus on the delivery of product to consumers and dictates the way in which we interact with them. This as we mentioned already is the core element of KDC’s focus during the next phase of development.
ANNUAL REPORT 2014
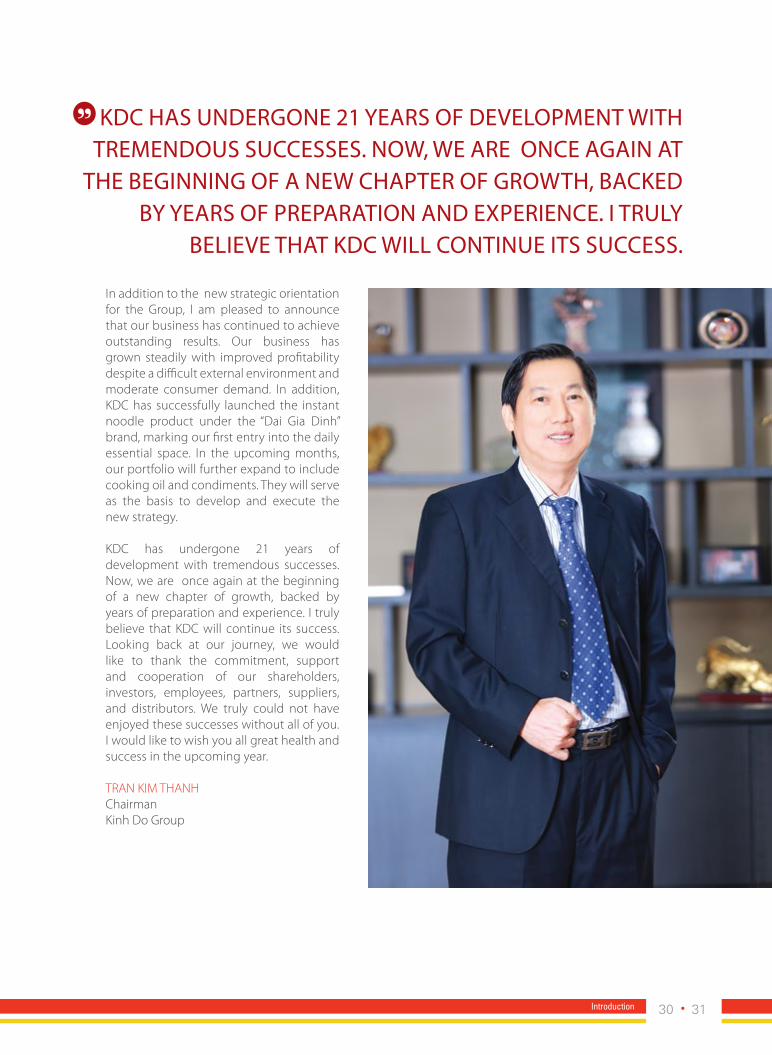
In addition to the new strategic orientation for the Group, I am pleased to announce that our business has continued to achieve outstanding results. Our business has grown steadily with improved profitability despite a difficult external environment and moderate consumer demand. In addition, KDC has successfully launched the instant noodle product under the “Dai Gia Dinh” brand, marking our first entry into the daily essential space. In the upcoming months, our portfolio will further expand to include cooking oil and condiments. They will serve as the basis to develop and execute the new strategy.
KDC has undergone 21 years of development with tremendous successes. Now, we are once again at the beginning of a new chapter of growth, backed by years of preparation and experience. I truly believe that KDC will continue its success. Looking back at our journey, we would like to thank the commitment, support and cooperation of our shareholders, investors, employees, partners, suppliers, and distributors. We truly could not have enjoyed these successes without all of you. I would like to wish you all great health and success in the upcoming year.
TRAN KIM THANHChairmanKinh Do Group
KDc hAS unDergOne 21 yeArS Of DeVelOpMenT wiTh TreMenDOuS SucceSSeS. nOw, we Are Once AgAin AT
The Beginning Of A new chApTer Of grOwTh, BAcKeD By yeArS Of prepArATiOn AnD experience. i Truly
BelieVe ThAT KDc will cOnTinue iTS SucceSS.
30 31Introduction

ceo’S meSSage
OVerAll, efficiency in Our OperATiOn prOViDeD uS A STrOng MOMenTuM DeSpiTe
unfAVOrABle MAcrO enVirOnMenT AnD MODerATe MArKeT DeMAnD.
ANNUAL REPORT 2014
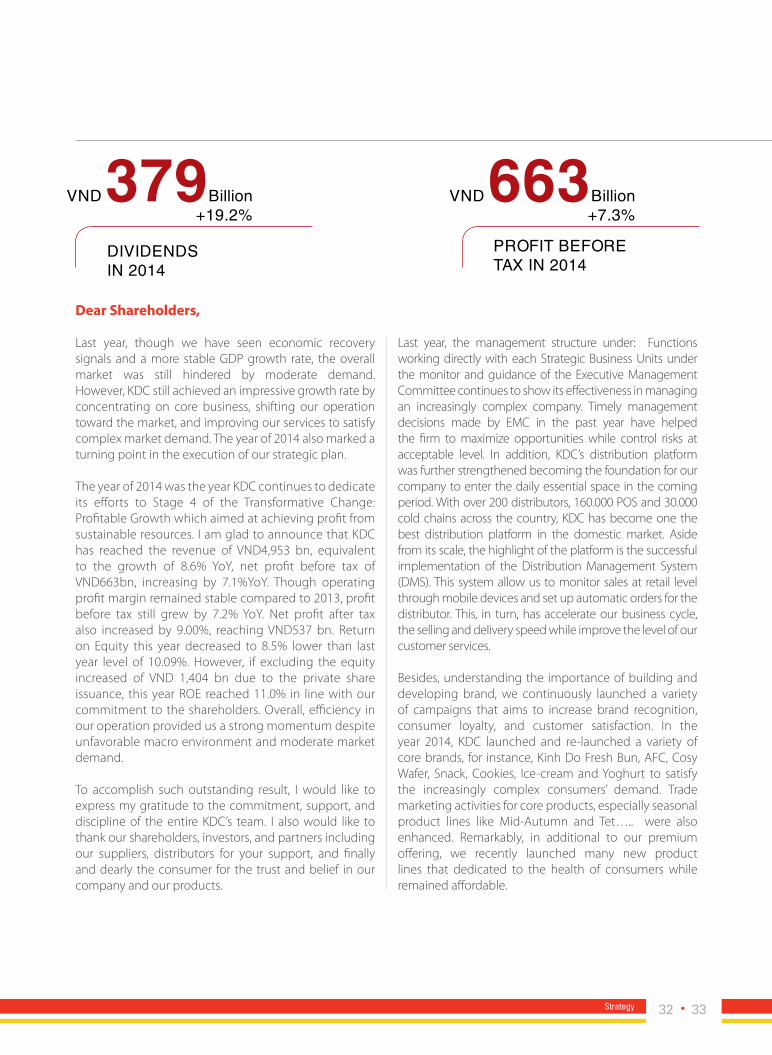
Dear Shareholders,
Last year, though we have seen economic recovery signals and a more stable GDP growth rate, the overall market was still hindered by moderate demand. However, KDC still achieved an impressive growth rate by concentrating on core business, shifting our operation toward the market, and improving our services to satisfy complex market demand. The year of 2014 also marked a turning point in the execution of our strategic plan.
The year of 2014 was the year KDC continues to dedicate its efforts to Stage 4 of the Transformative Change: Profitable Growth which aimed at achieving profit from sustainable resources. I am glad to announce that KDC has reached the revenue of VND4,953 bn, equivalent to the growth of 8.6% YoY, net profit before tax of VND663bn, increasing by 7.1%YoY. Though operating profit margin remained stable compared to 2013, profit before tax still grew by 7.2% YoY. Net profit after tax also increased by 9.00%, reaching VND537 bn. Return on Equity this year decreased to 8.5% lower than last year level of 10.09%. However, if excluding the equity increased of VND 1,404 bn due to the private share issuance, this year ROE reached 11.0% in line with our commitment to the shareholders. Overall, efficiency in our operation provided us a strong momentum despite unfavorable macro environment and moderate market demand.
To accomplish such outstanding result, I would like to express my gratitude to the commitment, support, and discipline of the entire KDC’s team. I also would like to thank our shareholders, investors, and partners including our suppliers, distributors for your support, and finally and dearly the consumer for the trust and belief in our company and our products.
Last year, the management structure under: Functions working directly with each Strategic Business Units under the monitor and guidance of the Executive Management Committee continues to show its effectiveness in managing an increasingly complex company. Timely management decisions made by EMC in the past year have helped the firm to maximize opportunities while control risks at acceptable level. In addition, KDC’s distribution platform was further strengthened becoming the foundation for our company to enter the daily essential space in the coming period. With over 200 distributors, 160.000 POS and 30.000 cold chains across the country, KDC has become one the best distribution platform in the domestic market. Aside from its scale, the highlight of the platform is the successful implementation of the Distribution Management System (DMS). This system allow us to monitor sales at retail level through mobile devices and set up automatic orders for the distributor. This, in turn, has accelerate our business cycle, the selling and delivery speed while improve the level of our customer services.
Besides, understanding the importance of building and developing brand, we continuously launched a variety of campaigns that aims to increase brand recognition, consumer loyalty, and customer satisfaction. In the year 2014, KDC launched and re-launched a variety of core brands, for instance, Kinh Do Fresh Bun, AFC, Cosy Wafer, Snack, Cookies, Ice-cream and Yoghurt to satisfy the increasingly complex consumers’ demand. Trade marketing activities for core products, especially seasonal product lines like Mid-Autumn and Tet….. were also enhanced. Remarkably, in additional to our premium offering, we recently launched many new product lines that dedicated to the health of consumers while remained affordable.
DiViDeNDs iN 2014
VND 663Billion +7.3%
VND 379Billion +19.2%
prOfit BefOre tax iN 2014
32 33Strategy

fOr The upcOMing chApTer, we wiSh ThAT The ShArehOlDerS, inVeSTOrS, AnD pArTnerS incluDing Our SupplierS, DiSTriBuTOrS will cOnTinue TO cOMMiT AnD SuppOrT uS.
The year 2014 also earmarked our expansion toward Food & Flavor space. This includes products that are consumed daily including meal compliments and meal replacements and can be used multiple times throughout the day. Due to its nature, this space has high coverage and much higher penetration that promises a great potential for revenue and profit growth.
2015 economic outlook remains fairly moderate which will pose challenges to our business. However, there are signs of recovery from the real estate market while CPI index is forecasted to be quite stable. As such, following the 2015 strategic goals of our Chairman, KDC has outlined an execution plan in detail to pursue the strategy, accelerate our company growth rate and create more value to the Shareholders.
ceo’S meSSage
ANNUAL REPORT 2014
In the upcoming years, one of the key success factors for us is the development and efficiency improvements of our distribution channels. The success of the entire organization will depend on our ability to drive the efficiency of individual channel as well as cross channel synergy. Moving forwards, KDC will reorganized into a Food Conglomerate with each subsidiary specializing on one of the following channels: packaged, frozen, retail and export. Currently, KDC has already possessed a strong distribution platform, experienced sales force and high market coverage across the country. Post the transformation, KDC will look to enhance the synergy cross channels to increase overall efficiency. In the longer term, KDC will seek additional opportunities to enter into the regional and global market. In additional to leveraging our low cost base to enter global playground, we will look for opportunities to leverage regional resources to improve our Value Creation process.
Furthermore, the entire category strategy of KDC will be consumer centric. Previously, serving opportunity of our product portfolio was limited within breakfast, afternoon tea, and dessert while missing two important periods: lunch and dinner. In addition, our consumer target age group was limited within 20 to 45 years old. Hence, in the future, we aim to diversify our product portfolio to serve the entire consumer base from urban to rural areas in different age group covering the entire consumer’s daily live. To be specific, after the launch of instant noodles at the end of 2014, we will look to launch premium instant noodles, cooking oil, condiments, and other products in Food & Flavour space.
We have also build a system and process to collect and analyze consumer feedbacks. As such, KDC could understand what products that its customers need, where they want to buy, at which time to use and in turn driving the entire operation base on such information. Hence, we look to develop the Dai Gia Dinh brand to become a brand that is well connected
with Vietnamese families. Endorsed by this brand, more products will be launched to satisfy the needs of different type of consumers in different age group throughout the day.
Even though Food & Flavour is an attractive space, it is also a field with large and experienced players. Thus, in order to prepare our entry, KDC needs a strong foundation that can sustain over the long term. As a result, KDC has restructured its Snack & Confectionary business by entering into a strategic partnership with Mondelēz International. This agreement will accelerate the development of Snack & Confectionary in the future and allow us to focus our resources to enter into Food & Flavour.
Together with establishing a strategic plan and a details execution plan, we have also set up a proactive risk management process. The process will carefully monitor and actively manage potential external and internal risks to assure the execution of business targets each year. To be specific, risks may come from the industry, suppliers, customers, business partner, entrance into new market and consumers’ demand.
For the upcoming chapter, we wish that the shareholders, investors, and partners including our suppliers, distributors will continue to commit and support us. Your trust will become our strength and motivation throughout our journey to accomplish our strategic goals and operating targets. Finally, I would like to wish you all great health and success in the upcoming year.
TRAN LE NGUYENChief Excutive OfficerKinh Do Group
34 35Strategy
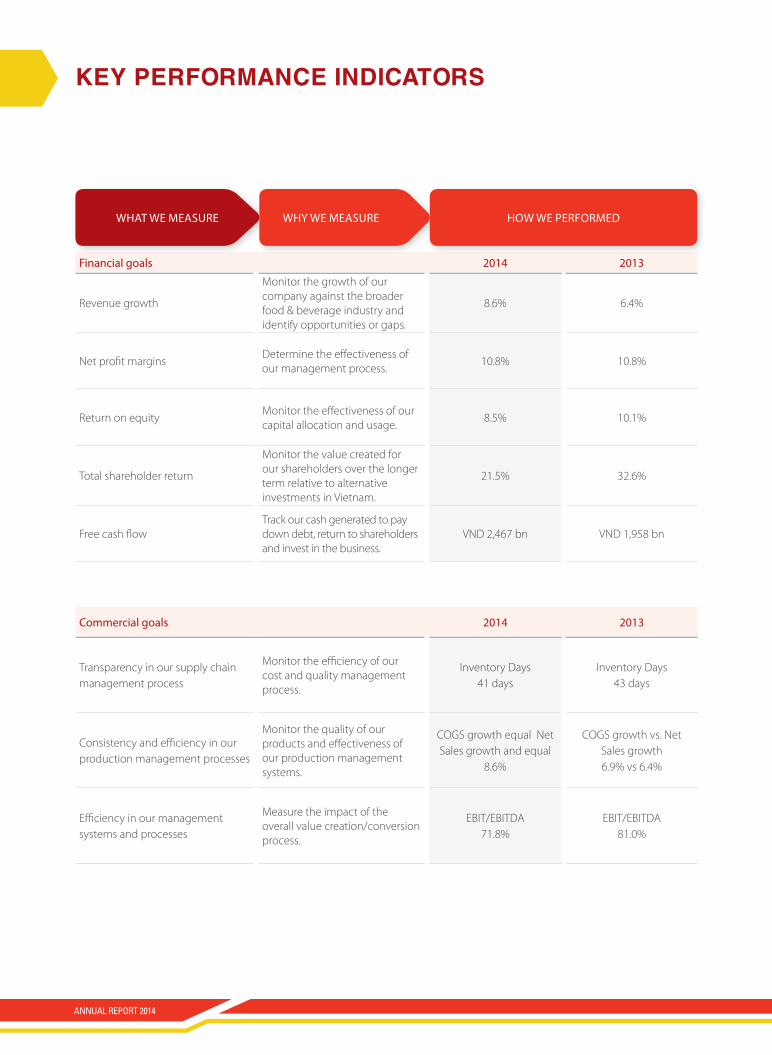
Key performance IndIcatorS
financial goals 2014 2013
Revenue growth
Monitor the growth of our company against the broader food & beverage industry and identify opportunities or gaps.
8.6% 6.4%
Net profit marginsDetermine the effectiveness of our management process.
10.8% 10.8%
Return on equityMonitor the effectiveness of our capital allocation and usage.
8.5% 10.1%
Total shareholder return
Monitor the value created for our shareholders over the longer term relative to alternative investments in Vietnam.
21.5% 32.6%
Free cash flowTrack our cash generated to pay down debt, return to shareholders and invest in the business.
VND 2,467 bn VND 1,958 bn
commercial goals 2014 2013
Transparency in our supply chain management process
Monitor the efficiency of our cost and quality management process.
Inventory Days 41 days
Inventory Days 43 days
Consistency and efficiency in our production management processes
Monitor the quality of our products and effectiveness of our production management systems.
COGS growth equal Net Sales growth and equal
8.6%
COGS growth vs. Net Sales growth6.9% vs 6.4%
Efficiency in our management systems and processes
Measure the impact of the overall value creation/conversion process.
EBIT/EBITDA71.8%
EBIT/EBITDA81.0%
whAT we MeASure why we MeASure hOw we perfOrMeD
ANNUAL REPORT 2014

36 37Strategy

MArKeTing
SAleS fOrcecOnSuMerS
reTAilerS DiSTriBuTOr
MAnufAcTuring
SupplierS
VAlu
e
cOn
VerS
iOn
VAlu
e
creA
TiO
n
Suppliers - Kinh Do is working with over 200 suppliers world-wide to ensure that the best quality materials are sourced for the best price with the objective of having a consistent balance between quality and profitability.
Employees - Kinh Do is working with over 8,000 employees including 4.800 in manufacturing, 1.650 in the distribution system and 1.550 in the growth platform to convert raw materials to product and create value through delivery of products that leverage our marketing and sales knowledge.
Distributors - Reaching through 3 channels to access 161,000 point of sales to deliver products. Connected through our Distributor Management System which allows us to access on a daily basis the inventory and sales volume throughout our channels.
Retailers - Serving over 161,000 point of sales and connected to our platform through our mobility platform to manage the sales execution process at a retailer level.
Consumers - Targeting over 50 million consumers with our range of products through 3 channels in Vietnam.
BuSIneSS model
impaCtiNG
the DaiLy LiVes Of
50 miLLiON CONsumers
ANNUAL REPORT 2014
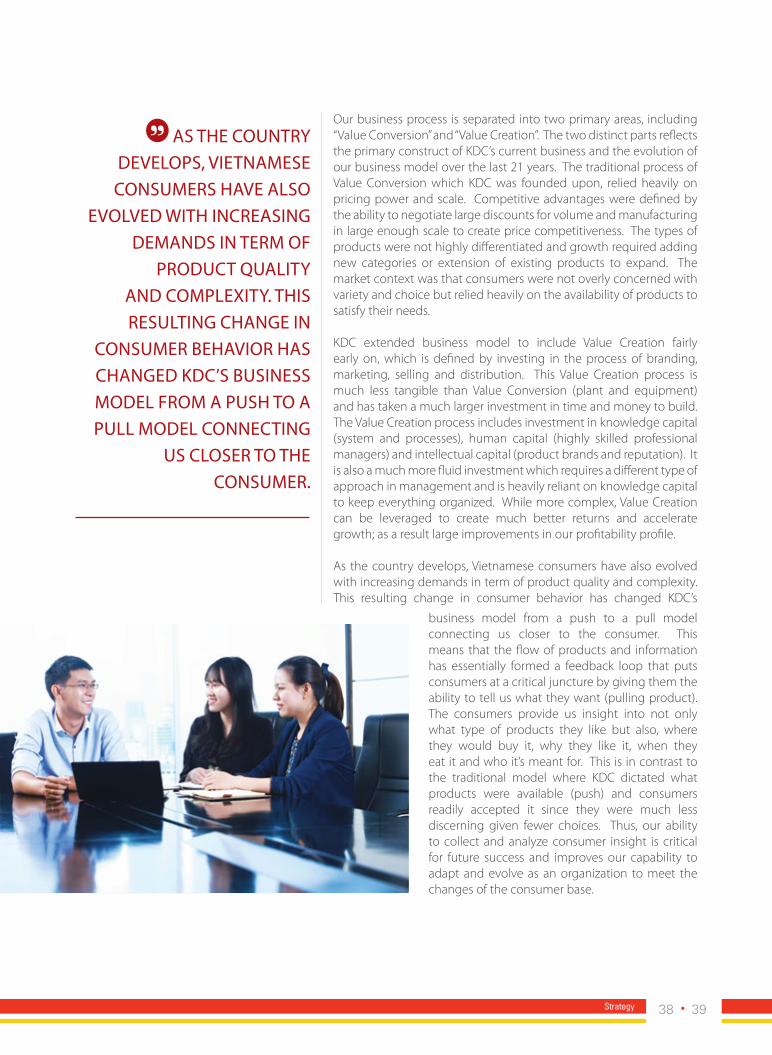
Our business process is separated into two primary areas, including “Value Conversion” and “Value Creation”. The two distinct parts reflects the primary construct of KDC’s current business and the evolution of our business model over the last 21 years. The traditional process of Value Conversion which KDC was founded upon, relied heavily on pricing power and scale. Competitive advantages were defined by the ability to negotiate large discounts for volume and manufacturing in large enough scale to create price competitiveness. The types of products were not highly differentiated and growth required adding new categories or extension of existing products to expand. The market context was that consumers were not overly concerned with variety and choice but relied heavily on the availability of products to satisfy their needs.
KDC extended business model to include Value Creation fairly early on, which is defined by investing in the process of branding, marketing, selling and distribution. This Value Creation process is much less tangible than Value Conversion (plant and equipment) and has taken a much larger investment in time and money to build. The Value Creation process includes investment in knowledge capital (system and processes), human capital (highly skilled professional managers) and intellectual capital (product brands and reputation). It is also a much more fluid investment which requires a different type of approach in management and is heavily reliant on knowledge capital to keep everything organized. While more complex, Value Creation can be leveraged to create much better returns and accelerate growth; as a result large improvements in our profitability profile.
As the country develops, Vietnamese consumers have also evolved with increasing demands in term of product quality and complexity. This resulting change in consumer behavior has changed KDC’s
AS The cOunTry DeVelOpS, VieTnAMeSe
cOnSuMerS hAVe AlSO eVOlVeD wiTh increASing
DeMAnDS in TerM Of prODucT quAliTy
AnD cOMplexiTy. ThiS reSulTing chAnge in
cOnSuMer BehAViOr hAS chAngeD KDc’S BuSineSS MODel frOM A puSh TO A pull MODel cOnnecTing
uS clOSer TO The cOnSuMer.
business model from a push to a pull model connecting us closer to the consumer. This means that the flow of products and information has essentially formed a feedback loop that puts consumers at a critical juncture by giving them the ability to tell us what they want (pulling product). The consumers provide us insight into not only what type of products they like but also, where they would buy it, why they like it, when they eat it and who it’s meant for. This is in contrast to the traditional model where KDC dictated what products were available (push) and consumers readily accepted it since they were much less discerning given fewer choices. Thus, our ability to collect and analyze consumer insight is critical for future success and improves our capability to adapt and evolve as an organization to meet the changes of the consumer base.
38 39Strategy
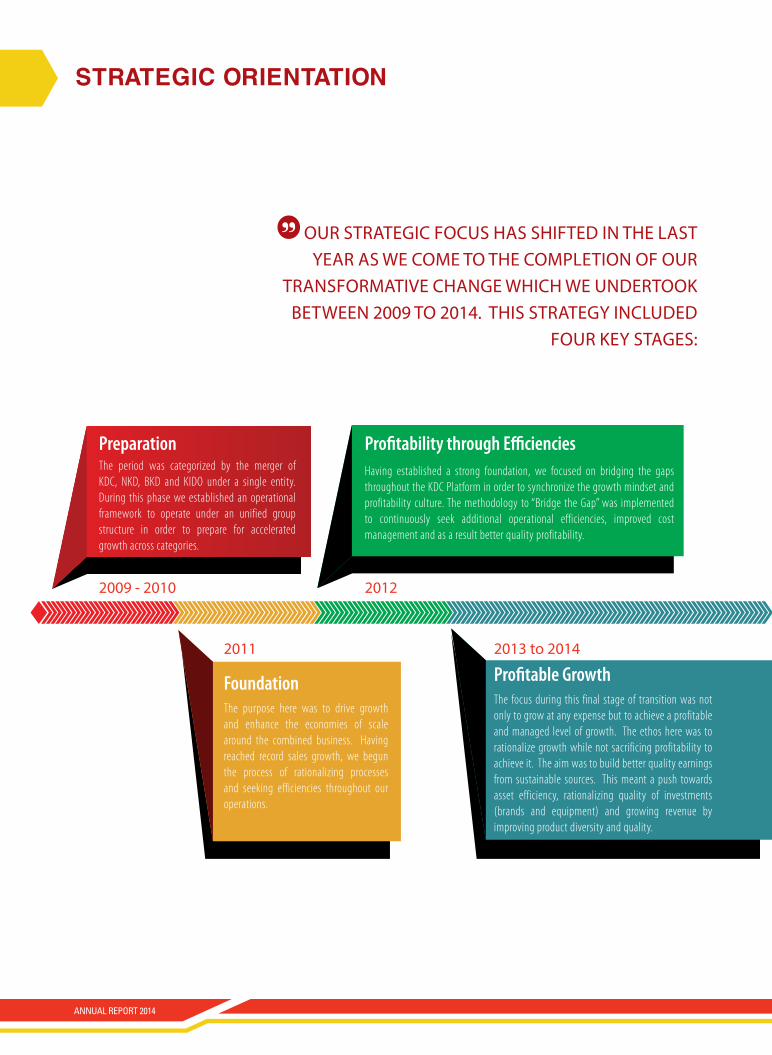
StrategIc orIentatIon
Our STrATegic fOcuS hAS ShifTeD in The lAST yeAr AS we cOMe TO The cOMpleTiOn Of Our
TrAnSfOrMATiVe chAnge which we unDerTOOK BeTween 2009 TO 2014. ThiS STrATegy incluDeD
fOur Key STAgeS:
Preparation Profitability through Efficiencies
Foundation Profitable Growth
2009 - 2010 2012
2011 2013 to 2014
The period was categorized by the merger of KDC, NKD, BKD and KIDO under a single entity. During this phase we established an operational framework to operate under an unified group structure in order to prepare for accelerated growth across categories.
Having established a strong foundation, we focused on bridging the gaps throughout the KDC Platform in order to synchronize the growth mindset and profitability culture. The methodology to “Bridge the Gap” was implemented to continuously seek additional operational efficiencies, improved cost management and as a result better quality profitability.
The purpose here was to drive growth and enhance the economies of scale around the combined business. Having reached record sales growth, we begun the process of rationalizing processes and seeking efficiencies throughout our operations.
The focus during this final stage of transition was not only to grow at any expense but to achieve a profitable and managed level of growth. The ethos here was to rationalize growth while not sacrificing profitability to achieve it. The aim was to build better quality earnings from sustainable sources. This meant a push towards asset efficiency, rationalizing quality of investments (brands and equipment) and growing revenue by improving product diversity and quality.
ANNUAL REPORT 2014
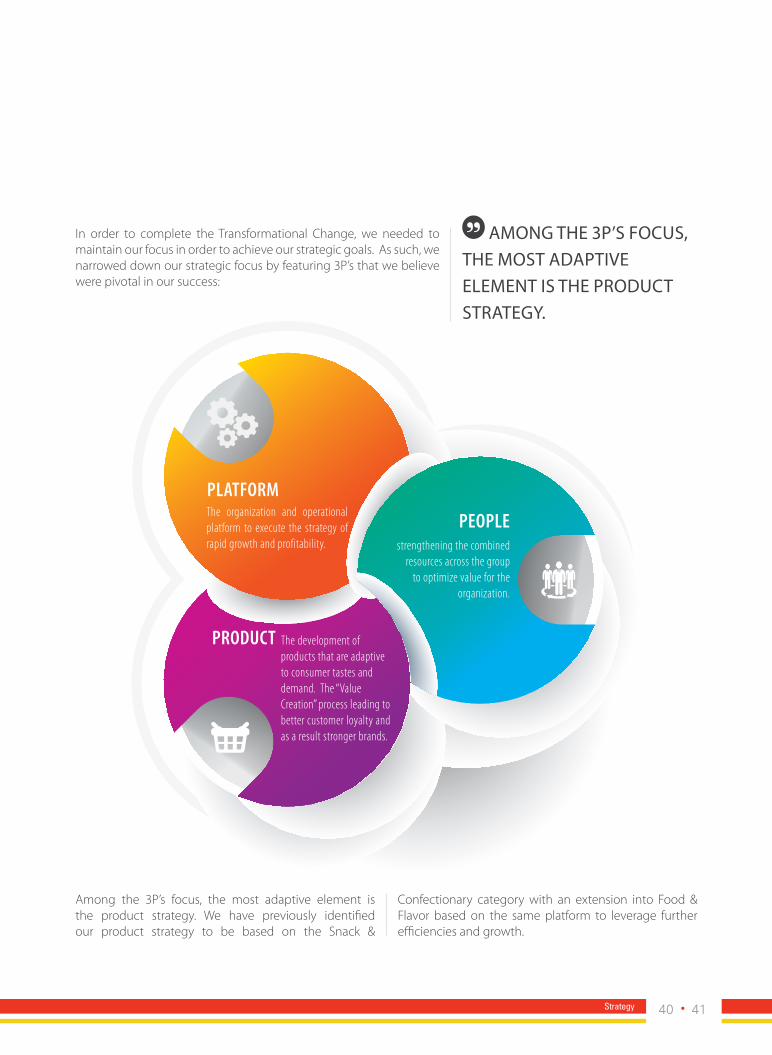
AMOng The 3p’S fOcuS, The MOST ADApTiVe eleMenT iS The prODucT STrATegy.
In order to complete the Transformational Change, we needed to maintain our focus in order to achieve our strategic goals. As such, we narrowed down our strategic focus by featuring 3P’s that we believe were pivotal in our success:
Among the 3P’s focus, the most adaptive element is the product strategy. We have previously identified our product strategy to be based on the Snack &
Confectionary category with an extension into Food & Flavor based on the same platform to leverage further efficiencies and growth.
PlatForm
PEoPlEThe organization and operational platform to execute the strategy of rapid growth and profitability.
The development of products that are adaptive to consumer tastes and demand. The “Value Creation” process leading to better customer loyalty and as a result stronger brands.
strengthening the combined resources across the group
to optimize value for the organization.
Product
40 41Strategy
StrategIc orIentatIon
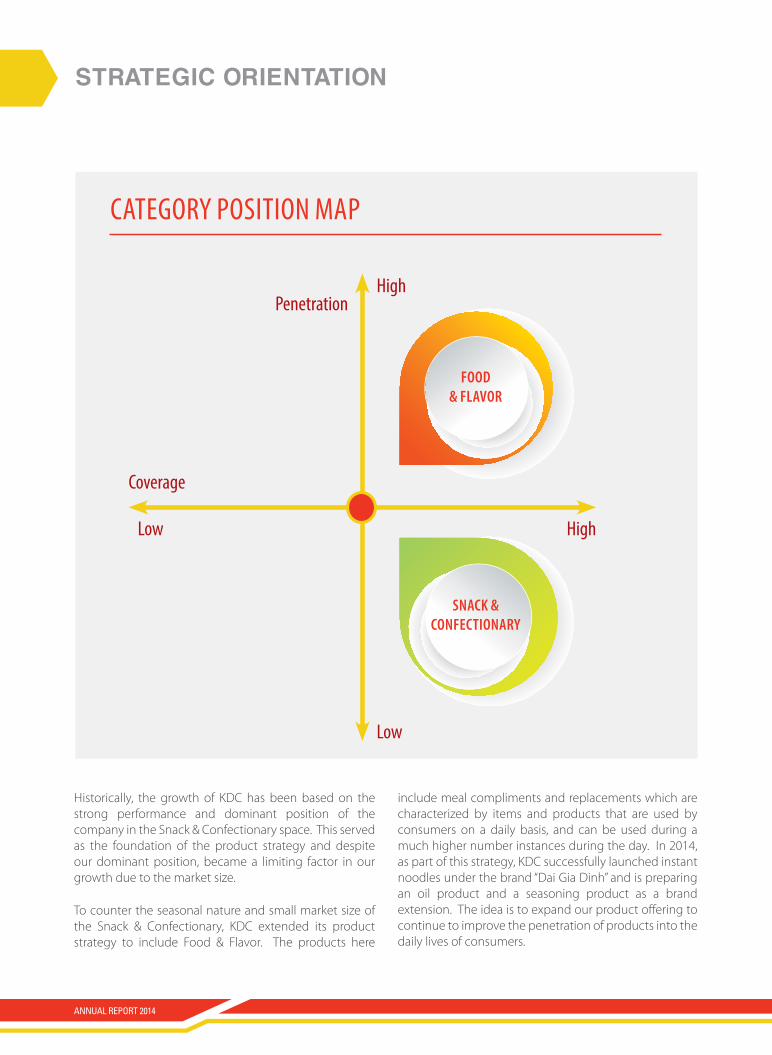
Historically, the growth of KDC has been based on the strong performance and dominant position of the company in the Snack & Confectionary space. This served as the foundation of the product strategy and despite our dominant position, became a limiting factor in our growth due to the market size.
To counter the seasonal nature and small market size of the Snack & Confectionary, KDC extended its product strategy to include Food & Flavor. The products here
Category PoSItIon MaP
HighPenetration
Coverage
High
Low
Low
Food & Flavor
Snack & conFEctionary
include meal compliments and replacements which are characterized by items and products that are used by consumers on a daily basis, and can be used during a much higher number instances during the day. In 2014, as part of this strategy, KDC successfully launched instant noodles under the brand “Dai Gia Dinh” and is preparing an oil product and a seasoning product as a brand extension. The idea is to expand our product offering to continue to improve the penetration of products into the daily lives of consumers.
ANNUAL REPORT 2014
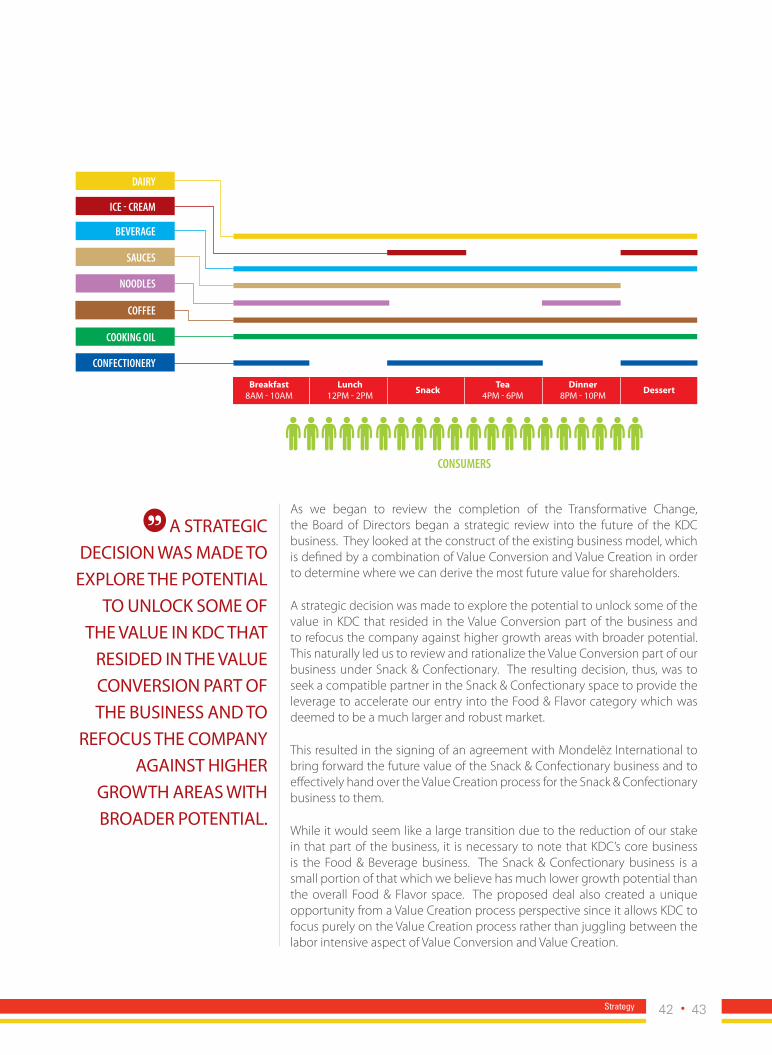
CONSUMERS
Breakfast8AM - 10AM
Lunch12PM - 2PM
Tea4PM - 6PM
Dinner8PM - 10PMSnack Dessert
DAIRY
ICE - CREAM
BEVERAGE
SAUCES
NOODLES
COFFEE
COOKING OIL
CONFECTIONERY
As we began to review the completion of the Transformative Change, the Board of Directors began a strategic review into the future of the KDC business. They looked at the construct of the existing business model, which is defined by a combination of Value Conversion and Value Creation in order to determine where we can derive the most future value for shareholders.
A strategic decision was made to explore the potential to unlock some of the value in KDC that resided in the Value Conversion part of the business and to refocus the company against higher growth areas with broader potential. This naturally led us to review and rationalize the Value Conversion part of our business under Snack & Confectionary. The resulting decision, thus, was to seek a compatible partner in the Snack & Confectionary space to provide the leverage to accelerate our entry into the Food & Flavor category which was deemed to be a much larger and robust market.
This resulted in the signing of an agreement with Mondelēz International to bring forward the future value of the Snack & Confectionary business and to effectively hand over the Value Creation process for the Snack & Confectionary business to them.
While it would seem like a large transition due to the reduction of our stake in that part of the business, it is necessary to note that KDC’s core business is the Food & Beverage business. The Snack & Confectionary business is a small portion of that which we believe has much lower growth potential than the overall Food & Flavor space. The proposed deal also created a unique opportunity from a Value Creation process perspective since it allows KDC to focus purely on the Value Creation process rather than juggling between the labor intensive aspect of Value Conversion and Value Creation.
A STrATegic DeciSiOn wAS MADe TO
explOre The pOTenTiAl TO unlOcK SOMe Of
The VAlue in KDc ThAT reSiDeD in The VAlue cOnVerSiOn pArT Of The BuSineSS AnD TO
refOcuS The cOMpAny AgAinST higher
grOwTh AreAS wiTh BrOADer pOTenTiAl.
42 43Strategy

corporate Strategy
The VAlue creATiOn prOceSS iS DriVen By A reViSeD cOrpOrATe STrATegy which will replAce The TrAnSfOrMATiVe chAnge STrATegy.
Our reViSeD cOrpOrATe STrATegy will Be DiViDeD inTO A fOur pArT execuTiOn plAn which incluDeS
1) ConSumer 2) Category 3) Country 4) Channel. TheSe 4c’S (cOnSuMer, cATegOry, cOunTry, chAnnel) will Define Our execuTiOn plAn fOr The nexT few yeArS AnD iS inTenDeD TO SerVe AS A MAp upOn which KDc cAn exTenD iTS VAlue creATiOn prOceSS in An
AccelerATeD fAShiOn AnD AS A reSulT DeliVer higher ShArehOlDer reTurnS AnD prOfiTS.
ANNUAL REPORT 2014
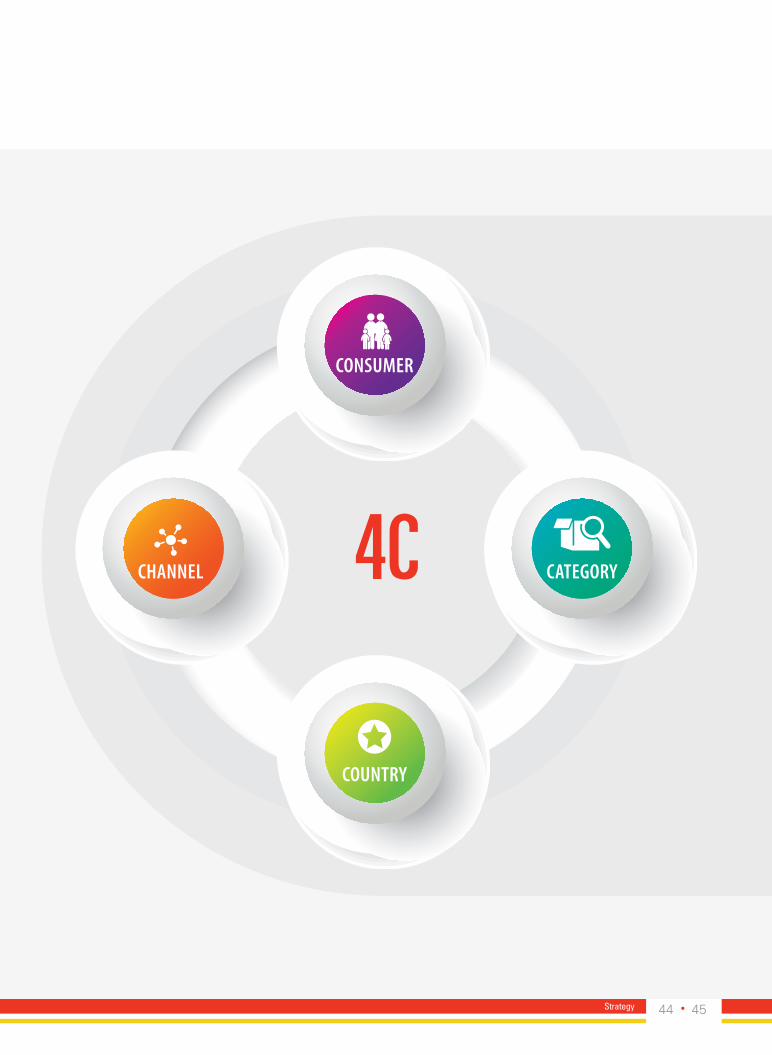
conSumEr
channEl 4C
country
catEGory
44 45Strategy
corporate Strategy
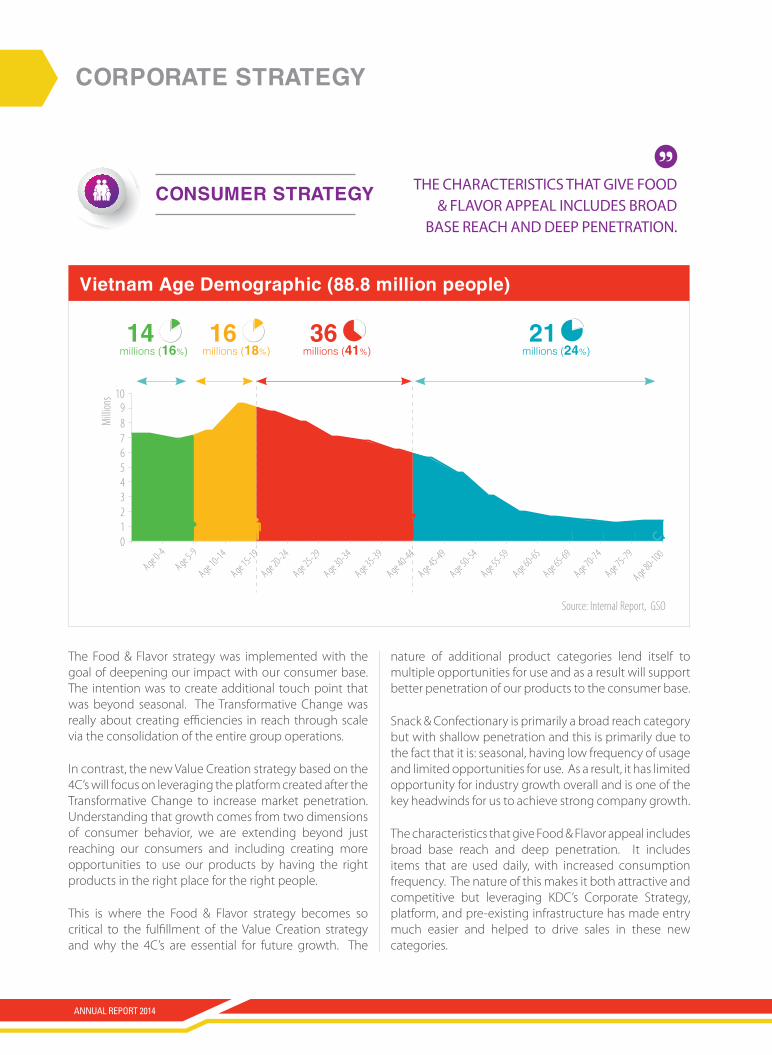
Vietnam Age Demographic (88.8 million people)
10
Millio
ns
Age 0-4
Age 5-9
Age 10-14
Age 15-19
Age 20-24
Age 25-29
Age 30-34
Age 35-39
Age 40-44
Age 45-49
Age 50-54
Age 55-59
Age 60-65
Age 65-69
Age 70-74
Age 75-79
Age 80-100
9876543210
21millions (24%)
36 millions (41%)
16millions (18%)
14millions (16%)
Source: Internal Report, GSO
conSumer Strategy
The Food & Flavor strategy was implemented with the goal of deepening our impact with our consumer base. The intention was to create additional touch point that was beyond seasonal. The Transformative Change was really about creating efficiencies in reach through scale via the consolidation of the entire group operations.
In contrast, the new Value Creation strategy based on the 4C’s will focus on leveraging the platform created after the Transformative Change to increase market penetration. Understanding that growth comes from two dimensions of consumer behavior, we are extending beyond just reaching our consumers and including creating more opportunities to use our products by having the right products in the right place for the right people.
This is where the Food & Flavor strategy becomes so critical to the fulfillment of the Value Creation strategy and why the 4C’s are essential for future growth. The
nature of additional product categories lend itself to multiple opportunities for use and as a result will support better penetration of our products to the consumer base.
Snack & Confectionary is primarily a broad reach category but with shallow penetration and this is primarily due to the fact that it is: seasonal, having low frequency of usage and limited opportunities for use. As a result, it has limited opportunity for industry growth overall and is one of the key headwinds for us to achieve strong company growth.
The characteristics that give Food & Flavor appeal includes broad base reach and deep penetration. It includes items that are used daily, with increased consumption frequency. The nature of this makes it both attractive and competitive but leveraging KDC’s Corporate Strategy, platform, and pre-existing infrastructure has made entry much easier and helped to drive sales in these new categories.
The chArAcTeriSTicS ThAT giVe fOOD
& flAVOr AppeAl incluDeS BrOAD BASe reAch AnD Deep peneTrATiOn.
ANNUAL REPORT 2014
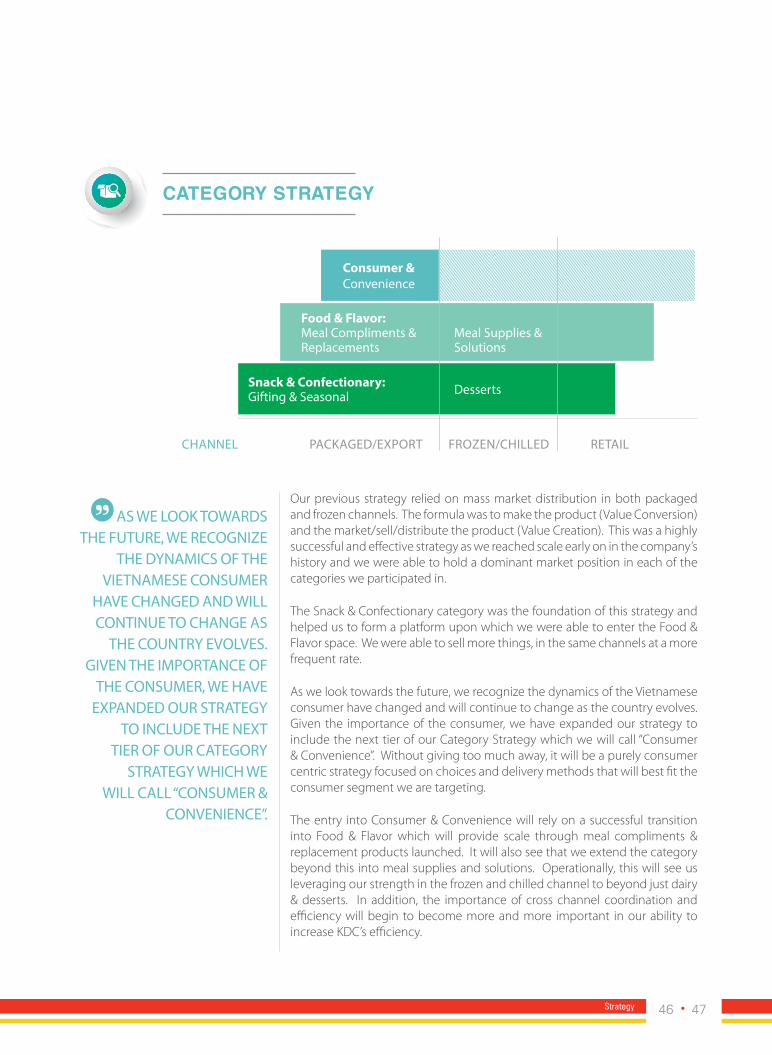
category Strategy
Our previous strategy relied on mass market distribution in both packaged and frozen channels. The formula was to make the product (Value Conversion) and the market/sell/distribute the product (Value Creation). This was a highly successful and effective strategy as we reached scale early on in the company’s history and we were able to hold a dominant market position in each of the categories we participated in.
The Snack & Confectionary category was the foundation of this strategy and helped us to form a platform upon which we were able to enter the Food & Flavor space. We were able to sell more things, in the same channels at a more frequent rate.
As we look towards the future, we recognize the dynamics of the Vietnamese consumer have changed and will continue to change as the country evolves. Given the importance of the consumer, we have expanded our strategy to include the next tier of our Category Strategy which we will call “Consumer & Convenience”. Without giving too much away, it will be a purely consumer centric strategy focused on choices and delivery methods that will best fit the consumer segment we are targeting.
The entry into Consumer & Convenience will rely on a successful transition into Food & Flavor which will provide scale through meal compliments & replacement products launched. It will also see that we extend the category beyond this into meal supplies and solutions. Operationally, this will see us leveraging our strength in the frozen and chilled channel to beyond just dairy & desserts. In addition, the importance of cross channel coordination and efficiency will begin to become more and more important in our ability to increase KDC’s efficiency.
Consumer & convenience
Food & Flavor:Meal compliments & replacements
Snack & Confectionary:gifting & Seasonal Desserts
Meal Supplies &Solutions
chAnnel pAcKAgeD/expOrT frOzen/chilleD reTAil
AS we lOOK TOwArDS The fuTure, we recOgnize
The DynAMicS Of The VieTnAMeSe cOnSuMer
hAVe chAngeD AnD will cOnTinue TO chAnge AS
The cOunTry eVOlVeS. giVen The iMpOrTAnce Of
The cOnSuMer, we hAVe expAnDeD Our STrATegy
TO incluDe The nexT Tier Of Our cATegOry
STrATegy which we will cAll “cOnSuMer &
cOnVenience”.
46 47Strategy
corporate Strategy
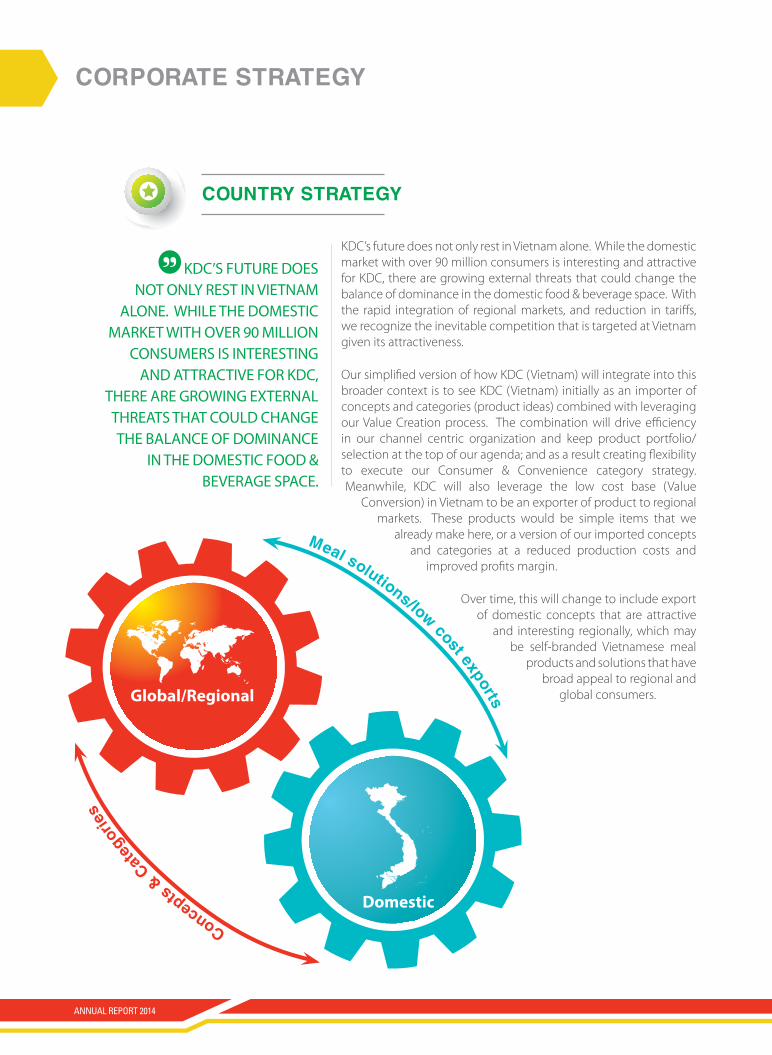
country Strategy
KDC’s future does not only rest in Vietnam alone. While the domestic market with over 90 million consumers is interesting and attractive for KDC, there are growing external threats that could change the balance of dominance in the domestic food & beverage space. With the rapid integration of regional markets, and reduction in tariffs, we recognize the inevitable competition that is targeted at Vietnam given its attractiveness.
Our simplified version of how KDC (Vietnam) will integrate into this broader context is to see KDC (Vietnam) initially as an importer of concepts and categories (product ideas) combined with leveraging our Value Creation process. The combination will drive efficiency in our channel centric organization and keep product portfolio/selection at the top of our agenda; and as a result creating flexibility to execute our Consumer & Convenience category strategy. Meanwhile, KDC will also leverage the low cost base (Value
Conversion) in Vietnam to be an exporter of product to regional markets. These products would be simple items that we
already make here, or a version of our imported concepts and categories at a reduced production costs and
improved profits margin.
Over time, this will change to include export of domestic concepts that are attractive
and interesting regionally, which may be self-branded Vietnamese meal
products and solutions that have broad appeal to regional and
global consumers.
KDc’S fuTure DOeS nOT Only reST in VieTnAM
AlOne. while The DOMeSTic MArKeT wiTh OVer 90 MilliOn
cOnSuMerS iS inTereSTing AnD ATTrAcTiVe fOr KDc,
There Are grOwing exTernAl ThreATS ThAT cOulD chAnge The BAlAnce Of DOMinAnce
in The DOMeSTic fOOD & BeVerAge SpAce.
Domestic
global/regional
concepts & c
atego
ries
meal solutions/low cost exports
ANNUAL REPORT 2014

channel StrategyKD
CDI
StrI
buto
rSre
taILe
rSCo
nSuM
erS
infrASTrucTure/plATfOrM
SAleS/MArKeTing
MArKeT
pAcKAgeD gOODS frOzen reTAil expOrT
The KDC platform will continue to be built upon and dictate our ability to distribute products. While the business model is consumer centric, our platform is about delivery and execution. The entire platform still centered around Strategic Business Units (SBU) which define the categories we compete in but broader than that, we are prioritizing our resources around our channels. These include four different primary distribution channels that are responsible for handling packaged foods, frozen/chilled products, retail and export. These channels currently cover all of Vietnam, and further than that will target to gain a larger foothold regionally and also globally in order to expand our market size and reach.
The KDc plATfOrM will cOnTinue TO Be BuilT upOn AnD DicTATe Our ABiliTy TO DiSTriBuTe prODucTS.
48 49Strategy
corporate Strategy
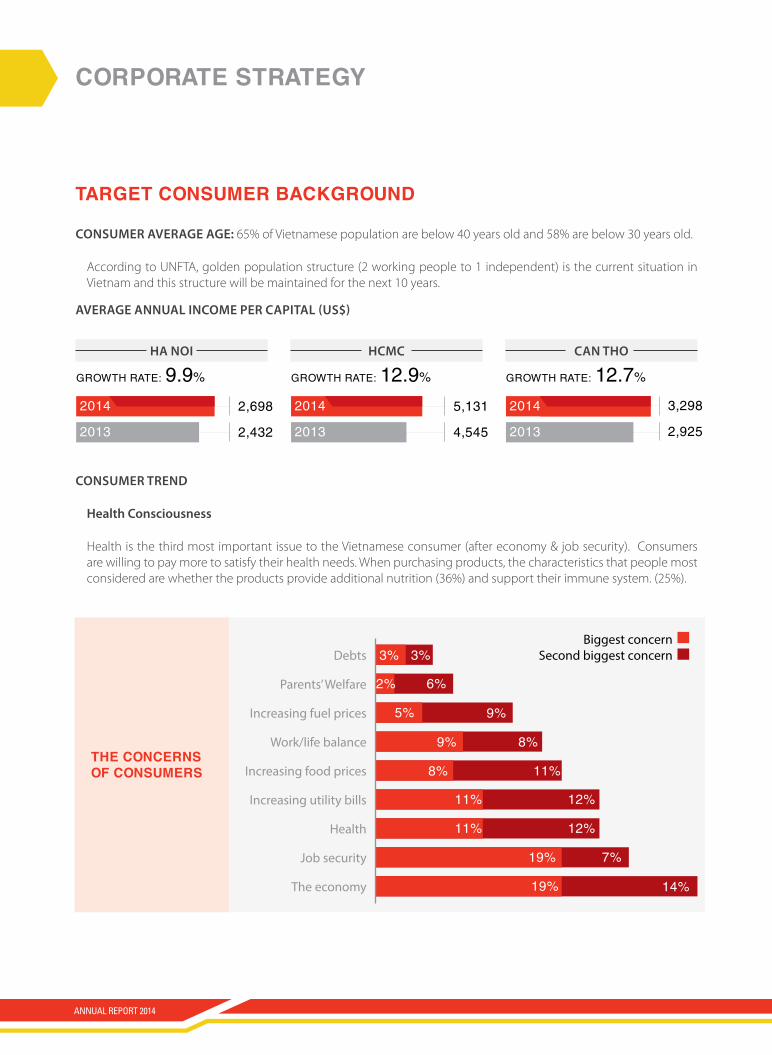
target conSumer BacKground
consumer aVerage age: 65% of Vietnamese population are below 40 years old and 58% are below 30 years old.
According to UNFTA, golden population structure (2 working people to 1 independent) is the current situation in Vietnam and this structure will be maintained for the next 10 years.
aVerage annuaL income Per caPiTaL (us$)
consumer TrenD
health consciousness
Health is the third most important issue to the Vietnamese consumer (after economy & job security). Consumers are willing to pay more to satisfy their health needs. When purchasing products, the characteristics that people most considered are whether the products provide additional nutrition (36%) and support their immune system. (25%).
ha noi hcmc can Tho
20142,698 5,131
2,432 4,5452013 2013 2013
GrOwth rate: 9.9% GrOwth rate: 12.9% GrOwth rate: 12.7%
3,298
2,925
Debts
parents’ welfare
increasing fuel prices
work/life balance
increasing food prices
increasing utility bills
health
Job security
The economy
3%
2%
5%
9%
8%
11%
11%
19%
19%
3%
6%
9%
8%
11%
12%
12%
7%
14%
the concernS of conSumerS
Biggest concern Second biggest concern
2014 2014
ANNUAL REPORT 2014
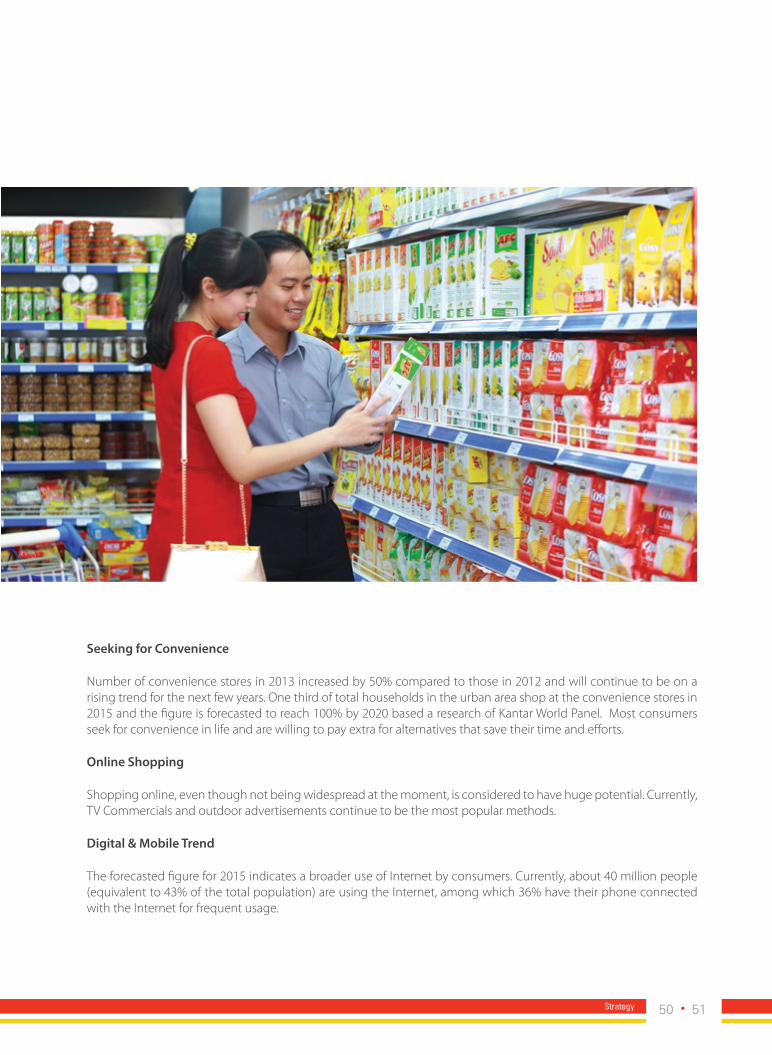
seeking for convenience
Number of convenience stores in 2013 increased by 50% compared to those in 2012 and will continue to be on a rising trend for the next few years. One third of total households in the urban area shop at the convenience stores in 2015 and the figure is forecasted to reach 100% by 2020 based a research of Kantar World Panel. Most consumers seek for convenience in life and are willing to pay extra for alternatives that save their time and efforts.
online shopping
Shopping online, even though not being widespread at the moment, is considered to have huge potential. Currently, TV Commercials and outdoor advertisements continue to be the most popular methods.
Digital & mobile Trend
The forecasted figure for 2015 indicates a broader use of Internet by consumers. Currently, about 40 million people (equivalent to 43% of the total population) are using the Internet, among which 36% have their phone connected with the Internet for frequent usage.
50 51Strategy

Leveraging the strength of our distribution network, Kinh Do has targeted the entry into
new categories including instant noodles, cooking oils, condiments, ice cream and milk.
The goal is to meet daily needs of the Vietnamese consumers.
21 years
LEADING POSITION in confectionery industry
Business Review
03
Diversify categories

fInancIal hIghlIghtS
(VnD’bil) 2013 2014 change % change
Sales 4,561 4,953 +392 +8.6%
Gross Profit 1,976 2,146 +169 +8.6%
Operating Expenses 1,393 1,632 +239 +17.2%
EBIT 584 514 -70 -11.9%
PBT 619 663 +44 +7.2%
NPAT 493 537 +44 +9.0%
Effective Tax Rate 20.3% 19.0% -1.3% -136 basis points
VND 2,146billion
VND 1,976billion
groSS profIt
VND 1,632billion
VND 1,393billion
operatIng eXpenSeS
2014
2013
VnD2,146 Billion | +8.6%
2014
2013
VnD1,632 Billion | +17.2%
ANNUAL REPORT 2014
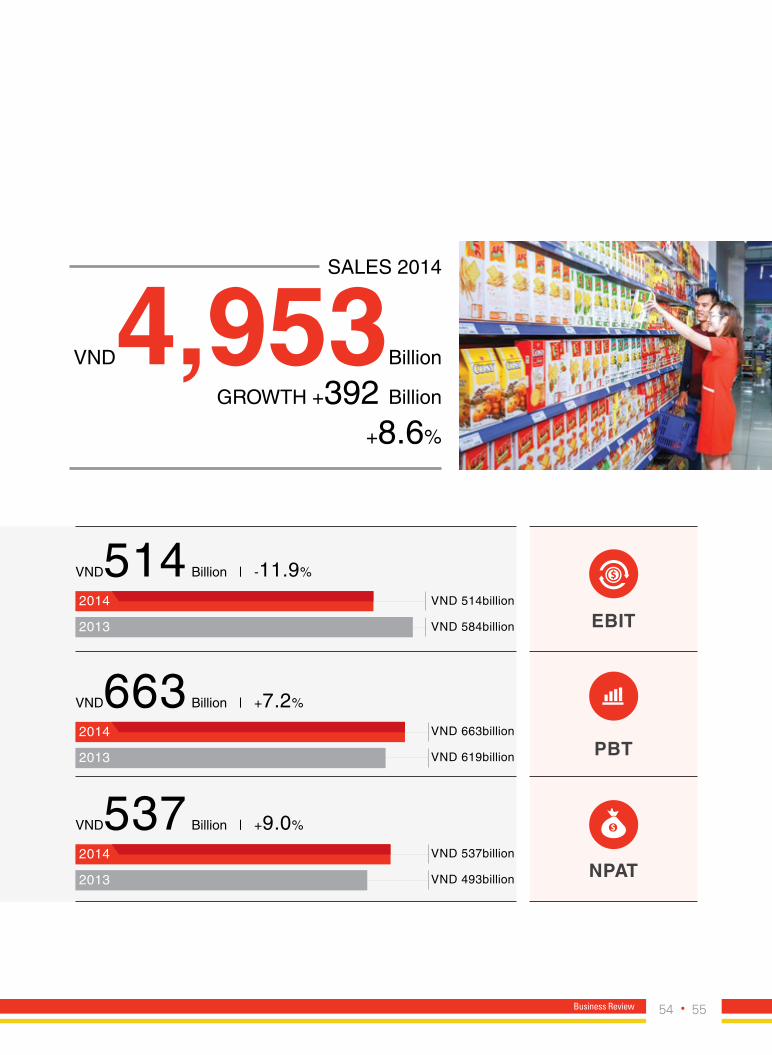
VnD4,953Billion
growth +392 Billion
+8.6%
saLes 2014
VND 514billion
VND 584billion eBIt
VND 663billion
VND 537billion
VND 619billion
VND 493billion
pBt
npat
2014
2013
VnD514 Billion | -11.9%
2014
2013
2014
2013
VnD663 Billion | +7.2%
VnD537 Billion | +9.0%
54 55Business Review
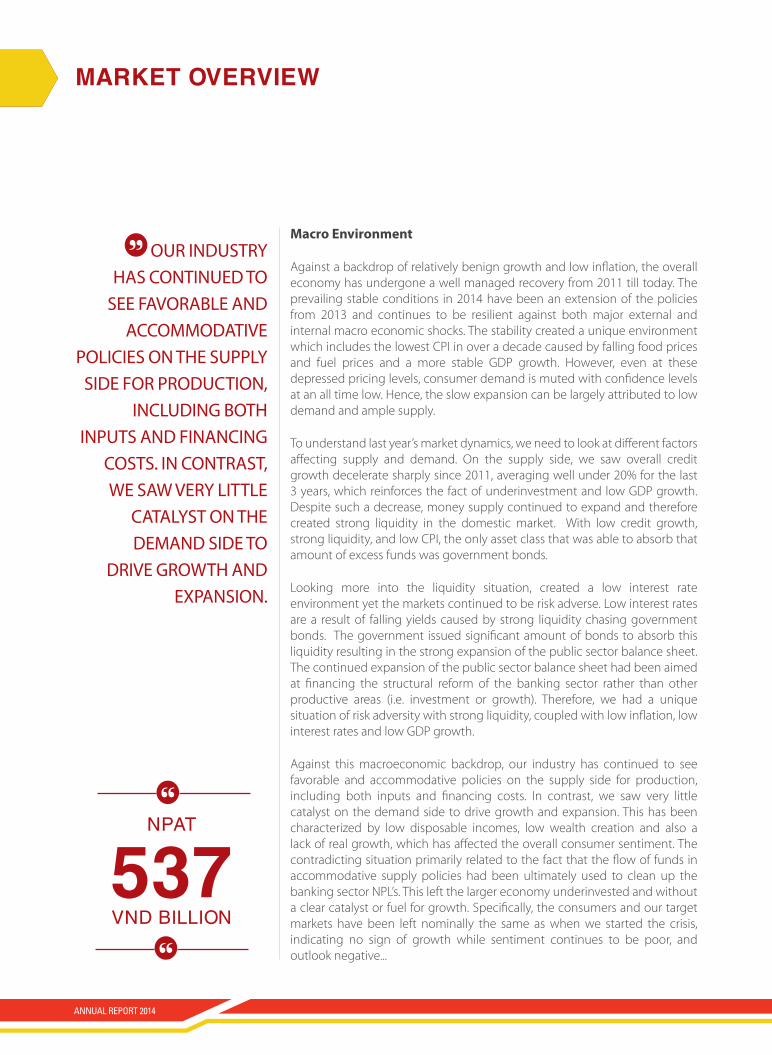
marKet overvIew
macro environment
Against a backdrop of relatively benign growth and low inflation, the overall economy has undergone a well managed recovery from 2011 till today. The prevailing stable conditions in 2014 have been an extension of the policies from 2013 and continues to be resilient against both major external and internal macro economic shocks. The stability created a unique environment which includes the lowest CPI in over a decade caused by falling food prices and fuel prices and a more stable GDP growth. However, even at these depressed pricing levels, consumer demand is muted with confidence levels at an all time low. Hence, the slow expansion can be largely attributed to low demand and ample supply.
To understand last year’s market dynamics, we need to look at different factors affecting supply and demand. On the supply side, we saw overall credit growth decelerate sharply since 2011, averaging well under 20% for the last 3 years, which reinforces the fact of underinvestment and low GDP growth. Despite such a decrease, money supply continued to expand and therefore created strong liquidity in the domestic market. With low credit growth, strong liquidity, and low CPI, the only asset class that was able to absorb that amount of excess funds was government bonds.
Looking more into the liquidity situation, created a low interest rate environment yet the markets continued to be risk adverse. Low interest rates are a result of falling yields caused by strong liquidity chasing government bonds. The government issued significant amount of bonds to absorb this liquidity resulting in the strong expansion of the public sector balance sheet. The continued expansion of the public sector balance sheet had been aimed at financing the structural reform of the banking sector rather than other productive areas (i.e. investment or growth). Therefore, we had a unique situation of risk adversity with strong liquidity, coupled with low inflation, low interest rates and low GDP growth.
Against this macroeconomic backdrop, our industry has continued to see favorable and accommodative policies on the supply side for production, including both inputs and financing costs. In contrast, we saw very little catalyst on the demand side to drive growth and expansion. This has been characterized by low disposable incomes, low wealth creation and also a lack of real growth, which has affected the overall consumer sentiment. The contradicting situation primarily related to the fact that the flow of funds in accommodative supply policies had been ultimately used to clean up the banking sector NPL’s. This left the larger economy underinvested and without a clear catalyst or fuel for growth. Specifically, the consumers and our target markets have been left nominally the same as when we started the crisis, indicating no sign of growth while sentiment continues to be poor, and outlook negative...
Our inDuSTry hAS cOnTinueD TO
See fAVOrABle AnD AccOMMODATiVe
pOlicieS On The Supply SiDe fOr prODucTiOn,
incluDing BOTh inpuTS AnD finAncing
cOSTS. in cOnTrAST, we SAw Very liTTle
cATAlyST On The DeMAnD SiDe TO
DriVe grOwTh AnD expAnSiOn.
Npat
537 VND BiLLiON
ANNUAL REPORT 2014

group reSultS
Performance
The fiscal year 2014 was an extension of the previous year strategy where we continued to focus our efforts on Stage 4 of our Transformative Change Strategy: Profitable Growth. The strategy proved to be resilient against the benign economic conditions and poor consumer sentiment. To be specific, the favorable supply conditions allowed us to continue monitizing on the restructuring of our value chain which we have divided into value conversion and value creation. This delineation has supported to focus and target our efforts to extract value and efficiency. Moreover, internal initiatives prevailed over implementing external ones such as advertising and promotions as poor consumer demand limited the effectiveness of external investments in the market.
Despite the lack of strong interest and demand and supply imbalances, we were able to increase net sales by 8.6% reaching VND4,953bn. Gross profit margins were on target at 43.0% with input prices remaining relatively stable across the board. Global commodity prices continued to be stable throughout 2014, which allowed for a significant decline in raw material price risk versus 2013. The primary cost increases were domestically driven, including labor, electricity and manufacturing overhead, which combined accounted for less than 15% of our total cost of goods sold;
limiting the impact of its increase. The sharp decline in oil prices in the last part of 2014 have yet to impact our raw material input costs, however this should positively impact our profitability by the 2nd or 3rd quarter of 2015 as the flow through from oil price declines begin to reach our suppliers of key commodities. Selling and general administrative costs were in line with revenue growth but it’s important to note that the construct of these costs have altered slightly.
During the course of 2014, we continued to rationalize and realign our process to create better quality earnings. Overall operating costs compared to 2013 has actually declined, and the actual increase of 17.2% was based on infrastructure investment that was designed for future capacity and capability, including the relocation of our corporate offices, building of additional warehouse capacity in the north, and investing in additional cold chain capacity. Sales and marketing costs increased by 21.8% year on year. The breakdown between variable and fixed costs are now approximately 48% vs. 52%. Variable costs consisting of advertising and promotion expenses, and fixed costs consisting of infrastructure costs. Advertising and promotional spending was well managed and reduced by VND70bn. Trade marketing activities increased by VND59bn and has been targeted at our core products to drive sales volume growth.
56 57Business Review

Overall, 2014 spending was well managed with variables directly in line with our growth and fixed at a managed rate that balanced the immediate impact and future growth. Sales infrastructure costs increased by 46.6%, within which the primarily is due to the regulated rise in salaries and wages as set out by the government in the early part of 2014. The additional increase was the result of sales incentives, which were paid out for successful achievement of volume targets.
Net operating profit was flat against 2013 and the difference primarily being a proactive approach to investing in infrastructure for future growth. This was balanced with an overall increase in profits before tax of VND 663bn, which was 7.2% better year-on-year. The savings from financing costs and reductions in debt were used to finance last year structural investment which helped to bring profits growth back in line with overall growth. Profit after taxes were 9.0% better reaching VND537bn, which was a direct result of active management over tax strategies, which helped to save approximately VND12bn in taxes paid against a higher pre-tax profit.
Overall, while there continued to be a lack of a strong catalyst to drive growth combined with strong headwinds in our industry, we maintained our performance with a defensive strategy. In a meantime, some of these challenges while manageable are believed to be structural across the entire confectionary industry. Therefore, a strategic review was undertaken to address longer term growth issues, resulting in strong shift in strategy that will see us expanding beyond snack & confectionary.
assets
Financial liquidity positions continued to be strong, with cash positions increasing from 2013 through a private placement in 2014, which was earmarked for several M&A projects. We are now becoming more aggressive in deployment as we believe that the current economic cycle is prime for investment entry as the market continues to be liquid but risk adverse. Since our first investment in Vinabico, we have continued this process with a strategic investment of 24% in Vocarimex, Vietnam’s largest edible oil company. Regarding this
marKet overvIew
free Cash fLOw
509 VND BiLLiON
ANNUAL REPORT 2014
investment, we have earmarked an addition VND700bn to increase our stake beyond 51%, which should be concluded by the end of 2015. Other investments relating to PP&E were kept minimal in 2014 as we continued to digest the CAPEX made during 2013.
liabilities
Our debt ratios remain fairly consistent with 2013’s debt-equity ratio of 0.25 times and an external gearing of 0.09 times. Taking advantage of the domestic liquidity and also as part of the cost reduction strategy, we fully repaid the more expensive long-term loans taken out in early 2014 with lower cost financing. This helped us to reduce average borrowing costs from 6.5% in 2013 to 4.1% in 2014. Even though we do not believe that our cost of borrowing can be reduced further, we continue to be bullish on the domestic liquidity and the current rate levels. Therefore, we continue to maintain shorter duration debt and do not foresee the need to swap funding further. We continue to actively monitor potential funding issues which could negatively impact these funding positions.
Working Capital
We continue to find efficiencies in our working capital management with a further reduction in our business cycle from 32.96 days to 31.93 days. The reduction was contributed primarily by reduction in inventory, which continued to be well managed and significantly improved by our Distributor Management System, which supported us to manage inventory levels throughout our supply chain.
return on equity & total Shareholder return
Return on equity was 8.6% vs. last year’s 10.09% but against a net increase of equity of approximately VND1,404bn due to the private placement. Excluding such impact, Return on Equity would have been 11.0%, which is close to where our commitment to shareholders has been. Regarding the positive financial highlights, it has been proven that we continued to be strongly committed to growth, profitability and returns and believed in maintain a relatively strong payout to shareholders.
GrOss prOfit
2,146 VND BiLLiON
58 59Business Review
Kdc Share prIce & StatIStIcS
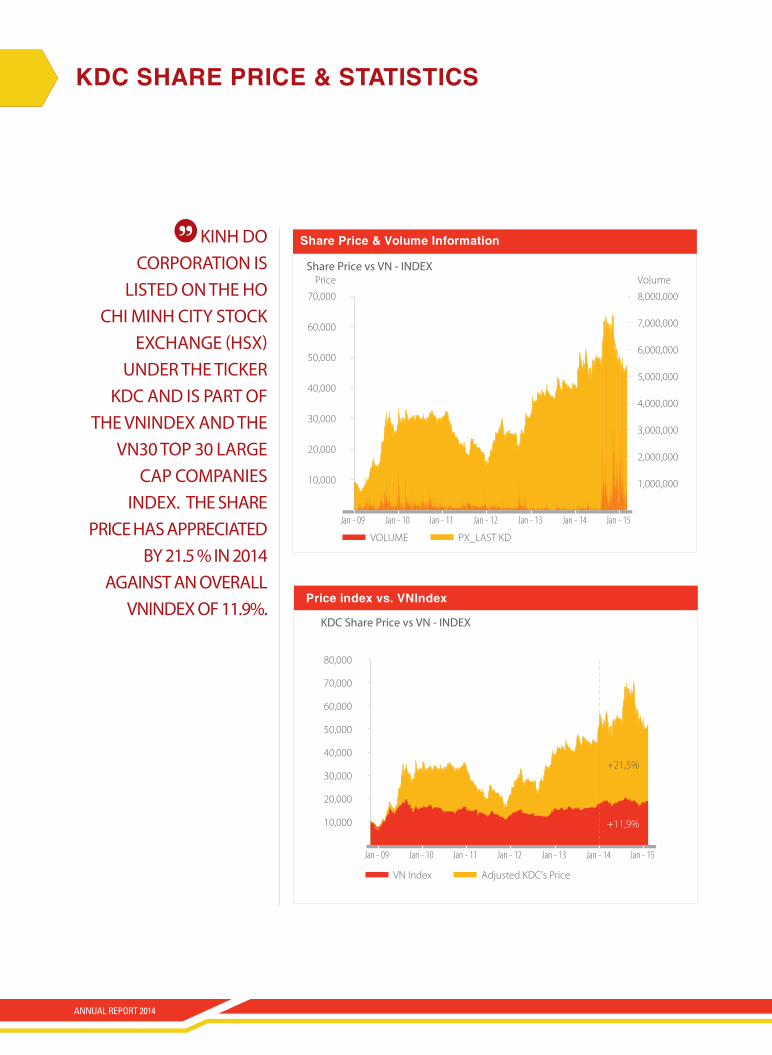
Kinh DO cOrpOrATiOn iS
liSTeD On The hO chi Minh ciTy STOcK
exchAnge (hSx) unDer The TicKer
KDc AnD iS pArT Of The VninDex AnD The
Vn30 TOp 30 lArge cAp cOMpAnieS
inDex. The ShAre price hAS AppreciATeD
By 21.5 % in 2014 AgAinST An OVerAll
VninDex Of 11.9%.
Share Price vs VN - INDEX
1,000,000
2,000,000
3,000,000
4,000,000
5,000,000
6,000,000
7,000,000
8,000,000
10,000
20,000
30,000
40,000
50,000
60,000
70,000
Price Volume
Jan - 09 Jan - 10 Jan - 11 Jan - 12 Jan - 13 Jan - 14 Jan - 15
VOLUME PX_LAST KD
Share Price & Volume Information
Price index vs. VNIndex
KDC Share Price vs VN - INDEX
10,000
20,000
30,000
40,000
50,000
60,000
70,000
+21,5%
+11,9%
80,000
VN Index Adjusted KDC’s Price
Jan - 09 Jan - 10 Jan - 11 Jan - 12 Jan - 13 Jan - 14 Jan - 15
ANNUAL REPORT 2014
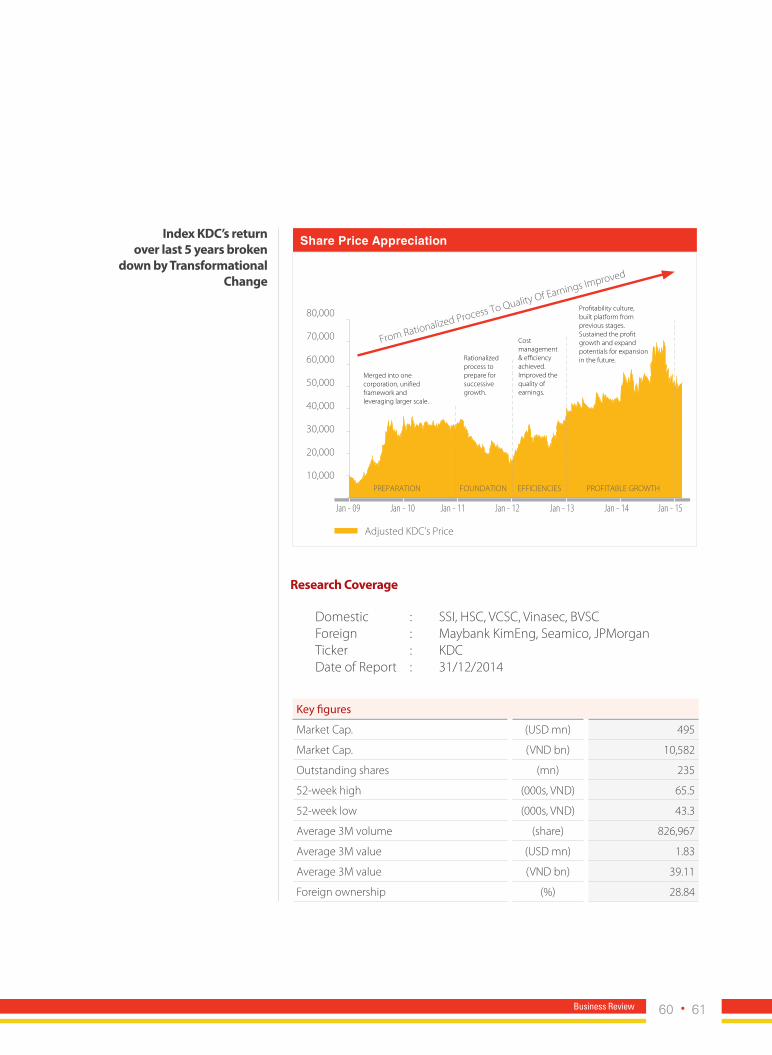
Domestic : SSI, HSC, VCSC, Vinasec, BVSCForeign : Maybank KimEng, Seamico, JPMorgan Ticker : KDCDate of Report : 31/12/2014
Index KDC’s return over last 5 years broken
down by transformational Change
Share Price Appreciation
Adjusted KDC’s Price
10,000
20,000
30,000
40,000
50,000
60,000
70,000
80,000
Jan - 09 Jan - 10 Jan - 11 Jan - 12 Jan - 13 Jan - 14 Jan - 15
From Rationalized Process To Quality Of Earnings Improved
Merged into one corporation, uni�ed framework and leveraging larger scale.
Rationalized process to prepare for successivegrowth.
Cost management & e�ciency achieved.Improved the quality of earnings.
Pro�tability culture, built platform fromprevious stages.Sustained the pro�tgrowth and expand potentials for expansion in the future.
PREPARATION FOUNDATION EFFICIENCIES PROFITABLE GROWTH
Key figures
Market Cap. (USD mn) 495
Market Cap. (VND bn) 10,582
Outstanding shares (mn) 235
52-week high (000s, VND) 65.5
52-week low (000s, VND) 43.3
Average 3M volume (share) 826,967
Average 3M value (USD mn) 1.83
Average 3M value (VND bn) 39.11
Foreign ownership (%) 28.84
research Coverage
60 61Business Review

Creating brands
Governance
Kinh Do is a company with a long history and development. To sustain the future growth and expansion, we have targeted to operate with a
clear corporate governance structure that facilitates transparency and accountability.
04WIN M&A
80 %

Creating brands
Governance
Kinh Do is a company with a long history and development. To sustain the future growth and expansion, we have targeted to operate with a
clear corporate governance structure that facilitates transparency and accountability.
04
WIN M&A
80 %

COrpOrate governance Structure
general meetIng oF ShareholDerS
InD
ePen
Den
t a
uD
Ito
r
BoarD oF DIreCtorSSuPervISory BoarD
cooperate
elect/Dismisspropose/ report
propose/ report
Audit
Audit
Appoint/Dismiss/Supervise
Deliberate/report
Deliberate/report
Deliberate/report
internal Audit
Delegate /execute
exeCutIve management CommIttee
StrategIC BuSIneSS DIreCtorS
CorPorate ComPanIeS(BuSIneSS unItS)Internal Control
Internal regulatIonS anD PolICIeS
ANNUAL REPORT 2014

Del
iber
ate/
repo
rt
Delegate /execute
SuB-CommIttee1. cOrpOrATe STrATegy2. riSK MAnAgeMenT3. DiSclOSure
TO enSure ThAT Our cOrpOrATe AcTiViTieS AnD iniTiATiVeS MeeT The
expecTATiOn Of DifferenT grOupS Of STAKehOlDerS AnD TO enABle uS TO
MeeT The DynAMicS Of A cOnSTAnTly chAnging BuSineSS enVirOnMenT, we
priOriTize The neeD TO enhAnce The cOrpOrATe gOVernAnce STrucTure
AnD AS A reSulT Our MAnAgeMenT cApABiliTy. ThiS will enABle uS TO
BuilD TruST ThrOugh TrAnSpArency AnD SOciAl reSpOnSiBiliTy wiTh Our
STAKehOlDerS.
64 65Governance
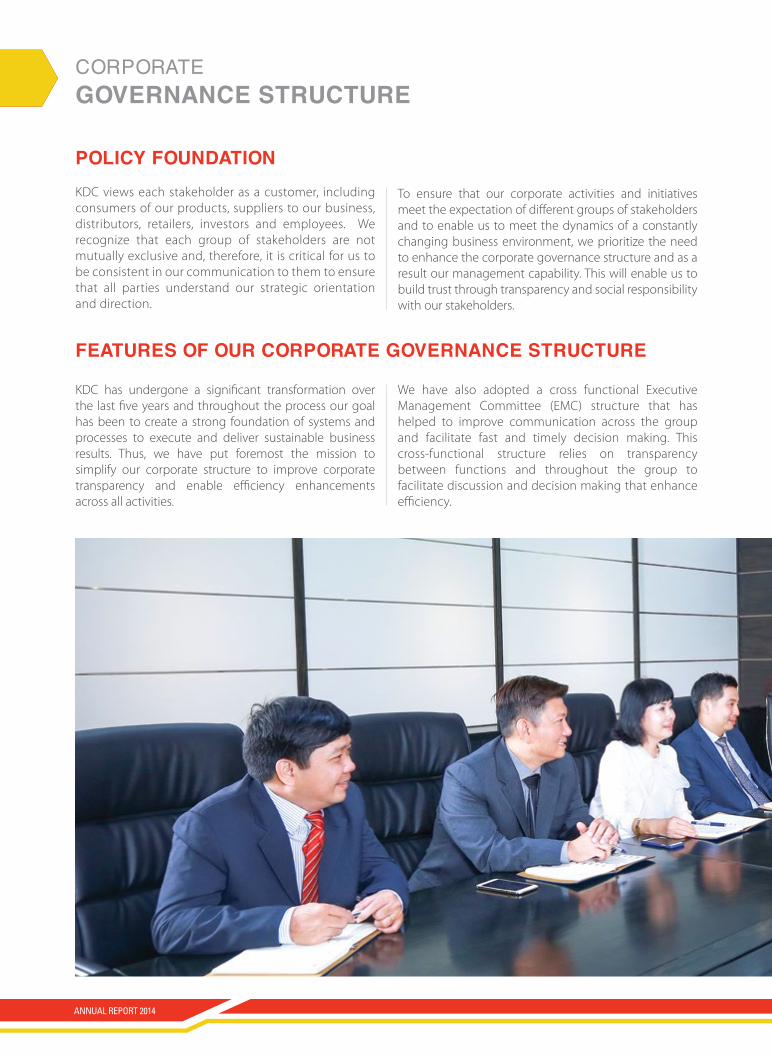
polIcy foundatIonKDC views each stakeholder as a customer, including consumers of our products, suppliers to our business, distributors, retailers, investors and employees. We recognize that each group of stakeholders are not mutually exclusive and, therefore, it is critical for us to be consistent in our communication to them to ensure that all parties understand our strategic orientation and direction.
featureS of our corporate governance Structure
To ensure that our corporate activities and initiatives meet the expectation of different groups of stakeholders and to enable us to meet the dynamics of a constantly changing business environment, we prioritize the need to enhance the corporate governance structure and as a result our management capability. This will enable us to build trust through transparency and social responsibility with our stakeholders.
KDC has undergone a significant transformation over the last five years and throughout the process our goal has been to create a strong foundation of systems and processes to execute and deliver sustainable business results. Thus, we have put foremost the mission to simplify our corporate structure to improve corporate transparency and enable efficiency enhancements across all activities.
We have also adopted a cross functional Executive Management Committee (EMC) structure that has helped to improve communication across the group and facilitate fast and timely decision making. This cross-functional structure relies on transparency between functions and throughout the group to facilitate discussion and decision making that enhance efficiency.
COrpOrate governance Structure
ANNUAL REPORT 2014
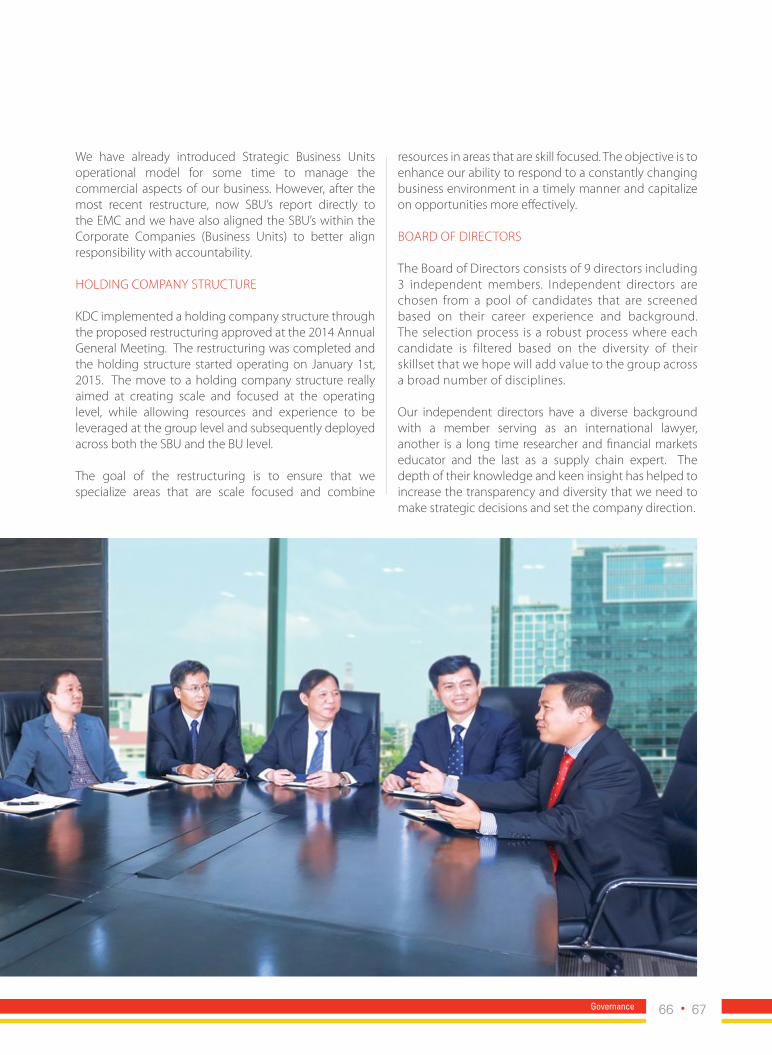
We have already introduced Strategic Business Units operational model for some time to manage the commercial aspects of our business. However, after the most recent restructure, now SBU’s report directly to the EMC and we have also aligned the SBU’s within the Corporate Companies (Business Units) to better align responsibility with accountability.
HOLDING COMPANY STRUCTURE
KDC implemented a holding company structure through the proposed restructuring approved at the 2014 Annual General Meeting. The restructuring was completed and the holding structure started operating on January 1st, 2015. The move to a holding company structure really aimed at creating scale and focused at the operating level, while allowing resources and experience to be leveraged at the group level and subsequently deployed across both the SBU and the BU level.
The goal of the restructuring is to ensure that we specialize areas that are scale focused and combine
resources in areas that are skill focused. The objective is to enhance our ability to respond to a constantly changing business environment in a timely manner and capitalize on opportunities more effectively.
BOARD OF DIRECTORS
The Board of Directors consists of 9 directors including 3 independent members. Independent directors are chosen from a pool of candidates that are screened based on their career experience and background. The selection process is a robust process where each candidate is filtered based on the diversity of their skillset that we hope will add value to the group across a broad number of disciplines.
Our independent directors have a diverse background with a member serving as an international lawyer, another is a long time researcher and financial markets educator and the last as a supply chain expert. The depth of their knowledge and keen insight has helped to increase the transparency and diversity that we need to make strategic decisions and set the company direction.
66 67Governance
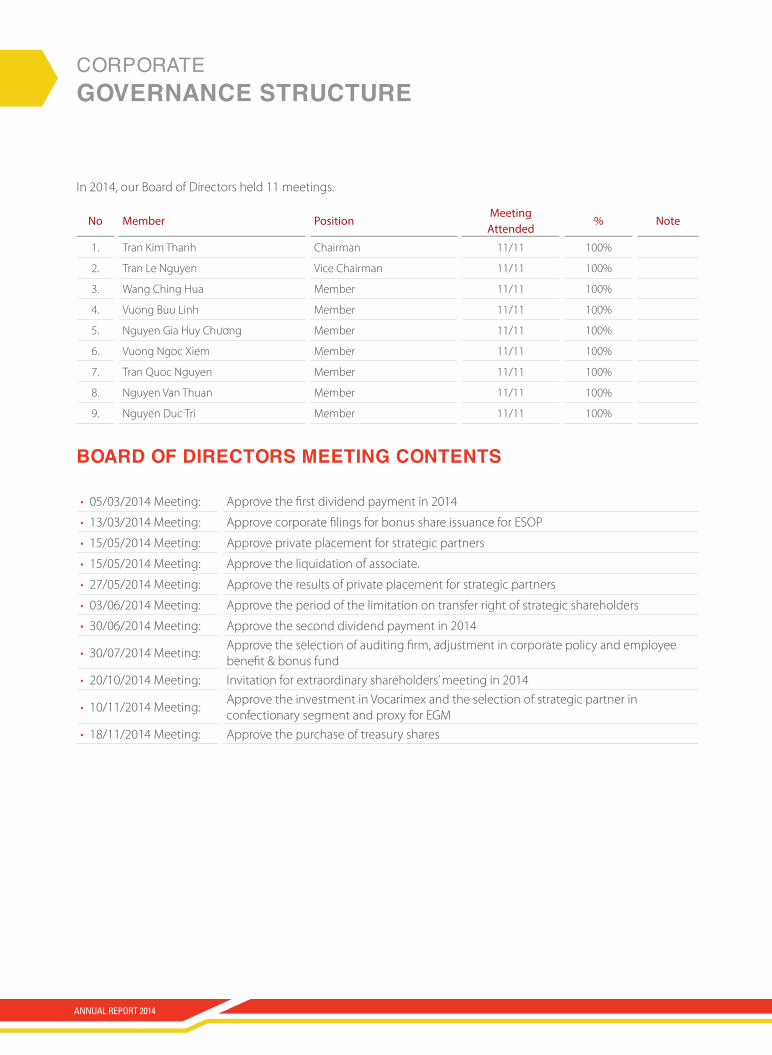
COrpOrate governance Structure
In 2014, our Board of Directors held 11 meetings.
no Member positionMeeting
Attended% note
1. Tran Kim Thanh Chairman 11/11 100%
2. Tran Le Nguyen Vice Chairman 11/11 100%
3. Wang Ching Hua Member 11/11 100%
4. Vuong Buu Linh Member 11/11 100%
5. Nguyen Gia Huy Chương Member 11/11 100%
6. Vuong Ngoc Xiem Member 11/11 100%
7. Tran Quoc Nguyen Member 11/11 100%
8. Nguyen Van Thuan Member 11/11 100%
9. Nguyen Duc Tri Member 11/11 100%
Board of dIrectorS meetIng contentS
• 05/03/2014 Meeting: Approve the first dividend payment in 2014
• 13/03/2014 Meeting: Approve corporate filings for bonus share issuance for ESOP
• 15/05/2014 Meeting: Approve private placement for strategic partners
• 15/05/2014 Meeting: Approve the liquidation of associate.
• 27/05/2014 Meeting: Approve the results of private placement for strategic partners
• 03/06/2014 Meeting: Approve the period of the limitation on transfer right of strategic shareholders
• 30/06/2014 Meeting: Approve the second dividend payment in 2014
• 30/07/2014 Meeting:Approve the selection of auditing firm, adjustment in corporate policy and employee benefit & bonus fund
• 20/10/2014 Meeting: Invitation for extraordinary shareholders’ meeting in 2014
• 10/11/2014 Meeting:Approve the investment in Vocarimex and the selection of strategic partner in confectionary segment and proxy for EGM
• 18/11/2014 Meeting: Approve the purchase of treasury shares
ANNUAL REPORT 2014
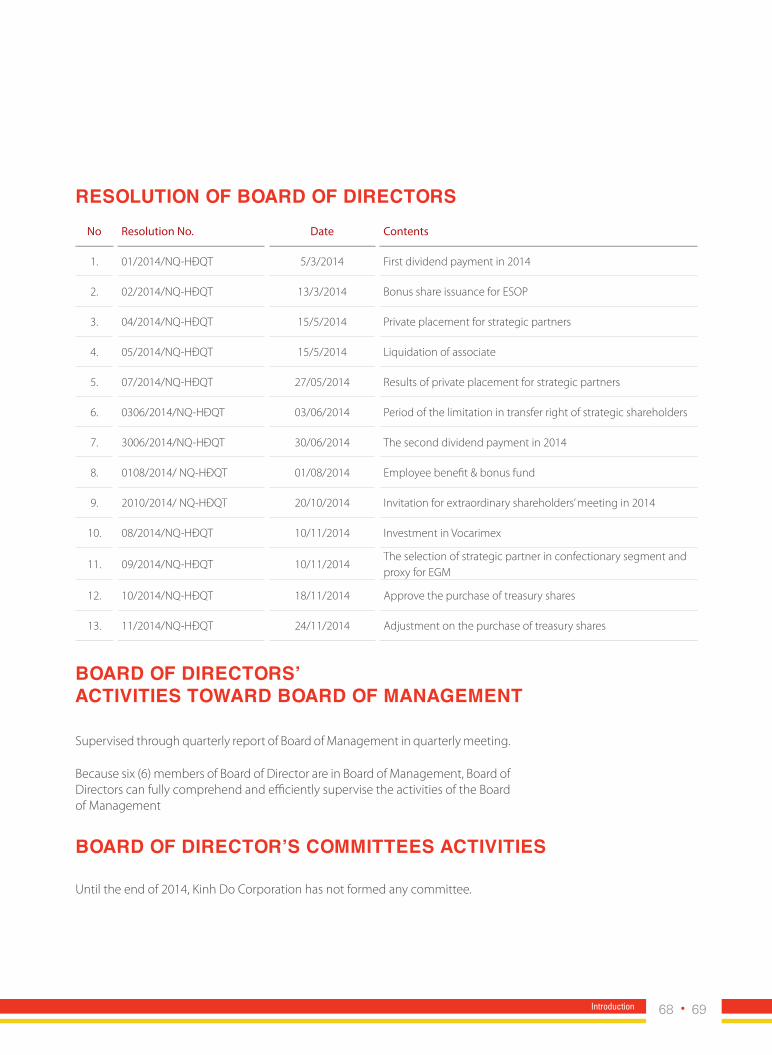
Board of dIrectorS’ actIvItIeS toward Board of management
Board of dIrector’S commItteeS actIvItIeS
Supervised through quarterly report of Board of Management in quarterly meeting.
Because six (6) members of Board of Director are in Board of Management, Board of Directors can fully comprehend and efficiently supervise the activities of the Board of Management
Until the end of 2014, Kinh Do Corporation has not formed any committee.
reSolutIon of Board of dIrectorSno resolution no. Date contents
1. 01/2014/NQ-HĐQT 5/3/2014 First dividend payment in 2014
2. 02/2014/NQ-HĐQT 13/3/2014 Bonus share issuance for ESOP
3. 04/2014/NQ-HĐQT 15/5/2014 Private placement for strategic partners
4. 05/2014/NQ-HĐQT 15/5/2014 Liquidation of associate
5. 07/2014/NQ-HĐQT 27/05/2014 Results of private placement for strategic partners
6. 0306/2014/NQ-HĐQT 03/06/2014 Period of the limitation in transfer right of strategic shareholders
7. 3006/2014/NQ-HĐQT 30/06/2014 The second dividend payment in 2014
8. 0108/2014/ NQ-HĐQT 01/08/2014 Employee benefit & bonus fund
9. 2010/2014/ NQ-HĐQT 20/10/2014 Invitation for extraordinary shareholders’ meeting in 2014
10. 08/2014/NQ-HĐQT 10/11/2014 Investment in Vocarimex
11. 09/2014/NQ-HĐQT 10/11/2014The selection of strategic partner in confectionary segment and proxy for EGM
12. 10/2014/NQ-HĐQT 18/11/2014 Approve the purchase of treasury shares
13. 11/2014/NQ-HĐQT 24/11/2014 Adjustment on the purchase of treasury shares
68 69Introduction
The eMc leVerAge Their DiVerSe BAcKgrOunDS AnD experience TO DiScuSS AnD DeliBerATe On iSSueS ThAT
Are AffecTing The enTire cOMpAny AnD MAKe TiMely DeciSiOnS TO execuTe OperATiOnS.
COrpOrate governance Structure
ANNUAL REPORT 2014
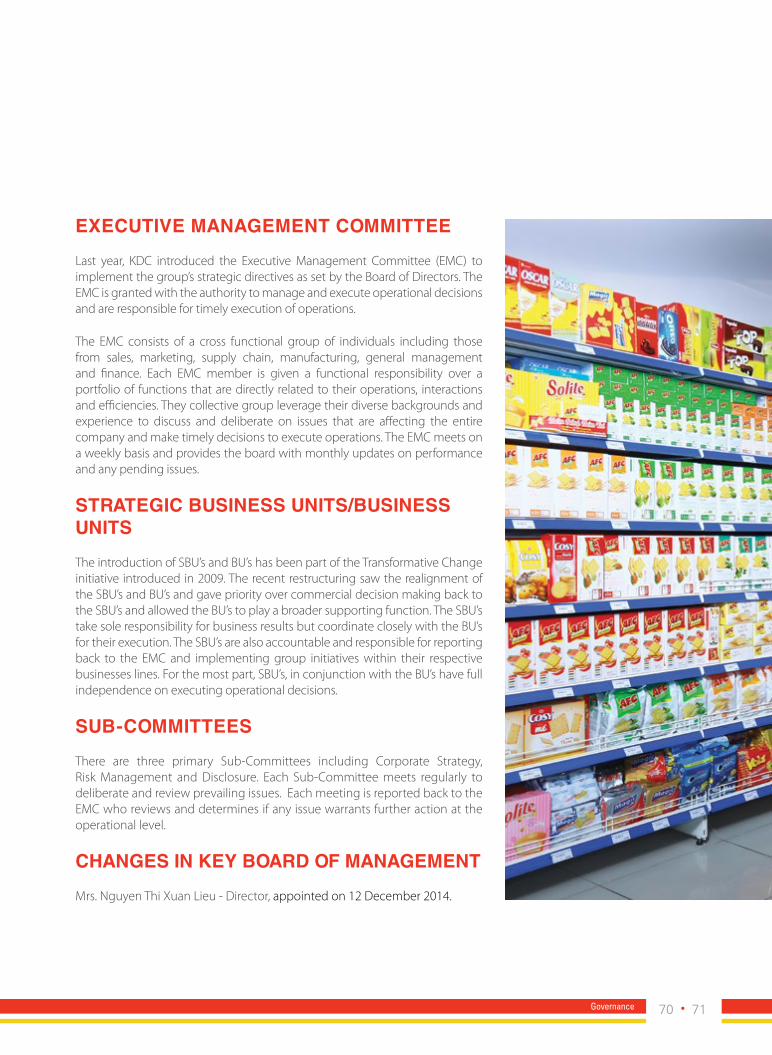
eXecutIve management commItteeLast year, KDC introduced the Executive Management Committee (EMC) to implement the group’s strategic directives as set by the Board of Directors. The EMC is granted with the authority to manage and execute operational decisions and are responsible for timely execution of operations.
The EMC consists of a cross functional group of individuals including those from sales, marketing, supply chain, manufacturing, general management and finance. Each EMC member is given a functional responsibility over a portfolio of functions that are directly related to their operations, interactions and efficiencies. They collective group leverage their diverse backgrounds and experience to discuss and deliberate on issues that are affecting the entire company and make timely decisions to execute operations. The EMC meets on a weekly basis and provides the board with monthly updates on performance and any pending issues.
StrategIc BuSIneSS unItS/BuSIneSS unItSThe introduction of SBU’s and BU’s has been part of the Transformative Change initiative introduced in 2009. The recent restructuring saw the realignment of the SBU’s and BU’s and gave priority over commercial decision making back to the SBU’s and allowed the BU’s to play a broader supporting function. The SBU’s take sole responsibility for business results but coordinate closely with the BU’s for their execution. The SBU’s are also accountable and responsible for reporting back to the EMC and implementing group initiatives within their respective businesses lines. For the most part, SBU’s, in conjunction with the BU’s have full independence on executing operational decisions.
SuB-commItteeSThere are three primary Sub-Committees including Corporate Strategy, Risk Management and Disclosure. Each Sub-Committee meets regularly to deliberate and review prevailing issues. Each meeting is reported back to the EMC who reviews and determines if any issue warrants further action at the operational level.
changeS In Key Board of managementMrs. Nguyen Thi Xuan Lieu - Director, appointed on 12 December 2014.
70 71Governance
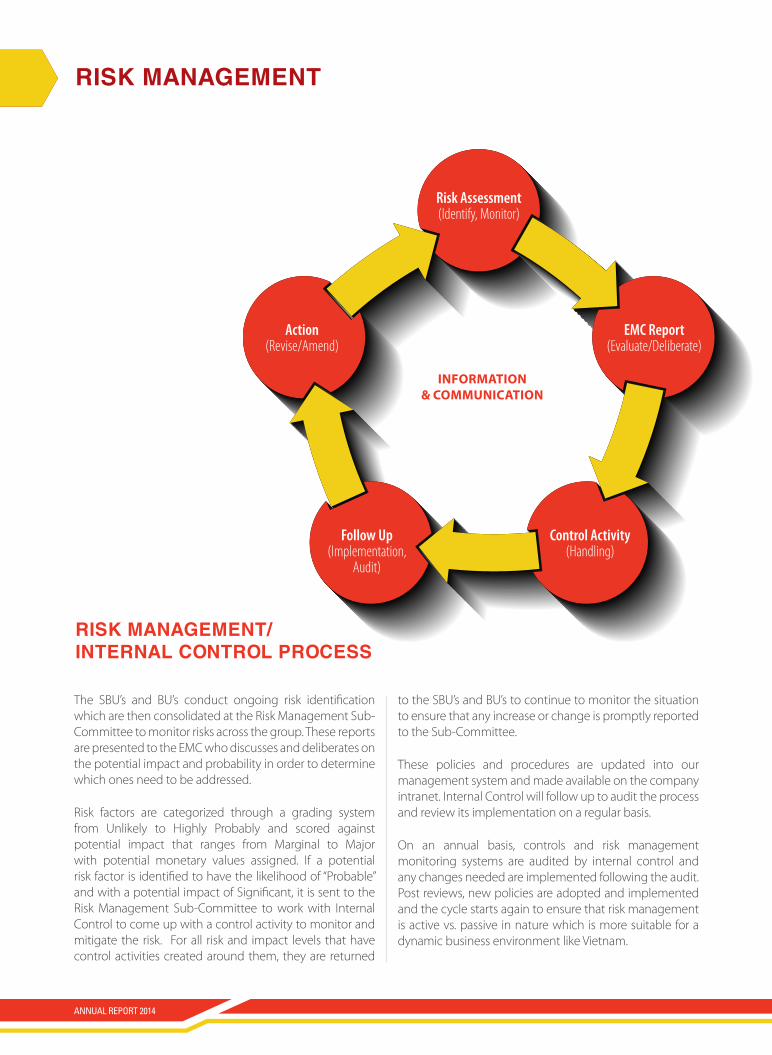
rISK management/ Internal control proceSS
The SBU’s and BU’s conduct ongoing risk identification which are then consolidated at the Risk Management Sub-Committee to monitor risks across the group. These reports are presented to the EMC who discusses and deliberates on the potential impact and probability in order to determine which ones need to be addressed.
Risk factors are categorized through a grading system from Unlikely to Highly Probably and scored against potential impact that ranges from Marginal to Major with potential monetary values assigned. If a potential risk factor is identified to have the likelihood of “Probable” and with a potential impact of Significant, it is sent to the Risk Management Sub-Committee to work with Internal Control to come up with a control activity to monitor and mitigate the risk. For all risk and impact levels that have control activities created around them, they are returned
to the SBU’s and BU’s to continue to monitor the situation to ensure that any increase or change is promptly reported to the Sub-Committee.
These policies and procedures are updated into our management system and made available on the company intranet. Internal Control will follow up to audit the process and review its implementation on a regular basis.
On an annual basis, controls and risk management monitoring systems are audited by internal control and any changes needed are implemented following the audit. Post reviews, new policies are adopted and implemented and the cycle starts again to ensure that risk management is active vs. passive in nature which is more suitable for a dynamic business environment like Vietnam.
risk assessment(Identify, Monitor)
Emc report (Evaluate/Deliberate)
action(Revise/Amend)
control activity (Handling)
Follow up (Implementation,
Audit)
InFormatIon & CommunICatIon
rISK management
ANNUAL REPORT 2014
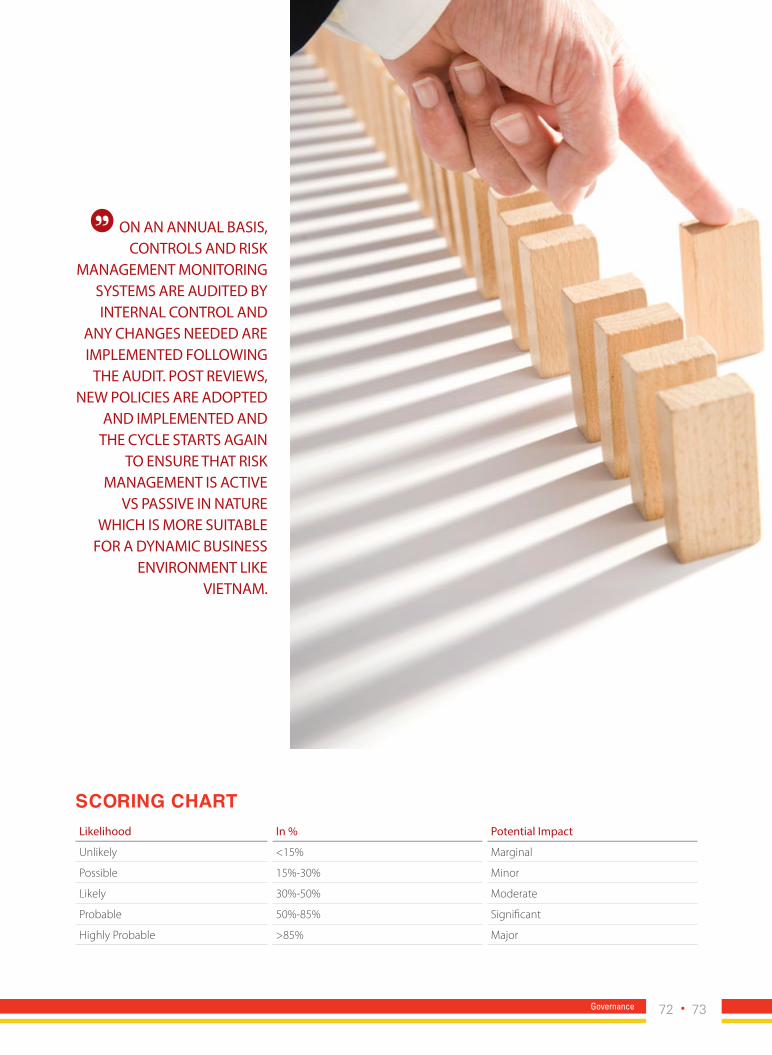
On An AnnuAl BASiS, cOnTrOlS AnD riSK
MAnAgeMenT MOniTOring SySTeMS Are AuDiTeD By inTernAl cOnTrOl AnD
Any chAngeS neeDeD Are iMpleMenTeD fOllOwing
The AuDiT. pOST reViewS, new pOlicieS Are ADOpTeD
AnD iMpleMenTeD AnD The cycle STArTS AgAin
TO enSure ThAT riSK MAnAgeMenT iS AcTiVe
VS pASSiVe in nATure which iS MOre SuiTABle
fOr A DynAMic BuSineSS enVirOnMenT liKe
VieTnAM.
ScorIng chartlikelihood in % potential impact
Unlikely <15% Marginal
Possible 15%-30% Minor
Likely 30%-50% Moderate
Probable 50%-85% Significant
Highly Probable >85% Major
72 73Governance

corporate risk overview
STrATegic riSKS
Macro-economic, socio-political and regulatory risks
Growth in the consumer goods space (particularly in the food and beverage category) is highly dependent on consumer spending, sentiment and confidence. Economic downturns and socio-political issues negatively impact consumer spending as individuals reduce discretionary spending. KDC monitors the regional economic and socio-political environment closes to anticipate changes in consumer sentiment. We also maintain conservative policies in product purchasing, working capital management and cost controls to ensure sensitivity to demand changes are minimized.
Dependency Risk
Risk associated with a dependence on a particular supplier, customer, business partner or product. An over reliance on a particular supplier, customer or product makes KDC vulnerable to sales reductions and margin pressures. To mitigate this risk, KDC works with a broad network of suppliers both domestically and internationally to ensure not only stability in the supply chain but also the best quality. KDC manages the distribution network in the same manner, ensuring that no one customer in any geography is over 10% of our total sales volume.
Execution Risk
The recent shift of KDC’s strategic direction has the potential to increase execution risk as we add new products and also processes to deliver those products to market. The mitigation here is that we have created a robust platform that we believe has the ability to plug and play. In addition, the strength and loyalty of our networks has given us the ability to minimize the execution risk in and around new product/category launches.
Consumer Demand Risk
Being able to anticipate changes in consumer sentiment and demand is a critical success factor and failure to do so represents a significant risk to KDC. In order to mitigate this, KDC leverages its Value Creation process in order to proactively manage the feedback process in order to minimize the risk of consumer demand risk.
Key rISK factorS
ANNUAL REPORT 2014

OperATiOnAl riSKS
Customer Relationship Risk
Having strong retailer and distributor relationships is a critical success factor for ensuring product reach, penetration and sales growth. Failure to maintain these relationships represents a potential risk factor to KDC and in order to mitigate this, we are committed to delivering outstanding customer service which is supported by our technological infrastructure that enables us to connect closer to our value chain downstream. This includes the ability to monitor inventory levels, sales process, and also consumer feedback; creating a robust system that enhances customer relationships.
Volatility of Raw Material Prices
Changes in raw material prices pose a significant risk to our profitability and margins. In order to mitigate this risk, we share the responsibility of managing this risk with our suppliers. We provide them with a clear forward looking materials demand plan and secure fixed pricing for a period of time in order to have stability and certainty in our production costs.
OperATiOnAl riSKS
Currency Risks
Currency risks are a direct result of our foreign exchange inflows and also foreign exchange denominated borrowing. To the extent possible, we ensure a natural hedge to ensure that the inflows are sufficient to cover the outflows of US dollar in order to mitigate the currency risks.
Financing and Liquidity Risks
Changes in the global and regional financial markets may have a significant impact on interest rates, which may lead to risks associated to profitability, liquidity and financing. In order to mitigate this risk, we actively monitor the markets and also the duration of our debt positions to ensure that we have enough cash flows and cash balances to meet our obligations. In the event that markets contract and liquidity is scarce, causing rates to rise, we reduce our debt positions using our cash balances and supplement working capital financing with cash on hand.
74 75Governance

COrpOrate SocIal reSponSIBIlIty
ANNUAL REPORT 2014
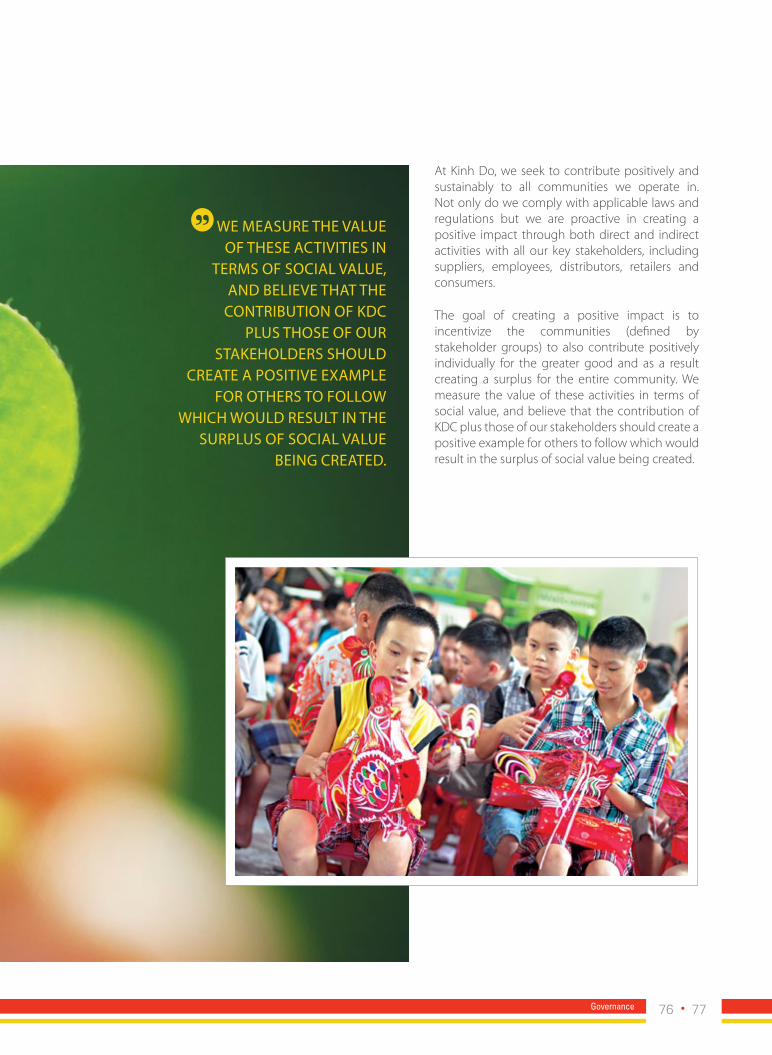
we MeASure The VAlue Of TheSe AcTiViTieS in
TerMS Of SOciAl VAlue, AnD BelieVe ThAT The
cOnTriBuTiOn Of KDc pluS ThOSe Of Our
STAKehOlDerS ShOulD creATe A pOSiTiVe exAMple
fOr OTherS TO fOllOw which wOulD reSulT in The
SurpluS Of SOciAl VAlue Being creATeD.
At Kinh Do, we seek to contribute positively and sustainably to all communities we operate in. Not only do we comply with applicable laws and regulations but we are proactive in creating a positive impact through both direct and indirect activities with all our key stakeholders, including suppliers, employees, distributors, retailers and consumers.
The goal of creating a positive impact is to incentivize the communities (defined by stakeholder groups) to also contribute positively individually for the greater good and as a result creating a surplus for the entire community. We measure the value of these activities in terms of social value, and believe that the contribution of KDC plus those of our stakeholders should create a positive example for others to follow which would result in the surplus of social value being created.
76 77Governance

COrpOrate SocIal reSponSIBIlIty
• Aggregate of direct and indirect initiatives on society overall that create value.
• Surplus of value created by initiatives and projects undertaken by the larger community that create social value.
• Direct initiatives targeted at employees that have a positive impact on our internal community by creating social value.
• Intiatives and projects aimed at our external stakeholders that indirectly create social value.
Social valuE
EmPloyEES
community
ANNUAL REPORT 2014
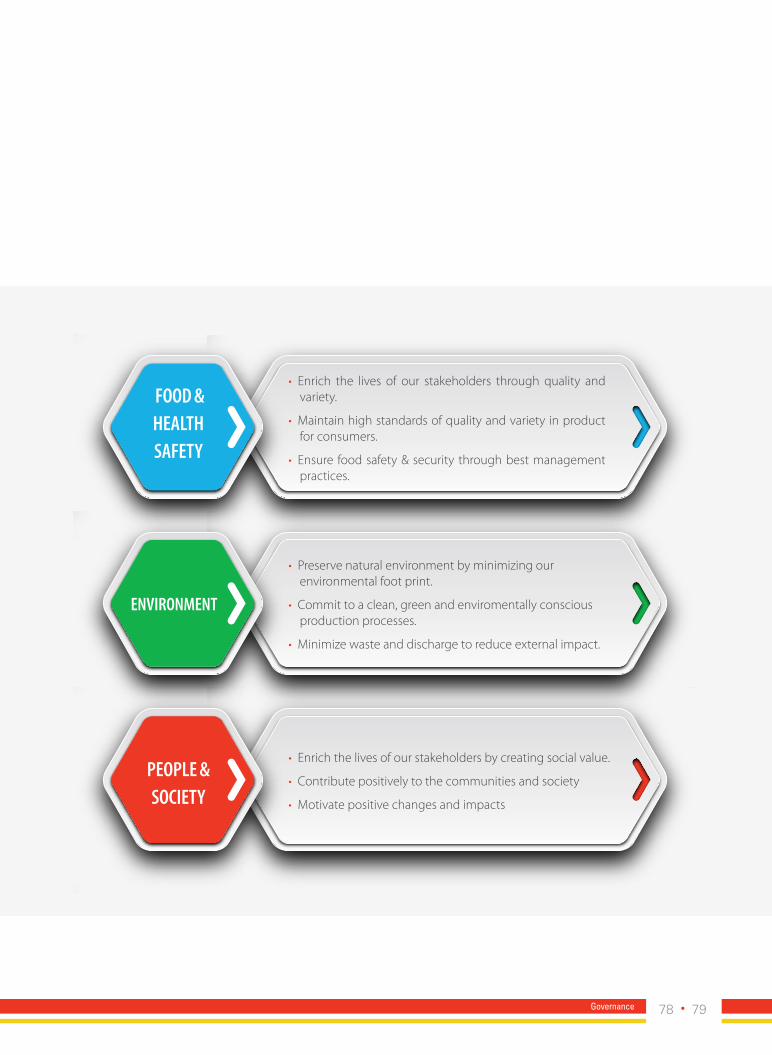
• Enrich the lives of our stakeholders through quality and variety.
• Maintain high standards of quality and variety in product for consumers.
• Ensure food safety & security through best management practices.
• Enrich the lives of our stakeholders by creating social value.
• Contribute positively to the communities and society
• Motivate positive changes and impacts
• Preserve natural environment by minimizing our environmental foot print.
• Commit to a clean, green and enviromentally conscious production processes.
• Minimize waste and discharge to reduce external impact.
Food & hEalth SaFEty
PEoPlE & SociEty
EnvironmEnt
78 79Governance

COrpOrate SocIal reSponSIBIlIty
ANNUAL REPORT 2014

80 81Governance

Expanding reach
Audited Report
05
Kinh Do's export markets
35 countries
Increasing our target markets through partnerships and alliances with the goal
of having our products reach the world.
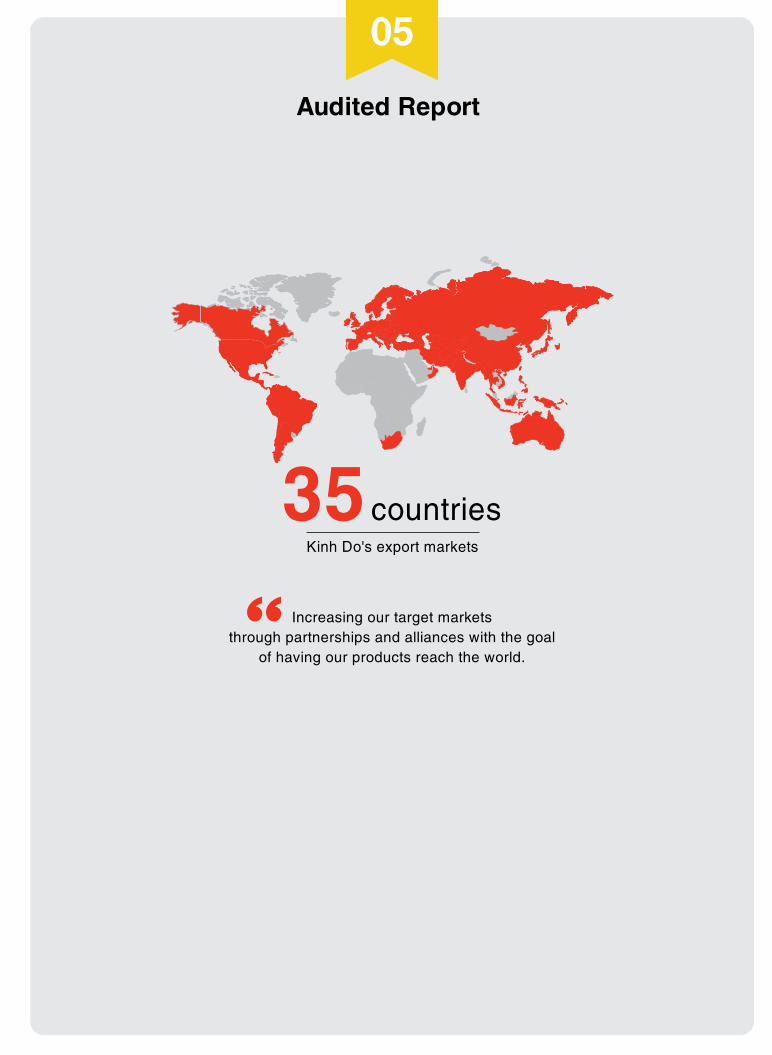
Expanding reach
Audited Report
05
Kinh Do's export markets
35 countries
Increasing our target markets through partnerships and alliances with the goal
of having our products reach the world.
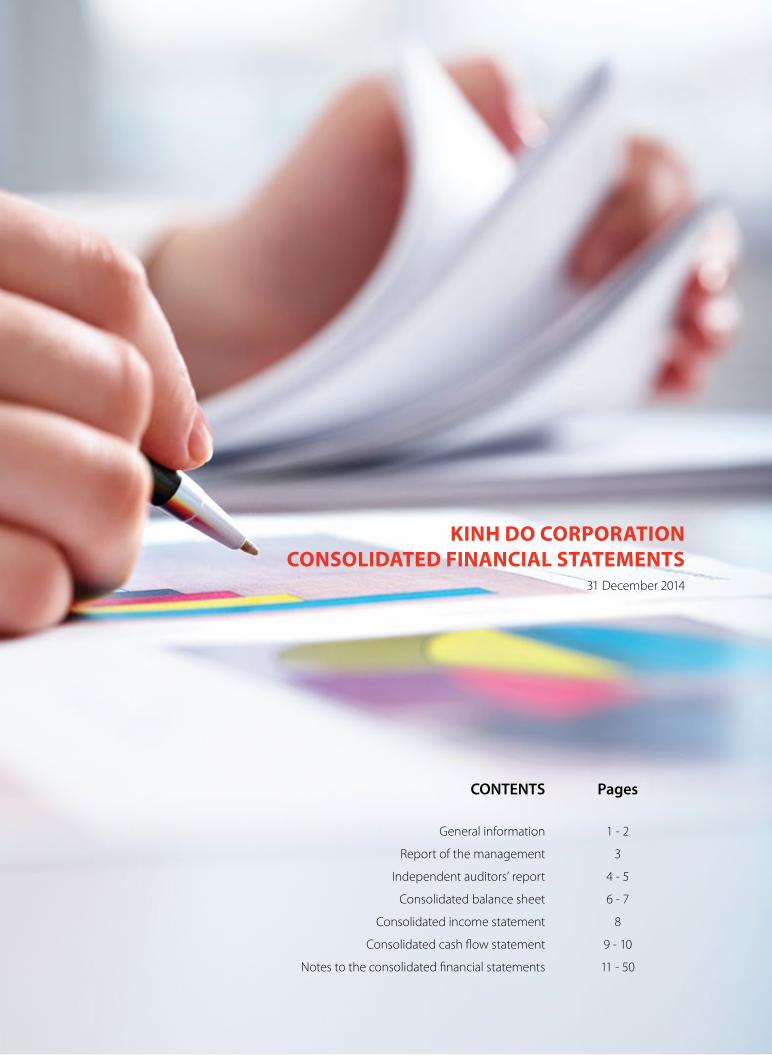
ANNUAL REPORT 2014
KInh Do CorPoratIon ConSolIDateD FInanCIal StatementS
31 December 2014
conTenTs Pages
General information 1 - 2
Report of the management 3
Independent auditors’ report 4 - 5
Consolidated balance sheet 6 - 7
Consolidated income statement 8
Consolidated cash flow statement 9 - 10
Notes to the consolidated financial statements 11 - 50

Audited Report 84 85
generAl infOrMATiOn
The cOMpAny
Kinh Do Corporation (“the Company”) is a shareholding company incorporated under the Law on Enterprise of Vietnam pursuant to the Business Registration Certificate (“BRC”) No. 4103001184 issued by the Department of Planning and Investment (“DPI”) of Ho Chi Minh City on 6 September 2002 and the following amended BRC:
amended Brc: Date:No. 4103001184The first amendment 26 November 2002The second amendment 22 September 2003The third amendment 11 December 2003The fourth amendment 3 August 2004The fifth amendment 7 October 2004The sixth amendment 11 May 2005The seventh amendment 18 May 2006The eighth amendment 6 July 2006The ninth amendment 6 November 2007The tenth amendment 10 October 2008No. 0302705302The eleventh amendment 21 January 2010The twelfth amendment 1 November 2010The thirteenth amendment 26 March 2011The fourteenth amendment 2 March 2012The fifteenth amendment 23 November 2012The sixteenth amendment 21 March 2013The seventeenth amendment 2 April 2013The eighteenth amendment 18 November 2013The nineteenth amendment 26 February 2015
The Company’s shares were listed on the Ho Chi Minh Stock Exchange in accordance with the License No. 39/UBCK-GPNY issued by the State Securities Commission on 18 November 2005.
The principal activities of the Company are to process agricultural products and foods; produce confectionery, purified water, and fruit juice; and sell and purchase agricultural products and foods, industrial products, and fabric; to produce and trade all kinds of food and drink products such as ice, ice cream, milk and other dairy products; to operate in real estate industry.
The registered head office of the Company is located at 138 - 142 Hai Ba Trung, Da Kao Ward, District 1, Ho Chi Minh City, Vietnam.
BOArD Of DirecTOrS
Members of the Board of Directors during the year and at the date of this report are:
Mr Tran Kim Thanh Chairman
Mr Tran Le Nguyen Vice Chairman
Mr Wang Ching Hua Member
Ms Vuong Buu Linh Member
Ms Vuong Ngoc Xiem Member
Mr Tran Quoc Nguyen Member
Mr Nguyen Van Thuan Member
Mr Nguyen Gia Huy Chuong Member
Mr Nguyen Duc Tri Member

ANNUAL REPORT 2014
BOArD Of SuperViSiOn
Members of the Board of Supervision during the year and at the date of this report are:
Mr Le Cao Thuan Head
Ms Luong My Duyen Member
Mr Vo Long Nguyen Member
MAnAgeMenT
Members of the management during the year and at the date of this report are:
Mr Tran Le Nguyen General Director
Ms Vuong Buu Linh Deputy General Director
Ms Vuong Ngoc Xiem Deputy General Director
Mr Wang Ching Hua Deputy General Director
Mr Nguyen Xuan Luan Deputy General Director
Mr Mai Xuan Tram Deputy General Director
Mr Bui Thanh Tung Deputy General Director
Mr Tran Quoc Nguyen Deputy General Director
Mr Tran Quoc Viet Deputy General Director
Mr Tran Tien Hoang Deputy General Director
Mr Kelly Yin Hon Wong Deputy General Director
Mr Ma Thanh Danh Deputy General Director
Ms Nguyen Thi Xuan Lieu Deputy General Director appointed on 12 December 2014
legAl repreSenTATiVe
The legal representative of the Company during the year and at the date of this report is Mr Tran Kim Thanh. Mr Tran Le Nguyen is authorized by Mr Tran Kim Thanh to sign the consolidated financial statements for the year ended 31 December 2014.
AuDiTOrS
The auditor of the Company is Ernst & Young Vietnam Limited.
generAl infOrMATiOn (continued)
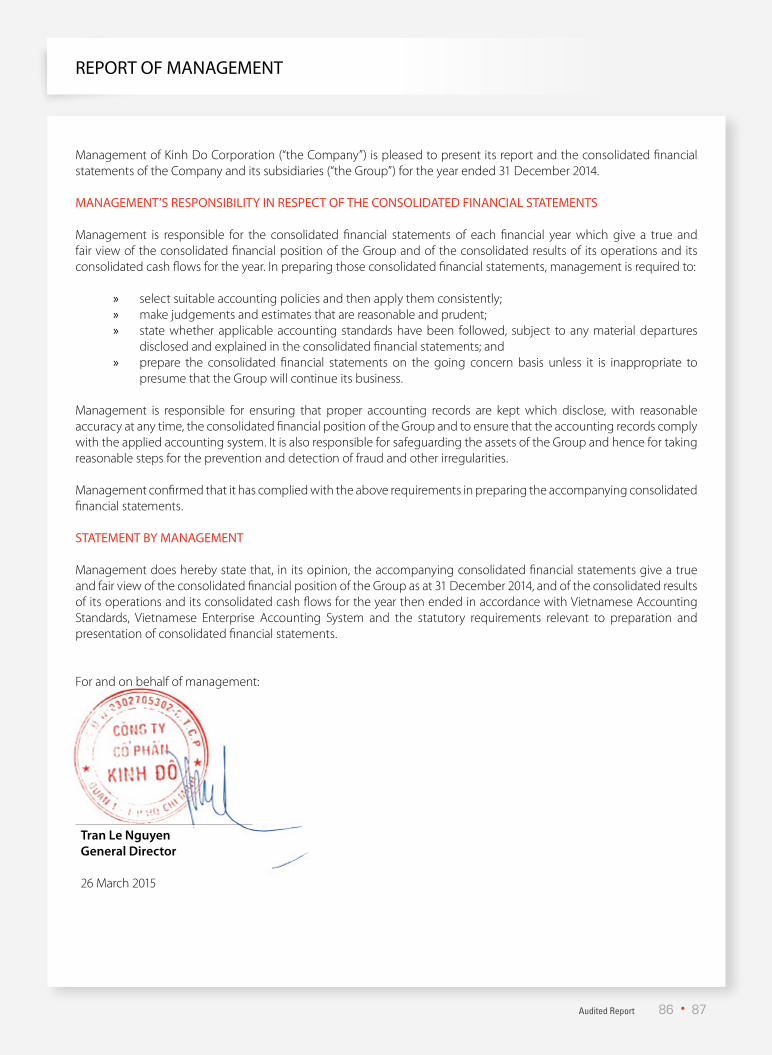
Audited Report 86 87
Management of Kinh Do Corporation (“the Company”) is pleased to present its report and the consolidated financial statements of the Company and its subsidiaries (“the Group”) for the year ended 31 December 2014.
MAnAgeMenT’S reSpOnSiBiliTy in reSpecT Of The cOnSOliDATeD finAnciAl STATeMenTS
Management is responsible for the consolidated financial statements of each financial year which give a true and fair view of the consolidated financial position of the Group and of the consolidated results of its operations and its consolidated cash flows for the year. In preparing those consolidated financial statements, management is required to:
» select suitable accounting policies and then apply them consistently; » make judgements and estimates that are reasonable and prudent; » state whether applicable accounting standards have been followed, subject to any material departures
disclosed and explained in the consolidated financial statements; and » prepare the consolidated financial statements on the going concern basis unless it is inappropriate to
presume that the Group will continue its business.
Management is responsible for ensuring that proper accounting records are kept which disclose, with reasonable accuracy at any time, the consolidated financial position of the Group and to ensure that the accounting records comply with the applied accounting system. It is also responsible for safeguarding the assets of the Group and hence for taking reasonable steps for the prevention and detection of fraud and other irregularities.
Management confirmed that it has complied with the above requirements in preparing the accompanying consolidated financial statements.
STATeMenT By MAnAgeMenT
Management does hereby state that, in its opinion, the accompanying consolidated financial statements give a true and fair view of the consolidated financial position of the Group as at 31 December 2014, and of the consolidated results of its operations and its consolidated cash flows for the year then ended in accordance with Vietnamese Accounting Standards, Vietnamese Enterprise Accounting System and the statutory requirements relevant to preparation and presentation of consolidated financial statements.
For and on behalf of management:
repOrT Of MAnAgeMenT
Tran Le nguyengeneral Director
26 March 2015
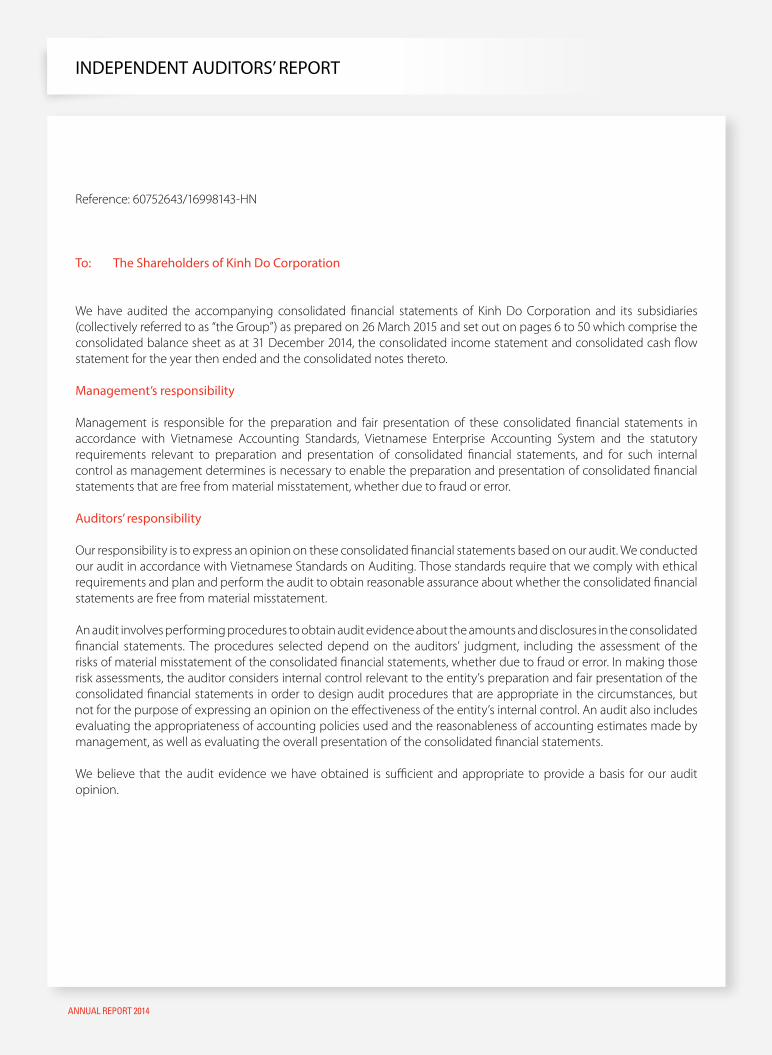
ANNUAL REPORT 2014
inDepenDenT AuDiTOrS’ repOrT
Reference: 60752643/16998143-HN
To: The Shareholders of Kinh Do corporation
We have audited the accompanying consolidated financial statements of Kinh Do Corporation and its subsidiaries (collectively referred to as “the Group”) as prepared on 26 March 2015 and set out on pages 6 to 50 which comprise the consolidated balance sheet as at 31 December 2014, the consolidated income statement and consolidated cash flow statement for the year then ended and the consolidated notes thereto.
Management’s responsibility
Management is responsible for the preparation and fair presentation of these consolidated financial statements in accordance with Vietnamese Accounting Standards, Vietnamese Enterprise Accounting System and the statutory requirements relevant to preparation and presentation of consolidated financial statements, and for such internal control as management determines is necessary to enable the preparation and presentation of consolidated financial statements that are free from material misstatement, whether due to fraud or error.
Auditors’ responsibility
Our responsibility is to express an opinion on these consolidated financial statements based on our audit. We conducted our audit in accordance with Vietnamese Standards on Auditing. Those standards require that we comply with ethical requirements and plan and perform the audit to obtain reasonable assurance about whether the consolidated financial statements are free from material misstatement.
An audit involves performing procedures to obtain audit evidence about the amounts and disclosures in the consolidated financial statements. The procedures selected depend on the auditors’ judgment, including the assessment of the risks of material misstatement of the consolidated financial statements, whether due to fraud or error. In making those risk assessments, the auditor considers internal control relevant to the entity’s preparation and fair presentation of the consolidated financial statements in order to design audit procedures that are appropriate in the circumstances, but not for the purpose of expressing an opinion on the effectiveness of the entity’s internal control. An audit also includes evaluating the appropriateness of accounting policies used and the reasonableness of accounting estimates made by management, as well as evaluating the overall presentation of the consolidated financial statements.
We believe that the audit evidence we have obtained is sufficient and appropriate to provide a basis for our audit opinion.
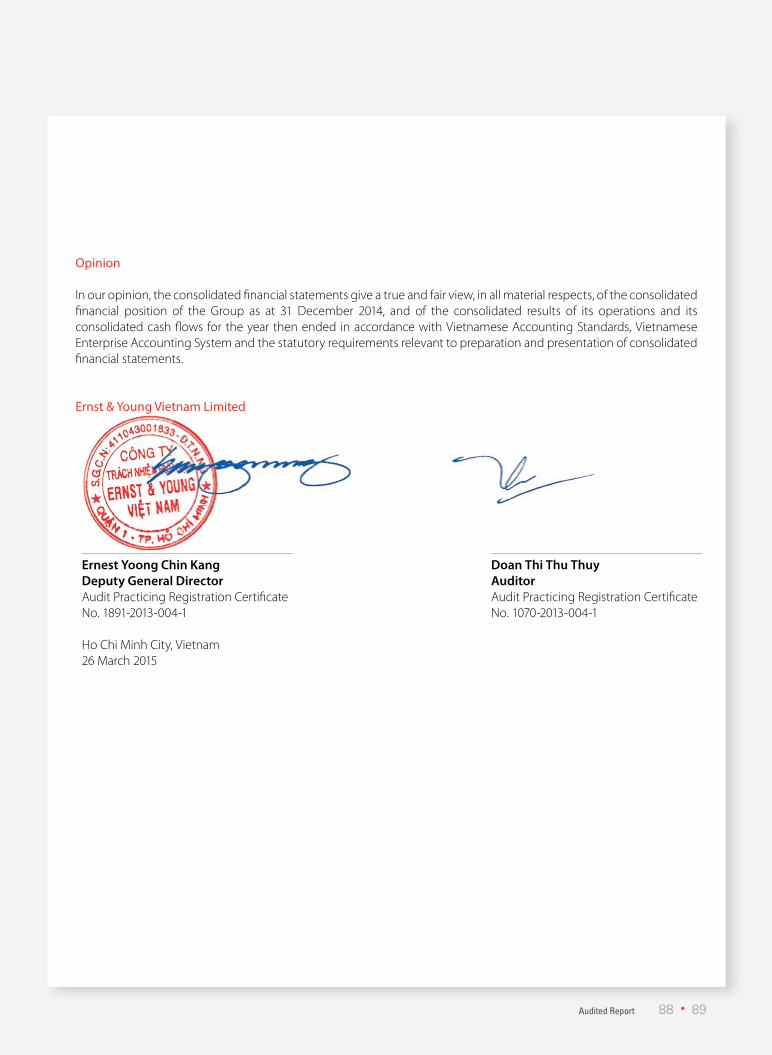
Audited Report 88 89
Opinion
In our opinion, the consolidated financial statements give a true and fair view, in all material respects, of the consolidated financial position of the Group as at 31 December 2014, and of the consolidated results of its operations and its consolidated cash flows for the year then ended in accordance with Vietnamese Accounting Standards, Vietnamese Enterprise Accounting System and the statutory requirements relevant to preparation and presentation of consolidated financial statements.
ernst & young Vietnam limited
ernest yoong chin KangDeputy general DirectorAudit Practicing Registration CertificateNo. 1891-2013-004-1
Ho Chi Minh City, Vietnam26 March 2015
Doan Thi Thu ThuyauditorAudit Practicing Registration CertificateNo. 1070-2013-004-1

B01 – DN/HN
ANNUAL REPORT 2014
CONsOLiDateD BaLaNCe sheetas at 31 December 2014
VND
code ASSeTS notes ending balance Beginning balance100 A. currenT ASSeTS 4,324,131,530,361 3,208,951,948,303110 i. cash and cash equivalents 5 2,467,177,548,607 1,958,064,548,124
111 1. Cash 621,395,548,607 287,064,548,124
112 2. Cash equivalents 1,845,782,000,000 1,671,000,000,000
120 ii. Short-term investments 13.2 700,100,705,600 39,479,723,350
121 1. Short-term investments 708,106,299,143 48,576,276,394
1292. Provision for diminution in value of short-term
investments(8,005,593,543) (9,096,553,044)
130 iii. current accounts receivable 6 784,031,063,903 859,893,313,934
131 1. Trade receivables 179,621,469,269 188,931,745,641
132 2. Advances to suppliers 69,329,681,247 70,757,652,186
135 3. Other receivables 538,297,499,600 603,491,045,600
139 4. Provision for doubtful debts (3,217,586,213) (3,287,129,493)
140 iV. Inventories 7 333,740,449,970 303,697,604,128
141 1. Inventories 345,171,757,188 317,614,040,657
149 2. Provision for obsolete inventories (11,431,307,218) (13,916,436,529)
150 V. Other current assets 39,081,762,281 47,816,758,767
151 1. Short-term prepaid expenses 19,009,034,891 14,434,824,512
152 2. Value-added tax deductible 13,217,668,176 5,679,645,734
154 3. Tax and other receivables from the State 8 1,941,177,932 17,515,321,638
158 4. Other current assets 4,913,881,282 10,186,966,883
200 B. nOn-currenT ASSeTS 3,551,744,980,102 3,169,293,630,695220 i. fixed assets 1,613,382,983,672 1,371,191,674,104
221 1. Tangible fixed assets 9 943,619,841,486 919,281,789,101
222 Cost 1,903,912,064,965 1,755,145,801,018
223 Accumulated depreciation (960,292,223,479) (835,864,011,917)
227 2. Intangible assets 10 646,884,983,783 326,200,228,842
228 Cost 778,091,532,845 429,548,357,289
229 Accumulated amortization (131,206,549,062) (103,348,128,447)
230 3. Construction in progress 11 22,878,158,403 125,709,656,161
240 ii. investment property 12 18,871,519,542 21,444,908,571
241 1. Cost 34,524,970,816 34,524,970,816
242 2. Accumulated depreciation (15,653,451,274) (13,080,062,245)
250 iii. long-term investments 1,480,145,599,984 1,272,100,000,000
252 1. Investments in associates and jointly controlled entity 13.1 1,471,505,599,984 1,257,100,000,000
258 2. Other long-term investments 13.3 8,640,000,000 15,000,000,000
260 iV. Other long-term assets 158,718,282,339 178,234,881,999
261 1. Long-term prepaid expenses 14 109,761,473,819 124,374,000,279
262 2. Deferred tax assets 28.3 35,823,601,560 40,647,012,600
268 3. Other long-term assets 13,133,206,960 13,213,869,120
269 V. goodwill 4 280,626,594,565 326,322,166,021
270 TOTAl ASSeTS 7,875,876,510,463 6,378,245,578,998

Audited Report
CONsOLiDateD BaLaNCe sheet (continued)as at 31 December 2014 B 01 - DN/hN
90 91
VND
code reSOurceS notes ending balance Beginning balance300 A. liABiliTieS 1,588,185,320,865 1,495,030,377,728310 i. current liabilities 1,535,881,366,903 1,265,590,486,146
311 1. Short-term loans 15 553,318,491,711 400,939,212,302
312 2. Trade payables 16 278,038,773,915 283,772,381,108
313 3. Advances from customers 17 37,066,122,475 34,950,728,208
314 4. Statutory obligations 18 50,654,459,117 81,827,122,663
315 5. Payables to employees 72,187,442,899 58,642,156,537
316 6. Accrued expenses 19 309,731,144,714 230,109,039,925
319 7. Other payables 20 186,263,372,486 122,357,506,054
323 8. Bonus and welfare fund 48,621,559,586 52,992,339,349
330 ii. non-current liabilities 52,303,953,962 229,439,891,582
333 1. Other long-term liabilities 52,303,953,962 60,554,121,882
334 2. Long-term loans 21 - 168,885,769,700
400 B. OwnerS’ equiTy 22 6,186,607,961,632 4,881,643,588,931410 i. capital 6,186,607,961,632 4,881,643,588,931
411 1. Issued share capital 2,566,533,970,000 1,676,282,700,000
412 2. Share premium 3,274,294,092,589 2,344,308,719,177
414 3. Treasury shares (805,826,191,900) (152,626,203,900)
417 4. Investment and development fund 25,370,280,515 25,370,280,515
418 5. Financial reserve fund 25,792,635,752 25,792,635,752
419 6. Other funds belonging to owners’ equity 15,909,752,661 15,909,752,661
420 7. Undistributed earnings 1,084,533,422,015 946,605,704,726
439 c. MinOriTy inTereSTS 101,083,227,966 1,571,612,339
440 TOTAl liABiliTieS AnD OwnerS’ equiTy 7,875,876,510,463 6,378,245,578,998
Off BAlAnce SheeT iTeM
iTeM ending balance Beginning balanceForeign currencies:
– United States dollar (USD) 2,762,321 1,389,939
– Euro (EUR) 103 110
Tran minh nguyet Preparer
nguyen Thi oanhchief accountant
Tran Le nguyengeneral Director
26 March 2014

ANNUAL REPORT 2014
CONsOLiDateD iNCOme statemeNtfor the year ended 31 December 2014 B 02 - DN/hN
VND
code iTeMS notes current year previous year
01 1. revenue from sale of goods and rendering of services 23.1 5,125,718,821,077 4,674,796,415,910
02 2. Deductions 23.1 (173,055,897,638) (114,198,130,572)
10 3. net revenue from sale of goods and rendering of services 23.1 4,952,662,923,439 4,560,598,285,338
11 4. cost of goods sold and services rendered 24 (2,806,830,526,554) (2,584,484,709,244)
20 5. gross profit from sale of goods and rendering of services 2,145,832,396,885 1,976,113,576,094
21 6. finance income 23.2 144,327,090,430 113,135,293,907
22 7. finance expenses 25 (26,185,496,926) (73,516,940,227)
23 In which: Interest expense (20,731,742,626) (43,391,810,398)
24 8. Selling expenses (1,214,612,633,132) (996,843,091,578)
25 9. general and administration expenses (417,538,749,182) (395,953,432,450)
30 10. Operating profit 631,822,608,075 622,935,405,746
31 11. Other income 26 63,331,885,612 30,372,643,049
32 12. Other expenses 26 (32,196,031,460) (34,690,086,601)
40 13. Other profit (loss) 26 31,135,854,152 (4,317,443,552)
50 14. profit before tax 662,958,462,227 618,617,962,194
51 15. current income tax expense 28.2 (121,010,750,584) (118,676,164,588)
52 16. Deferred tax expense 28.3 (4,823,411,040) (7,148,912,968)
60 17. net profit after tax 537,124,300,603 492,792,884,638
Attributable to:
61 17.1 Minority interests 678,661,494 (1,076,667,504)
62 17.2 The Company’s shareholders 536,445,639,109 493,869,552,142
80 18. Basic earnings per share and diluted earnings per share 22.5 2,296 2,542
Tran minh nguyet Preparer
nguyen Thi oanhchief accountant
Tran Le nguyengeneral Director
26 March 2014
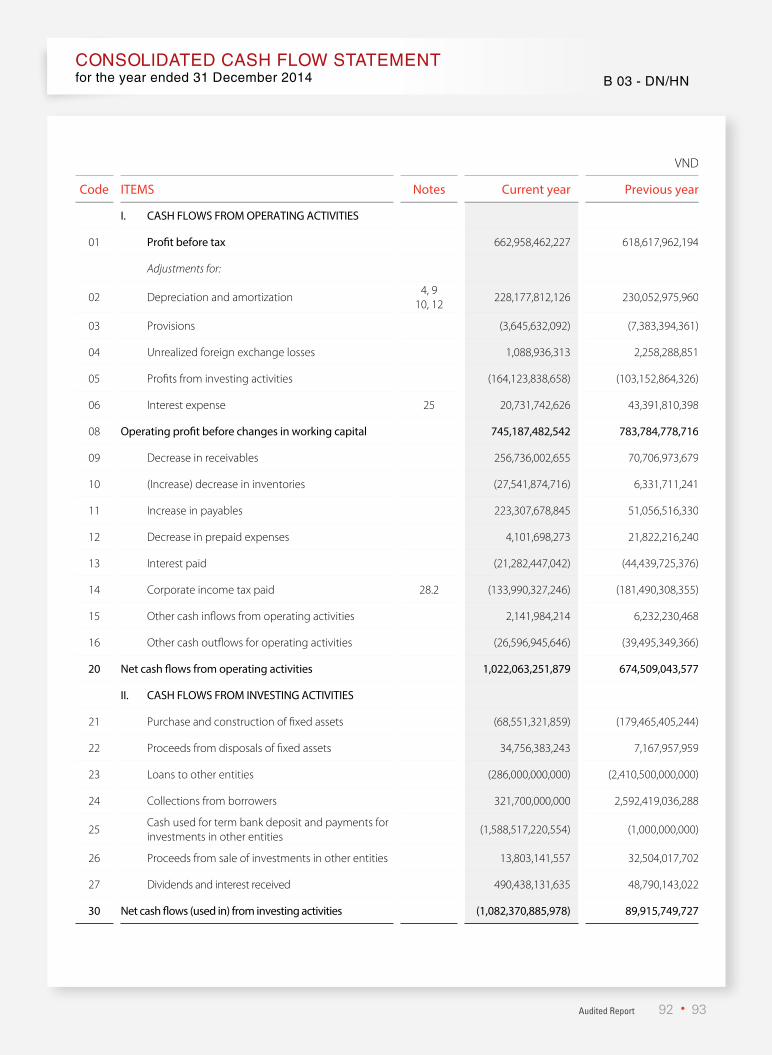
Audited Report 92 93
VND
code iTeMS notes current year previous year
i. cASh flOwS frOM OperATing AcTiViTieS
01 profit before tax 662,958,462,227 618,617,962,194
Adjustments for:
02 Depreciation and amortization4, 9
10, 12228,177,812,126 230,052,975,960
03 Provisions (3,645,632,092) (7,383,394,361)
04 Unrealized foreign exchange losses 1,088,936,313 2,258,288,851
05 Profits from investing activities (164,123,838,658) (103,152,864,326)
06 Interest expense 25 20,731,742,626 43,391,810,398
08 Operating profit before changes in working capital 745,187,482,542 783,784,778,716
09 Decrease in receivables 256,736,002,655 70,706,973,679
10 (Increase) decrease in inventories (27,541,874,716) 6,331,711,241
11 Increase in payables 223,307,678,845 51,056,516,330
12 Decrease in prepaid expenses 4,101,698,273 21,822,216,240
13 Interest paid (21,282,447,042) (44,439,725,376)
14 Corporate income tax paid 28.2 (133,990,327,246) (181,490,308,355)
15 Other cash inflows from operating activities 2,141,984,214 6,232,230,468
16 Other cash outflows for operating activities (26,596,945,646) (39,495,349,366)
20 net cash flows from operating activities 1,022,063,251,879 674,509,043,577
ii. cASh flOwS frOM inVeSTing AcTiViTieS
21 Purchase and construction of fixed assets (68,551,321,859) (179,465,405,244)
22 Proceeds from disposals of fixed assets 34,756,383,243 7,167,957,959
23 Loans to other entities (286,000,000,000) (2,410,500,000,000)
24 Collections from borrowers 321,700,000,000 2,592,419,036,288
25Cash used for term bank deposit and payments for investments in other entities
(1,588,517,220,554) (1,000,000,000)
26 Proceeds from sale of investments in other entities 13,803,141,557 32,504,017,702
27 Dividends and interest received 490,438,131,635 48,790,143,022
30 net cash flows (used in) from investing activities (1,082,370,885,978) 89,915,749,727
CONsOLiDateD Cash fLOw statemeNtfor the year ended 31 December 2014 B 03 - DN/hN
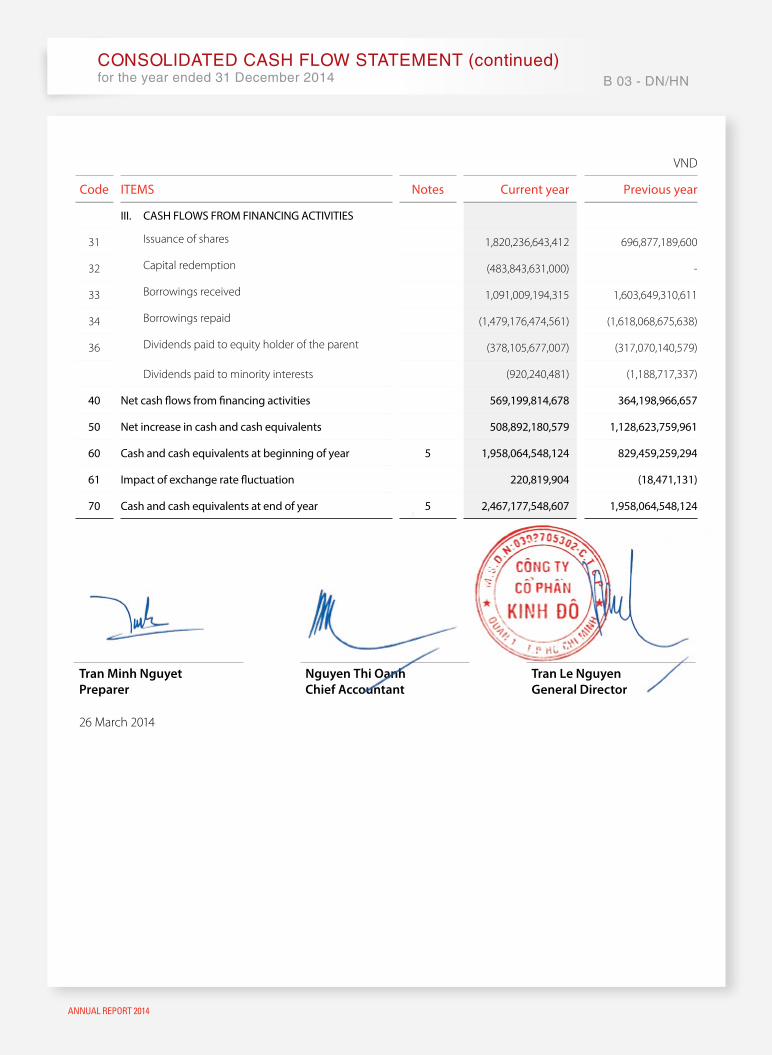
ANNUAL REPORT 2014
VND
code iTeMS notes current year previous year
iii. cASh flOwS frOM finAncing AcTiViTieS
31 Issuance of shares 1,820,236,643,412 696,877,189,600
32 Capital redemption (483,843,631,000) -
33 Borrowings received 1,091,009,194,315 1,603,649,310,611
34 Borrowings repaid (1,479,176,474,561) (1,618,068,675,638)
36 Dividends paid to equity holder of the parent (378,105,677,007) (317,070,140,579)
Dividends paid to minority interests (920,240,481) (1,188,717,337)
40 net cash flows from financing activities 569,199,814,678 364,198,966,657
50 net increase in cash and cash equivalents 508,892,180,579 1,128,623,759,961
60 cash and cash equivalents at beginning of year 5 1,958,064,548,124 829,459,259,294
61 impact of exchange rate fluctuation 220,819,904 (18,471,131)
70 cash and cash equivalents at end of year 5 2,467,177,548,607 1,958,064,548,124
CONsOLiDateD Cash fLOw statemeNt (continued)for the year ended 31 December 2014 B 03 - DN/hN
Tran minh nguyet Preparer
nguyen Thi oanhchief accountant
Tran Le nguyengeneral Director
26 March 2014
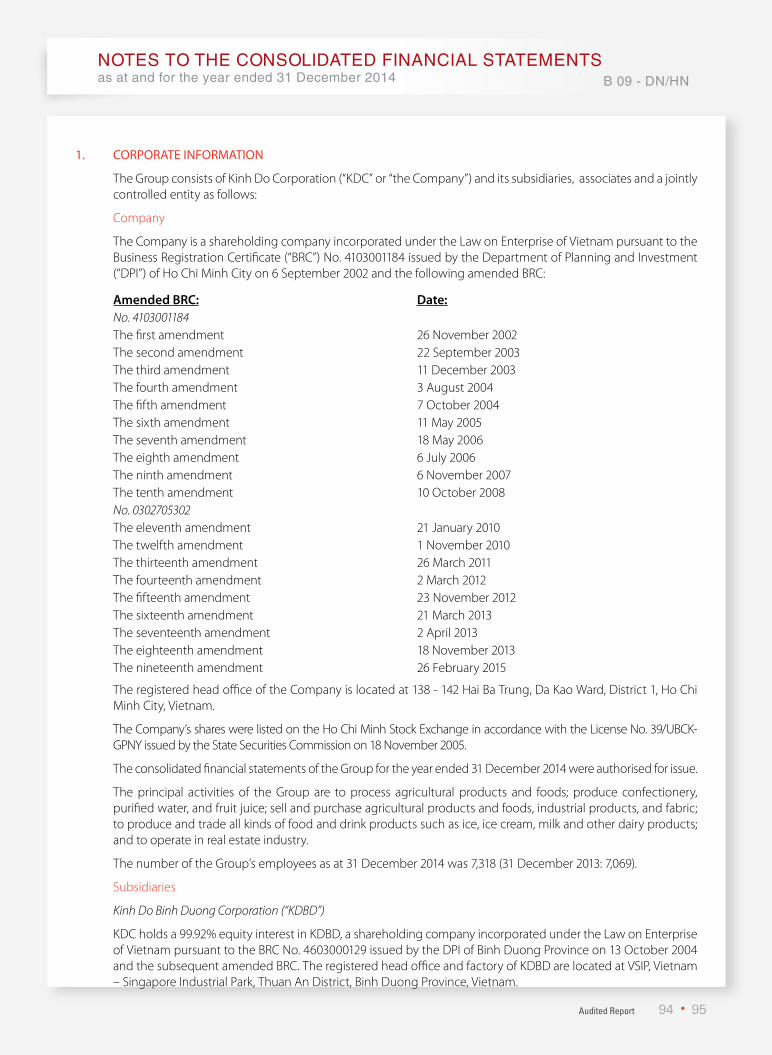
Audited Report 94 95
1. cOrpOrATe infOrMATiOn
The Group consists of Kinh Do Corporation (“KDC” or “the Company”) and its subsidiaries, associates and a jointly controlled entity as follows:
Company
The Company is a shareholding company incorporated under the Law on Enterprise of Vietnam pursuant to the Business Registration Certificate (“BRC”) No. 4103001184 issued by the Department of Planning and Investment (“DPI”) of Ho Chi Minh City on 6 September 2002 and the following amended BRC:
amended Brc: Date:No. 4103001184The first amendment 26 November 2002The second amendment 22 September 2003The third amendment 11 December 2003The fourth amendment 3 August 2004The fifth amendment 7 October 2004The sixth amendment 11 May 2005The seventh amendment 18 May 2006The eighth amendment 6 July 2006The ninth amendment 6 November 2007The tenth amendment 10 October 2008No. 0302705302The eleventh amendment 21 January 2010The twelfth amendment 1 November 2010The thirteenth amendment 26 March 2011The fourteenth amendment 2 March 2012The fifteenth amendment 23 November 2012The sixteenth amendment 21 March 2013The seventeenth amendment 2 April 2013The eighteenth amendment 18 November 2013The nineteenth amendment 26 February 2015
The registered head office of the Company is located at 138 - 142 Hai Ba Trung, Da Kao Ward, District 1, Ho Chi Minh City, Vietnam.
The Company’s shares were listed on the Ho Chi Minh Stock Exchange in accordance with the License No. 39/UBCK-GPNY issued by the State Securities Commission on 18 November 2005.
The consolidated financial statements of the Group for the year ended 31 December 2014 were authorised for issue.
The principal activities of the Group are to process agricultural products and foods; produce confectionery, purified water, and fruit juice; sell and purchase agricultural products and foods, industrial products, and fabric; to produce and trade all kinds of food and drink products such as ice, ice cream, milk and other dairy products; and to operate in real estate industry.
The number of the Group’s employees as at 31 December 2014 was 7,318 (31 December 2013: 7,069).
Subsidiaries
Kinh Do Binh Duong Corporation (“KDBD”)
KDC holds a 99.92% equity interest in KDBD, a shareholding company incorporated under the Law on Enterprise of Vietnam pursuant to the BRC No. 4603000129 issued by the DPI of Binh Duong Province on 13 October 2004 and the subsequent amended BRC. The registered head office and factory of KDBD are located at VSIP, Vietnam – Singapore Industrial Park, Thuan An District, Binh Duong Province, Vietnam.
NOtes tO the CONsOLiDateD fiNaNCiaL statemeNtsas at and for the year ended 31 December 2014 B 09 - DN/hN
NOtes tO the CONsOLiDateD fiNaNCiaL statemeNts (continued)as at and for the year ended 31 December 2014 B 09 - DN/hN
ANNUAL REPORT 2014
1. cOrpOrATe infOrMATiOn (continued)
Subsidiaries (continued)
Vinabico Corporation (“Vinabico”)
The Company holds a 100% equity interest in Vinabico, a company incorporated under the Law on Enterprise of Vietnam pursuant to the BRC No. 4103001904 issued by the DPI of Ho Chi Minh City on 3 November 2003 and the subsequent amended BRC. The registered head office and factory of Vinabico are located at 436 No Trang Long Street, Ward 13, Binh Thanh District, Ho Chi Minh City, Vietnam.
As at the date of this consolidated financial statements, Vinabico has been ceased as a legal entity and its operations have been merged as an independent branch of the Group. This restructuring plan was approved by the DPI of Ho Chi Minh City through the issuance of the nineteenth amended BRC dated 26 February 2015.
Kido Company Limited (“KIDO”)
The Company holds a 100% equity interest in KIDO, a one member limited liability company incorporated under the Law on Enterprise of Vietnam pursuant to the BRC No. 4103001557 issued by the DPI of Ho Chi Minh City on 14 April 2003 and the subsequent amended BRC. The registered head office and factory of KIDO are located at Cu Chi Northwest Industrial Park, Cay Sop Village, Tan An Hoi Ward, Cu Chi District, Ho Chi Minh City, Vietnam.
North Kinh Do One Member Company Limited (“NKD”)
The Company holds a 100% equity interest in NKD, a one member limited liability company incorporated under the Law on Enterprise of Vietnam pursuant to the BRC No. 0900178525 issued by the DPI of Hung Yen Province on 25 January 2011, as amended. The registered head office of NKD is located at Ban Yen Nhan Town, My Hao District, Hung Yen Province, Vietnam.
Tan An Phuoc Company Limited (“TAP”)
The Company holds a 80% equity interest in TAP, a limited liability company with two and more members incorporated under the Law on Enterprise of Vietnam pursuant to the BRC No. 0309403269 issued by the DPI of Ho Chi Minh City on 24 September 2009. The registered office of TAP is located at 6/134 National Road No. 13, Hiep Binh Phuoc Ward, Thu Duc District, Ho Chi Minh City, Vietnam.
Kido Food Company Limited (“KDF”)
The Company holds indirectly a 100% equity interest in KDF, a subsidiary wholly-owned by KIDO incorporated under the Law on Enterprise of Vietnam pursuant to the BRC No. 0106681285 issued by the DPI of Hanoi City on 3 November 2014 and the subsequent amended BRC. The registered head office of KDF is located at 10th Floor, Vinaconex Tower, 34 Lang Ha, Lang Ha Ward, Dong Da District, Hanoi, Vietnam.
Associate and jointly controlled entity
Vietnam Vegetable Oils Industry Corporation (“Vocarimex”)
The Company holds a 24% equity interest in Vocarimex, currently a shareholding company incorporated under the Law on Enterprise of Vietnam pursuant to the BRC No. 0300585984 issued by the DPI of Ho Chi Minh City on 31 December 2014. The registered head office of Vocarimex is located at 58 Nguyen Binh Khiem Street, Dakao Ward, District 1, Ho Chi Minh City, Vietnam.
Lavenue Investment Corporation (“Lavenue”)
The Company holds a 50% equity interest in Lavenue, a shareholding company incorporated under the Law on Enterprise of Vietnam pursuant to the BRC No. 0310306044 issued by the DPI of Ho Chi Minh City on 10 September 2010. The registered office of Lavenue is located at 3th Floor, May Flower Tower, 12 Le Thanh Ton, District 1, Ho Chi Minh City, Vietnam.

Audited Report
NOtes tO the CONsOLiDateD fiNaNCiaL statemeNts (continued)as at and for the year ended 31 December 2014
NOtes tO the CONsOLiDateD fiNaNCiaL statemeNts (continued)as at and for the year ended 31 December 2014 B 09 - DN/hN
96 97
2. BASiS Of prepArATiOn
2.1 Accounting standards and system
The consolidated financial statements of the Group, expressed in Vietnam dong (“VND”), are prepared in accordance with Vietnamese Enterprise Accounting System and Vietnamese Accounting Standards issued by the Ministry of Finance as per the:
» Decision No. 149/2001/QD-BTC dated 31 December 2001 on the Issuance and Promulgation of Four Vietnamese Accounting Standards (Series 1);
» Decision No. 165/2002/QD-BTC dated 31 December 2002 on the Issuance and Promulgation of Six Vietnamese Accounting Standards (Series 2);
» Decision No. 234/2003/QD-BTC dated 30 December 2003 on the Issuance and Promulgation of Six Vietnamese Accounting Standards (Series 3);
» Decision No. 12/2005/QD-BTC dated 15 February 2005 on the Issuance and Promulgation of Six Vietnamese Accounting Standards (Series 4); and
» Decision No. 100/2005/QD-BTC dated 28 December 2005 on the Issuance and Promulgation of Four Vietnamese Accounting Standards (Series 5).
Accordingly, the accompanying consolidated balance sheet, consolidated income statement, consolidated cash flow statement and related notes, including their utilisation are not designed for those who are not informed about Vietnam’s accounting principles, procedures and practices and furthermore are not intended to present the consolidated financial position and consolidated results of operations and consolidated cash flows in accordance with accounting principles and practices generally accepted in countries other than Vietnam.
2.2 Applied accounting documentation system
The Group’s applied accounting documentation system is the General Journal system.
2.3 Fiscal year
The Group’s fiscal year applicable for the preparation of its consolidated financial statements starts on 1 January and ends on 31 December.
2.4 Accounting currency
The consolidated financial statements are prepared in VND which is also the Group’s accounting currency.
2.5 Basis of consolidation
The Group’s consolidated financial statements comprise the financial statements of the Company (“the parent company”) and the financial statements of its subsidiaries for the year ended 31 December 2014.
Subsidiaries are fully consolidated from the date of acquisition, being the date on which the Group obtains control, and continues to be consolidated until the date that such control ceases.
The financial statements of the subsidiaries are prepared for the same reporting year as the parent company, using consistent accounting policies.
All intra-company balances, income and expenses and unrealized gains or losses result from intra-company transactions are eliminated in full.
Non-controlling interests represent the portion of profit or loss and net assets that is not held by the Group’s shareholders and are presented separately in the consolidated income statement and consolidated balance sheet. Acquisitions of minority interests are accounted for using the parent entity extension method, whereby, the difference between the consideration and the book value of the share of the net assets acquired is recognised in goodwill.

NOtes tO the CONsOLiDateD fiNaNCiaL statemeNts (continued)as at and for the year ended 31 December 2014 B 09 - DN/hN
ANNUAL REPORT 2014
3. SuMMAry Of SignificAnT AccOunTing pOlicieS
3.1 Cash and cash equivalents
Cash and cash equivalents comprise cash on hand, cash in banks, cash in transit and short-term, highly liquid investments with an original maturity of less than three months that are readily convertible into known amounts of cash and that are subject to an insignificant risk of change in value.
3.2 Inventories
Inventories are stated at the lower of cost incurred in bringing each product to its present location and condition, and net realizable value.
Net realizable value represents the estimated selling price in the ordinary course of business less the estimated costs to complete and the estimated costs necessary to make the sale.
The perpetual method is used to record inventories, which are valued as follows:
Raw materials, consumables and goods for resale.Finished goods and work in process.
- actual cost on a weighted average basis.
- cost of direct materials and labour plus attributable overhead based on the normal level of activities.
Provision for obsolete inventories
An inventory provision is created for the estimated loss arising due to the impairment (through diminution, damage, obsolescence, etc.) of raw materials, finished goods, and other inventories owned by the Group, based on appropriate evidence of impairment available at the balance sheet date. Increases and decreases to the provision balance are recorded into the cost of goods sold account in the consolidated income statement.
3.3 Receivables
Receivables are presented in the consolidated financial statements at the carrying amounts due from customers and other debtors, after provision for doubtful debts.
The provision for doubtful debts represents amounts of outstanding receivables at the balance sheet date which are doubtful of being recovered. Increases and decreases to the provision balance are recorded as general and administration expense in the consolidated income statement.
3.4 Tangible fixed assets
Tangible fixed assets are stated at cost less accumulated depreciation.
The cost of a tangible fixed asset comprises its purchase price and any directly attributable costs of bringing the tangible fixed asset to working condition for its intended use.
Expenditures for additions, improvements and renewals are added to the carrying amount of the assets and expenditures for maintenance and repairs are charged to the consolidated income statement as incurred.
When tangible fixed assets are sold or retired, their cost and accumulated depreciation are removed from the consolidated balance sheet and any gain or loss resulting from their disposal is included in the consolidated income statement.
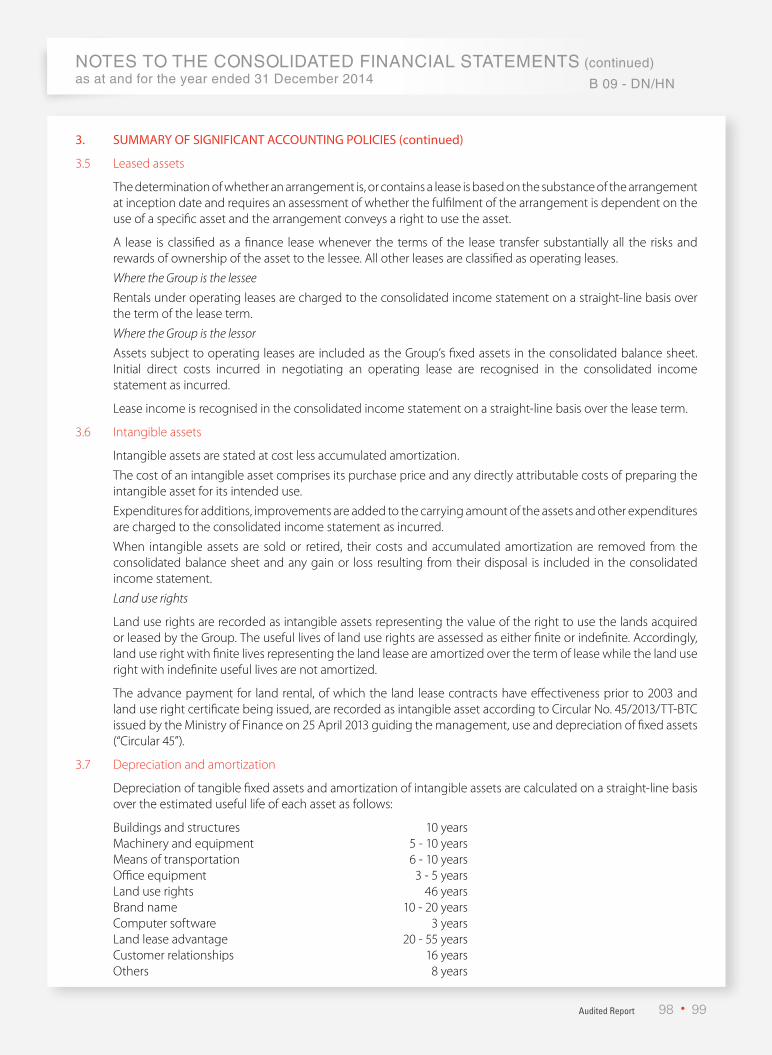
Audited Report
NOtes tO the CONsOLiDateD fiNaNCiaL statemeNts (continued)as at and for the year ended 31 December 2014
NOtes tO the CONsOLiDateD fiNaNCiaL statemeNts (continued)as at and for the year ended 31 December 2014 B 09 - DN/hN
98 99
3. SuMMAry Of SignificAnT AccOunTing pOlicieS (continued)
3.5 Leased assets
The determination of whether an arrangement is, or contains a lease is based on the substance of the arrangement at inception date and requires an assessment of whether the fulfilment of the arrangement is dependent on the use of a specific asset and the arrangement conveys a right to use the asset.
A lease is classified as a finance lease whenever the terms of the lease transfer substantially all the risks and rewards of ownership of the asset to the lessee. All other leases are classified as operating leases.
Where the Group is the lessee
Rentals under operating leases are charged to the consolidated income statement on a straight-line basis over the term of the lease term.
Where the Group is the lessor
Assets subject to operating leases are included as the Group’s fixed assets in the consolidated balance sheet. Initial direct costs incurred in negotiating an operating lease are recognised in the consolidated income statement as incurred.
Lease income is recognised in the consolidated income statement on a straight-line basis over the lease term.
3.6 Intangible assets
Intangible assets are stated at cost less accumulated amortization.
The cost of an intangible asset comprises its purchase price and any directly attributable costs of preparing the intangible asset for its intended use.
Expenditures for additions, improvements are added to the carrying amount of the assets and other expenditures are charged to the consolidated income statement as incurred.
When intangible assets are sold or retired, their costs and accumulated amortization are removed from the consolidated balance sheet and any gain or loss resulting from their disposal is included in the consolidated income statement.
Land use rights
Land use rights are recorded as intangible assets representing the value of the right to use the lands acquired or leased by the Group. The useful lives of land use rights are assessed as either finite or indefinite. Accordingly, land use right with finite lives representing the land lease are amortized over the term of lease while the land use right with indefinite useful lives are not amortized.
The advance payment for land rental, of which the land lease contracts have effectiveness prior to 2003 and land use right certificate being issued, are recorded as intangible asset according to Circular No. 45/2013/TT-BTC issued by the Ministry of Finance on 25 April 2013 guiding the management, use and depreciation of fixed assets (“Circular 45”).
3.7 Depreciation and amortization
Depreciation of tangible fixed assets and amortization of intangible assets are calculated on a straight-line basis over the estimated useful life of each asset as follows:
Buildings and structures 10 yearsMachinery and equipment 5 - 10 yearsMeans of transportation 6 - 10 yearsOffice equipment 3 - 5 yearsLand use rights 46 yearsBrand name 10 - 20 yearsComputer software 3 yearsLand lease advantage 20 - 55 yearsCustomer relationships 16 yearsOthers 8 years

NOtes tO the CONsOLiDateD fiNaNCiaL statemeNts (continued)as at and for the year ended 31 December 2014 B 09 - DN/hN
ANNUAL REPORT 2014
3. SuMMAry Of SignificAnT AccOunTing pOlicieS (continued)
3.7 Depreciation and amortization (continued)
The useful life of the fixed assets and depreciation and amortization rates are reviewed periodically to ensure that the method and the period of the depreciation and amortization are consistent with the expected pattern of economic benefits that will be derived from the use of the fixed assets.
3.8 Investment properties
Investment properties are stated at cost including transaction costs less accumulated depreciation.
Subsequent expenditure relating to an investment property that has already been recognized is added to the net book value of the investment property when it is probable that future economic benefits, in excess of the originally assessed standard of performance of the existing investment property, will flow to the Group.
Depreciation of investment properties is calculated on a straight-line basis over the estimated useful life of each asset as follows:
Plant 13.5 years
Investment properties are derecognised when either they have been disposed of or when the investment properties are permanently withdrawn from use and no future economic benefit is expected from its disposal. The difference between the net disposal proceeds and the carrying amount of the assets is recognised in the consolidated income statement in the period of retirement or disposal.
Transfers are made to investment properties when, and only when, there is a change in use, evidenced by ending of owner-occupation, commencement of an operating lease to another party or ending of construction or development. Transfers are made from investment properties when, and only when, there is change in use, evidenced by commencement of owner-occupation or commencement of development with a view to sale. The transfer from investment property to owner-occupied property or inventories does not change the cost or the carrying value of the property for subsequent accounting at the date of change in use.
3.9 Construction in progress
Construction in progress represents tangible fixed assets under construction and is stated at cost. This includes costs of construction of plant, installation of equipment and other direct costs. Construction in progress is not depreciated until such time as the relevant assets are completed and put into operation.
3.10 Borrowing costs
Borrowing costs consist of interest and other costs that the Group incurs in connection with the borrowing of funds and are recorded as expense during the year in which they are incurred.
3.11 Prepaid expenses
Prepaid expenses are reported as short-term prepaid expenses or long-term prepaid expenses on the consolidated balance sheet and amortized over the period for which the amounts are paid or the period in which economic benefits are generated in relation to these expenses.
Starting from 10 June 2013, according to Circular 45, the prepaid rental related to land lease contract with effectiveness after 2003 is not qualified for recognition as intangible asset. Accordingly, the unamortized balances of prepaid rental made in accordance with the lease contract with effectiveness after 2003 are reclassified from intangible assets to long-term prepaid expenses and allocated to the consolidated income statement over the remaining lease term.

Audited Report
NOtes tO the CONsOLiDateD fiNaNCiaL statemeNts (continued)as at and for the year ended 31 December 2014
NOtes tO the CONsOLiDateD fiNaNCiaL statemeNts (continued)as at and for the year ended 31 December 2014 B 09 - DN/hN
100 101
3. SUMMARY OF SIGNIFICANT ACCOUNTING POLICIES (continued)
3.12 Business combination and goodwill
Business combinations are accounted for using the purchase method. The cost of an acquisition is measured as the fair value of the assets given, equity instruments issued and liabilities incurred or assumed at the date of exchange, plus costs directly attributable to the acquisition. Identifiable assets acquired and liabilities and contingent liabilities assumed in a business combination are measured initially at fair values at the date of business combination.
Goodwill is initially measured at cost being the excess of the cost of the business combination over the Group’s share in the net fair value of the acquiree’s identifiable assets, liabilities and contingent liabilities. If the cost of acquisition is less than the fair value of the net assets of the subsidiary acquired, the difference is recognised directly in the consolidated income statement.
After initial recognition, goodwill is measured at cost less accumulated amortization. Amortization of goodwill is calculated on a straight-line basis over ten (10) years during which the source embodying economic benefits are recovered by the Group.
3.13 Investment in associates
The Group’s investment in its associates is accounted for using the equity method of accounting. An associate is an entity in which the Group has significant influence and which is neither a subsidiary nor a joint venture. The Group generally deems they have significant influence if they have over 20% of the voting rights.
Under the equity method, the investment is carried in the consolidated balance sheet at cost plus post acquisition changes in the Group’s share of net assets of the associates. Goodwill arising on acquisition of the associate is included in the carrying amount of the investment and is amortized over a 10-year period. The consolidated income statement reflects the share of the post-acquisition results of operation of the associate.
The share of post-acquisition profit (loss) of the associates is presented on the face of the consolidated income statement and its share of post-acquisition movements in reserves is recognised in reserves. The cumulative post-acquisition movements are adjusted against the carrying amount of the investment. Dividend or profit sharing received or receivable from associates reduce the carrying amount of the investment.
The financial statements of the associates are prepared for the same reporting year and use the same accounting policies as the Group. Where necessary, adjustments are made to bring the accounting policies in line with those of the Group.
3.14 Investment in jointly controlled entity
The Group’s investment in jointly controlled entity is accounted for using the equity method of accounting. Under the equity method, the investment is carried in the consolidated balance sheet at cost plus post joint venture changes in the Group’s share of net assets of the jointly controlled entity. The consolidated income statement reflects the share of the post-acquisition results of operation of the jointly controlled entity.
The share of profit (loss) of the jointly controlled entity is presented on face of the consolidated income statement and its share of post-acquisition movements in reserves is recognised in reserves. The cumulative post-acquisition movements are adjusted against the carrying amount of the investment. Dividend or profit sharing received or receivable from jointly controlled entities reduces the carrying amount of the investment.
The financial statements of the jointly controlled entities are prepared for the same reporting year and use the same accounting policies as the Group. Where necessary, adjustments are made to bring the accounting policies in line with those of the Group.
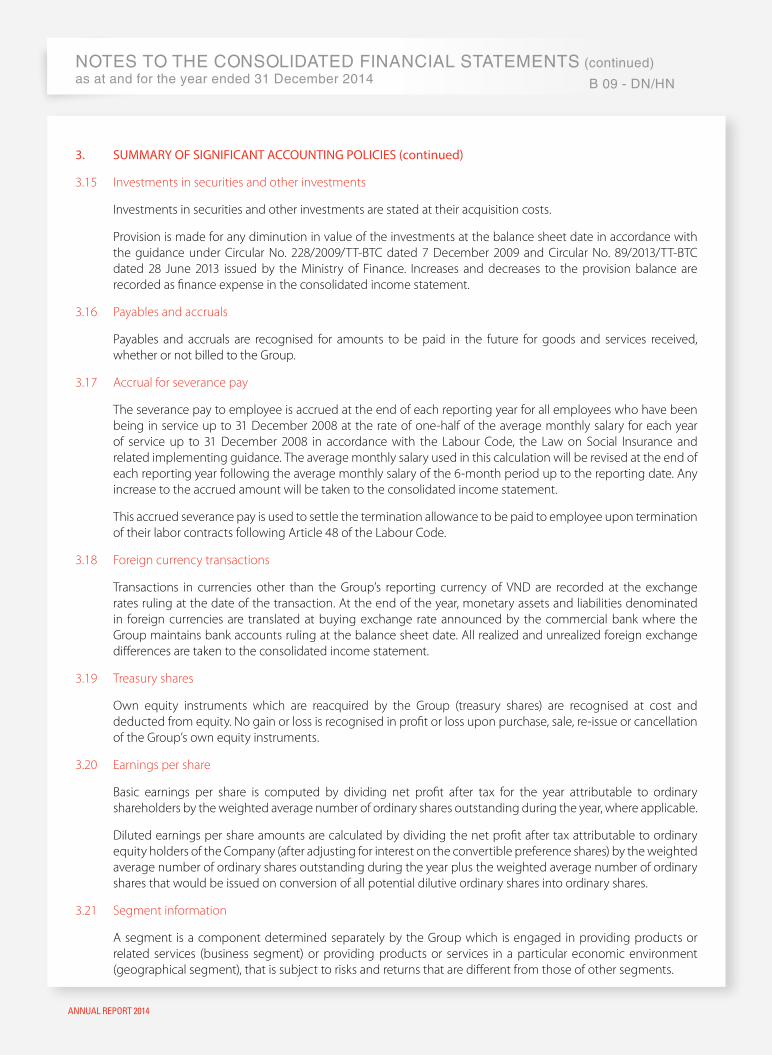
NOtes tO the CONsOLiDateD fiNaNCiaL statemeNts (continued)as at and for the year ended 31 December 2014 B 09 - DN/hN
ANNUAL REPORT 2014
3. SuMMAry Of SignificAnT AccOunTing pOlicieS (continued)
3.15 Investments in securities and other investments
Investments in securities and other investments are stated at their acquisition costs.
Provision is made for any diminution in value of the investments at the balance sheet date in accordance with the guidance under Circular No. 228/2009/TT-BTC dated 7 December 2009 and Circular No. 89/2013/TT-BTC dated 28 June 2013 issued by the Ministry of Finance. Increases and decreases to the provision balance are recorded as finance expense in the consolidated income statement.
3.16 Payables and accruals
Payables and accruals are recognised for amounts to be paid in the future for goods and services received, whether or not billed to the Group.
3.17 Accrual for severance pay
The severance pay to employee is accrued at the end of each reporting year for all employees who have been being in service up to 31 December 2008 at the rate of one-half of the average monthly salary for each year of service up to 31 December 2008 in accordance with the Labour Code, the Law on Social Insurance and related implementing guidance. The average monthly salary used in this calculation will be revised at the end of each reporting year following the average monthly salary of the 6-month period up to the reporting date. Any increase to the accrued amount will be taken to the consolidated income statement.
This accrued severance pay is used to settle the termination allowance to be paid to employee upon termination of their labor contracts following Article 48 of the Labour Code.
3.18 Foreign currency transactions
Transactions in currencies other than the Group’s reporting currency of VND are recorded at the exchange rates ruling at the date of the transaction. At the end of the year, monetary assets and liabilities denominated in foreign currencies are translated at buying exchange rate announced by the commercial bank where the Group maintains bank accounts ruling at the balance sheet date. All realized and unrealized foreign exchange differences are taken to the consolidated income statement.
3.19 Treasury shares
Own equity instruments which are reacquired by the Group (treasury shares) are recognised at cost and deducted from equity. No gain or loss is recognised in profit or loss upon purchase, sale, re-issue or cancellation of the Group’s own equity instruments.
3.20 Earnings per share
Basic earnings per share is computed by dividing net profit after tax for the year attributable to ordinary shareholders by the weighted average number of ordinary shares outstanding during the year, where applicable.
Diluted earnings per share amounts are calculated by dividing the net profit after tax attributable to ordinary equity holders of the Company (after adjusting for interest on the convertible preference shares) by the weighted average number of ordinary shares outstanding during the year plus the weighted average number of ordinary shares that would be issued on conversion of all potential dilutive ordinary shares into ordinary shares.
3.21 Segment information
A segment is a component determined separately by the Group which is engaged in providing products or related services (business segment) or providing products or services in a particular economic environment (geographical segment), that is subject to risks and returns that are different from those of other segments.

Audited Report
NOtes tO the CONsOLiDateD fiNaNCiaL statemeNts (continued)as at and for the year ended 31 December 2014
NOtes tO the CONsOLiDateD fiNaNCiaL statemeNts (continued)as at and for the year ended 31 December 2014 B 09 - DN/hN
102 103
3. SuMMAry Of SignificAnT AccOunTing pOlicieS (continued)
3.22 Appropriation of net profit
Net profit after tax (excluding unrealized exchange gains as at the balance sheet date) is available for appropriation to shareholders after approval in the shareholders’ meeting, and after making appropriation to reserve funds in accordance with the Group’s charter and Vietnamese regulatory requirements.
The Group maintains the following reserve funds which are appropriated from its net profit after tax as proposed by the Board of Directors and subject to approval by shareholders at the Annual General Meeting:
Financial reserve fund
This fund is set aside to protect the Group’s normal operations from business risks or losses, or to prepare for unforeseen losses or damages for objective reasons and force majeure, such as fire, economic and financial turmoil of the country or elsewhere.
Investment and development fund
This fund is set aside for use in the Group’s expansion of its operations or in-depth investments.
Bonus and welfare fund
This fund is set aside for the purpose of pecuniary rewarding and encouragement, common benefits and improvement of the employees’ benefits, and presented as a liability on the consolidated balance sheet.
Dividends
Final dividends proposed by the Board of Directors are classified as a separate allocation of undistributed earnings within the equity section of the consolidated balance sheet, until they have been approved by the shareholders at the Annual General Meeting. When these dividends have been approved by the shareholders and declared, they are recognised as a liability in the consolidated balance sheet.
3.23 Revenue recognition
Revenue is recognised to the extent that it is probable that the economic benefits will flow to the Group and the revenue can be reliably measured. Revenue is measured at the fair value of the consideration received or receivable, excluding trade discount, rebate and sales return. The following specific recognition criteria must also be met before revenue is recognised:
Sale of goods
Revenue is recognised when the significant risks and rewards of ownership of the goods have passed to the buyer, usually upon the delivery of the goods.
Rendering of services
Revenue is recognised when service is rendered and completed.
Interest
Revenue is recognised as the interest accrues (taking into account the effective yield on the asset) unless collectability is in doubt.
Dividends
Income is recognised when the Group’s entitlement as an investor to receive dividends is established.

NOtes tO the CONsOLiDateD fiNaNCiaL statemeNts (continued)as at and for the year ended 31 December 2014 B 09 - DN/hN
ANNUAL REPORT 2014
3. SuMMAry Of SignificAnT AccOunTing pOlicieS (continued)
3.24 Taxation
Current income tax
Current income tax assets and liabilities for current and prior years are measured at the amount expected to be recovered from or paid to the taxation authorities. The tax rates and tax laws used to compute the amount are those that are enacted by the balance sheet date.
Current income tax is charged or credited to the consolidated income statement, except when it relates to items recognised directly to equity, in which case it is also dealt with in the equity account.
Current income tax assets and liabilities are offset when there is a legally enforceable right for the Group to set off current tax assets against current tax liabilities and when the Group intends to settle its current tax assets and liabilities on a net basis.
Deferred tax
Deferred tax is provided using the balance sheet liability method on temporary differences at the balance sheet date between the tax base of assets and liabilities and their carrying amount for financial reporting purpose.
Deferred tax liabilities are recognised for all taxable temporary differences, except:
» where deferred tax liability arises from the initial recognition of an asset or liability in a transaction which at the time of the transaction affects neither the accounting profit nor taxable profit or loss;
» in respect of taxable temporary differences associated with investments in subsidiaries and associates, and interests in joint ventures where timing of the reversal of the temporary difference can be controlled and it is probable that the temporary difference will not reverse in the foreseeable future.
Deferred tax assets are recognised for all deductible temporary differences, carried forward unused tax credit and unused tax losses, to the extent that it is probable that taxable profits will be available against which deductible temporary differences, carried forward unused tax credit and unused tax losses can be utilised, except:
» where deferred tax asset in respect of deductible temporary difference which arises from the initial recognition of an asset or liability which at the time of the related transaction, affects neither the accounting profit nor taxable profit or loss;
» in respect of deductible temporary differences associated with investments in subsidiaries and associates, and interests in joint ventures, deferred tax assets are recognised only to the extent that it is probable that the temporary difference will reverse in the foreseeable future and taxable profits will be available against which the temporary differences can be utilised.
The carrying amount of deferred tax assets is reviewed at each balance sheet date and reduced to the extent that it is no longer probable that sufficient taxable profit will be available to allow all or part of deferred tax asset to be utilised. Previously unrecognised deferred tax assets are re-assessed at each balance sheet date and are recognised to the extent that it has become probable that future taxable profit will allow the deferred tax assets to be recovered.
Deferred tax assets and liabilities are measured at the tax rates that are expected to apply in the period when the asset is realized or the liability is settled based on tax rates and tax laws that have been enacted at the balance sheet date.
Deferred tax is charged or credited to the consolidated income statement, except when it relates to items recognised directly to equity, in which case it is also dealt with in the equity account.

Audited Report
NOtes tO the CONsOLiDateD fiNaNCiaL statemeNts (continued)as at and for the year ended 31 December 2014
NOtes tO the CONsOLiDateD fiNaNCiaL statemeNts (continued)as at and for the year ended 31 December 2014 B 09 - DN/hN
104 105
3. SuMMAry Of SignificAnT AccOunTing pOlicieS (continued)
3.24 Taxation (continued)
Deferred tax (continued)
Deferred tax assets and liabilities are offset when there is a legally enforceable right for the Group to set off current tax assets against current tax liabilities and when they relate to income taxes levied by the same taxation authority on either the same taxable entity or when the Group intends to either settle current tax liabilities and assets on a net basis or to realize the assets and settle the liabilities simultaneously, in each future period in which significant amounts of deferred tax liabilities or assets are expected to be settled or recovered.
3.25 Financial instruments
Initial recognition and presentation
Financial assets
Financial assets within the scope of Circular No. 210 /2009/TT-BTC issued by the Ministry of Finance on 6 November 2009 providing guidance for the adoption in Vietnam of the International Financial Reporting Standards on presentation and disclosures of financial instruments (“Circular 210”) are classified, for disclosures in the notes to the separate financial statements, as financial assets at fair value through profit or loss, held-to-maturity investments, loans and receivables or available-for-sale financial assets as appropriate. The Group determines the classification of its financial assets at initial recognition.
All financial assets are recognised initially at cost plus directly attributable transaction costs.
The Group’s financial assets include cash and short-term deposits, trade and other receivables, loan receivables and short-term and long-term investments.
Financial liabilities
Financial liabilities within the scope of Circular 210 are classified, for disclosures in the notes to the consolidated financial statements, as financial liabilities at fair value through profit or loss or financial liabilities measured at amortized cost as appropriate. The Group determines the classification of its financial liabilities at initial recognition.
All financial liabilities are recognised initially at cost, net of directly attributable transaction costs.
The Group’s financial liabilities include trade and other payables and loans.
Subsequent re-measurement
No subsequent re-measurement of financial instruments is currently required.
Offsetting of financial instruments
Financial assets and financial liabilities are offset and the net amount reported in the consolidated balance sheet if, and only if, there is a currently enforceable legal right to offset the recognised amounts and there is an intention to settle on a net basis, or to realize the assets and settle the liabilities simultaneously.
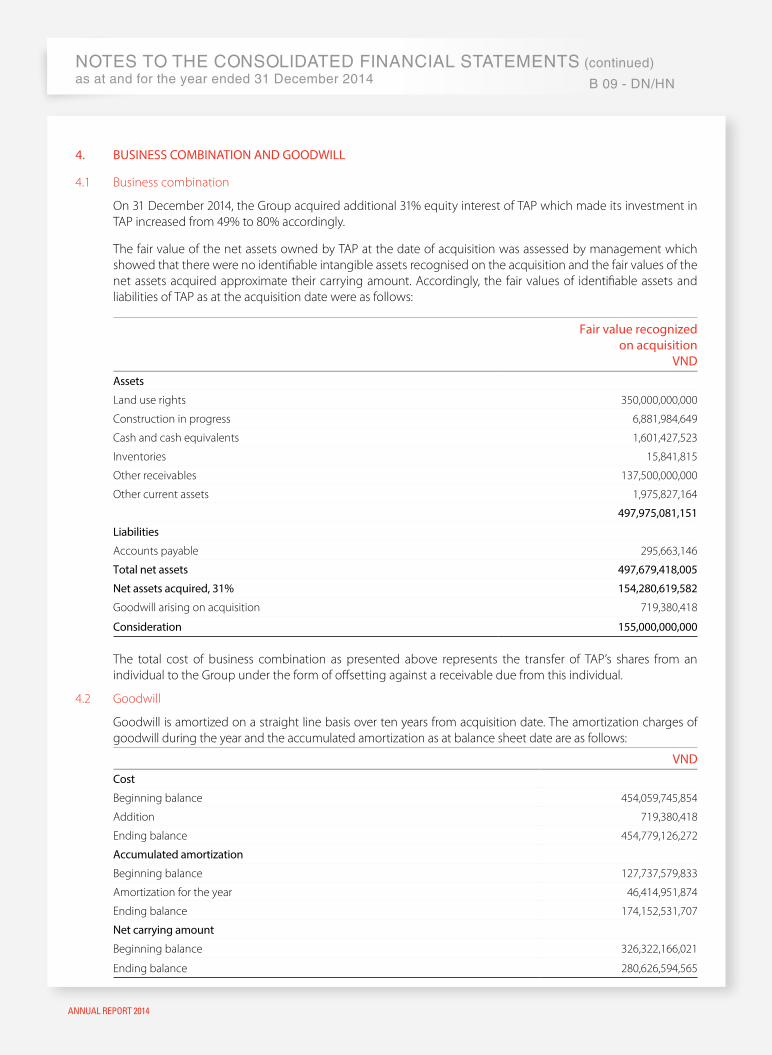
NOtes tO the CONsOLiDateD fiNaNCiaL statemeNts (continued)as at and for the year ended 31 December 2014 B 09 - DN/hN
ANNUAL REPORT 2014
4. BuSineSS cOMBinATiOn AnD gOODwill
4.1 Business combination
On 31 December 2014, the Group acquired additional 31% equity interest of TAP which made its investment in TAP increased from 49% to 80% accordingly.
The fair value of the net assets owned by TAP at the date of acquisition was assessed by management which showed that there were no identifiable intangible assets recognised on the acquisition and the fair values of the net assets acquired approximate their carrying amount. Accordingly, the fair values of identifiable assets and liabilities of TAP as at the acquisition date were as follows:
fair value recognized on acquisition
VnDAssets
Land use rights 350,000,000,000
Construction in progress 6,881,984,649
Cash and cash equivalents 1,601,427,523
Inventories 15,841,815
Other receivables 137,500,000,000
Other current assets 1,975,827,164
497,975,081,151
liabilities
Accounts payable 295,663,146
Total net assets 497,679,418,005
net assets acquired, 31% 154,280,619,582
Goodwill arising on acquisition 719,380,418
consideration 155,000,000,000
The total cost of business combination as presented above represents the transfer of TAP’s shares from an individual to the Group under the form of offsetting against a receivable due from this individual.
4.2 Goodwill
Goodwill is amortized on a straight line basis over ten years from acquisition date. The amortization charges of goodwill during the year and the accumulated amortization as at balance sheet date are as follows:
VnD cost
Beginning balance 454,059,745,854
Addition 719,380,418
Ending balance 454,779,126,272
Accumulated amortization
Beginning balance 127,737,579,833
Amortization for the year 46,414,951,874
Ending balance 174,152,531,707
net carrying amount
Beginning balance 326,322,166,021
Ending balance 280,626,594,565
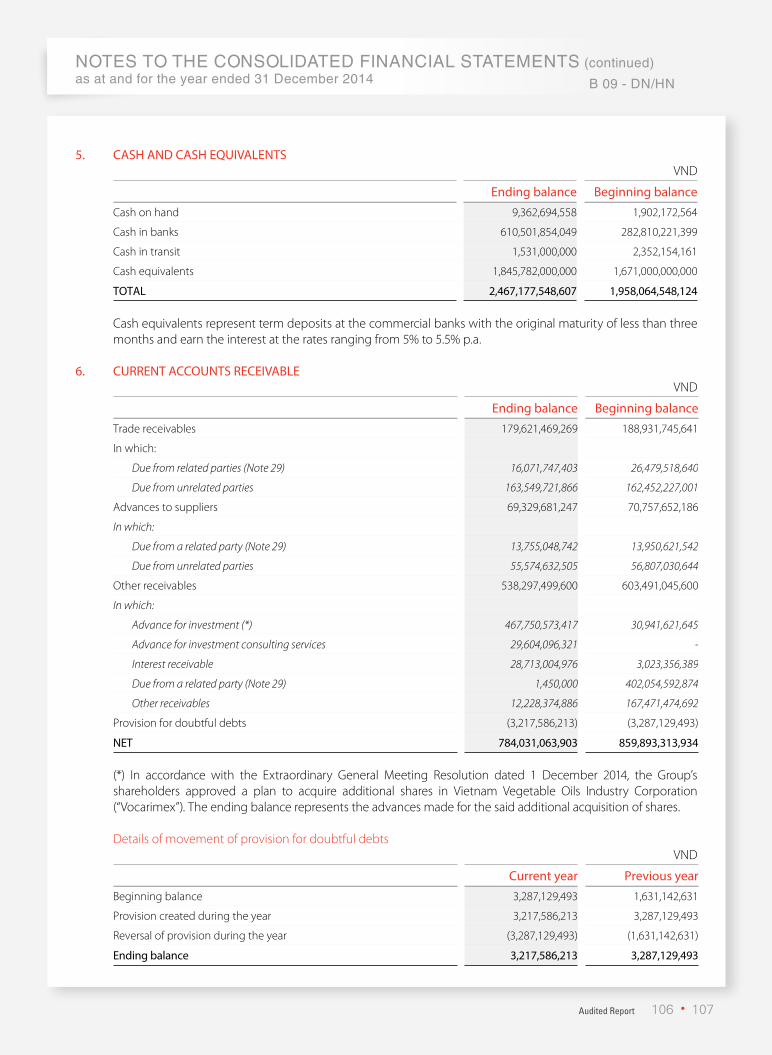
Audited Report
NOtes tO the CONsOLiDateD fiNaNCiaL statemeNts (continued)as at and for the year ended 31 December 2014
NOtes tO the CONsOLiDateD fiNaNCiaL statemeNts (continued)as at and for the year ended 31 December 2014 B 09 - DN/hN
106 107
5. cASh AnD cASh equiVAlenTSVND
ending balance Beginning balanceCash on hand 9,362,694,558 1,902,172,564
Cash in banks 610,501,854,049 282,810,221,399
Cash in transit 1,531,000,000 2,352,154,161
Cash equivalents 1,845,782,000,000 1,671,000,000,000
TOTAl 2,467,177,548,607 1,958,064,548,124
Cash equivalents represent term deposits at the commercial banks with the original maturity of less than three months and earn the interest at the rates ranging from 5% to 5.5% p.a.
6. currenT AccOunTS receiVABleVND
ending balance Beginning balanceTrade receivables 179,621,469,269 188,931,745,641
In which:
Due from related parties (Note 29) 16,071,747,403 26,479,518,640
Due from unrelated parties 163,549,721,866 162,452,227,001
Advances to suppliers 69,329,681,247 70,757,652,186
In which:
Due from a related party (Note 29) 13,755,048,742 13,950,621,542
Due from unrelated parties 55,574,632,505 56,807,030,644
Other receivables 538,297,499,600 603,491,045,600
In which:
Advance for investment (*) 467,750,573,417 30,941,621,645
Advance for investment consulting services 29,604,096,321 -
Interest receivable 28,713,004,976 3,023,356,389
Due from a related party (Note 29) 1,450,000 402,054,592,874
Other receivables 12,228,374,886 167,471,474,692
Provision for doubtful debts (3,217,586,213) (3,287,129,493)
neT 784,031,063,903 859,893,313,934
(*) In accordance with the Extraordinary General Meeting Resolution dated 1 December 2014, the Group’s shareholders approved a plan to acquire additional shares in Vietnam Vegetable Oils Industry Corporation (“Vocarimex”). The ending balance represents the advances made for the said additional acquisition of shares.
Details of movement of provision for doubtful debtsVND
current year previous yearBeginning balance 3,287,129,493 1,631,142,631
Provision created during the year 3,217,586,213 3,287,129,493
Reversal of provision during the year (3,287,129,493) (1,631,142,631)
ending balance 3,217,586,213 3,287,129,493
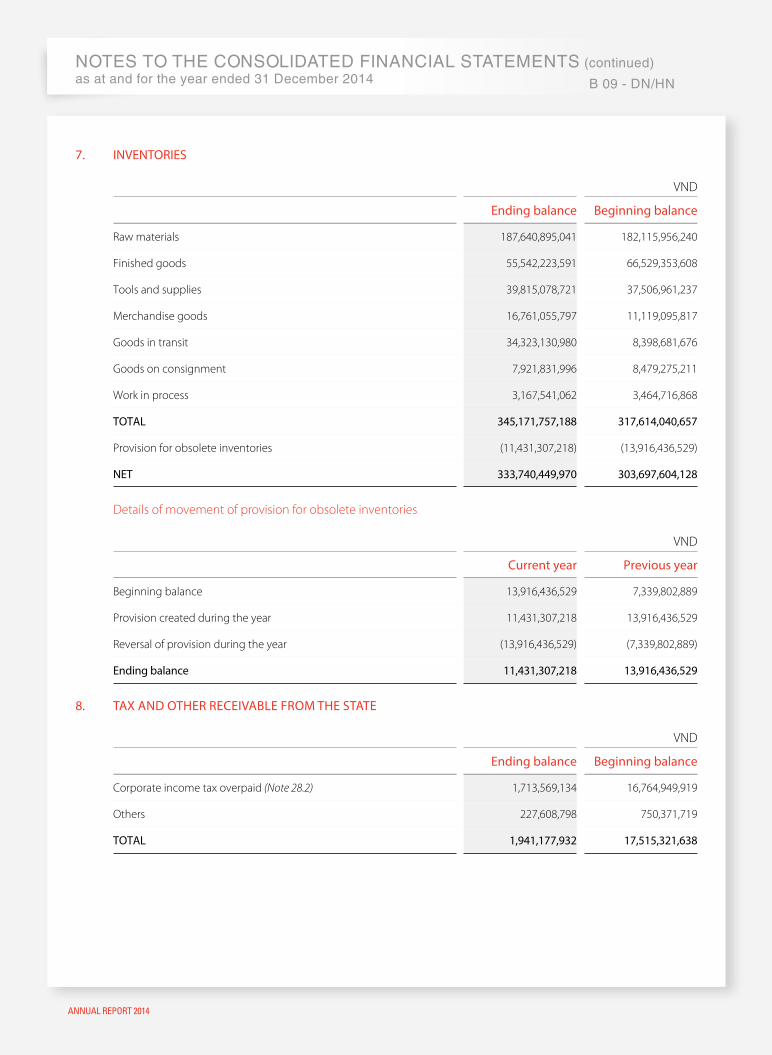
NOtes tO the CONsOLiDateD fiNaNCiaL statemeNts (continued)as at and for the year ended 31 December 2014 B 09 - DN/hN
ANNUAL REPORT 2014
7. inVenTOrieS
VND
ending balance Beginning balance
Raw materials 187,640,895,041 182,115,956,240
Finished goods 55,542,223,591 66,529,353,608
Tools and supplies 39,815,078,721 37,506,961,237
Merchandise goods 16,761,055,797 11,119,095,817
Goods in transit 34,323,130,980 8,398,681,676
Goods on consignment 7,921,831,996 8,479,275,211
Work in process 3,167,541,062 3,464,716,868
TOTAl 345,171,757,188 317,614,040,657
Provision for obsolete inventories (11,431,307,218) (13,916,436,529)
neT 333,740,449,970 303,697,604,128
Details of movement of provision for obsolete inventories
VND
current year previous year
Beginning balance 13,916,436,529 7,339,802,889
Provision created during the year 11,431,307,218 13,916,436,529
Reversal of provision during the year (13,916,436,529) (7,339,802,889)
ending balance 11,431,307,218 13,916,436,529
8. TAx AnD OTher receiVABle frOM The STATe
VND
ending balance Beginning balance
Corporate income tax overpaid (Note 28.2) 1,713,569,134 16,764,949,919
Others 227,608,798 750,371,719
TOTAl 1,941,177,932 17,515,321,638

Audited Report
NOtes tO the CONsOLiDateD fiNaNCiaL statemeNts (continued)as at and for the year ended 31 December 2014
NOtes tO the CONsOLiDateD fiNaNCiaL statemeNts (continued)as at and for the year ended 31 December 2014 B 09 - DN/hN
108 109
9. TAngiBle fixeD ASSeTS
VND
Buildingsand structures
Machinery and equipment
Means of transportation
Office equipment Total
cost
Beginning balance 411,196,221,621 1,137,682,791,711 130,235,425,057 76,031,362,629 1,755,145,801,018
Increases 5,030,225,438 150,841,092,181 14,513,991,367 7,422,495,280 177,807,804,266
In which:
Newly purchase 5,030,225,438 18,997,627,263 14,513,991,367 7,422,495,280 45,964,339,348
Transfer from construction in progress
- 131,843,464,918 - - 131,843,464,918
Reclassifications (2,837,029,738) (1,917,338,388) - 560,300,388 (4,194,067,738)
Disposal (845,131,652) (8,968,059,940) (7,060,060,219) (7,974,220,770) (24,847,472,581)
Ending balance 412,544,285,669 1,277,638,485,564 137,689,356,205 76,039,937,527 1,903,912,064,965
In which:
Fully depreciated 17,338,197,079 178,698,982,890 16,127,865,721 21,135,512,148 233,300,557,838
Accumulated depreciation
Beginning balance 116,047,106,874 606,650,251,926 64,453,600,899 48,713,052,218 835,864,011,917
Depreciation for the year 25,441,595,006 102,146,003,696 13,997,943,117 7,961,517,560 149,547,059,379
Reclassifications (1,638,629,207) (915,629,910) - 779,926,110 (1,774,333,007)
Disposal (690,025,680) (8,474,496,799) (6,290,786,727) (7,889,205,604) (23,344,514,810)
Ending balance 139,160,046,993 699,406,128,913 72,160,757,289 49,565,290,284 960,292,223,479
net carrying amount
Beginning balance 295,149,114,747 531,032,539,785 65,781,824,158 27,318,310,411 919,281,789,101
ending balance 273,384,238,676 578,232,356,651 65,528,598,916 26,474,647,243 943,619,841,486
The machinery of the Group with a carrying amount of VND 71,786,307,003 were placed as collateral for the Group’s long-term loans from the banks. Details of such loans are presented in Note 21.
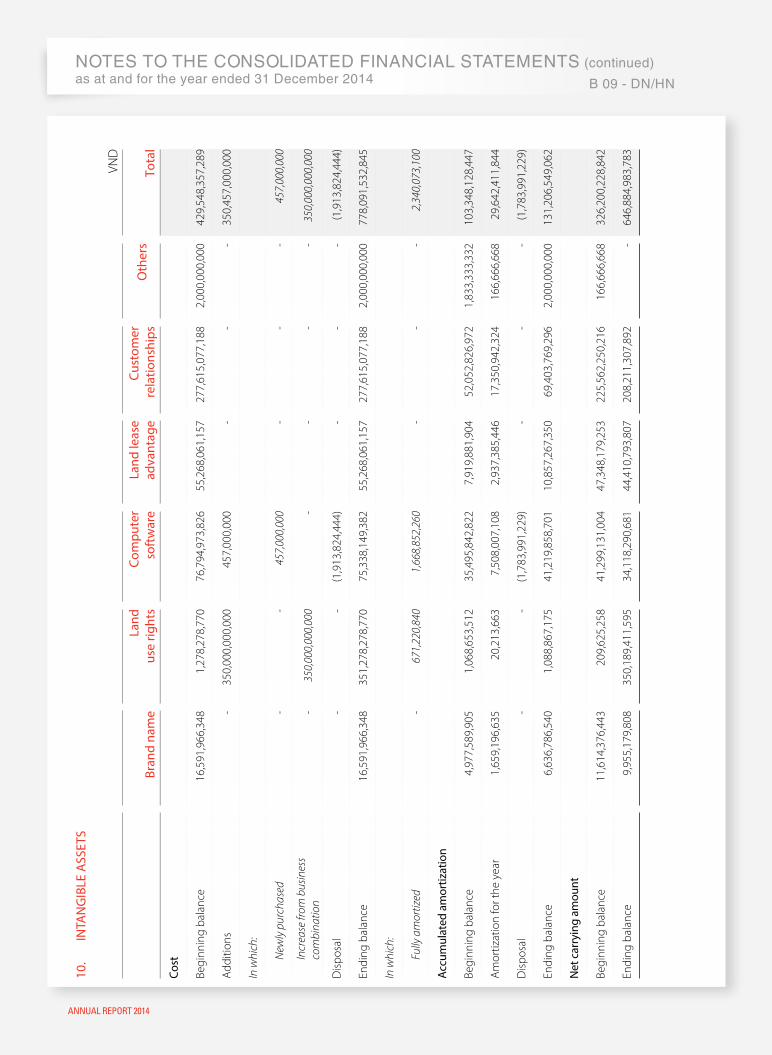
NOtes tO the CONsOLiDateD fiNaNCiaL statemeNts (continued)as at and for the year ended 31 December 2014 B 09 - DN/hN
ANNUAL REPORT 2014
10.
inTA
ng
iBle
ASS
eTS
VND
Bran
d na
me
land
us
e rig
hts
com
pute
r so
ftw
are
land
leas
e ad
vant
age
cust
omer
re
latio
nshi
psO
ther
sTo
tal
cost
Begi
nnin
g ba
lanc
e16
,591
,966
,348
1,
278,
278,
770
76,7
94,9
73,8
26
55,2
68,0
61,1
57
277,
615,
077,
188
2,00
0,00
0,00
0 42
9,54
8,35
7,28
9
Addi
tions
-
350,
000,
000,
000
457,
000,
000
- -
- 35
0,45
7,00
0,00
0
In w
hich
:
New
ly p
urch
ased
- -
457,
000,
000
- -
- 45
7,00
0,00
0
Incr
ease
from
bus
ines
s co
mbi
natio
n-
350,
000,
000,
000
--
--
350,
000,
000,
000
Disp
osal
- -
(1,9
13,8
24,4
44)
- -
- (1
,913
,824
,444
)
Endi
ng b
alan
ce16
,591
,966
,348
351,
278,
278,
770
75,3
38,1
49,3
8255
,268
,061
,157
277,
615,
077,
188
2,00
0,00
0,00
077
8,09
1,53
2,84
5
In w
hich
:
Fully
am
ortiz
ed-
671,
220,
840
1,66
8,85
2,26
0 -
- -
2,34
0,07
3,10
0
Acc
umul
ated
am
ortiz
atio
n
Begi
nnin
g ba
lanc
e4,
977,
589,
905
1,06
8,65
3,51
2 35
,495
,842
,822
7,
919,
881,
904
52,0
52,8
26,9
72
1,83
3,33
3,33
2 10
3,34
8,12
8,44
7
Amor
tizat
ion
for t
he y
ear
1,65
9,19
6,63
520
,213
,663
7,50
8,00
7,10
82,
937,
385,
446
17,3
50,9
42,3
24
166,
666,
668
29,6
42,4
11,8
44
Disp
osal
--
(1,7
83,9
91,2
29)
- -
- (1
,783
,991
,229
)
Endi
ng b
alan
ce6,
636,
786,
540
1,08
8,86
7,17
541
,219
,858
,701
10,8
57,2
67,3
5069
,403
,769
,296
2,
000,
000,
000
131,
206,
549,
062
net
car
ryin
g am
ount
Begi
nnin
g ba
lanc
e11
,614
,376
,443
20
9,62
5,25
8 41
,299
,131
,004
47
,348
,179
,253
22
5,56
2,25
0,21
6 16
6,66
6,66
8 32
6,20
0,22
8,84
2
Endi
ng b
alan
ce9,
955,
179,
808
350,
189,
411,
595
34,1
18,2
90,6
8144
,410
,793
,807
208,
211,
307,
892
- 64
6,88
4,98
3,78
3
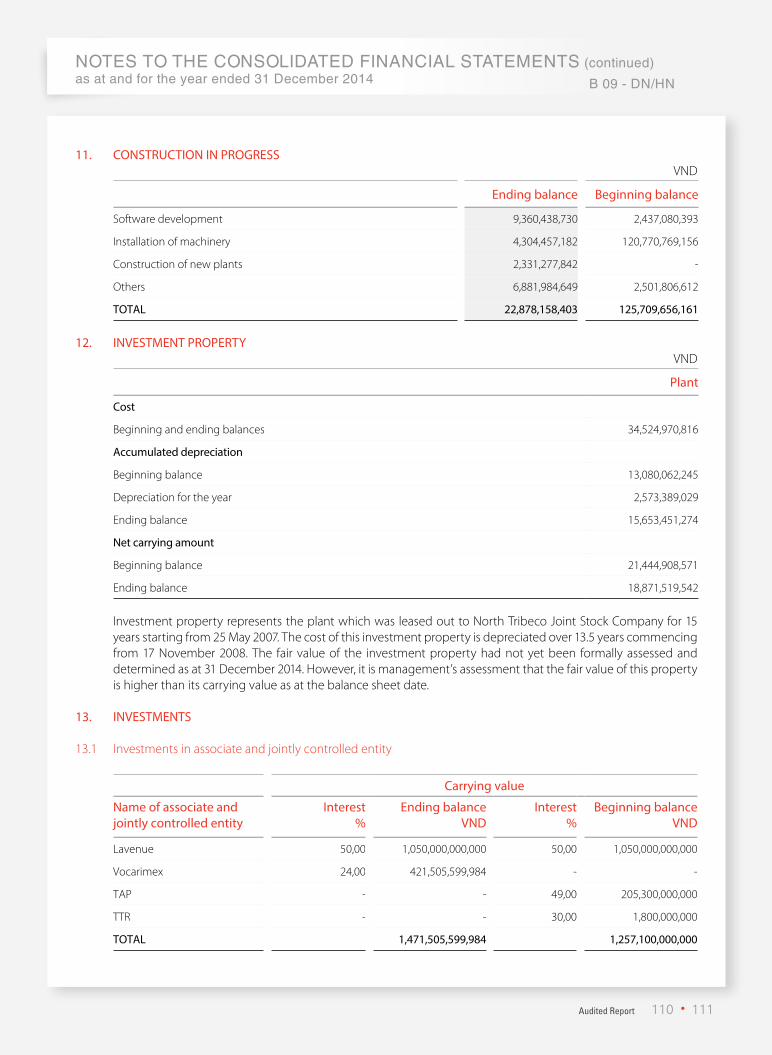
Audited Report
NOtes tO the CONsOLiDateD fiNaNCiaL statemeNts (continued)as at and for the year ended 31 December 2014
NOtes tO the CONsOLiDateD fiNaNCiaL statemeNts (continued)as at and for the year ended 31 December 2014 B 09 - DN/hN
110 111
11. cOnSTrucTiOn in prOgreSSVND
ending balance Beginning balance
Software development 9,360,438,730 2,437,080,393
Installation of machinery 4,304,457,182 120,770,769,156
Construction of new plants 2,331,277,842 -
Others 6,881,984,649 2,501,806,612
TOTAl 22,878,158,403 125,709,656,161
12. inVeSTMenT prOperTyVND
plant
cost
Beginning and ending balances 34,524,970,816
Accumulated depreciation
Beginning balance 13,080,062,245
Depreciation for the year 2,573,389,029
Ending balance 15,653,451,274
net carrying amount
Beginning balance 21,444,908,571
Ending balance 18,871,519,542
Investment property represents the plant which was leased out to North Tribeco Joint Stock Company for 15 years starting from 25 May 2007. The cost of this investment property is depreciated over 13.5 years commencing from 17 November 2008. The fair value of the investment property had not yet been formally assessed and determined as at 31 December 2014. However, it is management’s assessment that the fair value of this property is higher than its carrying value as at the balance sheet date.
13. inVeSTMenTS
13.1 Investments in associate and jointly controlled entity
carrying value
name of associate and jointly controlled entity
interest%
ending balanceVnD
interest%
Beginning balanceVnD
Lavenue 50,00 1,050,000,000,000 50,00 1,050,000,000,000
Vocarimex 24,00 421,505,599,984 - -
TAP - - 49,00 205,300,000,000
TTR - - 30,00 1,800,000,000
TOTAl 1,471,505,599,984 1,257,100,000,000

NOtes tO the CONsOLiDateD fiNaNCiaL statemeNts (continued)as at and for the year ended 31 December 2014 B 09 - DN/hN
ANNUAL REPORT 2014
13. inVeSTMenTS (continued)
13.2 Short-term investments
ending balance Beginning balance
number of shares
AmountVnD
number of shares
AmountVnD
Marketable securities, net 2,705,600 3,681,723,350
Short-term securities 206 8,299,143 95,691 4,778,276,394
In which:
Listed shares 206 8,299,143 45,691 1,278,276,394
Unlisted shares - - 50,000 3,500,000,000
Provision for diminution in value of securities (5,593,543) (1,096,553,044)
Other short-term investments, net 700,098,000,000 35,798,000,000
Short-term deposit in Vietnam Prosperity Bank (i) 700,000,000,000 -
Other short-term investments 8,098,000,000 43,798,000,000
In which:
Short-term investments in corporate bond of REE 1,000 98,000,000 1,000 98,000,000
Loans to Hung Vuong Corporation - 35,700,000,000
Other short-term investment 8,000,000,000 8,000,000,000
Provision for other short-term investments (8,000,000,000) (8,000,000,000)
net value of short-term investments 700,100,705,600 39,479,723,350
(i) The Group used this short-term deposit to mortgage and pledge for the loans from this bank obtained by Kinh Do Land Corporation.
13.3 Other long-term investments
ending balance Beginning balance
number of fund
certificate
AmountVnD
number of fund
certificate
AmountVnD
Viet capital healthcare fund 86 8,640,000,000 150 15,000,000,000
14. lOng-TerM prepAiD expenSeS
VND
ending balance Beginning balance
Land rental 60,994,973,604 71,275,053,740
Tools and consumables 42,209,715,252 47,416,744,169
Others 6,556,784,963 5,682,202,370
TOTAl 109,761,473,819 124,374,000,279
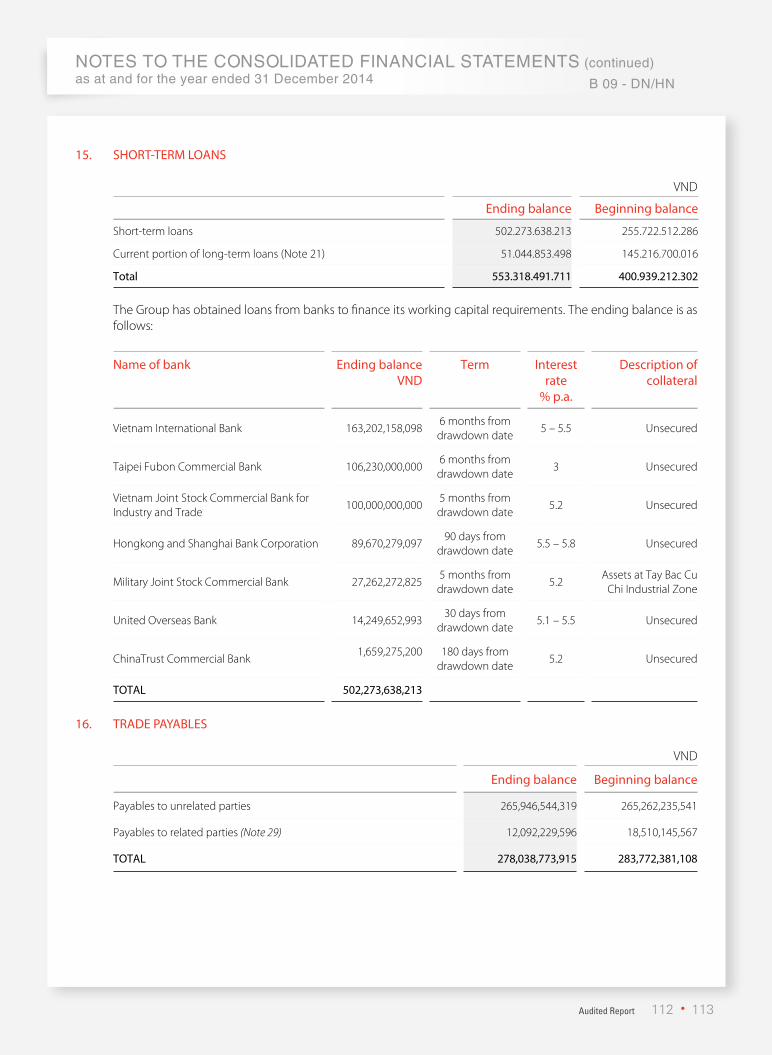
Audited Report
NOtes tO the CONsOLiDateD fiNaNCiaL statemeNts (continued)as at and for the year ended 31 December 2014
NOtes tO the CONsOLiDateD fiNaNCiaL statemeNts (continued)as at and for the year ended 31 December 2014 B 09 - DN/hN
112 113
15. ShOrT-TerM lOAnS
VND
ending balance Beginning balance
Short-term loans 502.273.638.213 255.722.512.286
Current portion of long-term loans (Note 21) 51.044.853.498 145.216.700.016
Total 553.318.491.711 400.939.212.302
The Group has obtained loans from banks to finance its working capital requirements. The ending balance is as follows:
name of bank ending balanceVnD
Term interest rate
% p.a.
Description of collateral
Vietnam International Bank 163,202,158,0986 months from drawdown date
5 – 5.5 Unsecured
Taipei Fubon Commercial Bank 106,230,000,000 6 months from drawdown date
3 Unsecured
Vietnam Joint Stock Commercial Bank for Industry and Trade
100,000,000,000 5 months from drawdown date
5.2 Unsecured
Hongkong and Shanghai Bank Corporation 89,670,279,09790 days from
drawdown date5.5 – 5.8 Unsecured
Military Joint Stock Commercial Bank 27,262,272,825 5 months from drawdown date
5.2Assets at Tay Bac Cu
Chi Industrial Zone
United Overseas Bank 14,249,652,99330 days from
drawdown date5.1 – 5.5 Unsecured
ChinaTrust Commercial Bank1,659,275,200
180 days from
drawdown date 5.2 Unsecured
TOTAl 502,273,638,213
16. TrADe pAyABleS
VND
ending balance Beginning balance
Payables to unrelated parties 265,946,544,319 265,262,235,541
Payables to related parties (Note 29) 12,092,229,596 18,510,145,567
TOTAl 278,038,773,915 283,772,381,108
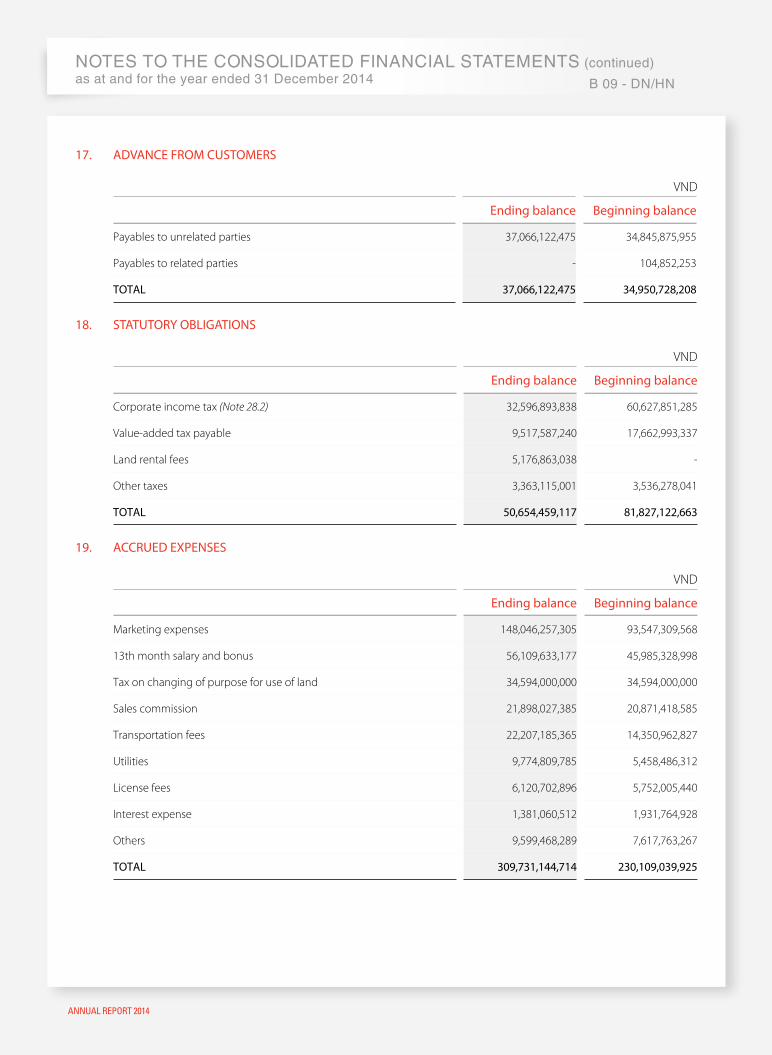
NOtes tO the CONsOLiDateD fiNaNCiaL statemeNts (continued)as at and for the year ended 31 December 2014 B 09 - DN/hN
ANNUAL REPORT 2014
17. ADVAnce frOM cuSTOMerS
VND
ending balance Beginning balance
Payables to unrelated parties 37,066,122,475 34,845,875,955
Payables to related parties - 104,852,253
TOTAl 37,066,122,475 34,950,728,208
18. STATuTOry OBligATiOnS
VND
ending balance Beginning balance
Corporate income tax (Note 28.2) 32,596,893,838 60,627,851,285
Value-added tax payable 9,517,587,240 17,662,993,337
Land rental fees 5,176,863,038 -
Other taxes 3,363,115,001 3,536,278,041
TOTAl 50,654,459,117 81,827,122,663
19. AccrueD expenSeS
VND
ending balance Beginning balance
Marketing expenses 148,046,257,305 93,547,309,568
13th month salary and bonus 56,109,633,177 45,985,328,998
Tax on changing of purpose for use of land 34,594,000,000 34,594,000,000
Sales commission 21,898,027,385 20,871,418,585
Transportation fees 22,207,185,365 14,350,962,827
Utilities 9,774,809,785 5,458,486,312
License fees 6,120,702,896 5,752,005,440
Interest expense 1,381,060,512 1,931,764,928
Others 9,599,468,289 7,617,763,267
TOTAl 309,731,144,714 230,109,039,925

Audited Report
NOtes tO the CONsOLiDateD fiNaNCiaL statemeNts (continued)as at and for the year ended 31 December 2014
NOtes tO the CONsOLiDateD fiNaNCiaL statemeNts (continued)as at and for the year ended 31 December 2014 B 09 - DN/hN
114 115
20. OTher pAyABleS
VND
ending balance Beginning balance
Payables for purchasing treasury shares 169,356,357,000 -
Unearned revenue 2,947,932,000 2,947,932,000
Dividends payable 2,181,123,780 2,435,013,268
Deposits received 2,072,218,796 2,767,218,796
Capital holding on behalf - 100,000,000,000
Others 9,705,740,910 14,207,341,990
TOTAl 186,263,372,486 122,357,506,054
In which:
Payables to related parties - 100,614,628,800
Payables to unrelated parties 186,263,372,486 21,742,877,254
21. lOng-TerM lOAnSVND
ending balance Beginning balance
Long-term loans from banks 51,044,853,498 314,102,469,716
Less:
Current portion of long-term loans (Note 15) 51,044,853,498 145,216,700,016
nOn-currenT pOrTiOn - 168,885,769,700
Details of long-term loans from banks are as follows:
name of bank ending balanceVnD
Term interest rate % p.a.
Description of collateral
United Overseas Bank - In USD 51,044,853,498 36 months from the
first withdrawal date on 8 November 2012
4 plus VNIBOR on US$
The new soft-cakes production line
amounting to VND 71,786,307,003
In which: Current portion
51,044,853,498
TOTAl 51,044,853,498
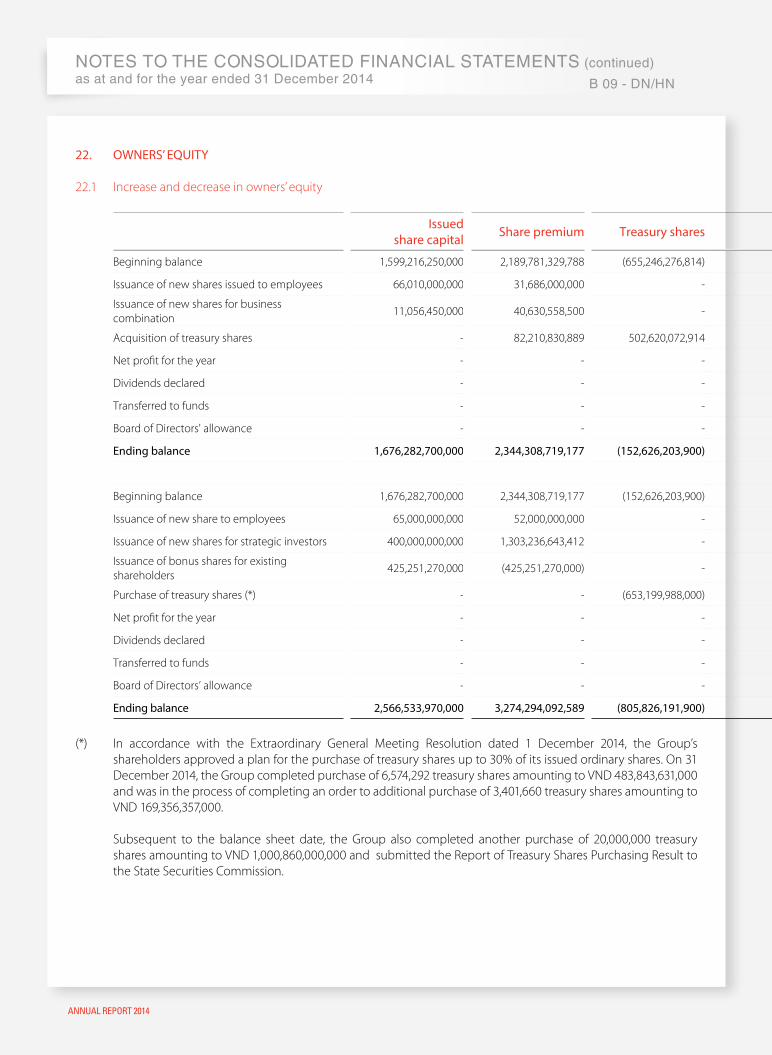
NOtes tO the CONsOLiDateD fiNaNCiaL statemeNts (continued)as at and for the year ended 31 December 2014 B 09 - DN/hN
ANNUAL REPORT 2014
22. OwnerS’ equiTy
22.1 Increase and decrease in owners’ equityVND
issued share capital Share premium Treasury shares investment and
development fundfinancial
reserve fundOther funds belonging
to owners’ equityundistributed
earnings Total
Beginning balance 1,599,216,250,000 2,189,781,329,788 (655,246,276,814) 25,370,280,515 25,792,635,752 15,909,752,661 809,449,689,144 4,010,273,661,046
Issuance of new shares issued to employees 66,010,000,000 31,686,000,000 - - - - - 97,696,000,000
Issuance of new shares for business combination
11,056,450,000 40,630,558,500 - - - - - 51,687,008,500
Acquisition of treasury shares - 82,210,830,889 502,620,072,914 - - - - 584,830,903,803
Net profit for the year - - - - - - 493,869,552,142 493,869,552,142
Dividends declared - - - - - - (318,141,106,487) (318,141,106,487)
Transferred to funds - - - - - - (31,543,480,073) (31,543,480,073)
Board of Directors' allowance - - - - - - (7,028,950,000) (7,028,950,000)
ending balance 1,676,282,700,000 2,344,308,719,177 (152,626,203,900) 25,370,280,515 25,792,635,752 15,909,752,661 946,605,704,726 4,881,643,588,931
Beginning balance 1,676,282,700,000 2,344,308,719,177 (152,626,203,900) 25,370,280,515 25,792,635,752 15,909,752,661 946,605,704,726 4,881,643,588,931
Issuance of new share to employees 65,000,000,000 52,000,000,000 - - - - - 117,000,000,000
Issuance of new shares for strategic investors 400,000,000,000 1,303,236,643,412 - - - - - 1,703,236,643,412
Issuance of bonus shares for existing shareholders
425,251,270,000 (425,251,270,000) - - - - - -
Purchase of treasury shares (*) - - (653,199,988,000) - - - - (653,199,988,000)
Net profit for the year - - - - - - 536,445,639,109 536,445,639,109
Dividends declared - - - - - - (378,772,028,000) (378,772,028,000)
Transferred to funds - - - - - - (14,817,893,820) (14,817,893,820)
Board of Directors’ allowance - - - - - - (4,928,000,000) (4,928,000,000)
ending balance 2,566,533,970,000 3,274,294,092,589 (805,826,191,900) 25,370,280,515 25,792,635,752 15,909,752,661 1,084,533,422,015 6,186,607,961,632
(*) In accordance with the Extraordinary General Meeting Resolution dated 1 December 2014, the Group’s shareholders approved a plan for the purchase of treasury shares up to 30% of its issued ordinary shares. On 31 December 2014, the Group completed purchase of 6,574,292 treasury shares amounting to VND 483,843,631,000 and was in the process of completing an order to additional purchase of 3,401,660 treasury shares amounting to VND 169,356,357,000.
Subsequent to the balance sheet date, the Group also completed another purchase of 20,000,000 treasury shares amounting to VND 1,000,860,000,000 and submitted the Report of Treasury Shares Purchasing Result to the State Securities Commission.
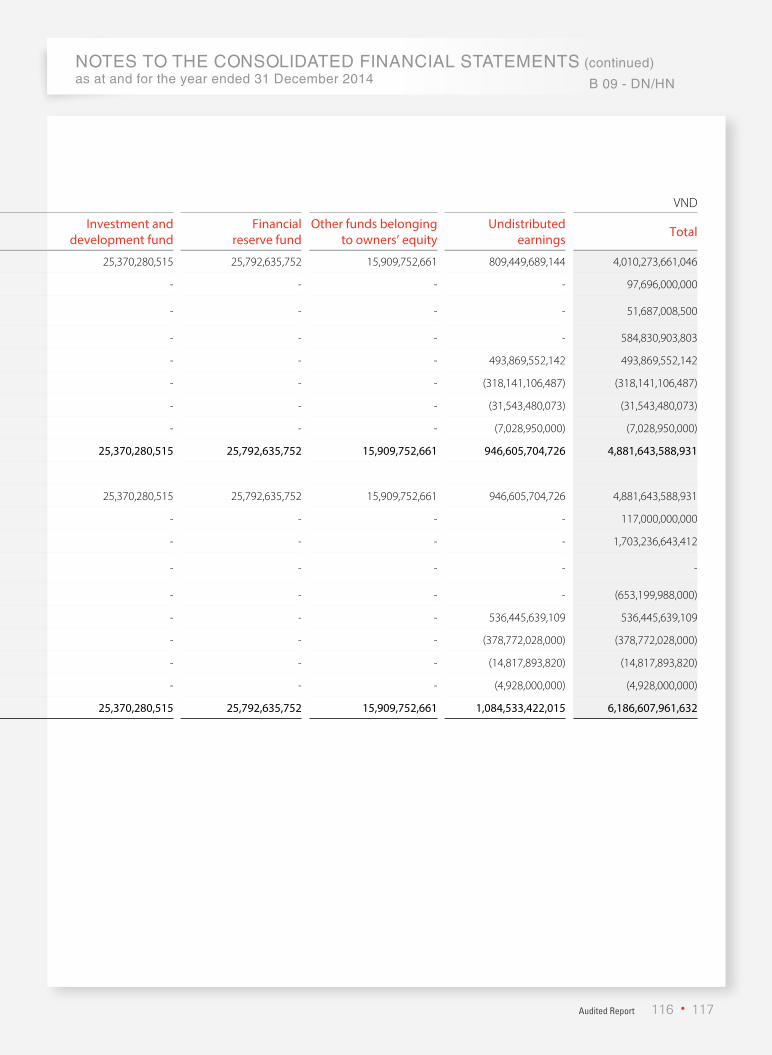
Audited Report
NOtes tO the CONsOLiDateD fiNaNCiaL statemeNts (continued)as at and for the year ended 31 December 2014
NOtes tO the CONsOLiDateD fiNaNCiaL statemeNts (continued)as at and for the year ended 31 December 2014 B 09 - DN/hN
116 117
22. OwnerS’ equiTy
22.1 Increase and decrease in owners’ equityVND
issued share capital Share premium Treasury shares investment and
development fundfinancial
reserve fundOther funds belonging
to owners’ equityundistributed
earnings Total
Beginning balance 1,599,216,250,000 2,189,781,329,788 (655,246,276,814) 25,370,280,515 25,792,635,752 15,909,752,661 809,449,689,144 4,010,273,661,046
Issuance of new shares issued to employees 66,010,000,000 31,686,000,000 - - - - - 97,696,000,000
Issuance of new shares for business combination
11,056,450,000 40,630,558,500 - - - - - 51,687,008,500
Acquisition of treasury shares - 82,210,830,889 502,620,072,914 - - - - 584,830,903,803
Net profit for the year - - - - - - 493,869,552,142 493,869,552,142
Dividends declared - - - - - - (318,141,106,487) (318,141,106,487)
Transferred to funds - - - - - - (31,543,480,073) (31,543,480,073)
Board of Directors' allowance - - - - - - (7,028,950,000) (7,028,950,000)
ending balance 1,676,282,700,000 2,344,308,719,177 (152,626,203,900) 25,370,280,515 25,792,635,752 15,909,752,661 946,605,704,726 4,881,643,588,931
Beginning balance 1,676,282,700,000 2,344,308,719,177 (152,626,203,900) 25,370,280,515 25,792,635,752 15,909,752,661 946,605,704,726 4,881,643,588,931
Issuance of new share to employees 65,000,000,000 52,000,000,000 - - - - - 117,000,000,000
Issuance of new shares for strategic investors 400,000,000,000 1,303,236,643,412 - - - - - 1,703,236,643,412
Issuance of bonus shares for existing shareholders
425,251,270,000 (425,251,270,000) - - - - - -
Purchase of treasury shares (*) - - (653,199,988,000) - - - - (653,199,988,000)
Net profit for the year - - - - - - 536,445,639,109 536,445,639,109
Dividends declared - - - - - - (378,772,028,000) (378,772,028,000)
Transferred to funds - - - - - - (14,817,893,820) (14,817,893,820)
Board of Directors’ allowance - - - - - - (4,928,000,000) (4,928,000,000)
ending balance 2,566,533,970,000 3,274,294,092,589 (805,826,191,900) 25,370,280,515 25,792,635,752 15,909,752,661 1,084,533,422,015 6,186,607,961,632
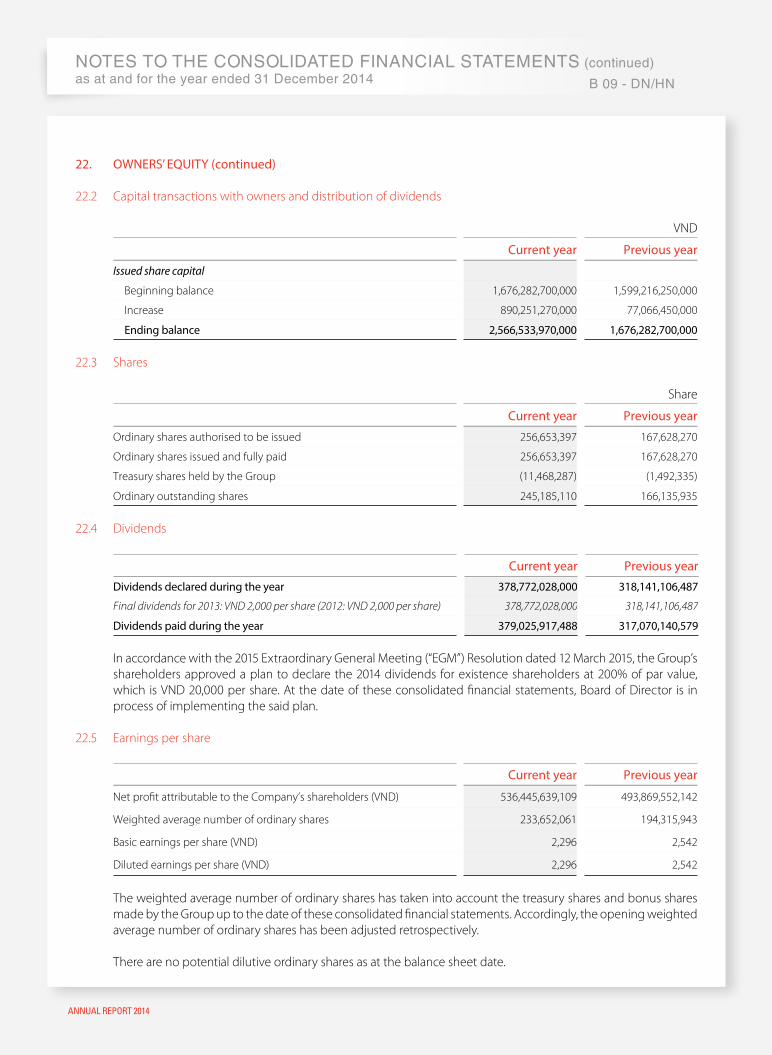
NOtes tO the CONsOLiDateD fiNaNCiaL statemeNts (continued)as at and for the year ended 31 December 2014 B 09 - DN/hN
ANNUAL REPORT 2014
22. OwnerS’ equiTy (continued)
22.2 Capital transactions with owners and distribution of dividends
VND
current year previous year
Issued share capital
Beginning balance 1,676,282,700,000 1,599,216,250,000
Increase 890,251,270,000 77,066,450,000
ending balance 2,566,533,970,000 1,676,282,700,000
22.3 Shares
Share
current year previous year
Ordinary shares authorised to be issued 256,653,397 167,628,270
Ordinary shares issued and fully paid 256,653,397 167,628,270
Treasury shares held by the Group (11,468,287) (1,492,335)
Ordinary outstanding shares 245,185,110 166,135,935
22.4 Dividends
current year previous year
Dividends declared during the year 378,772,028,000 318,141,106,487
Final dividends for 2013: VND 2,000 per share (2012: VND 2,000 per share) 378,772,028,000 318,141,106,487
Dividends paid during the year 379,025,917,488 317,070,140,579
In accordance with the 2015 Extraordinary General Meeting (“EGM”) Resolution dated 12 March 2015, the Group’s shareholders approved a plan to declare the 2014 dividends for existence shareholders at 200% of par value, which is VND 20,000 per share. At the date of these consolidated financial statements, Board of Director is in process of implementing the said plan.
22.5 Earnings per share
current year previous year
Net profit attributable to the Company’s shareholders (VND) 536,445,639,109 493,869,552,142
Weighted average number of ordinary shares 233,652,061 194,315,943
Basic earnings per share (VND) 2,296 2,542
Diluted earnings per share (VND) 2,296 2,542
The weighted average number of ordinary shares has taken into account the treasury shares and bonus shares made by the Group up to the date of these consolidated financial statements. Accordingly, the opening weighted average number of ordinary shares has been adjusted retrospectively.
There are no potential dilutive ordinary shares as at the balance sheet date.
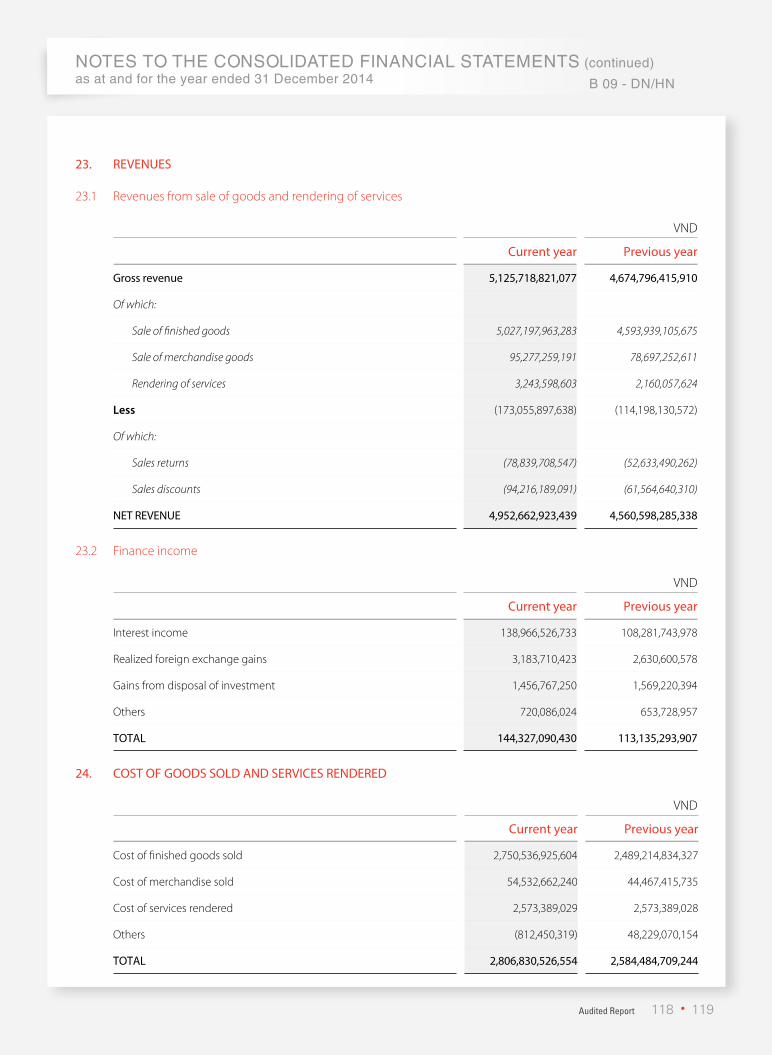
Audited Report
NOtes tO the CONsOLiDateD fiNaNCiaL statemeNts (continued)as at and for the year ended 31 December 2014
NOtes tO the CONsOLiDateD fiNaNCiaL statemeNts (continued)as at and for the year ended 31 December 2014 B 09 - DN/hN
118 119
23. reVenueS
23.1 Revenues from sale of goods and rendering of services
VND
current year previous year
gross revenue 5,125,718,821,077 4,674,796,415,910
Of which:
Sale of finished goods 5,027,197,963,283 4,593,939,105,675
Sale of merchandise goods 95,277,259,191 78,697,252,611
Rendering of services 3,243,598,603 2,160,057,624
Less (173,055,897,638) (114,198,130,572)
Of which:
Sales returns (78,839,708,547) (52,633,490,262)
Sales discounts (94,216,189,091) (61,564,640,310)
neT reVenue 4,952,662,923,439 4,560,598,285,338
23.2 Finance income
VND
current year previous year
Interest income 138,966,526,733 108,281,743,978
Realized foreign exchange gains 3,183,710,423 2,630,600,578
Gains from disposal of investment 1,456,767,250 1,569,220,394
Others 720,086,024 653,728,957
TOTAl 144,327,090,430 113,135,293,907
24. cOST Of gOODS SOlD AnD SerViceS renDereD
VND
current year previous year
Cost of finished goods sold 2,750,536,925,604 2,489,214,834,327
Cost of merchandise sold 54,532,662,240 44,467,415,735
Cost of services rendered 2,573,389,029 2,573,389,028
Others (812,450,319) 48,229,070,154
TOTAl 2,806,830,526,554 2,584,484,709,244

NOtes tO the CONsOLiDateD fiNaNCiaL statemeNts (continued)as at and for the year ended 31 December 2014 B 09 - DN/hN
ANNUAL REPORT 2014
25. finAnce expenSeS
VND
current year previous yearInterest expense 20,731,742,626 43,391,810,398
Realized foreign exchange loss 3,720,588,624 3,139,219,009
Unrealized foreign exchange loss 1,141,136,920 2,258,288,851
Finance consulting fees - 34,328,987,760
Reversal of provision for investment diminution - (15,616,014,863)
Others 592,028,756 6,014,649,072
TOTAl 26,185,496,926 73,516,940,227
26. OTher incOMe AnD expenSeS
VND
current year previous year
Other income 63,331,885,612 30,372,643,049
Proceeds on land use rights 31,884,849,516 -
Sale of scrap materials 12,150,033,146 12,340,588,017
Rental income 3,723,456,727 -
Proceeds on disposal of fixed assets 2,871,533,727 7,167,957,959
Others 12,702,012,496 10,864,097,073
Other expenses (32,196,031,460) (34,690,086,601)
Expenses on disposal of fixed assets (1,632,790,986) (5,765,583,605)
Expenses on disposal of land use rights (8,356,352,539) -
Disposal of scrap materials (8,495,782,014) (6,707,431,121)
Penalty (561,161,960) (4,243,636,059)
Others (13,149,943,961) (17,973,435,816)
neT 31,135,854,152 (4,317,443,552)
27. prODucTiOn AnD OperATing cOSTS
VND
current year previous year
Cost of merchandise goods 23,601,343,871 44,467,415,735
Raw materials 2,186,929,212,008 1,986,466,175,919
Labour costs 797,399,900,824 665,734,246,822
Depreciation and amortization (Notes 4, 9, 10 and 12) 228,177,812,126 230,052,975,960
Expenses from external services 683,503,647,577 581,591,958,146
Other expenses 523,459,085,845 477,497,756,620
TOTAl 4,443,071,002,251 3,985,810,529,202

Audited Report
NOtes tO the CONsOLiDateD fiNaNCiaL statemeNts (continued)as at and for the year ended 31 December 2014
NOtes tO the CONsOLiDateD fiNaNCiaL statemeNts (continued)as at and for the year ended 31 December 2014 B 09 - DN/hN
120 121
28. cOrpOrATe incOMe TAx
The Company and its subsidiaries, except for KDBD, have the obligation to pay corporate income tax (“CIT”) at the rate of 22% of taxable profits (2013: 25%).
KDBD has the obligation to pay the CIT at the rate of 15% of taxable profits for twelve (12) years from commencement of its operations, and 25% for the years thereafter. KDBD is entitled to an exemption from CIT for three (3) years commencing from the first year of earning profits (year 2008) and a 50% reduction from CIT for the following seven (7) years.
The tax returns filed by the Company and its subsidiaries are subject to examination by the tax authorities. Because the application of tax laws and regulations to many types of transactions is susceptible to varying interpretations, amounts reported in the consolidated financial statements could change at a later date upon final determination by the tax authorities.
28.1 CIT expenseVND
current year previous year
Current income tax expense 121,010,750,584 118,676,164,588
Deferred tax expense 4,823,411,040 7,148,912,968
TOTAl 125,834,161,624 125,825,077,556
28.2 Current tax
The current CIT payable is based on taxable profit for the current year. Taxable profit differs from profit as reported in the consolidated income statement because it excludes items of income or expense that are taxable or deductible in other years and it further excludes items that are not taxable or deductible. The Group’s liability for current tax is calculated using tax rates that have been enacted by the balance sheet date.
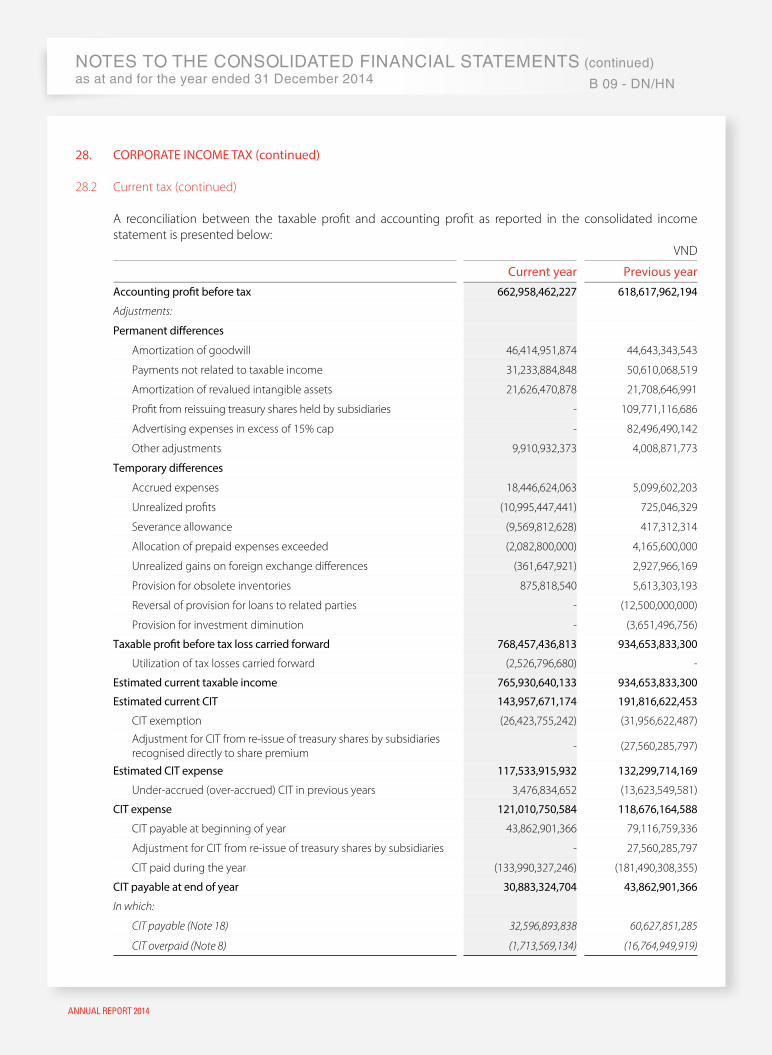
NOtes tO the CONsOLiDateD fiNaNCiaL statemeNts (continued)as at and for the year ended 31 December 2014 B 09 - DN/hN
ANNUAL REPORT 2014
28. cOrpOrATe incOMe TAx (continued)
28.2 Current tax (continued)
A reconciliation between the taxable profit and accounting profit as reported in the consolidated income statement is presented below:
VND
current year previous yearAccounting profit before tax 662,958,462,227 618,617,962,194
Adjustments:
permanent differences
Amortization of goodwill 46,414,951,874 44,643,343,543
Payments not related to taxable income 31,233,884,848 50,610,068,519
Amortization of revalued intangible assets 21,626,470,878 21,708,646,991
Profit from reissuing treasury shares held by subsidiaries - 109,771,116,686
Advertising expenses in excess of 15% cap - 82,496,490,142
Other adjustments 9,910,932,373 4,008,871,773
Temporary differences
Accrued expenses 18,446,624,063 5,099,602,203
Unrealized profits (10,995,447,441) 725,046,329
Severance allowance (9,569,812,628) 417,312,314
Allocation of prepaid expenses exceeded (2,082,800,000) 4,165,600,000
Unrealized gains on foreign exchange differences (361,647,921) 2,927,966,169
Provision for obsolete inventories 875,818,540 5,613,303,193
Reversal of provision for loans to related parties - (12,500,000,000)
Provision for investment diminution - (3,651,496,756)
Taxable profit before tax loss carried forward 768,457,436,813 934,653,833,300
Utilization of tax losses carried forward (2,526,796,680) -
estimated current taxable income 765,930,640,133 934,653,833,300
estimated current ciT 143,957,671,174 191,816,622,453
CIT exemption (26,423,755,242) (31,956,622,487)
Adjustment for CIT from re-issue of treasury shares by subsidiaries recognised directly to share premium
- (27,560,285,797)
estimated ciT expense 117,533,915,932 132,299,714,169
Under-accrued (over-accrued) CIT in previous years 3,476,834,652 (13,623,549,581)
ciT expense 121,010,750,584 118,676,164,588
CIT payable at beginning of year 43,862,901,366 79,116,759,336
Adjustment for CIT from re-issue of treasury shares by subsidiaries - 27,560,285,797
CIT paid during the year (133,990,327,246) (181,490,308,355)
ciT payable at end of year 30,883,324,704 43,862,901,366
In which:
CIT payable (Note 18) 32,596,893,838 60,627,851,285
CIT overpaid (Note 8) (1,713,569,134) (16,764,949,919)

Audited Report
NOtes tO the CONsOLiDateD fiNaNCiaL statemeNts (continued)as at and for the year ended 31 December 2014
NOtes tO the CONsOLiDateD fiNaNCiaL statemeNts (continued)as at and for the year ended 31 December 2014 B 09 - DN/hN
122 123
28. cOrpOrATe incOMe TAx (continued)
28.3 Deferred tax
The Group recognized deferred CIT as at the balance sheet date as follows:
VND
consolidated balance sheet consolidated income statement
ending balance
Beginning balance
current year
previous year
Accrued expense 26,431,040,676 25,203,852,708 1,227,187,968 (6,632,106,491)
Severance allowance 6,811,318,348 9,089,061,831 (2,277,743,483) (947,721,791)
Provision for other investment 1,760,000,000 1,760,000,000 - 1,760,000,000
Provision for obsolete inventories 773,559,185 778,982,791 (5,423,606) 346,403,370
Allocation of prepaid expenses exceeded 458,216,000 916,432,000 (458,216,000) 916,432,000
Unrealized profits (353,793,089) 2,656,344,922 (3,010,138,011) (180,967,271)
Unrealized gains on foreign exchange differences
(88,989,691) (7,979,377) (81,010,314) 731,141,329
Depreciation 32,250,131 250,317,725 (218,067,594) (62,482,202)
Provision for investment diminution - - - (3,125,000,000)
Provision for investment diminution at subsidiary level
- - - 45,388,088
TOTAl 35,823,601,560 40,647,012,600 (4,823,411,040) (7,148,912,968)
29. TrAnSAcTiOnS wiTh relATeD pArTieS
Related parties transactions include all transactions undertaken with other companies to which the Group is related, either through the investor/investee relationship or because they share a common investor and thus are considered to be a part of the same corporate group.
Significant transactions with related parties during the year were as follows: VND
related party relationship Transaction Amount
Kinh Do Saigon Bakery Joint Stock Corporation
Related party
Sale of finished goods 3,274,426,815
Service rendered 449,891,444
Sales of raw and packaging materials, tools and supplies
384,343,524
Kinh Do Investment Co., Ltd. Related party Loan collection 286,000,000,000
Short term loan to 286,000,000,000
Loan interest receivable 3,983,388,889
License fees 44,201,853,036
Hung Vuong Corporation Related partyLoan interest receivable 966,875,000
Loan collection 35,700,000,000
Tung Yoan Co., Ltd. Related partyPurchase of Packing 32,667,011,738
Expenses related to printing cost 552,000,000

NOtes tO the CONsOLiDateD fiNaNCiaL statemeNts (continued)as at and for the year ended 31 December 2014 B 09 - DN/hN
ANNUAL REPORT 2014
29. TrAnSAcTiOnS wiTh relATeD pArTieS (continued) Remuneration to members of the Board of Directors, management and the Board of Supervision during the year was as follows:
VND
current year previous year
Board of Directors
Allowance and bonus 11,365,239,465 7,016,950,000
Management
Salaries and bonus 32,570,435,851 25,407,190,000
Board of Supervision
Allowance and bonus 168,150,000 174,000,000
TOTAl 44,103,825,316 32,598,140,000
Amounts due from and due to related parties at the balance sheet date, other than the investments disclosed in Note 13, were as follows:
VND
related party relationship Transaction receivable(payable)
Trade receivables
Kinh Do Saigon Bakery Joint Stock Corporation
Related partySale of finished goods, materials, tools and supplies
14,596,240,609
Kinh Do Land Corporation Related party Sale of finished goods1,475,506,794
16,071,747,403
Other receivable
Kinh Do Investment Co., Ltd. Related party Payment on behalf 1,450,000
Advance to supplier
Kinh Do Investment Co., Ltd. Related party Advance for license fees 13,755,048,742
Trade payables
Tong Yuan Co., Ltd. Related party Purchase of packaging (11,288,817,589)
Kinh Do Saigon Bakery Joint Stock Corporation
Related party Purchase of finished goods(803,412,007)
(12,092,229,596)

Audited Report
NOtes tO the CONsOLiDateD fiNaNCiaL statemeNts (continued)as at and for the year ended 31 December 2014
NOtes tO the CONsOLiDateD fiNaNCiaL statemeNts (continued)as at and for the year ended 31 December 2014 B 09 - DN/hN
124 125
30. cOMMiTMenTS
Operating lease commitment The Group leases land, offices and warehouses under operating lease arrangements. The minimum lease commitment as at the balance sheet date under the operating lease agreements is as follows:
VND
ending balance Beginning balance
Within one year 69,897,808,665 54,810,143,295
After one year but not more than five years 207,269,912,080 168,147,573,881
More than five years 193,971,673,629 170,712,526,759
TOTAl 471,139,394,374 393,670,243,935
Capital contribution obligation
As at the balance sheet date, the Group had outstanding capital contribution obligation to a subsidiary amounting to VND 37,500,000,000.
31. finAnciAl riSK MAnAgeMenT OBJecTiVeS AnD pOlicieS
The Group’s principal financial liabilities comprise loans and debts, trade and other payables. The main purpose of these financial liabilities is to finance the Group’s operations. The Group has loans, receivables, trade and other receivables, and cash and short-term deposits that arise directly from its operations. The Group does not hold or issue derivative financial instruments.
The Group is exposed to market risk, credit risk and liquidity risk.
Risk management is integral to the whole business of the Group. The Group has a system of controls in place to create an acceptable balance between the cost of risks occurring and the cost of managing the risks. The management continually monitors the Group’s risk management process to ensure that an appropriate balance between risk and control is achieved.
Management reviews and agrees on the policies for managing each of these risks which are summarized below:
Market risk
Market risk is the risk that the fair value of future cash flows of a financial instrument will fluctuate because of changes in market prices. Market prices comprise four types of risk: interest rate risk, currency risk, commodity price risk and other price risk, such as equity price risk. Financial instruments affected by market risk include loans and borrowings, deposits and investments.
The sensitivity analyses in the following sections relate to the Group’s consolidated financial position as at the balance sheet date.
The sensitivity analyses have been prepared on the basis that the amount of net debt, the ratio of fixed to floating interest rates of the debt and the proportion of financial instruments in foreign currencies are all constant.
In calculating the sensitivity analyses, management assumed that the consolidated balance sheet relates to financial instruments and the sensitivity of the relevant income statement item is the effect of the assumed changes in respective market risks. This is based on the financial assets and financial liabilities held at the balance sheet date.

NOtes tO the CONsOLiDateD fiNaNCiaL statemeNts (continued)as at and for the year ended 31 December 2014 B 09 - DN/hN
ANNUAL REPORT 2014
31. finAnciAl riSK MAnAgeMenT OBJecTiVeS AnD pOlicieS (continued)
Market risk (continued)
Interest rate risk
Interest rate risk is the risk that the fair value or future cash flows of a financial instrument will fluctuate because of changes in market interest rates. The Group is exposed to market risk for changes in interest rate relates primarily to the Group’s short-term investments including cash and short-term deposits and its loans.
The Group manages interest rate risk by looking at the competitive structure of the market to obtain rates which are favourable for its purposes within its risk management limits.
Interest rate sensitivity
With all other variables held constant, the following table demonstrates the sensitivity to a reasonably possible change in interest rates on that portion of loans and deposits and its effect to the Group’s profit before tax:
increase/decrease in basis points
effect on profit before tax
VnDcurrent year
USD +100 586,882,667
VND +200 37,815,224,019
USD -100 (586,882,667)
VND -200 (37,815,224,019)
previous year
USD +100 (2,439,546,151)
VND +300 48,965,734,669
USD -100 2,439,546,151
VND -300 (48,965,734,669)
The assumed movement in basis points for interest rate sensitivity analysis is based on the currently observable market environment.
Foreign currency risk
Foreign currency risk is the risk that the fair value or future cash flows of a financial instrument will fluctuate because of changes in foreign exchange rates. The Group is exposed to the risk of changes in foreign exchange rates relates primarily to the Group’s operating activities.
The Group is not exposed to foreign currency risk as most of the Group’s operating activities, which are relating to purchases and sales of goods, are denominated in VND, the Group’s accounting currency. The Group does not employ any derivative financial instruments to hedge its foreign currency exposure.
Equity price risk
The Group’s listed and unlisted equity securities are susceptible to market price risk arising from uncertainty about future values of the investment securities. The Group manages equity price risk by placing a limit on equity investments. The Group’s Board of Directors reviews and approves all equity investment decisions.
At the balance sheet date, the Group is not exposed to significant equity securities price risk.
Audited Report
NOtes tO the CONsOLiDateD fiNaNCiaL statemeNts (continued)as at and for the year ended 31 December 2014
NOtes tO the CONsOLiDateD fiNaNCiaL statemeNts (continued)as at and for the year ended 31 December 2014 B 09 - DN/hN
126 127
31. finAnciAl riSK MAnAgeMenT OBJecTiVeS AnD pOlicieS (continued)
Commodity price risk
The Group is exposed to commodity price risk in relation to purchase of certain commodities. The Group manages its commodity price risk by keeping close watch on relevant information and situation of commodity market in order to properly manage timing of purchases, production plans and inventories level. The Group does not employ any derivative financial instruments to hedge its commodity price risk.
Credit risk
Credit risk is the risk that counterparty will not meet its obligations under a financial instrument or customer contract, leading to a financial loss. The Group is exposed to credit risk from its operating activities (primarily for trade receivables) and from its financing activities, including deposits with banks, short-term investments and other financial instruments.
Trade receivables
Customer credit risk is managed by the Group based on its established policy, procedures and control to minimise credit risk at an acceptable level. In view of the aforementioned and the fact that the Group’s trade receivables relate to a large number of diversified customers, management evaluates that there is no significant concentration of credit risk.
Bank deposits
The Group’s bank balances are mainly maintained with well-known banks in Vietnam. Credit risk from balances with banks is managed by the Group’s treasury department in accordance with its policy. The Group’s maximum exposure to credit risk for the components of the consolidated balance sheet at each reporting dates are the carrying amounts. Management evaluates the concentration of credit risk in respect to bank deposit as low.

NOtes tO the CONsOLiDateD fiNaNCiaL statemeNts (continued)as at and for the year ended 31 December 2014 B 09 - DN/hN
ANNUAL REPORT 2014
31.
fin
An
ciA
l ri
SK M
An
AgeM
enT
OBJ
ecTi
VeS
An
D p
Oli
cieS
(con
tinue
d)
Cred
it ris
k (c
ontin
ued)
Oth
er fi
nanc
ial in
stru
men
ts
Oth
er fi
nanc
ial i
nstr
umen
ts o
f the
Gro
up m
ainl
y in
clud
e tr
ade
and
othe
r rec
eiva
bles
and
man
agem
ent e
valu
ates
all
finan
cial
ass
ets a
re n
eith
er p
ast d
ue
nor i
mpa
ired
as th
ey re
late
d to
reco
gniz
ed a
nd c
redi
twor
thy
coun
terp
artie
s exc
ept f
or th
e fo
llow
ing
rece
ivab
le w
hich
are
pas
t due
but
not
impa
ired
as
at th
e ba
lanc
e sh
eet d
ate:
VND
Tota
ln
eith
er p
ast
due
nor i
mpa
ired
past
due
but
not
impa
ired
< 90
day
s91
–180
day
s18
1–21
0 da
ys>
210
days
endi
ng b
alan
ce
Trad
e re
ceiv
able
s and
oth
er re
ceiv
able
s71
4,70
1,38
2,65
662
9,21
2,08
3,24
959
,424
,878
,913
5,59
8,28
7,81
12,
218,
264,
122
18,2
47,8
68,5
61
Begi
nnin
g ba
lanc
e
Trad
e re
ceiv
able
s and
oth
er re
ceiv
able
s79
2,42
2,79
1,24
1 69
3,42
5,59
6,33
1 62
,623
,704
,495
9,
720,
926,
085
1,07
1,55
6,89
0 25
,581
,007
,440
Loan
s to
rela
ted
part
ies
35,
700,
000,
000
35,
700,
000,
000
--
--
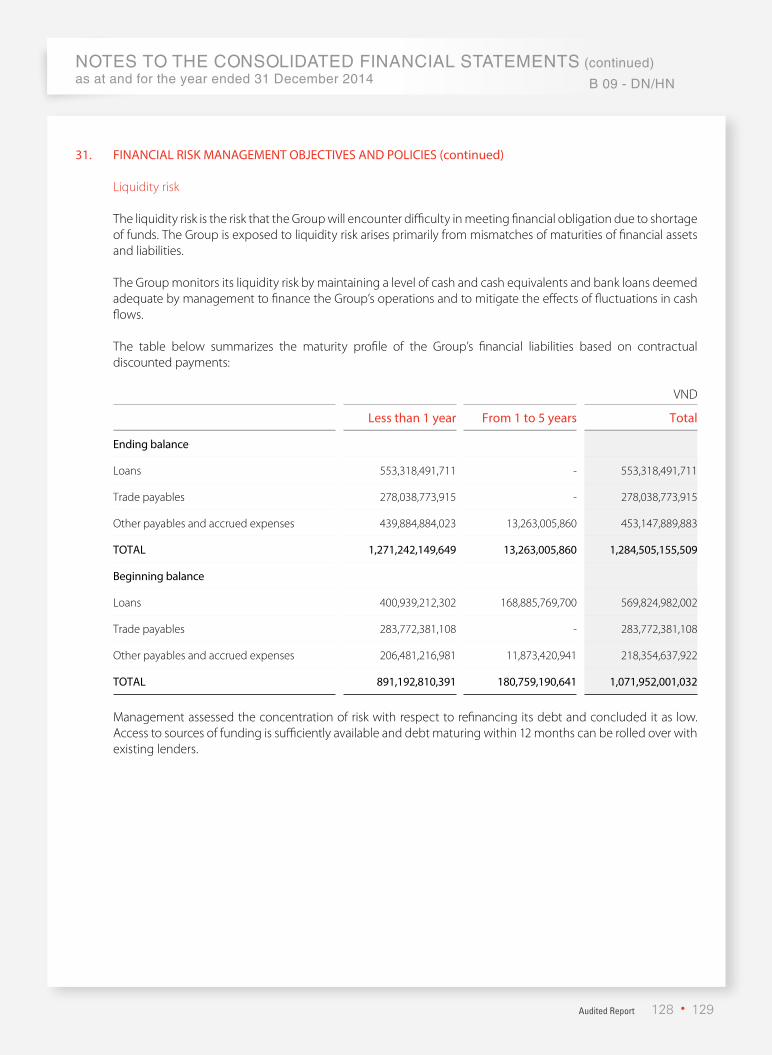
Audited Report
NOtes tO the CONsOLiDateD fiNaNCiaL statemeNts (continued)as at and for the year ended 31 December 2014
NOtes tO the CONsOLiDateD fiNaNCiaL statemeNts (continued)as at and for the year ended 31 December 2014 B 09 - DN/hN
128 129
31. finAnciAl riSK MAnAgeMenT OBJecTiVeS AnD pOlicieS (continued)
Liquidity risk
The liquidity risk is the risk that the Group will encounter difficulty in meeting financial obligation due to shortage of funds. The Group is exposed to liquidity risk arises primarily from mismatches of maturities of financial assets and liabilities.
The Group monitors its liquidity risk by maintaining a level of cash and cash equivalents and bank loans deemed adequate by management to finance the Group’s operations and to mitigate the effects of fluctuations in cash flows.
The table below summarizes the maturity profile of the Group’s financial liabilities based on contractual discounted payments:
VND
less than 1 year from 1 to 5 years Total
ending balance
Loans 553,318,491,711 - 553,318,491,711
Trade payables 278,038,773,915 - 278,038,773,915
Other payables and accrued expenses 439,884,884,023 13,263,005,860 453,147,889,883
TOTAl 1,271,242,149,649 13,263,005,860 1,284,505,155,509
Beginning balance
Loans 400,939,212,302 168,885,769,700 569,824,982,002
Trade payables 283,772,381,108 - 283,772,381,108
Other payables and accrued expenses 206,481,216,981 11,873,420,941 218,354,637,922
TOTAl 891,192,810,391 180,759,190,641 1,071,952,001,032
Management assessed the concentration of risk with respect to refinancing its debt and concluded it as low. Access to sources of funding is sufficiently available and debt maturing within 12 months can be rolled over with existing lenders.
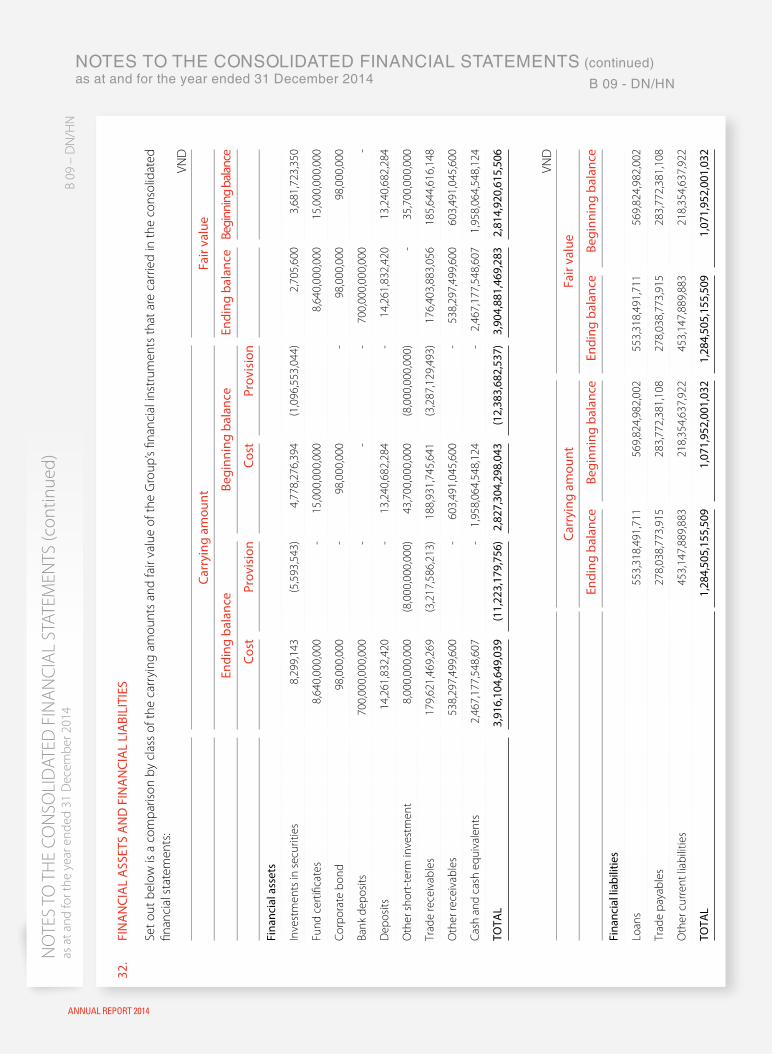
Notes to the coNsolidated fiNaNcial statemeNts (continued)as at and for the year ended 31 december 2014 B 09 - dN/hN
NO
TES
TO T
HE
CON
SOLI
DAT
ED F
INAN
CIAL
STA
TEM
ENTS
(con
tinue
d)as
at a
nd fo
r the
yea
r end
ed 3
1 D
ecem
ber 2
014
B 09
– D
N/H
N
ANNUAL REPORT 2014
32.
fin
An
ciA
l A
SSeT
S A
nD
fin
An
ciA
l li
ABi
liTi
eS
Set o
ut b
elow
is a
com
paris
on b
y cl
ass
of th
e ca
rryi
ng a
mou
nts
and
fair
valu
e of
the
Gro
up’s
finan
cial
inst
rum
ents
that
are
car
ried
in th
e co
nsol
idat
ed
finan
cial
sta
tem
ents
:VN
D
carr
ying
am
ount
fair
valu
e
endi
ng b
alan
ceBe
ginn
ing
bala
nce
endi
ng b
alan
ceBe
ginn
ing
balan
ce
cost
prov
isio
nco
stpr
ovis
ion
fina
ncia
l ass
ets
Inve
stm
ents
in se
curit
ies
8,29
9,14
3(5
,593
,543
)4,
778,
276,
394
(1,0
96,5
53,0
44)
2,70
5,60
03,
681,
723,
350
Fund
cer
tifica
tes
8,64
0,00
0,00
0-
15,0
00,0
00,0
00
8,64
0,00
0,00
015
,000
,000
,000
Corp
orat
e bo
nd98
,000
,000
-98
,000
,000
-
98,0
00,0
0098
,000
,000
Bank
dep
osits
700,
000,
000,
000
--
- 70
0,00
0,00
0,00
0-
Dep
osits
14,2
61,8
32,4
20-
13,2
40,6
82,2
84-
14,2
61,8
32,4
2013
,240
,682
,284
Oth
er sh
ort-
term
inve
stm
ent
8,00
0,00
0,00
0 (8
,000
,000
,000
)43
,700
,000
,000
(8
,000
,000
,000
)-
35,7
00,0
00,0
00
Trad
e re
ceiv
able
s17
9,62
1,46
9,26
9(3
,217
,586
,213
)18
8,93
1,74
5,64
1 (3
,287
,129
,493
)17
6,40
3,88
3,05
618
5,64
4,61
6,14
8
Oth
er re
ceiv
able
s53
8,29
7,49
9,60
0-
603,
491,
045,
600
- 53
8,29
7,49
9,60
060
3,49
1,04
5,60
0
Cash
and
cas
h eq
uiva
lent
s2,
467,
177,
548,
607
-1,
958,
064,
548,
124
- 2,
467,
177,
548,
607
1,95
8,06
4,54
8,12
4
TOTA
l3,
916,
104,
649,
039
(11,
223,
179,
756)
2,82
7,30
4,29
8,04
3 (1
2,38
3,68
2,53
7)3,
904,
881,
469,
283
2,81
4,92
0,61
5,50
6
VND
carr
ying
am
ount
fair
valu
e
endi
ng b
alan
ceBe
ginn
ing
bala
nce
endi
ng b
alan
ceBe
ginn
ing
bala
nce
fina
ncia
l lia
bilit
ies
Loan
s 55
3,31
8,49
1,71
1 56
9,82
4,98
2,00
2 55
3,31
8,49
1,71
1 56
9,82
4,98
2,00
2
Trad
e pa
yabl
es27
8,03
8,77
3,91
5 28
3,77
2,38
1,10
8 27
8,03
8,77
3,91
5 28
3,77
2,38
1,10
8
Oth
er c
urre
nt li
abili
ties
453,
147,
889,
883
218,
354,
637,
922
453,
147,
889,
883
218,
354,
637,
922
TOTA
l1,
284,
505,
155,
509
1,07
1,95
2,00
1,03
2 1,
284,
505,
155,
509
1,07
1,95
2,00
1,03
2

Audited Report
NOtes tO the CONsOLiDateD fiNaNCiaL statemeNts (continued)as at and for the year ended 31 December 2014
NOtes tO the CONsOLiDateD fiNaNCiaL statemeNts (continued)as at and for the year ended 31 December 2014 B 09 - DN/hN
130 131
32. finAnciAl ASSeTS AnD finAnciAl liABiliTieS (continued)
The fair value of the financial assets and liabilities are included at the amount at which the instrument could be exchanged in a current transaction between willing parties, other than in a forced or liquidation sale.
The following method and assumption were used to estimate the fair values:
» Cash and short-term deposits, trade receivables, trade payables and other current liabilities approximate their carrying amounts largely due to the short-term maturities of these instruments.
» Fair value of quoted bonds and shares is based on price quotations at the reporting date.
» Fair value of other financial assets is derived from quoted market prices in active markets, if available.

NOtes tO the CONsOLiDateD fiNaNCiaL statemeNts (continued)as at and for the year ended 31 December 2014 B 09 - DN/hN
ANNUAL REPORT 2014
33. SegMenT infOrMATiOn
The Group’s principal activities are to process agricultural products and foods which include purified drinks and dairy products. The Group views these activities as one business segment. However, the Group manages its geographical segments based on the location of the Group’s assets. Sales to external customers disclosed in geographical segments are based on the geographical location of its customers.
The Group’s geographically segments comprise South and North of Vietnam. The following tables present revenue, profit and certain asset, liabilities information regarding the Group’s geographical segments:
VND
South segment north segment Total
current year
Segment revenue
Sales to external customers 3,309,096,191,869 1,816,622,629,208 5,125,718,821,077
Sales deductions (131,424,718,357) (41,631,179,281) (173,055,897,638)
Inter-segment sales 286,691,409,728 20,723,910,718 307,415,320,446
3,464,362,883,240 1,795,715,360,645 5,260,078,243,885
Reconciliation:
Elimination of inter-segment sales (307,415,320,446)
Revenue for the year 4,952,662,923,439
Segment results 300,940,302,272 290,198,327,722 591,138,629,994
Reconciliation:
Interest income 138,966,526,733
Interest expense (20,731,742,626)
Amortization of goodwill (46,414,951,874)
Profit before tax 662,958,462,227
Other segment information
Depreciation and amortization 165,706,923,684 62,470,888,442 228,177,812,126
Provision for doubtful debts (1,350,343,280) 1,280,800,000 (69,543,280)
Provision for obsolete inventories (4,194,582,724) 1,709,453,413 (2,485,129,311)
Provision for investment diminution (1,090,959,501) - (1,090,959,501)
Segment assets 6,898,163,907,442 866,195,831,152 7,764,359,738,594
Reconciliation:
Elimination of inter-segment receivables (169,109,822,696)
Unallocated assets 280,626,594,565
Total assets 7,875,876,510,463
Segment liabilities 1,365,918,146,207 391,376,997,354 1,757,295,143,561
Reconciliation:
Elimination of inter-segment payables (169,109,822,696)
Total liabilities 1,588,185,320,865

Audited Report
NOtes tO the CONsOLiDateD fiNaNCiaL statemeNts (continued)as at and for the year ended 31 December 2014
NOtes tO the CONsOLiDateD fiNaNCiaL statemeNts (continued)as at and for the year ended 31 December 2014 B 09 - DN/hN
132 133
33. SegMenT infOrMATiOn (continued)
The following tables present revenue, profit and certain asset, liabilities information regarding the Group’s geographical segments: (continued)
VND
South segment north segment Total
previous year
Segment revenue
Sales to external customers 3,129,441,180,449 1,545,355,235,461 4,674,796,415,910
Sales deductions (88,181,185,216) (26,016,945,356) (114,198,130,572)
Inter-segment sales 304,367,007,200 60,331,807,297 364,698,814,497
3,345,627,002,433 1,579,670,097,402 4,925,297,099,835
Reconciliation:
Elimination of inter-segment sales (364,698,814,497)
Revenue for the year 4,560,598,285,338
Segment results 382,405,095,828 215,966,276,329 598,371,372,157
Reconciliation:
Interest income 108,281,743,978
Interest expense (43,391,810,398)
Amortization of goodwill (44,643,343,543)
Profit before tax 618,617,962,194
Other segment information
Depreciation and amortization 168,430,076,741 61,622,899,219 230,052,975,960
Provision for doubtful debts 1,758,295,537 (102,308,675) 1,655,986,862
Provision for obsolete inventories 8,473,486,616 (1,896,852,976) 6,576,633,640
Provision for investment diminution (15,316,014,863) (300,000,000) (15,616,014,863)
Segment assets 5,329,538,962,849 960,366,669,489 6,289,905,632,338
Reconciliation:
Elimination of inter-segment receivables (237,982,219,361)
Unallocated assets 326,322,166,021
Total assets 6,378,245,578,998
Segment liabilities 1,273,148,393,589 459,864,203,500 1,733,012,597,089
Reconciliation:
Elimination of inter-segment payables (237,982,219,361)
Total liabilities 1,495,030,377,728

NOtes tO the CONsOLiDateD fiNaNCiaL statemeNts (continued)as at and for the year ended 31 December 2014 B 09 - DN/hN
ANNUAL REPORT 2014
34. SignificAnT eVenTS During The yeAr
(a) Issuance of ordinary shares to the strategic shareholders
In accordance with the 2013 Extraordinary General Meeting (“EGM”) Resolution dated 4 November 2013, the Group’s shareholders approved the issuance of 40,000,000 new shares for the potential strategic investors.
On 21 May 2014, the Group issued 40,000,000 new shares at the price per share of 44,000 VND to the strategic investors as listed in the 2014 Annual General Meeting (“AGM”) Resolution dated 30 June 2014.
On 27 May 2014, the Group submitted the Report of Distribution Result to the State Securities Commission and issued the shareholder certificate for these strategic investors.
(b) Acquisition of shares of Vocarimex
On 25 July 2014, the Group acquired 24% equity interests of Vocarimex amounting to VND 421,505,599,984. Accordingly, Vocarimex becomes an associate of the Group.
In accordance with the EGM Resolution dated 1 December 2014, the Group’s shareholders approved a plan to increase the Group’s ownership rate in Vocarimex up to more than 51% to secure the control over the Vocarimex’s operations for long-term investment objectives. As at the date of these consolidated financial statements, the Group is in the process of completing this plan.
(c) Restructuring plan
In accordance with the 2014 AGM Resolution dated 30 June 2014, the Group’s shareholders approved a restructuring plan for the purpose of separating the Group’s confectionery segment out of other business activities to achieve higher efficiency.
On 15 October 2014, the Group transferred its entire investments in NKD to KDBD at the total price of VND 694,175,525,000, which is also the carrying value of the investment in NKD, in exchange for the increase in the Group’s investments in KDBD by the same amount. This transfer is part of the said restructuring plan.
(d) Transferring the confectionery segment
In accordance with the EGM Resolution dated 1 December 2014, the Group’s shareholders approved a plan to transfer 80% equity interests in KDBD to Mondelēz International, an enterprise incorporated overseas, or its assigned subsidiary, Cadbury Enterprises Pte. Ltd., together with an option to purchase the remaining 20%, after the Group completed the restructuring plans as approved by the shareholders in the 2014 AGM Resolution dated 30 June 2014.
(e) The repurchase of treasury shares
Also, in accordance with the EGM Resolution dated 1 December 2014, the Group’s shareholders approved a plan to repurchase treasury shares up to 30% of the Group’s issued ordinary shares for the purpose of decreasing the number of existing shares being circulated.

Audited Report
NOtes tO the CONsOLiDateD fiNaNCiaL statemeNts (continued)as at and for the year ended 31 December 2014
NOtes tO the CONsOLiDateD fiNaNCiaL statemeNts (continued)as at and for the year ended 31 December 2014 B 09 - DN/hN
134 135
35. eVenTS AfTer The BAlAnce SheeT DATe
Except for the events as disclosed at Note 22, there have been no other significant events occurring after the balance sheet date which would require adjustments or disclosures to be made in the consolidated financial statements.
Tran minh nguyet Preparer
nguyen Thi oanhchief accountant
Tran Le nguyengeneral Director
26 March 2014

KInh do corporatIon Address: 138 - 142 hai Ba Trung Da Kao ward, District 1, hcM Tel: (08-8) 3 8270 838 fax: (08-8) 3 8270 839 email: [email protected]
www.kinhdo.vn