accelerated testing for prediction of 28-day...
TRANSCRIPT

ACCELERATED TESTING FOR PREDICTION OF 28-DAY STRENGTH OF CONCRETE P. Kalyanasundaram, Department of Civil Engineering, Indian Institute of Technology,
Madras; and V. J. Kurien, Department of Civil Engineering, Region Engineering College,
Kozhikode, India
There is a need for timely information on strength of concrete in construction works to help achieve better quality control. In India, not much work on accelerated strength testing of concrete has been reported, and there is a need for a systematic study of such testing by using locally available cements. This paper gives an accountofan experimental study of accelerated testing of concrete for prediction of strength by using two methods based on suitable modifications of the British accelerated testing committee method and the Canadian modified boiling method. Concrete mixes with st1·engths ranging from 150 to 600 kgf/ cm2 (15 to 60 MPa) were tested. Test results, which were correlated by regression analyses, show that accelerated testing (hot-water curing for 31,h hours at 85 C) can be used to accurately predict 28-day concrete strengths.
•CONVENTIONAL practice for specification of concrete consists of denoting the 28-day compressive strength of 15 by 30-cm cylinders or 15-cm cubes cast, moist cured, and tested under controlled conditions. However this duration is too long in the context of current trends in new design concepts, increased pace of construction, and timely control of concrete quality. The need for an early determination of the concrete strength with satisfactory reliability has long been felt by many as evidenced by the research work published by many institutions all over the world during the past few decades. Different accelerated tests are being used in different countries for the prediction of the 28-day compressive strength, and these are available either as departmental or committee recommendations or incorporated as specification in the codes (1, 2, 3, 4, 5, 6, 7, 8). In general, these methods use the application of external heat or conserva-= Ron ofthe heat of hydration for the accelerated strength development, and the methods differ mainly in procedural details.
In India, accelerated strength testing of concrete has not been widely attempted, and there is a need for a systematic study of such testing using locally available cements. Rehsi, Garg, and Kalra (9) have studied the suitability of the test method, recommended by the British accelerated testing committee (BATC), for application of 28-day compressive strengths of 100 kgf/cm2 (10 MPa) to 250 kgf/ cm2 (25 MPa) to concretes of grades M 100 to M 250 (11 cement samples from the various factories of the Associated Cement Companies Ltd., Bombay). Two mixes with water-cement ratios of 0.4 and 0.6 and aggregate-cement ratios of 3.03 and 6.09 were used for the tests. It was concluded that the BATC method could be adopted for predicting the 28-day strength of the concrete mixes tried.
In this paper, a detailed laboratory study is reported on accelerated strength testing of concrete with strengths ranging from 150 to 600 kgf/cm2 (15 to 60 MPa) by two different methods. The results of the tests have been assessed with the aid of suitable regression analyses.
77

78
EXPERIMENTAL PROGRAM
Materials and Equipment
Ordinary portland cements from three manufacturers (A, B, and C) in South India were used. The physical properties of these cements, obtained from standard tests [Indian Standard 4031 (1968)], are given in Table 1.
Crushed granite aggregate [maximum size, 8 in. (20 mm)] and river sand were used. Their gradations are given in Table 2.
t{ormal potable water was used for mixing a.."1.d curing. Various mixes were adopted with water-cement ratios ranging from 0.30 to 0.68;
the values of aggregate cement ratios were 3.0, 4.5, 6.0, and 9.0. For the most part, the combined aggregate consisted of two parts of coarse aggregate and one part of fine aggregate by weight, and this resulted in a good continuous grading for the mix. The 28-day strengths of the mixes ranged from about 150 kgf/cm2 to 600 kgf/ cm2 (15 to 60 MP a).
A thermostatically controlled, 87 by 60 by 38-cm-high water bath was used for accelerated curing. The bath was equipped with a main heater of adequate capacity and a secondary heater of 200 W to be operated by thermostatic control. The water level in the bath was maintained to provide for a volume of 0.05 m3 of water for each specimen (15-cm cube). To maintain a uniform temperature, the water was continuously stirred.
Methods of Testing
Two methods of accelerated testing based on the BATC method (1) and the Canadian modified boiling method (6) were selected for the tests, and slight modifications in procedural details were made to suit the available facilities.
The modified methods adopted are named method 1 and method 2 respectively. The details of the basic methods and the modifications adopted for the tests are given in Table 3.
Test Procedure
Standard 15-cm cube specimens were cast in steel molds on a vibrating table. Twelve specimens were prepared from each concrete mix, oi which four specimens were subjected to accelerated testing in the water bath and four each were normally cured in water for the 7-day and 28-day strength tests. For accelerated testing by method 1, the steel molds containing the concrete specimens were covered by 7-mm-thick steel plates, and these were cured in the water bath at the specified temperature. For method 2, the molds were covered with damp sacks for 24 hours after which the specimens were demolded and cured in the water bath at 85 C. Method 1 was attempted with 1 cement (cement A), and 25 sets of 15-cm cubes were cast, 12 cubes per set of concrete mix. Method 2 used two cements (cements Band C), and 16 sets of mixes were cast with each cement. The details of the mixes and the strengths obtained (average of four cubes each) are given in Tables 4, 5, and 6.
In Tables 4, 5, and 6, R1 is the value of the 1-day accelerated strength test by the particular test method; R1 and Rza are the 7 and 28-day strengths of normally cured specimens respectively.
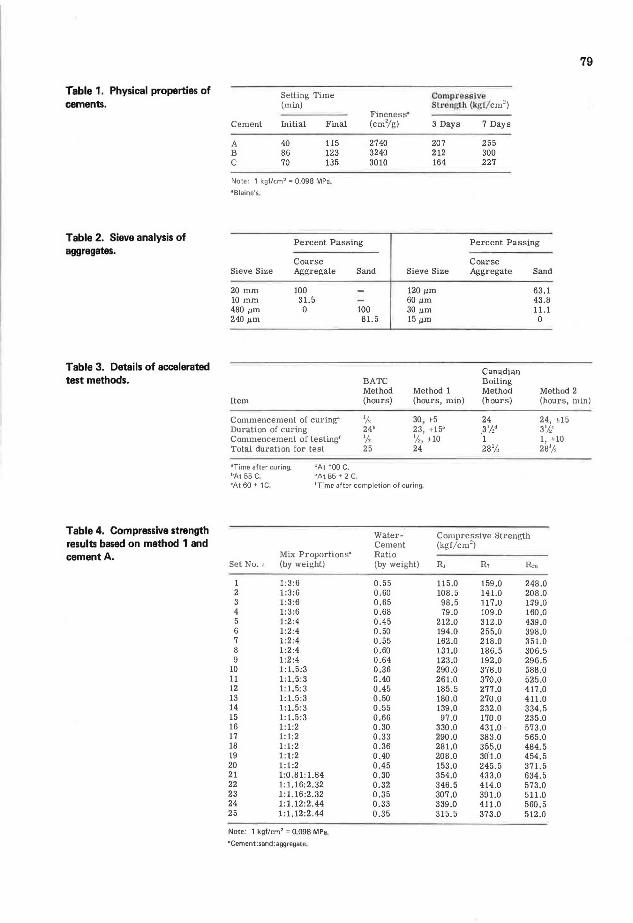
Table 1. Physical properties of cements.
Table 2. Sieve analysis of aggregates.
Table 3. Details of accelerated test methods.
Table4. Compressive strength results based on method 1 and cement A.
Cement
A B c
Setting Time (min)
Initial
40 86 70
Final
115 123 135
Note: 1 kgf/cm 2 = 0.098 MPa .
.1 e1aine's..
Fineness" (cm2/g)
2740 3240 3010
Compressive Sh·cngt.h (kgf/ cm')
3 Days
207 212 164
7 Days
255 300 227
Percent Passing Percent Passing
Coarse Coarse Sieve Size Aggregate Sand Sieve Size Aggregate Sand
20 mm 100 120 µm 63.1 10 mm 31.5 60 um 43.8 480 µm 0 100 30 um 11.1 240 um 81.5 15 um 0
Canadian BATC Boiling Method Method 1 Method Method 2
79
Item (hours) (hours, min) (hours) (hours, min)
Commencement of curing-Duration of curing Commencement of testingr Total duration for test
arime afler curing.
'At 55 C. 'At 100 C. "At 85 ± 2 C,
'/, 30 , >5 24' 23, +15' '/, 'h, ±10 25 24
24 24, •15 .3'/f 3'/,' 1 1, HO 28'/, 281/,
' At 60 ± lC, 1Time after completion of curing
Water- Compressive Strength Cement (kgl/cm')
Mix Proportions" Ratio Set No.,. (by weight) (by weight) R1 R1 R,.
1 1:3:6 0.55 115.0 159.0 248.0 2 1:3:6 0.60 108.5 141.0 208.0 3 1:3:6 0.65 98.5 117.0 Vl'9.0 4 1:3:6 0,68 79.0 109.0 160.0 5 1:2:4 0.45 212.0 312.0 439.0 6 1:2:4 0.50 194.0 255.0 398.0 7 1:2:4 0.55 162.0 218.0 351.0 8 1:2:4 0.60 131.0 186.5 306.5 9 1:2:4 0.64 123.0 192.0 296.5
10 1:1.5:3 0.36 290.0 378.0 588.0 11 1:1.5:3 0.40 261.0 370.0 525.0 12 1: 1.5:3 0.45 185.5 277.0 417 .0 13 1:1.5:3 0.50 180.0 270.0 411.0 14 1:1.5:3 0.55 139.0 232.0 334.5 15 1: 1.5:3 0.66 97.0 170.0 235.0 16 1: 1:2 0.30 330 .0 431.0 573.0 17 1: 1:2 0 .33 290 .0 383.0 565.0 18 1:1:2 0.36 281.0 355.0 484.5 19 1:1:2 0.40 208.0 301.0 454.5 20 1:1 :2 0.45 153.0 245.5 371.5 21 1:0.81:1.84 0.30 354.0 433.0 634.5 22 1:1.16:2.32 0.32 346.5 414.0 573.0 23 1:1.16:2.32 0.35 307 .0 391.0 511.0 24 1: 1.12:2.44 0.33 339.0 411.0 560.5 25 1:1.12:2.44 0.35 315.5 373.0 512.0
Note: 1 kgf/cm 2 = 0.098 MPa.
•cement:sand :aggregate.

80
Table 5. Compressive strength results based on method 2 ~ind cement B.
Waler- Compressive Strength Cement (kgf/cm2
)
Mi."{ Proportionsa Ratio Set No. (by weight) (by weight) R, R, R~e
1 1:3:6 0.60 133.0 202.5 310.0 2 1:3:6 0.65 116.0 183.5 290.5 3 1:3:6 0.68 101.0 161.5 266.0 4 1:2:4 0.50 185.5 283.0 400.0 5 1:2:4 0.55 172.6 281.5 373.0 6 1:2:4 0.60 145 ~ 5 24..3 .5 .330..5 7 1:2:4 0.64 118.5 198.0 285.5 8 1:1.5:3 0.36 305.0 478.0 582.5 9 1: 1.5:3 0.40 282.0 446.0 524.5
10 1: 1.5:3 0.45 190 .0 307 .5 405.5 11 1:1.5:3 0.50 190 .0 296.5 399.5 12 1:1.5:3 0 .55 168.5 276.0 341.0 13 1: 1:2 0.30 347 .5 476.0 568.0 14 1:1:2 0.33 286.0 450.5 560.5 15 1:1:2 0.36 256.0 410.0 523.0 16 1: 1:2 0.40 255.0 412.5 481.0
Note: 1 kgl/cm' = 0.098 MPa.
"Cement: sand :aggregate_
Table 6. Compressive strength results based on method 2 and cement C.
Water- Comp»essive Strength Cement (kg f/ c1'1\2)
Mix Proportionsa Ratio Set No. (by weight) (by weight) R, R, R:!B
1 1:3:6 0.60 113.5 195.5 275.0 2 1:3:6 0.65 101.0 172.5 259.5 3 1:3:6 0.68 93.0 147 .5 220.0 4 1:2:4 0.50 154.0 253.5 345.0 5 1:2:4 0 .55 148.5 241.5 323.0 6 1:2:4 0.60 115.5 190.0 280.5 7 1:2:4 0.64 96.0 155.5 236.5 8 1:1.5:3 0.36 220.5 330.0 464.5 9 1:1.5:3 0.40 210.5 327.0 435.5
10 1:1.5:3 0.45 151.0 246.0 330.0 11 1:1.5:3 0.50 139.0 229.5 318.0 12 1: 1.5:3 0.55 110.0 195.0 270.5 13 1:1:2 0.30 261.5 411.0 507.5 14 1:1:2 0.33 260.5 405.5 484.5 15 1:1:2 0.36 223.0 337.0 456.0 16 1:1:2 0.40 187 .0 287.0 405.0
Note: 1 kgl/cm' = 0.098 MPa.
"Cement :sand :aggregate~

81
ANALYSIS OF RESULTS
Accelerated Test Method 1
Curves of the correlation between R1 and R1 and between R1 and R2a are shown in Figures 1 and 2. These are parabolic in nature, and the best fit for the parabolic curve was obtained by means of statistical methods (10). The equations obtained for the best fitting curves are also shown in Figures 1 and2. The standard errors or prediction for R1 and R2a were 14.2 kgf/cm:i (1.4 MPa) and 27.5 kgf/cm2 (2.7 MPa) respectively.
Accelerated Test Method 2
Based on Figures 1 and 2, the correlations were almost linear, and the plots for both cements B and C nearly coincide. Hence a single linear correlation, based on the results for cements B and C (total population), was then attempted. By statistical methods (11), the regression line that gave the best linear fit was determined. The results of this analysis are shown in Figures 3 and 4. The standard error of prediction is small, 8.33 kgf/ cm2 (0.8 MPa) and 10.34 kgf/cm2 (1.0 MPa), for prediction of R7 and R28 values from R1 values. The 95 percent confidence limits for the correlation are also shown in Figures 3 and 4.
DISCUSSION OF RESULTS
Accelerated Test Method 1
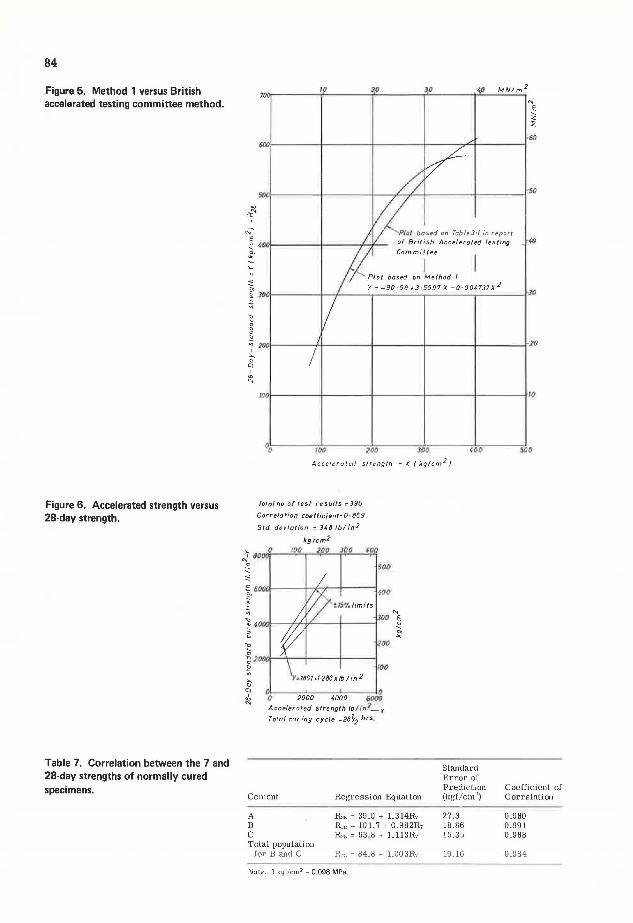
Almost all the results shown in Figures 1 and 2 are within the ±10 percent error limits. The scatter of results is relatively more with the high-strength concretes, i.e., for 28-day strengths of 500 kgf/ cm2 (50 MPa) and more. But the standard error of prediction is small. The parabolic correlation is compared with that obtained by the BATC method (Figure 5). This shows a similar trend between the two sets of results up to concrete strengths of about 500 kgf/cm2 (50 MPa). The method appears to be quite useful for prediction of strength but involves a procedure of maintaining a constant temperature bath at 60 C for 23 hours and requires the use of the mold and a cover plate for the curing.
Accelerated Test Method 2
This method gives a linear correlation for prediction of 7-day or 28-day strengths (Figures 3 and 4), and the standard error of prediction is considerably lower than that of method 1. The 95 percent confidence limits are close together (Figures 3 and 4). The linear character of the relationship and the coefficient of correlation obtained by this method compare well with the results obtained by the Canadian modified boiling method (Figure 6) (6). The correlation obtained appears to be independent of the source of the cement, cement content, and water-cement ratio. The method has good potential for application and can give accurate results. A more representative character of the linear relationship can be obtained by undertaking a large number of laboratory and field tests, say, about 500 sets of results, with portland cements from a number of different sources in the country.

82
Figure 1. Accelerated strength versus 7-<lay strength for method 1.
Figure 2. Accelerated strength versus 28-day strength for method 1.
10 20 30 'O MN/m2 70f>r" ____ _.._ ____ ...,... ____ .,.... ____ ..,.... ____ _
Total no of resvf ts = 25
Regression equation= Y = -81·0812·5153 X-0-00316 K2
Standard error of pr11dictlon ::U•21 kglcm2
" ~ "' <
60
..,- m1-----+----+----1-----+-----1 so § ' "· "" !10°1. error limits
·~,otll·-----+-----f---".~--l~'""'=----1------r'o
"' " "" -,;. c ~
~ Jllll------+----.:.-,l'0--4----+-----+-----1-JO ~ 0
" c ~ ~xx~-----+--'-i'r---+-----+-----+-----f.20
..,-~ ~
100!----'l'l--l-----+----+----f-----+IO
JOO 200 300 500
Acce/,uated strength= R1 = X ( kglcm2)
100.-----~10 ____ ~2~0----~J~o_:_ ___ _.,j•Lo _ _:__"'~N~l~m:.:.2
" E ~
Total no of results = 25 _.CJ- - l: Regression equal ion= Y = -90·58., J-5,..597'X - D·OOl,737X 2 60 Standard error of prediction= /~ -,-------!
27°53 kglcm 2 // /
/
0 0
~ •001-----t----:"-,~IL...---""""1------l-------r40
"'~ "" g. ~ 30
~ 1! ~ 6'
Cl
' c
"'
1001------+-----l------l------l------}10
Accelerated stren9Jh ::R1 = X ( kglcm 2 J

Figure 3. Accelerated strength versus 7-day strength for method 2 and cements B and C.
Figure 4. Accelerated strength versus 28-day strength for method 2 and cements B and C.
0 J ' 0 /vfNI m 2
Tota f no of results = 32
83
... E ~ ~
Regression equation Y=15•29~ 15075X
Standard error of prediction=8 ·33 hglcm2
Correlation coefficient= 0 ·997
-1----160
95% confidence limits
•Results of cement B
A Results of cement C
Accelerated strength= R 1 =X (kglcm2)
Total no results =32
Regression equation Y =98 14 • 1·5714 X t.;~ Standard pred1ct1on =10 ~34 kglcm 2
1 I. 'I
Correlation coeff1c1ent =0·993 -ti~ ', I., ~,"?. ..
" soo1-----1-----1--_.,__,,_ _ ___ ,_ ___ __,.50 E
.!:'. "' ""
..,
95% confidence limits
'a. ~ ~ J'rllll-------l-'#-- ----l--- --l--- ----li-------IJO
"' ~ .g ~ 0
~ 200t---.... - +--- - --+------l------ .1-------1·20 ~ Cl ' "' "' •Results of cement B
IOO t-- ---+------+-------< ~.llU[U-f>LJ;em_w
D 1 0 300
Accelerated strength= R1 =X (kglcm2)
500
84
Figure 5. Method 1 versus British accelerated testing committee method.
Figure 6. Accelerated strength versus 28-day strength.
Table 7. Correlation between the 7 and 28-day strengths of normally cured specimens.
(} fvfNlm 2
0
Commiftee
Plot based on Method 1
~ Y:::-90 •58+3·55.97X-O·OOl,737X 2
~ JIJOl------+---.'----~----~----~----..f"o
~ ~ l: ~ 2()(}t------ri-----+-----+-----+----~20
~ Cl
Acee/era led strength = X ( kg!cm 2 )
' :!:!
Total no of rest results :::396
Correla ti on coefficient= o ~ 869
Std. deviation = 348 lblin2
k91cm2
JO(} 200 JOO {00
500
t: ~OOGt----t-Jt:-r-i----:1 ~· {OD .... !.IS'/. limits ~ ~
~ i'O«;lt--..,.., ...... ~--i----1J()() ~ i:! ~
1' - 200 0 i! 2/!0l.lt--'t- -+---+----1 ~ m/OO
~ Cl
~ 0 0 o 2000 •ooo 6000 Acce/eroted strength lblln-1_x
Total curing cycle =28~2 hrs_
Cement Regression Equation
A B c Total population
!or Band C
R'" = 39.0 + 1.314R, R'" = 101.7 + 0.982R7
R" = 63 .8 + 1.113R,
R,,, = 84.8 + 1.003R,
Note: 1 kgf/cm 2 = 0,098 MPa
Slandard Error of Prediction (kgl/cm')
27 .3 18.86 15.35
19.16
Coefficient of Correlation
0.980 0.991 0.988
0.984
MERIT OF ACCELERATED TESTING OVER CURRENT PRACTICE
85
In the absence of accelerated testing, current practice for estimation of 28-day strengths is based on the 7 -day strengths actually obtained. To compare the relative merits of this method against the prediction of accelerated test method, linear correlations between R1 and R2a for the different cements were determined. The results of the regression analysis are given in Table 7. Comparison of these with the results of accelerated test method 2 (Figure 4) shows that the latter are at least as reliable as the 7-day (normally cured) strength tests for prediction of the 28-day strengths and can be used confidently and advantageously in time.
CONCLUSIONS
1. Both the accelerated test methods tried appear to give satisfactory results for predicting the 28-day strength of concrete.
2. Method 2, a modification of the Canadian boiling method, is recommended over method 1 because it gives better accuracy in prediction and provides a simple linear relationship and because the operating procedure and curing characteristics are simpler than those of method 1.
3. The accelerated test method (method 2) can be advantageously adopted in place of 7-day (normally cured) strengths for reliable estimation of 28-day strengths.
4. The relationship obtained for prediction of 28-day strength appears to be independent of the concrete variables like cement content, water-cement ratio, and the source of cement.
5. The accelerated test method 2 can be further developed for wide application by using a large number of tests covering the practical range of concrete mixes used in the laboratory and field. This method can be used to help in the design of trial mixes, to evaluate the uniformity of field concrete for quality control, and to evaluate the strength and quality of concrete by replacing the 28-day strength test entirely.
ACKNOWLEDGMENTS
We would like to thank P. C. Varghese, Indian Institute of Technology, Madras, for his keen interest and valuable suggestions during this investigation. This paper contains part of the project work of Kurien for his master's degree (12) and is published by permission of the head of the Department of Civil Engineering;-fndian Institute of Technology, Madras.
REFERENCES
1. J. W. H. King. An Accelerated Test of Concrete. Proc., Institution of Civil Engineers, May 1968, Vol. 40, pp. 125-129.
2. N. T. Grant. The Use of an Accelerated Testing Method in the Quality Control of Ready Mixed Concrete. Proc., Symposium on Concrete Quality, Cement and Concrete Association, London, Nov. 1964.
3. V. M. Malhotra. Analysis of Accelerated 24-Hour Concrete Strengths From Field Tests. International Union of Testing and Research Laboratories for Materials and Structures, Bulletin 31, June 1966.
4. W. Jarocki. The Rapid Control of Concrete Strength on the Basis of Specimens Cured in Hot Water. International Union of Testing and Research Laboratories for Materials and Structures, Bulletin 31, June 1966.
5. J. Vuorinen. Some Notes on the Use of Accelerated Curing of Test Specimens for Concrete Quality Control. International Union of Testing and Research Laboratories for Materials and Structures, Bulletin 31, June 1966.

86
6. V. M. Malhotra and N. G. Zoldners. Accelerated Strength Testing of Concrete Using the Modified Boiling Method. International Union of Testing and Research Laboratories for Materials and Structures, Bulletin 31, June 1966.
7. P. Smith and B. Chojnacki. Accelerated Strength Testing of Concrete Cylinders. Proc., American Society for Testing and Materials, Vol. 63, 1963, pp. 1,079-1, 106.
8. P. Smith. Quick Quality Testing of Concrete. Civil Engineering, American Society of Civil Engineers, Aug. 1970, pp. 52-56.
9. S. S. Rehsi, S. K. Garg, and P. D. Kalra. Accelerated Testing of 28-Day Strength of Concrete. Bulletin, Indian Standards Institution, Vol. 23, No. 6, 1971, pp. 273-279 0
10. M. R. Spiegel. Theory and Problems of Statistics. McGraw-Hill Book Co., New York, Schaum's Outline Series, 1961.
11. A. H. Bowker and G. J. Lieberman. Engineering Statistics. Prentice-Hall, New York, 1961, pp. 238-286.
12. V. J. Kurien. Strength Characteristics of Rapid Cured and Ordinary Cured Concretes Made With Local Cements. Department of Civil Engineering, Indian Institute of Technology, Madras, Master's thesis, 1972.