academic and behavioral improvements in 2nd- through 8th
TRANSCRIPT

Academic and Behavioral Improvements Study: Hardy Brain Camp 2011 Page 1
Academic and Behavioral Improvements in 2nd- Through 8th-Grade Students in the Hardy Brain Camp Program
Report on the Hardy Brain Camp Pilot Study of the Boys & Girls Clubs of Greater Oxnard and Port Hueneme and the United Boys & Girls Clubs of Santa Barbara
County
November 2011
Jamshid Damooei, Ph.D. Professor of Economics and Chair Department of Economics, Finance, and Accounting California Lutheran University

Academic and Behavioral Improvements Study: Hardy Brain Camp 2011 Page 2
Acknowledgements I am grateful to Mr. Tim Blaylock, Chief Professional Officer, for his support throughout the duration of this project. I am thankful to Mr. Michael Rattray, CEO of the United Boys & Girls Clubs of Santa Barbara County, for his encouragement and help. My sincere gratitude goes to Ms. Erin Antrim, Director of Program Services, for her time and effort to help this evaluation. Mr. David Poeschel, Director of Pupil Services of Rio School District, has been most helpful in bringing together all the collaborators to coordinate their efforts in the outset of the project, which has been most helpful. I am grateful for the time and the efforts of Mr. William McDonald, School Psychologist from Rio School District. I thank Ms. Diane Solomon for her most valuable assistance.
I also would also like to thank the staff of the Boys & Girls Clubs of Greater Oxnard and Port Hueneme and the Boys & Girls Clubs of Santa Barbara County for giving me their utmost cooperation and assistance.
I want to recognize the pivotal role and the enormous contribution of Ms. Sherrie Hardy in helping me in every step of this evaluation. The personal interest and gracious support of Mr. Jeff Henley, Chairman of the Board of Directors of Oracle Corporation and member of the National Board of Directors of the Boys and Girls Clubs, has been one of the most significant elements of the commencement of this project and its unique contribution to the success of many children who have gone through this program, and hopefully will continue to benefit from it in the years to come.
I would like to express my appreciation for the help of my research assistant, Mr. Jenish Patel, M.B.A., for his valuable and hard work in processing the gathered data and preparing them for analyses. I thank Mr. Adam Erickson, M.Ed., for his work in editing the manuscript of this study.
Jamshid Damooei, Ph.D.
Professor of Economics and Chair
Department of Economics, Finance, and Accounting
California Lutheran University
Tel: (805) 493-3357

Academic and Behavioral Improvements Study: Hardy Brain Camp 2011 Page 3
Executive Summary The academic and behavioral performance of 54 students (grades 2-8) was studied before and after participation in the Hardy Brain Camp program. The students, who belonged to the Boys and Girls Club of Greater Oxnard and Port Hueneme and attended school in the Rio School District along with students who belonged to the United Boys & Girls Clubs of Santa Barbara, were selected by Boys and Girls Club Staff and Rio School District School Psychologists as those needing academic, attention, and behavior improvements.
The students in both groups were selected because of observed difficulties with learning, attention, organization, behavior, poor grades, listening, following directions, completing schoolwork, reading and/or math weaknesses. Some of the students were struggling in regular classrooms, some in Special-Education pull-out programs, some with Special Education one-to-one aides, some in full-day Special Education programs and some in programs for emotionally disturbed children. Some had no diagnosis and some had diagnoses of Learning Disabilities, ADD, ADHD, dyslexia, Central Auditory Processing Disorder, speech and language delay, dysgraphia, dyscalculia, Asperger’s Syndrome and autism. They all had severe difficulties that negatively impacted their ability to do well in school.
The students went through the Hardy Brain Camp program, which consisted of 20 sessions of 45 minutes using a proprietary training program designed by Sherrie Hardy to improve the millisecond timing of the brain. Improved millisecond timing has been shown to improve reading, math, thinking speed, attention, communication, and coordination.
Before and after training, teachers, parents, and Boys and Girls Club counselors rated the students on eleven traits that influence academic success and behavior.
Two standardized testing measurements were used to evaluate the students along with a Mathematics Performance Inventory. Twenty-two students were tested using the Woodcock-Johnson for Reading Fluency, Math, and Processing Speed. Thirty–two students were given the WISC Coding and Symbol Search to measure processing speed along with the Mathematics Performance Inventory.
The twenty-two students tested with the Woodcock-Johnson gained an average of:
• 9.1 months improvement in reading. • 3.9 months improvement in math. • 16 months (1.6 years) improvement in processing speed. This was the most significant
outcome
. Processing speed is the combination of thinking speed and decision-making speed. As students improve their processing speed they are able to think faster and absorb information more easily.
The thirty-two students who were tested with the WISC showed an average of: • 10.9% improvement in processing speed in the WISC Coding measurement.

Academic and Behavioral Improvements Study: Hardy Brain Camp 2011 Page 4
• 31.2% improvement in processing speed in the WISC Symbol Search. The thirty-two students who were tested on the Mathematics Performance Inventory showed an average of:
• 2.9 months improvement in math.
The students also showed dramatic improvement in ratings from teachers, parents, and Boys and Girls Club counselors on the 11 academic and behavior traits for which they were rated. Remarkable improvements were made in academic performance, attitude, ability to process information, and ability to deal with the surrounding environment
Students showed an average of:
• Ability to pay attention: 35.2% improvement • Reading, math, spelling, and writing: 32.1% improvement • Ability to organize and communicate ideas: 26.7% improvement • Focus: 35.1% improvement • Ability to finish work on time: 30.4% improvement • Listening skills: 32.1% improvement • Ability to manage frustration: 27.5% improvement • Ability to finish work independently: 31.3% improvement • Coordination and motor skills: 20.8% improvement • Ability to work well with others: 25.4% improvement • Self confidence: 30.5% improvement
For the 11 traits rated, teachers reported an average of 21.9% improvement, parents reported an average of 32.8% improvement and Boys and Girls Club counselors reported an average of 34.4% improvement.
Rio School District School Psychologist, William MacDonald, summed up the progress students made as “remarkable.” He said he has never seen this much progress so quickly with this population of students.
Principal of Rio Real Elementary School, Maria Hernandez, said the program “takes away the barriers and allows our students to experience academic success.”

Academic and Behavioral Improvements Study: Hardy Brain Camp 2011 Page 5
Table of Contents Acknowledgements 2
Executive Summary 3
List of Tables 6
Introduction 7
About the Hardy Brain Camp Workshop and Pilot Project 8
Methods: Data and Analyses 10
Data Gathering and Reporting 10
Data Analysis 11 Formal Achievement Test: Woodcock-Johnson and WISC 11 Students’ Rating Scores by Parents, Teachers, and Boys & Girls Clubs Facilitators 12
Results and Discussion 13
Woodcock-Johnson Test 13 Takeaways from Reading Tests Results 13 Takeaways from Math Tests Results 13 Takeaways from Processing Speed Results 13
Wechsler Intelligence Scale for Children (WISC) Test 17 Takeaways from Change in Coding Test Results: 17 Takeaways from Change in Symbol Search Test Results: 17 Takeaways from Change in Math Test Results: 17
Summary of Achievement Test Results 21
Results from Ranking of the Students’ Abilities 21
Conclusions 24
Appendix A: Graphic Presentation of Differential Changes in Eleven Areas Evaluated by Parents, Teachers, and Counselors 25
Appendix B: Graphic Results of Separate Areas of Evaluation by Parents, Teachers, and BGC Counselors 36

Academic and Behavioral Improvements Study: Hardy Brain Camp 2011 Page 6
List of Tables TABLE 1: SUMMARY OF READING SCORES FOR GROUP OF 22 STUDENTS USING WOODCOCK-JOHNSON METHOD ............................ 14
TABLE 2: SUMMARY OF MATH SCORES FOR GROUP OF 22 STUDENTS USING WOODCOCK-JOHNSON METHOD ................................ 15
TABLE 3: SUMMARY OF PROCESSING SPEED FOR GROUP OF 22 STUDENTS USING WOODCOCK-JOHNSON METHOD .......................... 16
TABLE 4: SUMMARY OF CODING TESTING FOR 32 STUDENTS USING WISC METHOD ................................................................. 18
TABLE 5: SUMMARY OF SYMBOL SEARCH TESTING FOR 32 STUDENTS USING WISC METHOD ...................................................... 19
TABLE 6: SUMMARY OF MATH SCORES FOR GROUP OF 32 STUDENTS USING THE MATHEMATICS PERFORMANCE INVENTORY ............. 20
TABLE 7: RANKING OF ELEVEN AREAS OF STUDENT ABILITY ASSESSED BY PARENTS, TEACHERS, AND COUNSELORS ............................... 22

Academic and Behavioral Improvements Study: Hardy Brain Camp 2011 Page 7
Introduction Children struggle in school for many reasons. Two of the most important are slow thinking skills and weak processing skills. Students with these two weaknesses have problems completing school work, paying attention, reading, and doing math. Often, these students receive tutoring or extra help for these visible symptoms - but not for the underlying weak processing and thinking skills that create these problems.
A learning disability (LD) is usually defined as unexpected underachievement—specifically, students who do not listen, speak, read, write, or develop mathematics skills commensurate with their potential, even though there has been adequate opportunity to learn. Historically, unexpected underachievement has been attributed to intrinsic neurobiological factors that indicate that students with LD will require specialized instruction to achieve at expected levels based upon some index of aptitude, usually an IQ test score. 1 The concept of unexpected underachievement has been reported in medical and psychological literature since the mid-19th century under the rubrics of dyslexia, word blindness, dysgraphia, dyscalculia, and other terms.2
The concept of learning disabilities and the need for different specialized educational services also made intuitive sense to parents, teachers, and policymakers. The term did not stigmatize children. Specifically, the learning difficulties displayed by youngsters with LD were not due to mental retardation, poor parenting, or psychopathology. The term likewise reflected optimism. Students with LD had not yet reached their potential: Their difficulties in learning to read, write, and/or calculate occurred despite adequate intelligence, sensory integrity, healthy emotional development, and cultural and environmental advantage. Education programs were needed that recognized differences among children with LD, those who learned “normally,” and those who manifested physical, sensory, and intellectual handicaps that affected academic achievement.
However, it has only been since 1962, when Samuel Kirk, a psychologist at the University of Illinois, coined the term learning disabilities, that the concept of unexpected underachievement attained formal recognition in the education community.
The field of LD was founded on the assumption that neurobiological factors are the basis of these disabilities. As the field progressed, definitions of LD continued to attribute disabilities in learning to intrinsic (neurobiological) rather than extrinsic (for example, environmental or instructional) causes, even though there was initially no objective way to assess the presence of recognized brain dysfunction.3
New scientific studies proved that a large number of children need support in a timely manner to overcome their existing biological and neurological impediments to learning. It became clear that failure
1 See K. Kavale and S. Forness, The Nature of Learning Disabilities (Hillsdale, NJ: Erlbaum, 1995); and J.L. Wiederholt, “Historical Perspectives on the Education of the Learning Disabled,” in The Second Review of Special Education, eds. L. Mann and D. Sabatino, (Austin, TX: PRO-ED, 1974), 103-152. 2 See G. Reid Lyon, Jack M. Fletcher, et al (2001), Rethinking Learning Disabilities, Progressive Policy Institute, Thomas B. Fordham Foundation. 3 Ibid.

Academic and Behavioral Improvements Study: Hardy Brain Camp 2011 Page 8
to act in the early years of a child’s development may create an irreversible condition. The importance of a timely intervention became more obvious in the minds of parents, community leaders and policy makers.
The No Child Left Behind Act of 2001 (NCLB) includes benefits to students with learning disabilities (LD), as well as some barriers that might prevent these same students from enjoying all of the opportunities in the law. In order to increase the accountability of at-risk groups of students and for the purpose of helping to close the achievement gap, NCLB further required that schools, school districts, and states disaggregate, or separate out, the test results for several subgroups of students. Students with disabilities who are receiving services under the Individuals with Disabilities Education Act (IDEA), that is, students with IEPs, are one of the subgroups that must be reported.
• Economically disadvantaged students • Students from major racial and ethnic groups • Students with disabilities under the IDEA • Students with limited English proficiency
All students must be tested annually in grades 3-8 and once in high school (during the grade 10-12 span) in reading and mathematics. Schools must test students in science at least once in elementary, middle, and high school. These assessments were decided to be aligned with state academic standards. Schools were required to report the scores of the statewide assessments to parents in the form of a "report card." States must bring all students up to the "proficient" level on state tests by the 2013-14 school year. This certainly has not worked in a manner that it was intended and the rate of success has been questionable in many places for a variety of reasons.
Under NCLB, accommodations are defined as changes in testing materials or procedures that ensure that an assessment measures the student's knowledge rather than the student's disability. Students with Individualized Education Plans (IEP) may not be exempted from participating in a state's assessment system. The IEP determines how a student will participate, not whether a student will participate. Furthermore, out-of-level testing is not allowed under NCLB. Students, including students with disabilities, must be assessed at the student's assigned grade level.
A discussion about educational expectation and provision for students with disabilities emphasizes the importance of timely investment to help this group receive as much from the educational system as other students. This clearly shows that the importance of any program that can impact the situation and bring the level of learning of students with disabilities to the level of other students can be one of the most important developments that can help young people to overcome their learning problems. This is the most important element of this transformation and, at the same time, saves significant amounts of financial resources for many states who are involved in the process.
About the Hardy Brain Camp Workshop and Pilot Project
Boys & Girls Clubs of Greater Oxnard and Port Hueneme along with the United Boys & Girls Clubs of Santa Barbara County supported a joint effort to send a number of their members who needed such an intervention to the Hardy Brain Camp workshop over a period of twenty sessions.
Academic and Behavioral Improvements Study: Hardy Brain Camp 2011 Page 9
The training was designed using the Interactive Metronome training equipment and a proprietary training formula developed by Sherrie Hardy that is customized for each student’s needs. Students participate in pre-training exercises to prepare them for the “regular” training of 20 sessions if their millisecond (ms) timing is in the below average to severe range. Students with timings of less than 100 ms are ready to begin regular training. Most of the students selected for this pilot project had millisecond timings in the below average to severe range and needed pre-training prior to starting the regular training program.
Fifty-four students completed the study.4
The students in both groups were selected because of observed difficulties with learning, attention, organization, behavior, poor grades, listening, following directions, completing schoolwork, reading and/or math weaknesses. Some of the students were struggling in regular classrooms, some in Special-Education pull-out programs, some with Special Education one-to-one aides, some in full-day Special Education programs and some in programs for emotionally disturbed children. Some had no diagnosis and some had diagnoses of Learning Disabilities, ADD, ADHD, dyslexia, Central Auditory Processing Disorder, speech and language delay, dysgraphia, dyscalculia, Asperger’s Syndrome and autism. They all had severe difficulties that negatively impacted their ability to do well in school.
Thirty-two students were chosen and tested by the school psychologists from The Rio School District and participated at the three school sites. Twenty two students were selected by Boys and Girls Club staff and participated at the Boys & Girls Clubhouses at 5th Street, Seventh Street, Port Hueneme and Carpentaria.
4 It should be mentioned that a significant number of the children who attended the training did not complete the full course of the intervention and therefore their progress has been impacted by inability to complete the entire course.

Academic and Behavioral Improvements Study: Hardy Brain Camp 2011 Page 10
Methods: Data and Analyses
Data Gathering and Reporting
The students wore earphones through which they heard a rhythmic beat. Specific body movements were done to this beat. Triggers on hands and feet recorded the responses down to a hundredth of a millisecond. Fifteen different movement activities using hands, feet and a combination of hands and feet were used during the training. After each movement, the score was seen on the computer screen and an auditory tone was presented in the earphones simultaneously indicating if the response was “perfect” (within 20 milliseconds of the tone), slightly early, very early, slightly late or very late as the score flashed on the screen. The challenge the students faced was to reduce their millisecond times lower and lower, to learn how to get “perfect” hits and then to begin to get strings of perfect hits.
The training aimed at changing attention, learning, communication, behavior and organization for students who struggle in the classroom because it overwhelms the brain with more information than can be easily processed. The brain responds to this overload by growing new connections and strengthening existing ones to process the incoming information. The student’s millisecond scores drop as the brain is better able to process this massive amount of input. This growth is then used naturally in class to pay attention, learn, communicate, behave and organize better. Students who are behind in class and struggle with learning disabilities, ADD, ADHD, dyslexia, Central Auditory Processing Disorder, reading, math, speech & language delays, dysgraphia, dyscalculia, Asperger’s Syndrome and autism are able to make permanent gains in learning and attention. The program also helps average learners and gifted students who want to pay attention better, think faster, and do better in school.
Twenty-two of the students were pre- and post-tested at the Boys and Girls Clubs using the Woodcock-Johnson reading, math and processing speed inventories. The thirty two students who participated in conjunction with the Rio School District at the Boys and Girls Club School sites were trained at Rio Real, Rio Del Norte and Rio Del Valle Schools in the Rio School District. These students were selected by Rio School District psychologists due to the same observed criteria used to identify students at the Boys and Girls Club sites. The Rio School District school psychologist was in charge of the pre and post-testing of these students. They were pre and post-tested using the WISC Coding and Symbol Search tests to measure processing speed (see notes on the test sheet) and the Mathematics Performance Analysis.
Fourteen of the students in this group (the school-based sites) were post-tested prior to completing the entire training program of 20 sessions. Two of these students had some notable progress nevertheless in spite of the shortening of their program. One of the students who joined the program as a selective mute began communicating with peers, teachers, and BGC staff for the first time, using single words, text messages, and pictures to express his needs.
Another student who was a full-time special education day class student at the beginning of his training finished approximately half of the regular program and qualified to be moved out of full-time special education and mainstreamed into some regular classes for the first time ever.

Academic and Behavioral Improvements Study: Hardy Brain Camp 2011 Page 11
Most of the other 12 students who did not finish the entire program required extensive pre-training time and they had to be tested at the end of the school year and training could not continue over the summer since they were all school site students. Nevertheless, most of them made positive progress.
Because test scores may not fully reflect the growth students achieve, to evaluate how well the training transferred to the students’ classroom and home life, students were rated by their teachers, parents and Boys and Girls Club staff on their:
• Ability to pay attention • Academic improvement in reading, math, spelling, and writing • Ability to organize ideas and communicate • Ability to focus on work • Ability to finish work on time • Ability to listen and follow directions • Ability to manage frustration • Ability to complete work independently • Coordination and motor-skills • Ability to work with others • Self-confidence and self-esteem
The rating scale went from 1 (very poor), 3 (average) to 5 (excellent). In addition to the ratings, teachers, parents and staff were asked to write a comment on the progress they observed. There is one special rating from the school librarian at Rio Del Norte School who approached the program director about the positive overall changes she has observed in the entire group.
Data Analysis
A counterfactual research design was used, allowing us to compare the academic and behavioral performance of students in the Hardy Brain Camp Workshop, before and after the intervention.
Formal Achievement Test: Woodcock-Johnson and WISC
The Woodcock-Johnson metric was administered to 22 students before and after training (20 sessions). This metric measures the academic level of students for reading, mathematics, and processing speed.
The Wechsler Intelligence Scale for Children (WISC) was administered to 32 students before and after training (20 sessions). The WISC is an individual test that does not require reading or writing. Performance subtests are nonverbal problems, all of which are timed and some of which allow bonus points for extra fast work. A number of students in this group have had less than 20 sessions of training. The reports are for Coding and Symbol Search. The scores are reported in percentages. There is a considerable lack of consistent data that show the scores in the pre-post stages for a complete period of training due to the fourteen students who were unable to fully complete the training.
Academic and Behavioral Improvements Study: Hardy Brain Camp 2011 Page 12
Students’ Rating Scores by Parents, Teachers, and Boys & Girls Clubs Facilitators
The objectives of the program are to help students develop other useful skills that allow them to manage their lives better and function better in relation to others around them. The program’s objectives are to help students with:
• Ability to pay Attention • Academic Improvement • Ability to Organize Ideas • Ability to Focus on Work • Ability to Finish Work on Time • Ability to Listen and Follow Directions • Ability to Manage Frustration Level • Ability to Complete Work Independently • Coordination of Motor Skills • Ability to Work with Others • Improving Self Confidence and Self Esteem
Parents, teachers, and BGC facilitators rated each student on a scale of 1 to 5 (1 being the lowest, 3 being average and 5 the highest scores) for these traits.

Academic and Behavioral Improvements Study: Hardy Brain Camp 2011 Page 13
Results and Discussion Below are the results from the pre- and post-training tests, including the formal achievements tests (Woodcock-Johnson and WISC) and the eleven areas of improvements in academic, skill, and attitude of individual participants rated by their parents, teachers, and the Boys & Girls Clubs counselors. A more comprehensive report of the findings in graphic format can be found in the appendix of this report.
Woodcock-Johnson Test
This method was used for 22 students. We had consistent data for almost all of these 22 participants based on their pre- and post-workshop scores.
Reading, math, and processing results are reported in Table 1, Table 2, and Table 3, respectively. Respecting student confidentiality, student names are not reported. Test scores from Woodcock- Johnson are reported based on the age and grade level of the students.
Takeaways from Reading Tests Results • Every student showed improvement in reading, with the exception of one whose score did not
change and one whose score showed a slight decline. • The average student gained 9.1 months in reading • Almost half of the students made improvements of more than 1 year in reading (9 students) • In one case, the student gained 6 years in reading • There was no apparent relationship between the grade of the students and her/his level of
improvement.
Takeaways from Math Tests Results • Students showed an average of 3.9 months improvement in math • 77% of the students showed improvement (17 students) • One student’s score stayed the same. • Four students declined. It shows that their performance was not impacted by the workshop
intervention and they may have fallen back to a lower level.
Takeaways from Processing Speed Results • The average student had 16 months (1.6 academic years) improvement in processing speed • After training, 54% of the students performed at a level higher than their existing grade level. • This area of improvement was by far the most outstanding of the three areas.

Academic and Behavioral Improvements Study: Hardy Brain Camp 2011 Page 14
Table 1: Summary of Reading Scores for Group of 22 Students Using Woodcock-Johnson Method
Pre-Training Reading Grade Level
Post-Training Reading Grade Level
Change in Score Months Improvement
3.1 3.4 0.3 3.0 2.3 2.1 -0.2 -2.0 4.0 4.8 0.8 8.0 0.8 1.3 0.5 5.0 2.3 2.9 0.6 6.0 2.7 3.6 0.9 9.0
below K 1.8 1.8 18.0 2.2 2.4 0.2 2.0
below k 1.1 1.1 1 1.0 2.2 2.4 0.2 2.0 2.7 2.8 0.1 1.0 4.0 4.6 0.6 6.0 1.6 3.6 2.0 20.0 2.6 9.0 6.4 64.0 7.3 9.0 1.7 17.0 2.1 3.4 1.3 13.0 2.1 2.3 0.2 2.0 1.6 2.0 0.4 4.0 4.0 4.6 0.6 6.0 2.4 2.4 0.0 0.0 1.8 2.1 0.3 3.0 2.8 3.1 0.3 3.0
Average Months Improved Per Student 9.1 months

Academic and Behavioral Improvements Study: Hardy Brain Camp 2011 Page 15
Table 2: Summary of Math Scores for Group of 22 Students Using Woodcock-Johnson Method
Pre-Training Math Grade Level
Post-Training Math Grade Level Change Months Improvement
6.1 6.2 0.1 1.0 2.4 2.6 0.2 2.0 2.0 2.5 0.5 5.0 1.6 1.1 -0.5 -5.0 2.0 2.8 0.8 8.0 2.9 3.5 0.6 6.0 1.6 1.8 0.2 2.0 4.9 4.4 -0.5 -5.0 1.2 0.5 -0.7 -7.0 2.3 2.2 -0.1 -1.0 0.0 2.2 2.2 22.0 6.8 7.1 0.3 3.0 1.7 2.9 1.2 12.0 2.7 5.4 2.7 27.0 8.7 6.8 -1.9 -19.0 2.2 3.4 1.2 12.0 3.0 3.3 0.3 3.0 2.9 3.0 0.1 1.0 3.9 4.1 0.2 2.0 1.1 2.0 0.9 9.0 2.4 2.4 0.0 0.0 3.0 3.8 0.8 8.0
Average Months Improved Per Student 3.9 months

Academic and Behavioral Improvements Study: Hardy Brain Camp 2011 Page 16
Table 3: Summary of Processing Speed for Group of 22 Students Using Woodcock-Johnson Method
Pre-Training Processing Grade Level
Post-Training Processing Grade Level Change Months Improvement
3.5 5.4 1.9 19.0 3.0 4.2 1.2 12.0 1.9 3.8 1.9 19.0 2.1 3.6 1.5 15.0 0.6 2.1 1.5 15.0 5.2 7.3 2.1 21.0 2.1 2.3 0.2 2.0 2.8 4.5 1.7 17.0 0.2 1.5 1.3 13.0 2.4 4.5 2.1 21.0 2.5 4.2 1.7 17.0 3.2 4.3 1.1 11.0 2.4 3.3 0.9 9.0 2.5 8.5 6.0 60.0 4.6 5.2 0.6 6.0 1.4 3.0 1.6 16.0 3.0 4.2 1.2 12.0 3.6 5.2 1.6 16.0 6.0 8.2 2.2 22.0 1.0 0.7 -0.3 -3.0 2.4 4.3 1.9 19.0 3.6 5.8 2.2 22.0
Average Months Improved Per Student 16 months

Academic and Behavioral Improvements Study: Hardy Brain Camp 2011 Page 17
Wechsler Intelligence Scale for Children (WISC) Test
The WISC test was administered to 32 students for two areas: Coding and Symbol Search. These students also completed the Mathematics Performance Inventory. The results of each are reported in Table 4, Table 5, and Table 6.
Takeaways from Change in Coding Test Results: • Students showed an average improvement of 10.9% • 46% of students (15 students) improved, some with minor improvement but most with a
significant level of improvement • 11 of the students with less than the desired level of improvement also did not complete
training
Takeaways from Change in Symbol Search Test Results: • Students showed an average improvement of 31.2% • 81% (26 cases) of students showed improvement, 2 students showed no change, and 2
declined
Takeaways from Change in Math Test Results: • The Mathematics Performance Inventory requires a full years’ growth (rather than month-by-
month, as in the Woodcock-Johnson) to show any gains. Gains of even 9 months therefore appear as 0.
• 30% of students showed improvement in math scores, despite the metric’s limitations • 43% (14 students) did not make at least one whole year of growth • 15% (5 students) were performing at their existing grade level • 12% (4 students) declined in grade level • Overall, the average improvement was 2.9 months

Academic and Behavioral Improvements Study: Hardy Brain Camp 2011 Page 18
Table 4: Summary of Coding Testing for 32 students Using WISC Method
Pre-Training Percentile Post-Training Percentile Improvement 5% 39% 34%
can't use scores * * 0% 12% 12% 0% 1% 1%
39% 68% 29% 16% 50% 34% 37% 42% 5% 84% 99% 15% 87% 87% 0% 1% 1% 0%
50% 50% 0% 63% 25% -38% 1% 84% 83%
10% 19% 9% 30% 30% 0% 0% 1% 1%
can't use scores * * 45% 50% 5%
* * * * * * * * *
1% 97% 96% 68% 95% 27% 50% 50% 0%
* * * 5% 9% 4%
42% 68% 26% 55% 19% -36% 50% 50% 0% 99% 96% -3%
can't use scores * * 81% 50% -31% Improvement per person on average 10.9%

Academic and Behavioral Improvements Study: Hardy Brain Camp 2011 Page 19
Table 5: Summary of Symbol Testing for 32 students Using WISC Method
Pre-Training Percentile Post-Training Percentile Improvement 5% 87% 82%
42% 68% 26% 42% 79% 37% 0% 19% 19% 1% 75% 74% * *
0% 87% 87% * *
30% 99% 69% 1% 25% 24%
30% 96% 66% 1% 37% 36% 1% 63% 62%
30% 19% -11% 1% 12% 11% 1% 1% 0%
can't use scores 81% 99% 18% 0% 68% 68% 6% 42% 36% 1% 37% 36% 1% 21% 20%
68% 86% 18% 42% 68% 26% 19% 50% 31% 2% 32% 30%
98% 30% -68% 42% 89% 47% 30% 30% 0% 87% 96% 9% 19% 42% 23% 50% 79% 29% Improvement per person on average 31.2%

Academic and Behavioral Improvements Study: Hardy Brain Camp 2011 Page 20
Table 6: Summary of Math Scores for Group of 32 Students Using Mathematics Performance Inventory
Pre-Training Math Grade Level
Post-Training Math Grade Level Change Months Improvement
2 1 -1 -9 1 2 1 9 1 K 0 0 2 2 18 3 3 0 0 2 3 1 9 1 3 2 18 0 0 0 0 3 3 0 0 4 4 0 0 1 2 1 9 4 4 0 0 2 3 1 9 4 4 0 0 3 3 0 0 K K 0 0 3 4 1 9 4 5 1 9 K K 0 0 1 0 -1 -9 4 4 0 0 0 1 1 9 4 5 1 9 4 4 0 0 3 1 -2 -18 0 1 1 9 2 2 0 0 4 5 1 9 3 3 0 0
can't use scores K K 0 3 3 0 0
Average Months Improved Per Student 2.9 months

Academic and Behavioral Improvements Study: Hardy Brain Camp 2011 Page 21
Summary of Achievement Test Results
• Regardless of the achievement test used, students showed improvement on all metrics after completing Hardy Brain Camp:
o Math skills improved. Students taking the Woodcock-Johnson Mathematics Skills test showed an average of 3.9 months improvement in math. Students taking the Mathematics Performance Inventory showed only 2.9 months average growth; however, this was likely due to the fact that the inventory is only sensitive to a full year’s growth.
o Reading skills improved. Students taking the Woodcock-Johnson Reading Skills test showed an average of 9.1 months improvement in reading.
o Processing speed improved. Students taking the Woodcock-Johnson processing skills test showed an average of 16 months improvement. Students taking the Coding processing test showed an average of 10.9% improvement; students taking the Symbol Search test showed an average of 31.2% improvement.
• The students who showed less improvement than most only partially completed the prescribed 20 sessions. This may have contributed to their comparatively lower level of performance and improvement.
Results from Ranking of the Students’ Abilities
Students were ranked in eleven competency areas, both before and after completion of the Hardy Brain Camp program. The evaluators were the parents, teachers, and Boys & Girls Club counselors and program coordinators, who have been in close contacts with the program participants before, during and after the training was over. Results from these evaluations are tabulated in Table 7. All three groups of evaluators found significant positive growth in the students’ performance. For many students, the growth was huge: moving from a score of 1 to 5.
Overall, the evaluators found:
• 32.1% improvement in reading, math, spelling, and writing • 35.2% improvement in ability to pay attention • 35.1% improvement in ability to focus • 32.1% improvement in listening skills • 30.5% improvement in self confidence • 31.3% improvement in ability to finish work independently • 30.4% improvement in ability to finish work on time • 27.5% improvement in ability to manage frustration levels • 26.7% improvement in ability to organize and communicate ideas • 25.4% improvement in ability to work well with others • 20.8% improvement in coordination and motor skills

Academic and Behavioral Improvements Study: Hardy Brain Camp 2011 Page 22
Table 7: Ranking of eleven areas of student ability assessed by parents, teachers, and counselors
Detailed Data Breakdown
Trait Overall
Improvement
# of Students
Min Change
Max Change
Mean Change +/-
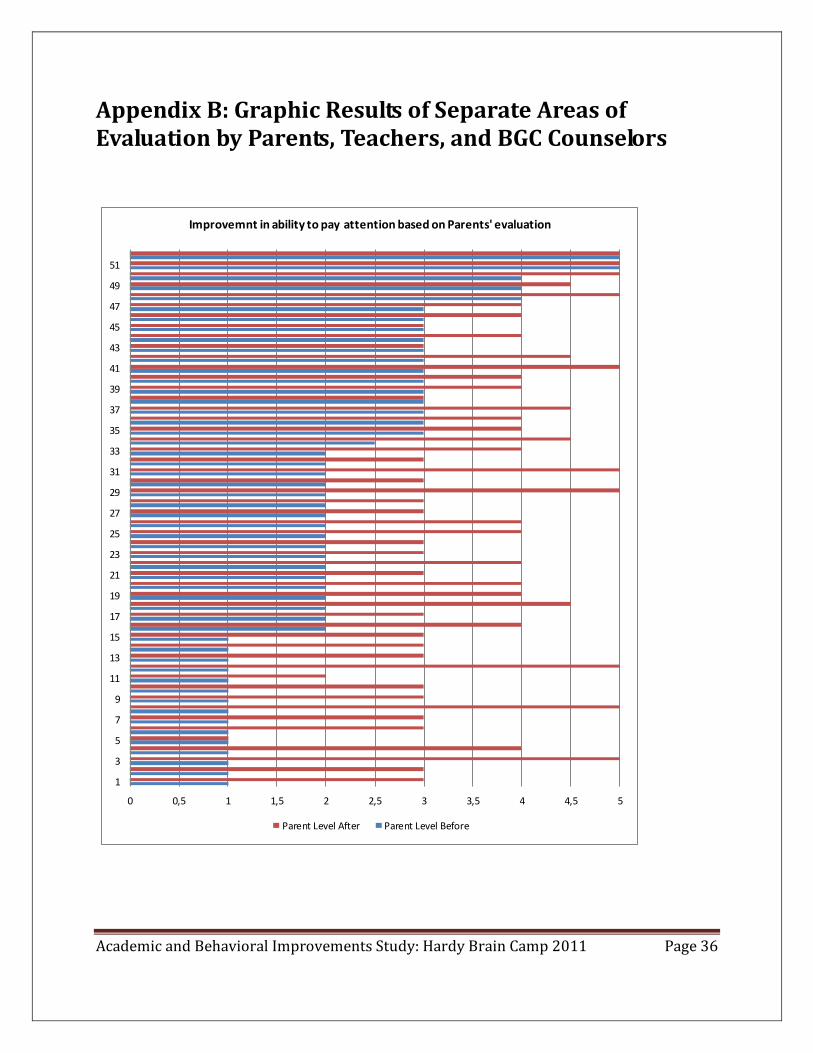
Attention 35.2% Parents 52 0% 100% 39.3% 24.9% Teachers 54 -75% 75% 24.0% 26.2% BGC Counselors 53 0% 100% 42.3% 19.5%
Academic Performance 32.1%
Parents 52 0% 100% 39.2% 23.0% Teachers 53 -75% 100% 24.1% 25.2% BGC Counselors 49 0% 75% 33.0% 22.9%
Ability to Organize Ideas &
Communicate 26.7%
Parents 52 0% 75% 31.7% 23.2% Teachers 53 -50% 75% 19.4% 22.6% BGC Counselors 52 0% 100% 29.0% 23.6%
Focus 35.1% Parents 52 -25% 10% 40.4% 27.8% Teachers 53 -75% 75% 23.1% 26.6% BGC Counselors 51 0% 75% 41.8% 17.1%
Ability to Finish Work on Time 30.4%
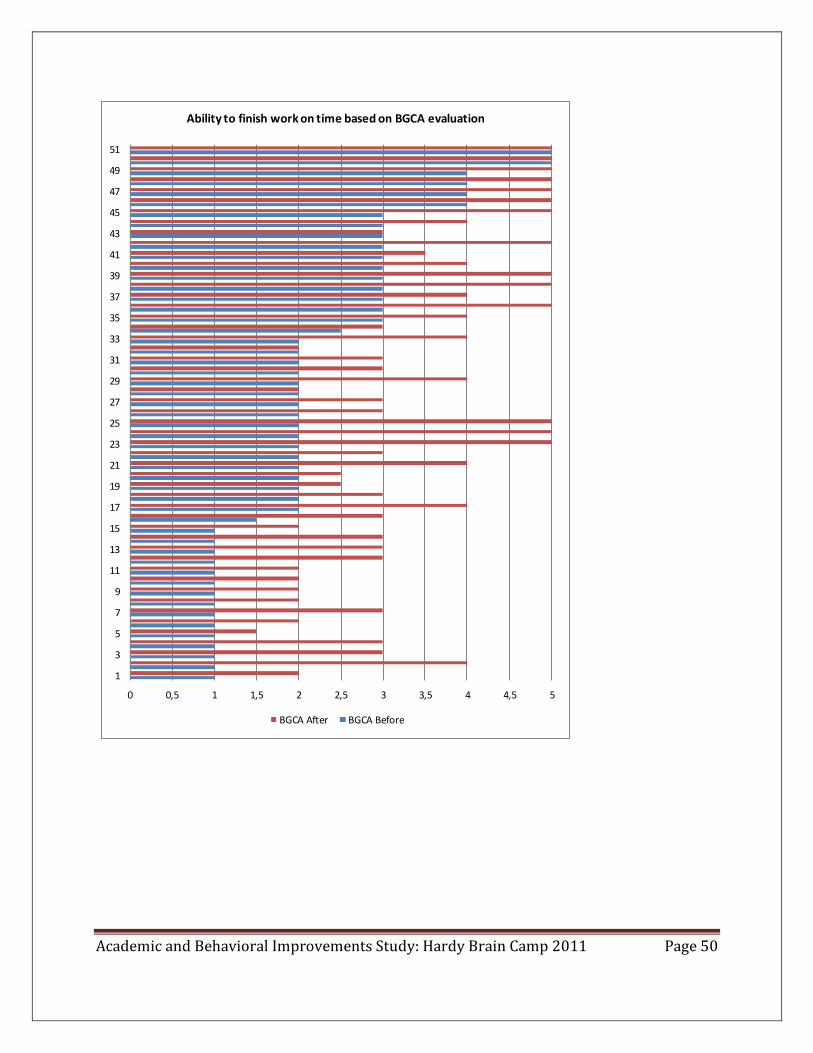
Parents 50 -25% 100% 37.3% 24.4% Teachers 53 -75% 75% 21.2% 24.8% BGC Counselors 51 0% 75% 32.8% 20.2%
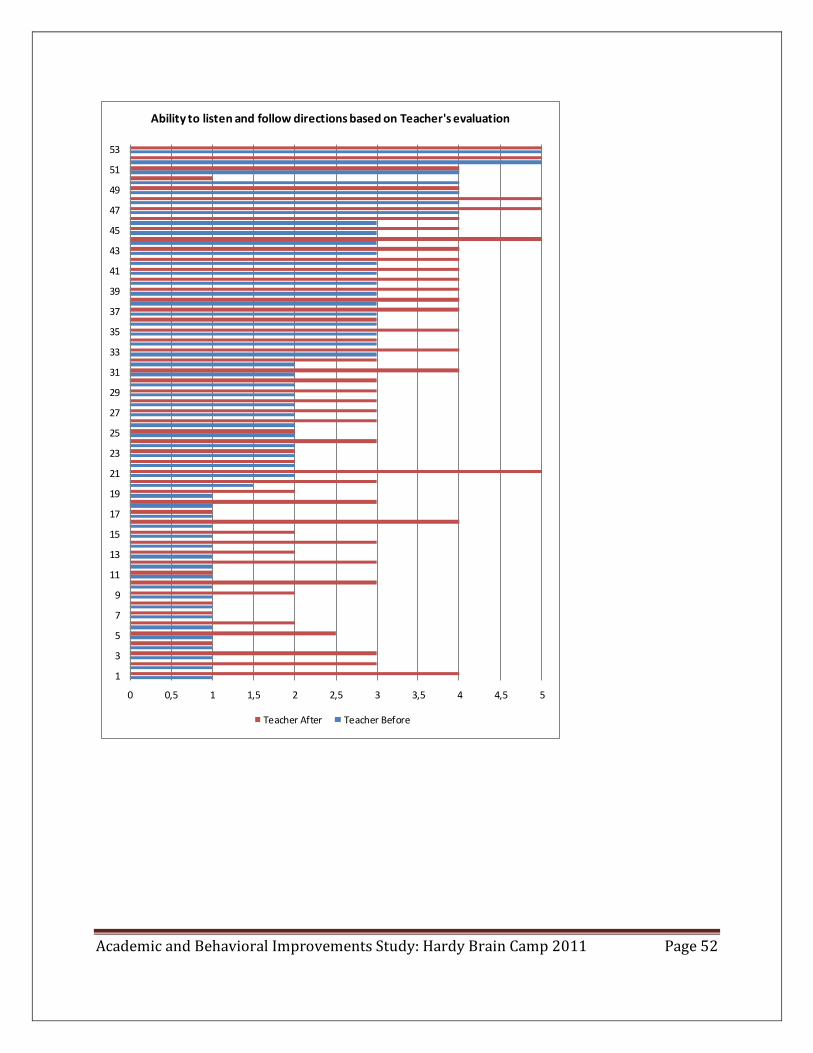
Listening Skills 32.1% Parents 51 0% 100% 33.1% 23.9% Teachers 54 -75% 75% 24.1% 24.6% BGC Counselors 52 0% 100% 39.1% 26.1%
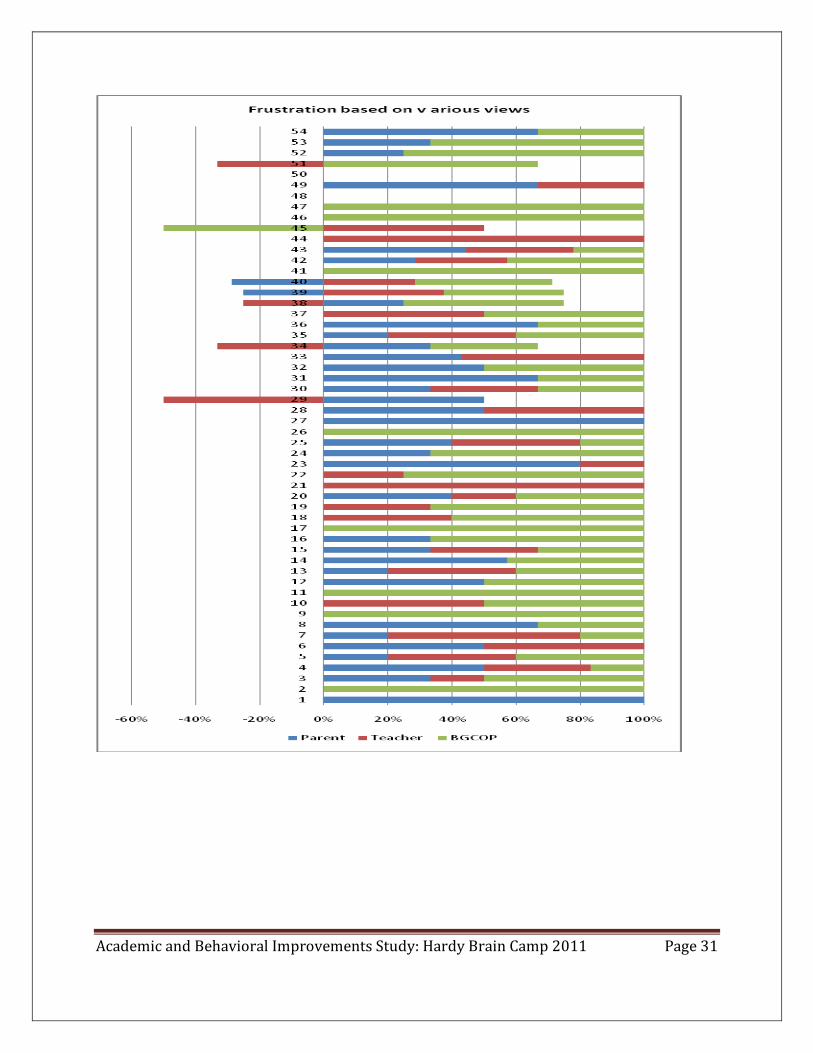
Ability to Avoid Frustration 27.5%
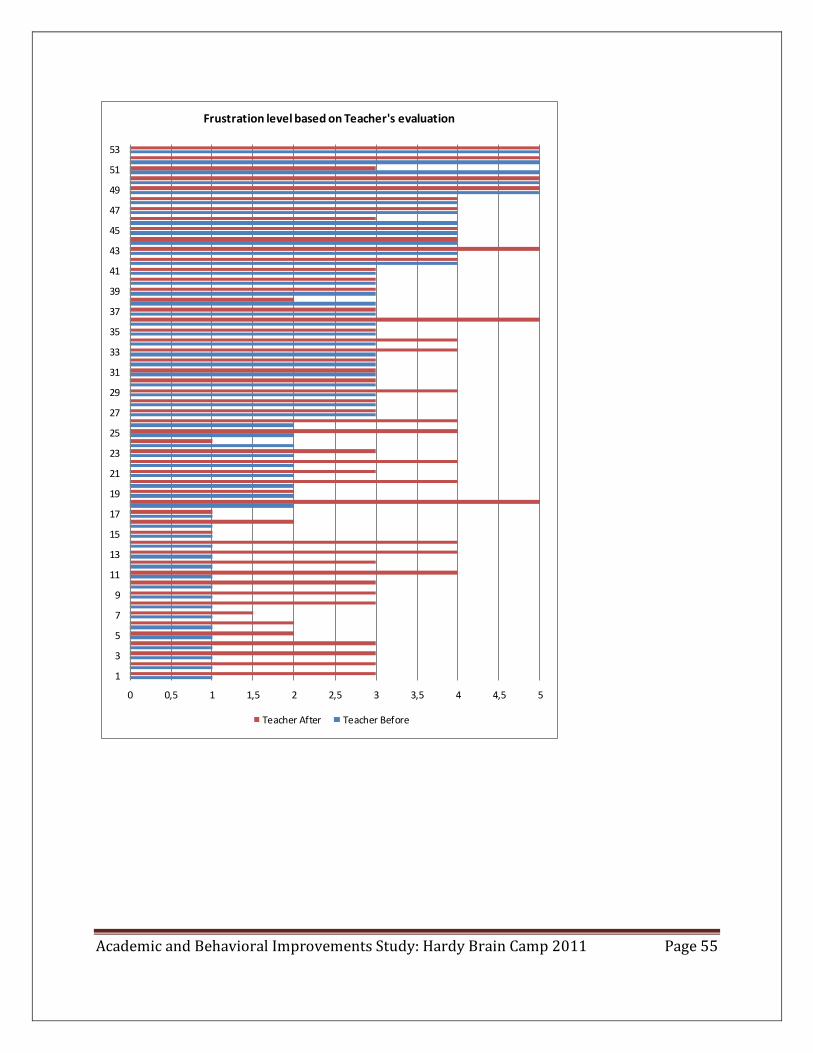
Parents 52 -50% 100% 24.7% 28.2% Teachers 54 -50% 75% 20.8% 28.9% BGC Counselors 51 -50% 100% 36.9% 30.0%
Ability to Finish Work
Independently 31.3%
Parents 51 0% 100% 38.1% 24.1% Teachers 54 -75% 100% 23.8% 29.2% BGC Counselors 51 0% 87.5% 32.0% 22.1%
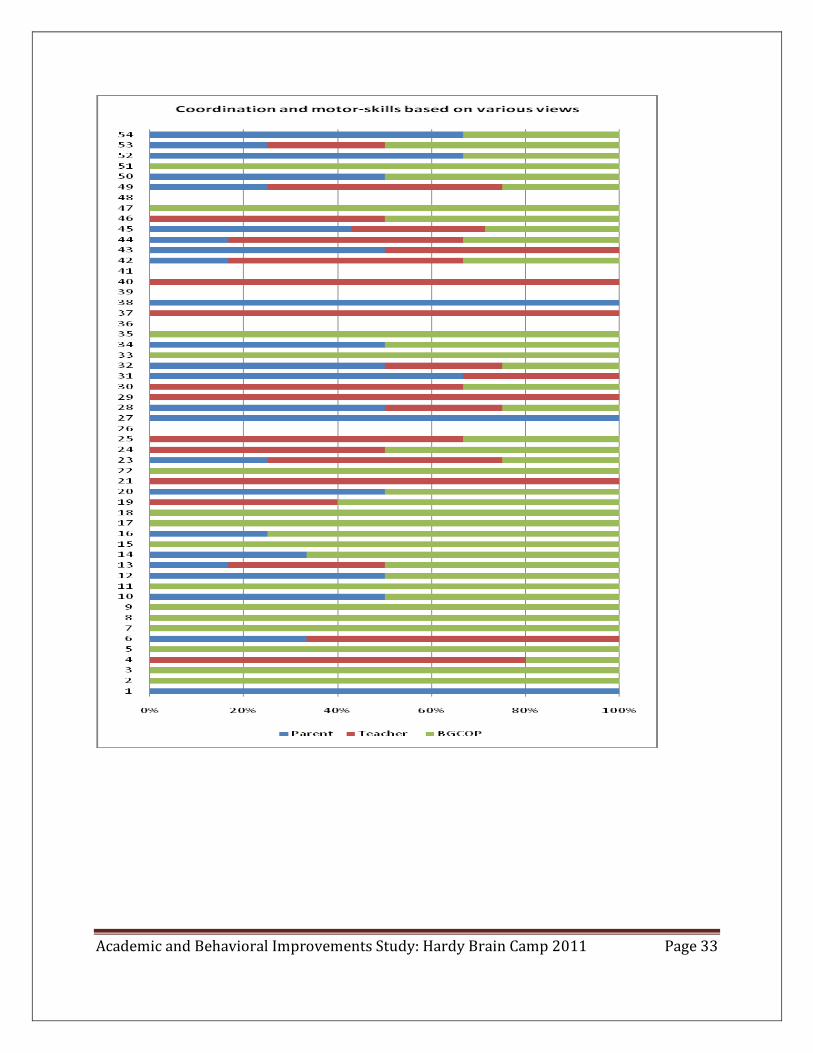
Coordination & Motor Skills 20.8%
Parents 52 0% 75% 17.4% 22.0% Teachers 51 0% 75% 18.9% 23.1% BGC Counselors 52 0% 75% 26.1% 21.5%
Ability to Work Well with Others 25.4%
Parents 52 0% 100% 26.8% 24.4% Teachers 54 -50% 100% 20.0% 27.8% BGC Counselors 52 0% 100% 29.3% 23.1%
Self Confidence 30.5% Parents 52 0% 75% 32.8% 23.2% Teachers 54 -75% 75% 22.1% 25.2% BGC Counselors 52 0% 75% 36.7% 22.2%

Academic and Behavioral Improvements Study: Hardy Brain Camp 2011 Page 23
Raw data from Table 7:
Descriptive Statistics of Changes in Ranking provided by Parents, Teachers and the Counselors N Minimum Maximum Mean Std. Deviation P_Attention 51 0 4 1.55 0.996 T_Attention 53 -3 3 0.92 1.046 BGC_Attention 53 0 4 1.70 0.780 P_Academic 53 0 4 1.56 0.918 T_Academic 53 -3 4 0.92 1.007 BGC_Academic 49 0 3 1.34 0.915 P_OrgIdea 53 0 3 1.25 0.928 T_OrgIdea 53 -2 3 0.73 0.902 BGC_OrgIdea 52 0 4 1.16 0.943 P_Focus 53 -1 4 1.59 1.110 T_Focus 53 -3 3 0.86 1.062 BGC_Focus 51 0.0 3.0 1.686 0.6853 P_Finish 51 -1 4 1.47 0.977 T_Finish 53 -3 3 0.80 0.992 BGC_Finish 51 0 3 1.31 0.806 P_Listen 52 0 4 1.28 0.957 T_Listen 54 -3 3 0.93 0.983 BGC_Listen 52 0 4 1.57 1.043 P_Frustration 53 -2 4 0.97 1.128 T_Frustration 54 -2 3 0.79 1.156 BGC_Frustration 51 -2 4 1.48 1.200 P_CompWork 52 0 4 1.50 0.965 T_CompWork 53 -3 4 0.89 1.167 BGC_CompWork 51 0.0 3.5 1.284 0.8846 P_Motor 53 0 3 0.69 0.878 T_Motor 51 0 3 0.71 0.923 BGC_Motor 52 0 3 1.05 0.859 P_WorkOthers 54 0 4 1.04 0.975 T_WorkOthers 54 -2 4 0.78 1.110 BGC_WorkOthers 52 0 4 1.17 0.923 P_SelfConf 53 0 3 1.29 0.927 T_SelfConf 54 -3 3 0.84 1.009 BGC_SelfConf 52 0 3 1.47 0.888
P: Stands for parents Note:
T: stands for teachers BGC: presents ranking provided by the Boys & Girls Clubs Counselors Attention: Ability to pay attention Academic: Academic improvement Orgldea: Ability to organize ideas and communicate
Focus: Ability to focus on work Finish: Ability to finish work on time Listen: Ability to listen and follow directions Frustration: Frustration level CompWork: Ability to complete work independently Motor: Coordination and motor-skills WorkOthers: Ability to work well with others SElfConf: Self-confidence and self-esteem

Academic and Behavioral Improvements Study: Hardy Brain Camp 2011 Page 24
Conclusions The twenty-two students tested with the Woodcock-Johnson gained an average of:
• 9.1 months improvement in reading. • 3.9 months improvement in math. • 16 months (1.6 years) improvement in processing speed. This was the most significant
outcome
. Processing speed is the combination of thinking speed and decision-making speed. As students improve their processing speed they are able to think faster and absorb information more easily.
The thirty-two students who were tested with the WISC showed an average of: • 10.9% improvement in processing speed in the WISC Coding measurement. • 31.2% improvement in processing speed in the WISC Symbol Search.
The thirty-two students who were tested on the Mathematics Performance Inventory showed an average of:
• 2.9 months improvement in math.
The students also showed dramatic improvement in ratings from teachers, parents, and Boys and Girls Club counselors on the 11 academic and behavior traits for which they were tested. Remarkable improvements were made in academic performance, attitude, ability to process information, and ability to deal with the surrounding environment
Students showed an average improvement of:
• Ability to pay attention: 35.2% improvement • Reading, math, spelling, and writing: 32.1% improvement • Ability to organize and communicate ideas: 26.7% improvement • Focus: 35.1% improvement • Ability to finish work on time: 30.4% improvement • Listening skills: 32.1% improvement • Ability to manage frustration: 27.5% improvement • Ability to finish work independently: 31.3% improvement • Coordination and motor skills: 20.8% improvement • Ability to work well with others: 25.4% improvement • Self confidence: 30.5% improvement
For the 11 traits reported, teachers reported an average of 21.9% improvement, parents reported an average of 32.8% improvement and Boys and Girls Club counselors reported an average of 34.4% improvement.

Academic and Behavioral Improvements Study: Hardy Brain Camp 2011 Page 25
Appendix A: Graphic Presentation of Differential Changes in Eleven Areas Evaluated by Parents, Teachers, and Counselors

Academic and Behavioral Improvements Study: Hardy Brain Camp 2011 Page 26

Academic and Behavioral Improvements Study: Hardy Brain Camp 2011 Page 27

Academic and Behavioral Improvements Study: Hardy Brain Camp 2011 Page 28

Academic and Behavioral Improvements Study: Hardy Brain Camp 2011 Page 29

Academic and Behavioral Improvements Study: Hardy Brain Camp 2011 Page 30
Academic and Behavioral Improvements Study: Hardy Brain Camp 2011 Page 31

Academic and Behavioral Improvements Study: Hardy Brain Camp 2011 Page 32
Academic and Behavioral Improvements Study: Hardy Brain Camp 2011 Page 33

Academic and Behavioral Improvements Study: Hardy Brain Camp 2011 Page 34

Academic and Behavioral Improvements Study: Hardy Brain Camp 2011 Page 35
Academic and Behavioral Improvements Study: Hardy Brain Camp 2011 Page 36
Appendix B: Graphic Results of Separate Areas of Evaluation by Parents, Teachers, and BGC Counselors
0 0,5 1 1,5 2 2,5 3 3,5 4 4,5 5
1
3
5
7
9
11
13
15
17
19
21
23
25
27
29
31
33
35
37
39
41
43
45
47
49
51
Improvemnt in ability to pay attention based on Parents' evaluation
Parent Level After Parent Level Before

Academic and Behavioral Improvements Study: Hardy Brain Camp 2011 Page 37
0 0,5 1 1,5 2 2,5 3 3,5 4 4,5 5
1
3
5
7
9
11
13
15
17
19
21
23
25
27
29
31
33
35
37
39
41
43
45
47
49
51
53
Improvement in ability to pay attention based on Techers' evaluation
Teacher After Teacher Before

Academic and Behavioral Improvements Study: Hardy Brain Camp 2011 Page 38
0 0,5 1 1,5 2 2,5 3 3,5 4 4,5 5
1
3
5
7
9
11
13
15
17
19
21
23
25
27
29
31
33
35
37
39
41
43
45
47
49
51
53
Improvement in ability to pay attention based on BGCA evaluation
BGCA After BGCA Before

Academic and Behavioral Improvements Study: Hardy Brain Camp 2011 Page 39
0 0,5 1 1,5 2 2,5 3 3,5 4 4,5 5
1
3
5
7
9
11
13
15
17
19
21
23
25
27
29
31
33
35
37
39
41
43
45
47
49
51
Academic improvement based on Parent's evaluation
Parent After Parent Before

Academic and Behavioral Improvements Study: Hardy Brain Camp 2011 Page 40
0 0,5 1 1,5 2 2,5 3 3,5 4 4,5 5
1
3
5
7
9
11
13
15
17
19
21
23
25
27
29
31
33
35
37
39
41
43
45
47
49
51
Academic improvement based on Teacher's evaluation
Teacher After Teacher Before

Academic and Behavioral Improvements Study: Hardy Brain Camp 2011 Page 41
0 0,5 1 1,5 2 2,5 3 3,5 4 4,5 5
1
3
5
7
9
11
13
15
17
19
21
23
25
27
29
31
33
35
37
39
41
43
45
47
49
Academic improvement based on BGCA evaluation
BGCA After BGCA Before

Academic and Behavioral Improvements Study: Hardy Brain Camp 2011 Page 42
0 0,5 1 1,5 2 2,5 3 3,5 4 4,5 5
1
3
5
7
9
11
13
15
17
19
21
23
25
27
29
31
33
35
37
39
41
43
45
47
49
51
Ability to organize ideas and communicate based on Parent's evaluation
Parent After Parent Before

Academic and Behavioral Improvements Study: Hardy Brain Camp 2011 Page 43
0 0,5 1 1,5 2 2,5 3 3,5 4 4,5 5
1
3
5
7
9
11
13
15
17
19
21
23
25
27
29
31
33
35
37
39
41
43
45
47
49
51
Ability to organize ideas and communicate based on Teacher's evaluation
Teacher After Teacher Before

Academic and Behavioral Improvements Study: Hardy Brain Camp 2011 Page 44
0 0.5 1 1.5 2 2.5 3 3.5 4 4.5 5
1
3
5
7
9
11
13
15
17
19
21
23
25
27
29
31
33
35
37
39
41
43
45
47
49
51
Ability to organize ideas and communicate based on BGCA evaluation
BGCA After BGCA Before

Academic and Behavioral Improvements Study: Hardy Brain Camp 2011 Page 45
0 0,5 1 1,5 2 2,5 3 3,5 4 4,5 5
1
3
5
7
9
11
13
15
17
19
21
23
25
27
29
31
33
35
37
39
41
43
45
47
49
51
Ability to focus on work based on Parent's evaluation
Parent After Parent Before

Academic and Behavioral Improvements Study: Hardy Brain Camp 2011 Page 46
0 0,5 1 1,5 2 2,5 3 3,5 4 4,5 5
1
3
5
7
9
11
13
15
17
19
21
23
25
27
29
31
33
35
37
39
41
43
45
47
49
51
Ability to focus on work based on Techers's evaluation
Teacher After Teacher Before

Academic and Behavioral Improvements Study: Hardy Brain Camp 2011 Page 47
0 0,5 1 1,5 2 2,5 3 3,5 4 4,5 5
1
3
5
7
9
11
13
15
17
19
21
23
25
27
29
31
33
35
37
39
41
43
45
47
49
51
Ability to focus on work based on BGCA evaluation
BGCA After BGCA Before

Academic and Behavioral Improvements Study: Hardy Brain Camp 2011 Page 48
0 0,5 1 1,5 2 2,5 3 3,5 4 4,5 5
1
3
5
7
9
11
13
15
17
19
21
23
25
27
29
31
33
35
37
39
41
43
45
47
49
Ability to finish work on time based on Parent's evaluation
Parent After Parent Before

Academic and Behavioral Improvements Study: Hardy Brain Camp 2011 Page 49
0 0,5 1 1,5 2 2,5 3 3,5 4 4,5 5
1
3
5
7
9
11
13
15
17
19
21
23
25
27
29
31
33
35
37
39
41
43
45
47
49
51
Ability to finish work on time based on Teacher's evaluation
Teacher After Teacher Before
Academic and Behavioral Improvements Study: Hardy Brain Camp 2011 Page 50
0 0,5 1 1,5 2 2,5 3 3,5 4 4,5 5
1
3
5
7
9
11
13
15
17
19
21
23
25
27
29
31
33
35
37
39
41
43
45
47
49
51
Ability to finish work on time based on BGCA evaluation
BGCA After BGCA Before

Academic and Behavioral Improvements Study: Hardy Brain Camp 2011 Page 51
0 0,5 1 1,5 2 2,5 3 3,5 4 4,5 5
1
3
5
7
9
11
13
15
17
19
21
23
25
27
29
31
33
35
37
39
41
43
45
47
49
51
Ability to listen and follow directions based on Parent's evaluation
Parent After Parent Before
Academic and Behavioral Improvements Study: Hardy Brain Camp 2011 Page 52
0 0,5 1 1,5 2 2,5 3 3,5 4 4,5 5
1
3
5
7
9
11
13
15
17
19
21
23
25
27
29
31
33
35
37
39
41
43
45
47
49
51
53
Ability to listen and follow directions based on Teacher's evaluation
Teacher After Teacher Before

Academic and Behavioral Improvements Study: Hardy Brain Camp 2011 Page 53
0 0,5 1 1,5 2 2,5 3 3,5 4 4,5 5
1
3
5
7
9
11
13
15
17
19
21
23
25
27
29
31
33
35
37
39
41
43
45
47
49
51
Ability to listen and follow directions based on BGCA evaluation
BGCA After BGCA Before

Academic and Behavioral Improvements Study: Hardy Brain Camp 2011 Page 54
0 0,5 1 1,5 2 2,5 3 3,5 4 4,5 5
1
3
5
7
9
11
13
15
17
19
21
23
25
27
29
31
33
35
37
39
41
43
45
47
49
51
Frustration level based on Parent's evaluation
Parent After Parent Before
Academic and Behavioral Improvements Study: Hardy Brain Camp 2011 Page 55
0 0,5 1 1,5 2 2,5 3 3,5 4 4,5 5
1
3
5
7
9
11
13
15
17
19
21
23
25
27
29
31
33
35
37
39
41
43
45
47
49
51
53
Frustration level based on Teacher's evaluation
Teacher After Teacher Before
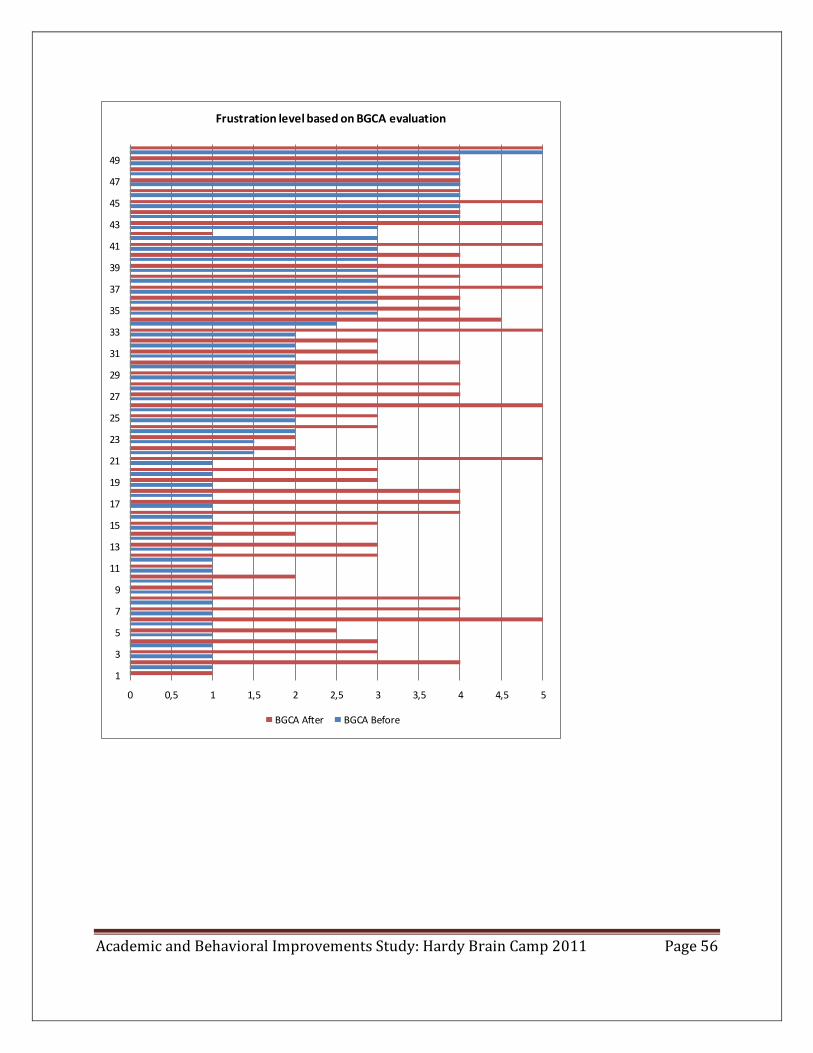
Academic and Behavioral Improvements Study: Hardy Brain Camp 2011 Page 56
0 0,5 1 1,5 2 2,5 3 3,5 4 4,5 5
1
3
5
7
9
11
13
15
17
19
21
23
25
27
29
31
33
35
37
39
41
43
45
47
49
Frustration level based on BGCA evaluation
BGCA After BGCA Before

Academic and Behavioral Improvements Study: Hardy Brain Camp 2011 Page 57
0 0,5 1 1,5 2 2,5 3 3,5 4 4,5 5
1
3
5
7
9
11
13
15
17
19
21
23
25
27
29
31
33
35
37
39
41
43
45
47
49
51
Ability to complete work independently based on Parent's evaluation
Parent After Parent Before

Academic and Behavioral Improvements Study: Hardy Brain Camp 2011 Page 58
0 0,5 1 1,5 2 2,5 3 3,5 4 4,5 5
1
3
5
7
9
11
13
15
17
19
21
23
25
27
29
31
33
35
37
39
41
43
45
47
49
51
Ability to complete work independently based on Teacher's evaluation
Teacher After Teacher Before

Academic and Behavioral Improvements Study: Hardy Brain Camp 2011 Page 59
0 0,5 1 1,5 2 2,5 3 3,5 4 4,5 5
1
3
5
7
9
11
13
15
17
19
21
23
25
27
29
31
33
35
37
39
41
43
45
47
49
51
Ability to complete work independently based on BGCA evaluation
BGCA After BGCA Before

Academic and Behavioral Improvements Study: Hardy Brain Camp 2011 Page 60
0 0,5 1 1,5 2 2,5 3 3,5 4 4,5 5
1
3
5
7
9
11
13
15
17
19
21
23
25
27
29
31
33
35
37
39
41
43
45
47
49
51
Coordination and motor-skills based on Parent's evaluation
Parent After Parent Before

Academic and Behavioral Improvements Study: Hardy Brain Camp 2011 Page 61
0 0,5 1 1,5 2 2,5 3 3,5 4 4,5 5
1
3
5
7
9
11
13
15
17
19
21
23
25
27
29
31
33
35
37
39
41
43
45
47
49
Coordination and motor-skills based on Teacher's evaluation
Teacher After Teacher Before
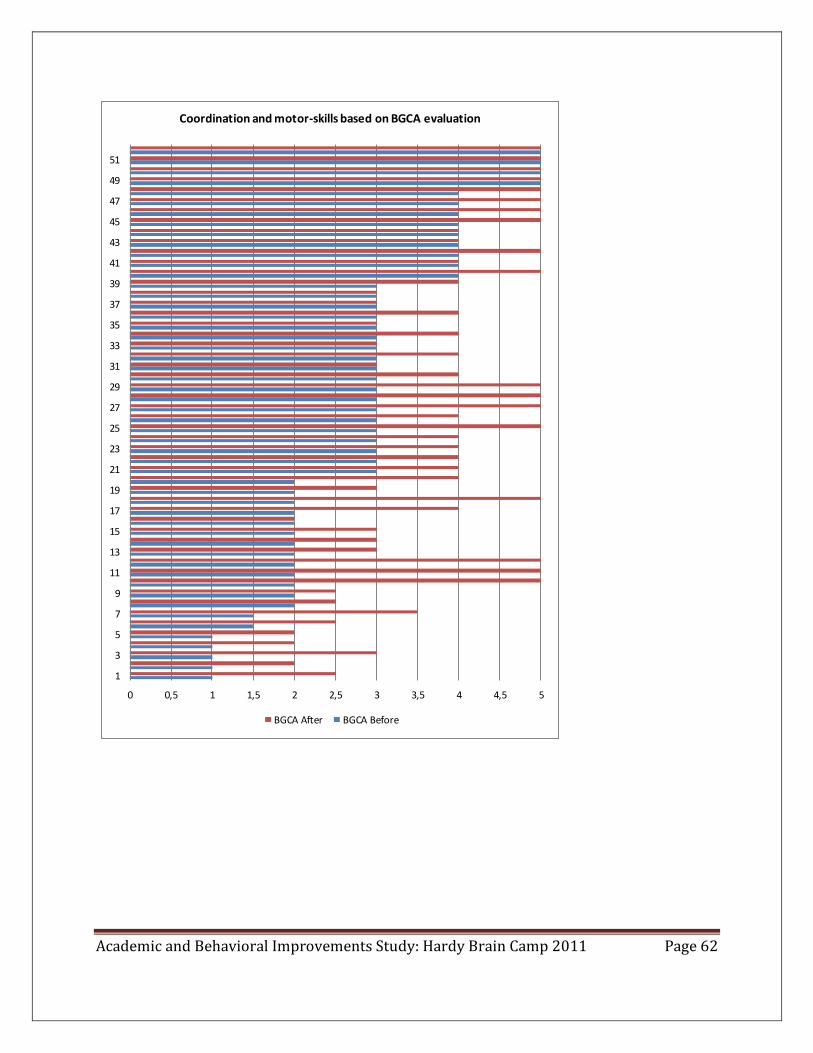
Academic and Behavioral Improvements Study: Hardy Brain Camp 2011 Page 62
0 0,5 1 1,5 2 2,5 3 3,5 4 4,5 5
1
3
5
7
9
11
13
15
17
19
21
23
25
27
29
31
33
35
37
39
41
43
45
47
49
51
Coordination and motor-skills based on BGCA evaluation
BGCA After BGCA Before

Academic and Behavioral Improvements Study: Hardy Brain Camp 2011 Page 63
0 0,5 1 1,5 2 2,5 3 3,5 4 4,5 5
1
3
5
7
9
11
13
15
17
19
21
23
25
27
29
31
33
35
37
39
41
43
45
47
49
51
Ability to work well with others based on Parent's evaluation
Parent After Parent Before

Academic and Behavioral Improvements Study: Hardy Brain Camp 2011 Page 64
0 0,5 1 1,5 2 2,5 3 3,5 4 4,5 5
1
3
5
7
9
11
13
15
17
19
21
23
25
27
29
31
33
35
37
39
41
43
45
47
49
51
53
Ability to work well with others based on Teacher's evaluation
Teacher After Teacher Before

Academic and Behavioral Improvements Study: Hardy Brain Camp 2011 Page 65
0 0,5 1 1,5 2 2,5 3 3,5 4 4,5 5
1
3
5
7
9
11
13
15
17
19
21
23
25
27
29
31
33
35
37
39
41
43
45
47
49
51
Ability to work well with others based on BGCA evaluation
BGCA After BGCA Before

Academic and Behavioral Improvements Study: Hardy Brain Camp 2011 Page 66
0 0,5 1 1,5 2 2,5 3 3,5 4 4,5 5
1
3
5
7
9
11
13
15
17
19
21
23
25
27
29
31
33
35
37
39
41
43
45
47
49
51
Self-confidence and self-esteem based on Parent's evaluation
Parent After Parent Before

Academic and Behavioral Improvements Study: Hardy Brain Camp 2011 Page 67
0 0,5 1 1,5 2 2,5 3 3,5 4 4,5 5
1
3
5
7
9
11
13
15
17
19
21
23
25
27
29
31
33
35
37
39
41
43
45
47
49
51
53
Self-confidence and self-esteem based on Teacher's evaluation
Teacher After Teacher Before