abstract - nc state university · ii biography matthew ryan diering was born on november 2, 1985 in...
TRANSCRIPT
ABSTRACT
DIERING, MATTHEW RYAN. Ergonomic Evaluation of Scaffolding Task
Interventions for Power Plant Maintenance (Under the direction of Dr. David B. Kaber)
A nuclear power plant is a complex operation requiring a large number of
maintenance operations. Examination of a local power utility‟s injury database revealed
that maintenance personnel had the highest injury incidence rates. Maintenance jobs were
analyzed from an ergonomics perspective and scaffolding tasks, including walk-board
tie-down to frames and frame tube coupling, were found to pose high risks. Ergonomic
risks included excessive torques at joints and awkward posture positions in both tasks.
The purpose of this research was to conceptualize interventions to reduce these risks and
to conduct experiments to empirically assess the impact of the proposed interventions on
worker posture and performance.
The standard procedure for walk-board tie-down at the nuclear power plants calls
for the use of #9 gauge wire. The wire is looped around a walk-board and a scaffolding
tube, and then twisted with pliers to tighten. The ergonomic analysis showed that this task
involved extreme wrist posture positions with high rotational forces. To alleviate these
problems, the replacement of wire tie-downs with plastic zip ties was proposed.
In scaffold frame assembly, tubes are clamped together using right-angle and
swivel couplers. To tighten a standard coupler a nut and bolt mechanism is ratcheted. The
ergonomics analysis showed that this task required very high torques to be applied to the
ratchet. A coupler utilizing a “ski-boot”-type clamping mechanism was designed to
eliminate the repetitive ratcheting motion and the excessive torque requirements.
Two experiments were conducted to test the interventions using electro-
goniometers to record wrist angle measurements. The tie-down experiment recorded

wrist flexion, extension, radial deviation, ulnar deviation and the average task-to-time
completion (TTC). The coupling experiment measured wrist flexion, extension, radial
deviation, ulnar deviation, forearm pronation and the average TTC. Multivariate and
univariate Analyses of Variance were conducted on each response measure to assess the
impact of each intervention. It was expected that the zip ties and lever-based coupler
would significantly reduce wrist joint angles as well as TTC.
By replacing the wire ties with more flexible plastic zip ties, angular response
measures and TTC were positively affected. Maximum flexion angle was reduced by
37%, maximum extension angle was decreased by 4.0% and maximum ulnar deviation
angle was decreased by 17.0%. While there was no reduction in radial deviation solely
due to the plastic zip ties, a decrease was seen during certain subtasks (tie-
down/tightening). TTC was reduced by 1.6 seconds when using the plastic zip ties. It was
recommended that plastic zip ties replace the #9 gauge wire for the walk-board tie-down
task.
Results of the coupling experiment revealed coupler type to interact with the
subtask being performed (i.e., coupler placement/removal or tightening/loosening) to
effect the angular response measures. Due to the elimination of the ratcheting task, a
9.0% decrease in maximum flexion was achieved while there was no effect on maximum
extension angle. A 19.5% decrease in maximum radial deviation angle and a 6.6%
decrease in maximum ulnar deviation angle were found when tightening the lever
couplers. There was no significant reduction in forearm pronation. While there was
reduction in the angular response measures, the lever coupler was found to slightly
increase the TTC for frame tube coupling (approximately 12%) as compared to the

ratcheting couplers. Based on the improvement in the angular response measures, the
lever couplers were recommended for further examination as a viable alternative to the
standard scaffolding couplers. An avenue of future research would be a comparison of the
force requirements for the existing couplers versus the lever couplers.

Ergonomic Evaluation of Scaffolding Task
Interventions for Power Plant Maintenance
by
Matthew Ryan Diering
A thesis submitted to the Graduate Faculty of
North Carolina State University
in partial fulfillment of the
requirement for the Degree of
Master of Science
Industrial Engineering
Raleigh, North Carolina
December 2009
APPROVED BY:
________________________
Simon Hsiang, PhD
________________________
Jeff Thompson, PhD
________________________
Yuan-Shin Lee, PhD
________________________
David B. Kaber, PhD
(Chairperson of Advisory Committee)

ii
Biography
Matthew Ryan Diering was born on November 2, 1985 in Raleigh, North
Carolina. The son and brother of NC State graduates, Matt was destined to attend NC
State. In May 2008 he graduated from the Edward P. Fitts Department of Industrial and
Systems Engineering with a B.S. The following August he enrolled in graduate school at
the same department where he was awarded the National Institute for Occupational
Safety and Health (NIOSH) Occupational Safety & Ergonomics Graduate Education and
Research Program Fellowship. In May 2010 he will be graduating with a M.S in
industrial engineering.

iii
Acknowledgements
I would like to thank all of those who have helped during the course of this
study: Theo for helping with the design work, Prithima for always knowing what to do,
and Shruti for helping me every step along the way. I would also like to thank the
National Institute for Occupational Safety and Health (NIOSH) for supporting my
Master‟s study over the past year and a half through Grant No. 2 T42 OH008673-04. This
research would not have been possible without NIOSH's funding of the NC State
Ergonomics Lab.

iv
Table of Contents
List of Figures ............................................................................................... vi
List of Tables .............................................................................................. viii
List of Expert Acronyms ............................................................................. ix
1 Introduction ............................................................................................ 1
1.1 Motivation for Study ....................................................................................................... 1
1.2 Preliminary Job Analysis ................................................................................................. 3
1.3 Existing Equipment for Scaffolding Operations ............................................................. 6
1.3.1 Walk-board Tie-Down Task .................................................................................... 6
1.3.2 Scaffolding Couplers ............................................................................................... 8
1.4 Literature Review ............................................................................................................ 9
1.4.1 Low Back Pain ........................................................................................................ 9
1.4.2 Ergonomic Assessments ........................................................................................ 11
1.4.3 End Frame Handling .............................................................................................. 14
1.4.4 Summary................................................................................................................ 16
1.5 Objectives ...................................................................................................................... 17
2 Methods ................................................................................................. 18
2.1 Participants ......................................................................................................... 18
2.2 Tasks................................................................................................................... 19
2.2.1 Walk-Board Tie-Down ............................................................................... 19
2.2.2 Scaffold Couplers........................................................................................ 23
2.3 Testing Apparatus .............................................................................................. 26
2.3.1 Experiment 1 Overview .............................................................................. 26
2.3.2 Experiment 2 Overview .............................................................................. 29
2.3.3 Experimental Equipment ............................................................................ 32
2.4 Experimental Design .......................................................................................... 35
2.4.1 Independent Variables ................................................................................ 35
2.4.2 Dependent Variables ................................................................................... 36
2.5 Experimental Procedure ..................................................................................... 36

v
2.5.1 Facility and Training ................................................................................... 36
2.5.2 Experiment 1 Testing .................................................................................. 38
2.5.2 Frame 2 ....................................................................................................... 41
2.5.3 Debriefing ................................................................................................... 44
2.6 Hypotheses ......................................................................................................... 44
2.7 Data Handling .................................................................................................... 45
2.8 Statistical Analysis ............................................................................................. 46
2.8.1 Testing Assumptions of Analysis of Variance............................................ 46
2.8.2 Data Analysis .............................................................................................. 47
3 Results .................................................................................................... 56
3.1 Experiment 1 ...................................................................................................... 56
3.2 Experiment 2 ...................................................................................................... 69
4 Discussion .............................................................................................. 81
4.1 Experiment 1 ...................................................................................................... 81
4.2 Experiment 2 ...................................................................................................... 87
4.3 Discussion of Individual Differences ................................................................. 93
5 Conclusion ............................................................................................. 94
5.1 Overall Recommendations ................................................................................. 94
5.2 Limitations ......................................................................................................... 96
5.3 Future Research .................................................................................................. 98
References .................................................................................................. 100
Appendix A: Informed Consent Form .................................................... 102
Appendix B: Demographic Questionnaire ............................................. 104
Appendix C: Graphs for the ANOVA Assumptions ............................. 106
Appendix D: Outliers ................................................................................ 119

vi
List of Figures
Figure 1.1: Common Metal Walk-board ............................................................................. 7
Figure 1.2: Common Wood Walk-boards ........................................................................... 7
Figure 1.3: Scaffolder Performing the Tie-down Task ....................................................... 8
Figure 1.4: Scaffolders Performing the Coupling Task ...................................................... 9
Figure 2.5: Completed tie-down on wood walk-board. .................................................... 20
Figure 2.6: Close-up of tie-down. ..................................................................................... 21
Figure 2.7: Hook-on mechanism used for metal walk-boards. ......................................... 22
Figure 2.8: Completed tie-down on metal walk-board. .................................................... 22
Figure 2.9: Close-up of scaffolding coupler. .................................................................... 24
Figure 2.10: Scaffolding coupler in use. ........................................................................... 24
Figure 2.11: Swivel couplers. ........................................................................................... 26
Figure 2.12: Swivel couplers in use. ................................................................................. 26
Figure 2.13: Initial design drawings for lever coupler. ..................................................... 30
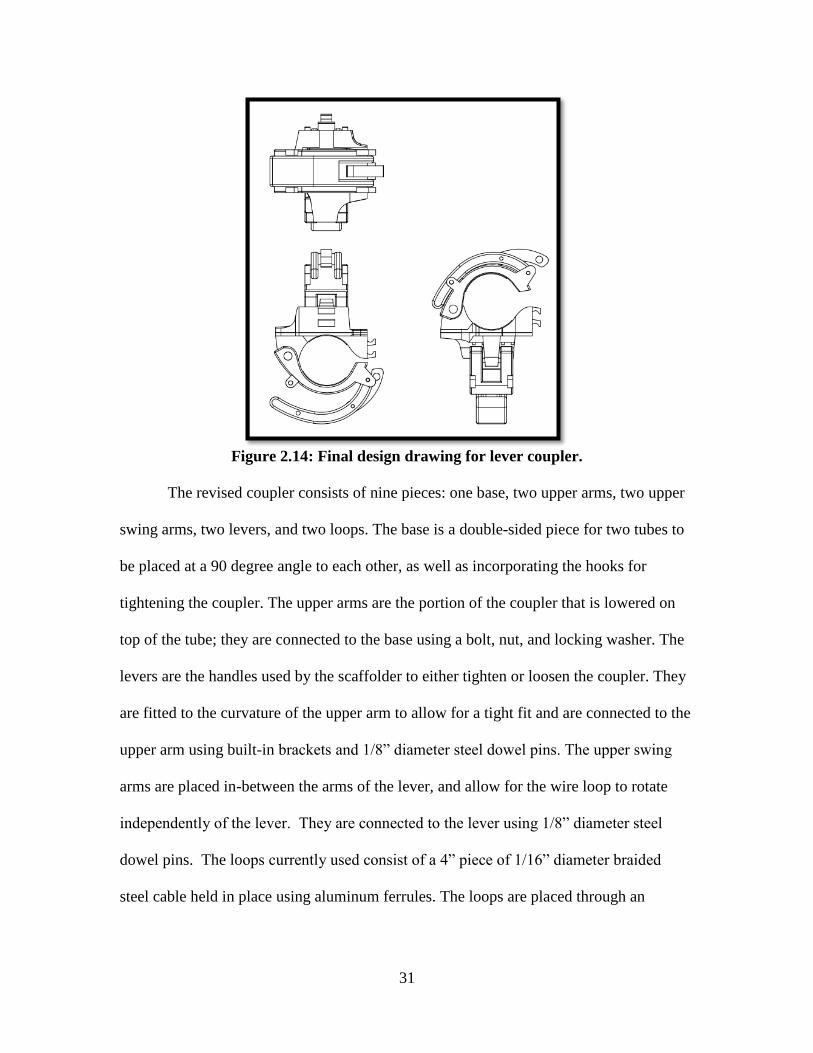
Figure 2.14: Final design drawing for lever coupler......................................................... 31
Figure 2.15: Electro-goniometer mounting on the hand and forearm for measuring wrist
extension-flexion and radial-ulnar deviation. ................................................................... 33
Figure 2.16: Torsiometer mounting on the hand and forearm measuring pronation. ....... 34
Figure 2.17: Experimental frame setup. ............................................................................ 37
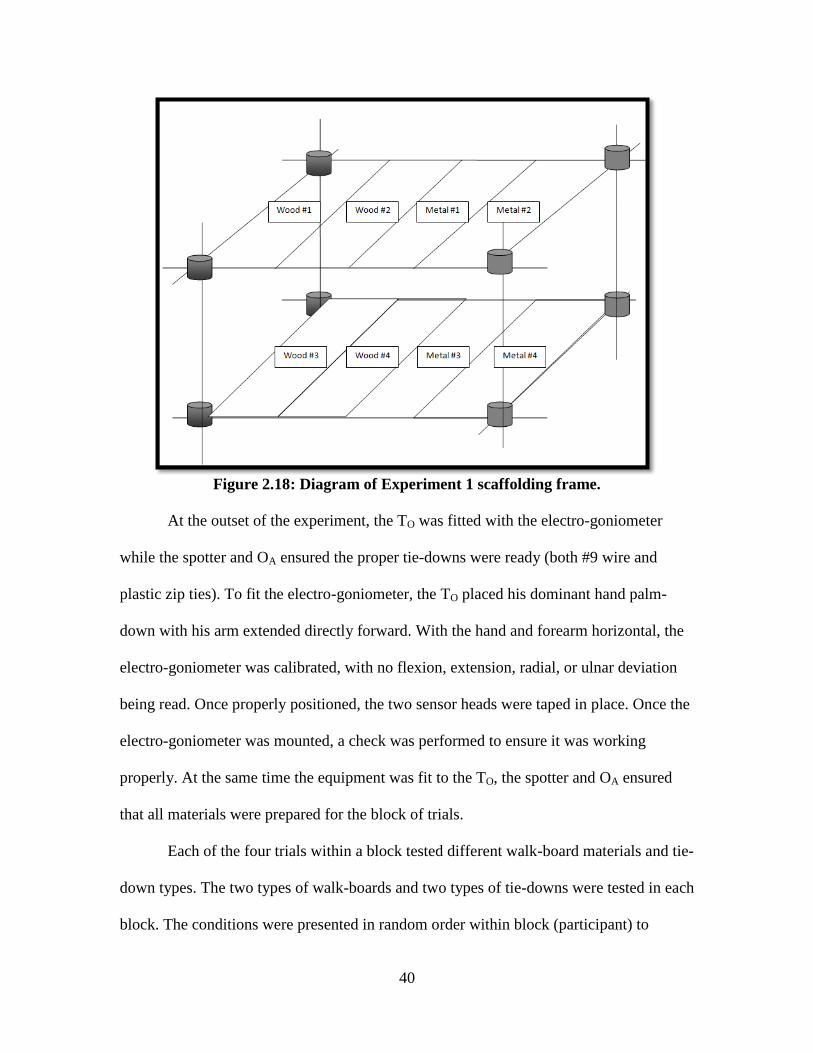
Figure 2.18: Diagram of Experiment 1 scaffolding frame. ............................................... 40
Figure 2.19: Diagram of Experiment 1 scaffolding frame. ............................................... 43
Figure 3.20: Flexion angle tie*subtask interaction plot. ................................................... 61
Figure 3.21: Extension angle tie*subtask interaction plot. ............................................... 61
vii
Figure 3.22: Radial deviation angle tie*subtask interaction plot. ..................................... 62
Figure 3.23: TTC tie*walk-board interaction plot. ........................................................... 64
Figure 3.24: TTC walk-board*level interaction plot. ....................................................... 65
Figure 3.25: TTC tie*subtask interaction plot. ................................................................. 66
Figure 3.26: Flexion angle coupler*subtask interaction plot. ........................................... 74
Figure 3.27: Radial deviation angle coupler*subtask interaction plot. ............................. 74
Figure 3.28: Ulnar deviation angle coupler*subtask interaction plot. .............................. 75
Figure 3.29: Flexion angle activity*subtask interaction plot. ........................................... 76
Figure 3.30: Extension angle activity*subtask interaction plot. ....................................... 76

viii
List of Tables
Table 2.1: Participant anthropometry. .............................................................................. 18
Table 2.2: Description of Experiment 1 task procedure and estimated test times. ........... 39
Table 2.3: Description of Experiment 2 task procedure and estimated step times. .......... 42
Table 3.1: Experiment 1 MANOVA results. .................................................................... 58
Table 3.2: TTC results for interaction of tie*walk-board*level. ...................................... 67
Table 3.3: TTC results for interaction of tie*walk-board*level. ...................................... 68
Table 3.4: Experiment 1 correlation table. ........................................................................ 68
Table 3.5: MANOVA results for Experiment 2................................................................ 70
Table 3.6: TTC results for interaction of coupler*activity*subtask. ................................ 79
Table 3.7: Experiment 2 correlation table. ........................................................................ 80

ix
List of Expert Acronyms
NPP: Nuclear power plant
ECNC: Ergonomics Center of North Carolina
SIMS: Safety Information Management System
OSHA: Occupational Safety and Health Administration
LI: Lifting index
UL: Underwriters Laboratories
FM: Factory Mutual Engineering Corporation
E1: Experiment 1
E2: Experiment 2
SLA: Stereolithography
RCB: Randomized complete bock
TTC: Time-to-task completion
TO: Test operator
OA: Operator‟s assistant
S: Spotter
ANOVA: Analysis of variance
MANOVA: Multivariate analysis of variance
HSD: Honestly Significant Difference
EMG: Electromyography

1
1 Introduction
1.1 Motivation for Study
Nuclear power plants (NPP) are extremely complex systems requiring massive
operations and maintenance staff to ensure that the plant is running at peak efficiency.
From the servicing of the reactors to pipe repair to fuel rod exchange, maintenance is a
primary concern that requires each plant to shut down for two to three months per year to
allow for a complete sweep. The North Carolina State University Ergonomics Lab, part
of the Edward P. Fitts Department of Industrial and Systems Engineering, and the
Ergonomics Center of North Carolina (ECNC) recently contracted with a local power
utility company to implement an ergonomics program in the utility‟s nuclear power
division designed to reduce work related musculoskeletal injuries. This partnership
provided the framework that supported the present thesis.
On the basis of prior worker injury cases, environmental safety and health
personnel at the company speculated that maintenance employees were at a higher risk
for ergonomic related injuries. In order to quantify this risk, the local power utility
company provided the Ergonomics Lab and ECNC with access to their Safety
Information Management System (SIMS) databases for all nuclear power plants (NPP) in
the company‟s fleet. The SIMS data covered all occupations at the NPPs and allowed for
identification of injuries with significant ergonomic root causes as well as identification
of specific job areas that accounted for the highest rates of lost time. The database
included Occupational Safety and Health Administration (OSHA) logs covering the
period from January 2002 through July 2007. During this time, 162 recordable incidents
occurred. After a study of the descriptions of causes of these recordable incidents, it was

2
found that 58 out of 162 (35.8%) of injuries had ergonomically related root causes. This
motivated ergonomic evaluation of NPP manual work tasks to potentially reduce the
number of recordable incidents.
Once incidents with ergonomic root causes were identified, the proportion
involving personnel in maintenance operations was determined. Strain and sprain
injuries accounted for 54 of 162 (33.3%) of the total injuries; of the strain and sprain
injuries, 13 of 54 (24%) were sustained by maintenance workers. Additionally, 50% of
tendinitis cases were found among maintenance personnel. Finally, half of all reported
back strains occurred among maintenance workers. Injury incidence rates were higher for
maintenance workers than for any other type of personnel at the NPPs. Even though
maintenance jobs accounted for a significant proportion of ergonomic related injuries,
they did not account for a significant proportion of lost days. The reason for this is that
other work groups in the NPPs, primarily security, produce incidents with comparatively
large number of lost days. Maintenance worker incidents only accounted for 11.7% of all
lost days. Therefore, the database analysis revealed that while more injuries happened to
maintenance personnel, they tended to be less severe.
Due to the large percentage of recordable incidents that could be attributed to
maintenance personnel, the focus of the Lab research and this thesis was to develop
ergonomic interventions for maintenance operations with the intent to reduce ergonomic
related injuries. More specifically, non-repetitive maintenance tasks involving scaffolding
assembly were selected for analysis. These tasks are one-off and are customized to the
situation (more information is provided below).

3
1.2 Preliminary Job Analysis
Based on the number of ergonomic related injuries occurring in maintenance
operations, further analysis was conducted to narrow the focus of the study. This job
hazard analysis was constrained to ergonomic hazards and did not include slip and fall
injuries, for example. There were two major steps in the analysis, including:
(1) Screening of maintenance jobs for ergonomic risk factors using a review tool
developed by the ECNC - The job review tool was partially based the RULA (Rapid
Upper Limb Assessment) method and the NIOSH lifting equation. RULA was used to
determine the acceptability of arm postures and forces. An observational survey method,
RULA assesses upper limb risk from work-related activities (McAtamneya & Corlett,
1993). The NIOSH lifting equation was used to determine acceptable lifting limits.
Weight, lifting postures, and repetition are used to analyze specific lifting situations
(Waters, Putz-Anderson, & Garg, 1994). The review tool was developed to subjectively
establish ergonomic risk based on an ergonomist‟s inspection of jobs. A wide array of
maintenance jobs was evaluated using the review tool, including chemical technicians,
maintenance mechanics, scaffolding crews, shipping staff, turbine maintenance
personnel, and water treatment facility maintenance staff. Each job was divided into
component tasks that comprised the job. These tasks were assigned subjective ratings (1-
10) for three potential hazards: extreme posture, force and repetitive motion. The ratings
were assigned across 10 different areas of the body. By combining the ratings across
hazard types, a risk priority (low, moderate, high) was assigned to each of the 10 body
areas. These priorities were then weighted and summed to create an overall job risk score.

4
The job scores were then compared in order to determine the specific aspects most likely
to cause ergonomic related injuries.
This initial job screening revealed scaffolding, shipping and receiving, and cable
pulling to be maintenance jobs falling in the “high” ergonomic risk category. These tasks
shared a common set of characteristics including generation of very large body forces,
maintenance of extreme posture positions during tasks, and use of tools requiring high
application forces or excessive repetition.
(2) Performing a “deep dive” analysis on high risk jobs - A “deep dive” analysis
involves a detailed risk assessment using existing validated ergonomics job analysis tools
including the NIOSH lifting equation, the Strain Index, and the Liberty Mutual
psychophysical lifting limits to quantify the extent to which jobs exceed established
criteria and to provide a basis for intervention recommendations. The Strain Index is used
to assess a task‟s risk to the hands, wrists, and elbow. Duration of the task, postures, and
intensity of exertion are all used to determine risk (Moore & Garg, 1995). The Liberty
Mutual psychophysical lifting limits are used to determine the relationship between
psychological limits and actual lifting capacity. By combining perception and
biomechanics, safe lifting limits can be implemented (Snook, 1978).
All of the identified ergonomic analysis tools have been computerized and are
packaged as a part of the Ergonomic Decision-making Guide for Assessing Risk®
software application, developed by the ECNC. In using this tool, first the entire job is
divided into elements, including carries, lifts, postures, and hand-intensive tasks. These
task elements are then processed using the appropriate computational aid (e.g., RULA for
hand-intensive task assessment). Each element is then assigned a ranking of „Passed‟,

5
„Cautioned‟, or „Failed‟. „Passed‟ elements pose no ergonomic risk to the worker,
„Cautioned‟ elements are considered to represent an “acceptable” risk, while „Failed‟
elements should be ceased immediately.
Upon reviewing the results of the deep dive analysis, it was determined that
scaffolding operations included the most tasks posing an ergonomic risk. Sixteen
elements were found for scaffolding operations. One received „Passed‟ ranking, ten
received „Cautioned‟ rankings, and five received „Failed‟ rankings. Two of the „Failed‟
elements involved the loosening of scaffold joints. This task required an estimated 300
in-lbs torque at the wrist, far exceeding the recommended hand torque limit of 180.75 in-
pounds (Mital & Channaveeraiah, 1988). Lifting and lowering of scaffolding equipment
accounted for next „Failed‟ element. Scaffolders used one handed lifts and lowers to
transport 35 lb scaffold walk-boards, greatly exceeding the University of Michigan
3DSSPP recommended lift of 7.10 lbs. Similarly, the transport of scaffold equipment (up
to 40 lbs) to and from the worksite violated Snook‟s (1978) recommendation of 37.4 lbs
for a general work population with a two handed lift. Among the „Cautioned‟ elements
was the tying down of the scaffold walk-boards with #9 gauge wire that according to
Moore and Garg (1995)involved “Very Bad” hand and wrist postures as well as a
“Somewhat Hard” perceived intensity of exertion.
From these results, there was quantitative evidence that scaffolding was an area of
maintenance activity which placed the worker at a heightened risk. Thus, scaffolding was
selected as the specific focus for the present research. Of the high risk scaffolding
elements posing a heightened risk to the worker, two were selected for this study. The
first was the tying down of scaffold walk-boards using #9 gauge wire. The second was
6
the tightening and loosening of the scaffold couplers to construct scaffolding frames.
Both of these tasks require high forces and potentially hazardous hand postures. The tasks
were also selected because there are limited alternate methods for performance and the
fact that they could be easily replicated in an experimental setting for detailed analysis.
1.3 Existing Equipment for Scaffolding Operations
Scaffolding is a job that requires use of specialized equipment not used elsewhere
in the NPP. The scaffolds most commonly used are of the tube and coupler type. A series
of two inch diameter pipes are connected using steel couplers which join two adjacent
pipes. The pipes and couplers create a framework upon which the maintenance staff can
perform their tasks. While various other scaffolding systems are used throughout the
NPP, tube and coupler scaffold is predominately used due to its flexibility. For this
reason, tube and coupler scaffolding is also used in all NPPs as part of the utility‟s fleet
making it a good candidate for study. While the elements used in the construction of
scaffolds, tubes and couplers, may be manufactured by different companies, the different
brands function in an identical manner, allowing utilities freedom in the selection of
equipment for maintenance operations.
1.3.1 Walk-board Tie-Down Task
At each working level of the scaffold, walk-boards are placed as a work surface.
There are two primary materials from which walk-boards are constructed including metal
and wood. Metal walk-boards (Figure 1.1) are lighter, have slip resistant surfaces, and
last longer. However, they only come in predetermined lengths. Wood walk-boards
(Figure 1.2) are able to be cut to size, but are heavier and deteriorate quicker. When
paired with wooden walk-boards, tube and coupler scaffolds can be erected around any

7
obstacle or at any location in the NPP. Due to its flexibility, wooden walk-boards are
most commonly used. Metal walk-boards are commonly used with tube and coupler
assembly in large open areas where frames must be erected quickly. Both metal and
wood walk-boards were analyzed in this study.
Figure 1.1: Common Metal Walk-board
Figure 1.2: Common Wood Walk-boards
The securing of the walk-boards to the scaffolding frames was identified as a
hazardous task by the deep dive analysis. In general, tie-down wire is used to prevent
lateral end-to-end movement and vertical travel of walk-boards once they are placed on
an assembled frame. The NPPs of the utility company currently use #9 gauge wire

8
(0.1144” diameter) for this task. In the tie-down task, the scaffolder first positions a walk-
board on a frame, then a precut length of #9 gauge wire (18-36”) is looped around both
the walk-board and a horizontal tube. The #9 gauge wire is then tightened using a pair of
pliers, grasping both ends with the pliers and twisting them together until the wire loop is
secure. To ensure the safety of the maintenance workers, the ends of the wire are cut to a
suitable length by scaffolders and then twisted out of the way to prevent poking injuries.
Due to the thickness of the #9 gauge wire, high forces are required in manipulation and
twisting. This issue coupled with the repeated wrist motion required to tighten the wire
around the walk-boards, poses a significant ergonomic hazard for scaffolders.
Figure 1.3: Scaffolder Performing the Tie-down Task
1.3.2 Scaffolding Couplers
While constructing a scaffold, scaffold couplers are used to secure scaffold tubes
in place. There are two primary types of load bearing couplers used at the NPP: right
angle and swivel. Right angle couplers are used to connect horizontal tubes with vertical
tubes at 90 degree angles. Swivel couplers are able to secure tubes at any other angle.

9
Typically, swivel couplers are used to secure diagonal braces. Both types of couplers
utilize an integrated bolt and nut to secure the coupler‟s arm over the tube, using friction
to keep the tube secure. Once the tube has been placed on the base of the couplers, the
coupler‟s arm is fitted over the tube. The bolt is then inserted into the arm and the bolt is
tightened down onto the arm. A ratchet is used to tighten the bolt, requiring the scaffolder
to perform repetitive motions under high forces and awkward postures for tightening.
Figure 1.4: Scaffolders Performing the Coupling Task
1.4 Literature Review
Once scaffolding was identified as the focus of this research, a literature review
was conducted to identify any prior work in the area developing ergonomic interventions
for tie-down and coupling tasks. After reviewing a number of articles, it was found that
there existed three primary groups of literature pertaining to scaffolding including low
back pain, ergonomic assessment methods of scaffolding, and end frame handling.
1.4.1 Low Back Pain
Back pain is a common complaint among scaffolders. A study was conducted by
Elders and Burdorf (2001)to determine how physical, psychosocial, and individual risk
factors relate to low back pain in scaffolders. Both a survey and postural loading was
10
conducted. The survey was used to gather data on the presence of low back pain as well
as physical, psychosocial, and individual risk factors, while the review of postural loads
was intended to examine actual working conditions. From an examination of postural
loads, a number of interesting results were found: scaffolders held awkward back posture
positions 8% of the time, held their arms raised above their heads 27% of the time, and
lifted more than 10 pounds 22.2% of the time. More than half of the scaffolders surveyed
reported that they had experienced low back pain in the past year (58%). Furthermore,
23% reported chronic low back pain while 30% reported serious low back pain.
Statistical analysis was performed on the results of the survey to determine correlations
among responses and to identify any relationship with the incidence of low back pain.
High correlations were found between reporting of manual handling, awkward back
posture, strenuous arm positions, and perceived exertion. Associations between these
factors and low back pain were also present. High manual material handling, strenuous
arm positions, awkward back postures, high perceived exertion, high job demand, low job
control, and moderate perceived general health were all significantly correlated with low
back pain. Reporting of the activity of scaffolding was not found to be significantly
associated with low back pain. Finally, there was a significant relationship between
perceived exertion and chronic low back pain. The purpose of this paper was not to
identify intervention strategies, but to highlight the risk factors related with low back
pain.
In a continuation of the previous study, Elders and Burdorf (2004)performed a
four year longitudinal study on the same scaffolder population while assessing the
prevalence, incidence, and recurrence of lower back pain. A yearly questionnaire

11
gathered information on the presence of low back pain as well as additional information
on physical, psychosocial, individual risk factors, and measures of health.
At the baseline survey, 60% of scaffolders had low back pain, while in the three
follow-up surveys it varied between 44% and 46%. In the follow-up surveys, the
incidence of new lower back pain was between 20% and 28%, while recurrence was
between 64% and 77%. Of the 127 scaffolders that responded to all four surveys, 74%
had at least one incidence of low back pain, while only 26% were unaffected. A
univariate analysis was performed on risk factors and their relation to low back pain. For
the incidence of low back pain, moderate health was the only significant predictor, while
strenuous arm movements, awkward back posture, high job demand and low job control
led to elevated but statistically insignificant relationships. For recurrence of low back
pain, manual material handling, awkward back posture, high job demand, low job control
and moderate general health had significant association, while strenuous arm movement
and high BMI had no significant associations. From this research, Elders and Burdorf
(2004) concluded that it is very difficult to establish the independence of an incidence of
low back pain from previous episodes.
1.4.2 Ergonomic Assessments
Scaffolding can be broken down into four major categories: construction of
scaffold (50% of time), dismantlement of scaffold (20%), transport of scaffold parts
(20%), and material preparation time (10%). Van der Beek, Mathiassen, Windhorst and
Burdorf (2005) conducted a study comparing the revised NIOSH lifting equation,
Arbouw method, practitioners‟ method of the NIOSH lifting equation, and systematic
observations for assessing the physical impact of manual material handling tasks during

12
scaffolding. The first three methods used a self-administered checklist combined with
observations of lifting frequencies and other input for each lifting situation. The final
method used a set of systematic observations of scaffolders in the field. The NIOSH
lifting equation (Waters, Putz-Anderson, & Garg, 1994) is used to define recommended
weight limits for a task. The Arbouw method was developed for the Dutch construction
industry and is a simplified version of the NIOSH lifting equation. The practitioners‟
method of the NIOSH equation was designed for this study, and examines only the
„worst‟ lifting scenario among the set of observations. All three of these methods
calculate a lifting index (LI) which is used to determine the acceptability of a lift.
Systematic observation requires a very large amount of data which is then used to
calculate an action category and to determine whether the lift is acceptable or not. The
entire scaffolding process was found to have a LI of 3.85, 3.29 and 3.98 for the first three
methods, accordingly. In general, it was found that scaffolding procedures put workers at
a substantially increased risk for injury. The subtask with the highest LI was the transport
of material followed by construction and dismantlement. For the systematic observations,
construction was found to present the highest risk to scaffolders, followed by
dismantlement and transportation. While all four method of analysis revealed that
scaffolders have an elevated risk for injuries, there were only slight differences in which
activity posed the highest risk. This was partially due to the fact that a number of
observations had to be eliminated for each method, due to altered lifting situations. Van
der Beek et al. (2005) found that the NIOSH lifting equation was a good predictor of risk
in scaffold operations, but very time consuming. However, the method is limiting in that
it requires a very rigid set of components to be present in the examined activity. The

13
Arbouw and practitioners‟ methods were quicker, but still considered too difficult to
apply in the field. Finally, Van der Beek et al. (2005) offered that systematic observations
are useful for design, but they are very time consuming and expensive to conduct.
Another study that examined the application of ergonomic assessments in
scaffolding was conducted by Vink, Urlings and van der Molen (1997). Because
scaffolders are exposed to extreme postures and high forces, they were recruited for a
participatory ergonomic study towards improving work methods and reducing injuries.
The participatory ergonomics approach was used to allow the scaffolders to have some
influence on the redesign of tasks. The six steps of the participatory ergonomic approach
are: (1) preparation, (2) analysis of workers, (3) selection of improvements, (4) pilot
study of improvements, (5) implementation, and (6) evaluation. During Step 2, a number
of task issues were revealed by the scaffolders to be problematic from an ergonomics
perspective. Among the issues were high forces and repetition in transport of materials,
assembly and disassembly tasks, and cleaning after disassembly. The shoulder, wrist,
elbow, and upper back were all found to be body parts with a higher frequency of
scaffolder complaints than normal laborers. Based on these results, an ergonomics
steering committee decided to focus on reducing the physical load during cleaning and
during manual material transport. In Step 4, it was decided that heart rate would be
monitored to identify any reduction in heavy work load based on the redesign. The
researchers found a significant decrease in heart rate as well as a decrease in the
percentage of time the workers moved more than 20kg. Scaffolders also indicated a
decrease in shoulder, leg and total body discomfort; albeit with a slight rise in back
discomfort. These improvements were then implemented in the work place and a survey

14
was completed after 6 months. The scaffolders were asked which improvements were
still used and if they were beneficial. The improvements suggested by management were
found to be less frequently used than the ones suggested by the scaffolders. In general,
the participatory ergonomics approach can be used as an effective alternate method of
improving scaffold task design through using the involvement of employees to ensure the
validity of recommendations. One of the major shortcomings of the approach is the
potential for a hazard to not be identified by workers, leading to it being ignored.
1.4.3 End Frame Handling
Due to the construction industry having the highest injury rate of any major
United States industry, many ergonomics and safety studies have been conducted.
Scaffolding in construction poses risks with overexertion being one of the key problems.
Hsaio and Stanevich (1996) undertook a study to identify activities which increase a
worker‟s risk of exposure to overexertion hazards and to determining strategies to reduce
occurrence of overexertion. Visits were made to construction sites to observe and record
scaffolding task performance. It was found that many sites used a welded-tubular end-
frame, a hollow metal structure with two legs that can be inserted into the top of a lower
end frame to construct scaffold tiers. During the erection and dismantling of scaffolds,
workers were videotaped and the frequency of task components counted. Some common
task components included: (1) preparing foundations, (2) carrying scaffold parts, (3)
erecting/removing end frames, (4) erecting/removing cross braces, (5)
installing/removing access ladders, (6) installing/removing walk-boards, (7)
installing/removing guardrails, and (8) securing/removing scaffold tiebacks. From this
list of components, biomechanical stresses were calculated using 3DSSPP. The

15
biomechanical analysis identified lifting scaffold end frames, carrying end frames,
handling scaffold walk-boards, removing cross braces, and removing guardrails as
activities that increase risk of overexertion injuries.
Some common features of this include: handling bulky materials, awkward
working postures, restricted work spaces, or elevated work surfaces. In transporting
scaffold end frames, video analysis revealed that there are six lifting and five carrying
methods commonly used. All of these methods were found to create stresses which
exceeded the strength capacity of some portion of the general work population.
Symmetric front lifts at either elbow or knuckle height were identified as the postures
allowing for the greatest isometric strength. In summary, Hsaio and Stanevich (1996)
found the majority of scaffolding tasks to cause significant biomechanical stress and
increase the risk of an overexertion injury.
In a continuation of the previous study, Cutlip, Hsiao, Garcia, Becker, and
Mayeux (2000) further examined the stresses caused by the transport of welded-tubular
scaffold end frames. In this study, a cohort of 46 experienced scaffolders was selected.
Two experiments, using force platforms, were designed to determine if scaffolders
possessed increased muscle strength over the general population and to determine if
various postures were beneficial to muscular strength when disassembling scaffolds.
Seven postures were examined in the experiments. Scaffolders performed a series of
exertions in the various posture positions. These exertions were then measured and
compared to a general industrial worker population. The study found that the scaffolders
examined in the study had a higher muscular strength capacity than the general
population of industrial workers studied by Chaffin, Herrin and Keyserling (1978). Of the

16
seven postures examined, four were found to be conducive to generating the necessary
force to carry end frames. In summary, Cutlip et al. (2000) found that while some
postures allows for a relatively safe transport of end frames by scaffolders, there are
portions of the population which would be still be at significant risk using similar work
methods.
1.4.4 Summary
While the literature review confirmed many of the findings from the “deep dive”
analysis of the scaffolding tasks at the power utility, no literature was found documenting
studies on the specific problems in coupling and walk-board tie-down discussed above.
Papers concerning carrying welded end frames indicated similar areas of ergonomic
concern as the “deep dive” analysis: handling of material, handling scaffolding walk-
boards, and the removal of scaffolding tubes; however, end frames are not used at the
NPPs under study. Similarly, the literature confirmed that awkward postures and high
forces placed the scaffolders at elevated risk of low back pain. While low back pain is not
the focus of this study, the studies reviewed here indicated the same risk factors as found
in the “deep dive” analysis of the work tasks at the NPPs. The literature concerning
different ergonomic assessments, while not directly related to this study, highlights the
usefulness of engineering controls in reducing hazard exposures in scaffolding tasks. In
general, the scaffolding literature reinforces our preliminary job analysis and indicates
that there is room for further research on ergonomic interventions to scaffold frame
coupling and walk-board handling.

17
1.5 Objectives
The objectives of this study are twofold. First, to conceptualize interventions to
reduce scaffolding injuries pertaining to the tying down of scaffolding walk-boards with
#9 gauge wire and the tightening and loosening of scaffold couplers. Second, to conduct
experiments in which the impact of the proposed interventions is empirically evaluated.
18
2 Methods
2.1 Participants
The participants recruited for the experiments in this study were nine males
ranging in age from 33 to 60. All participants were NPP scaffolding staff. The primary
qualifications for participation were expertise in scaffold assembly and familiarity with
current NPP scaffolding practices. Each participant was presented with a consent form
prior to participation in the experiments (see Appendix A).
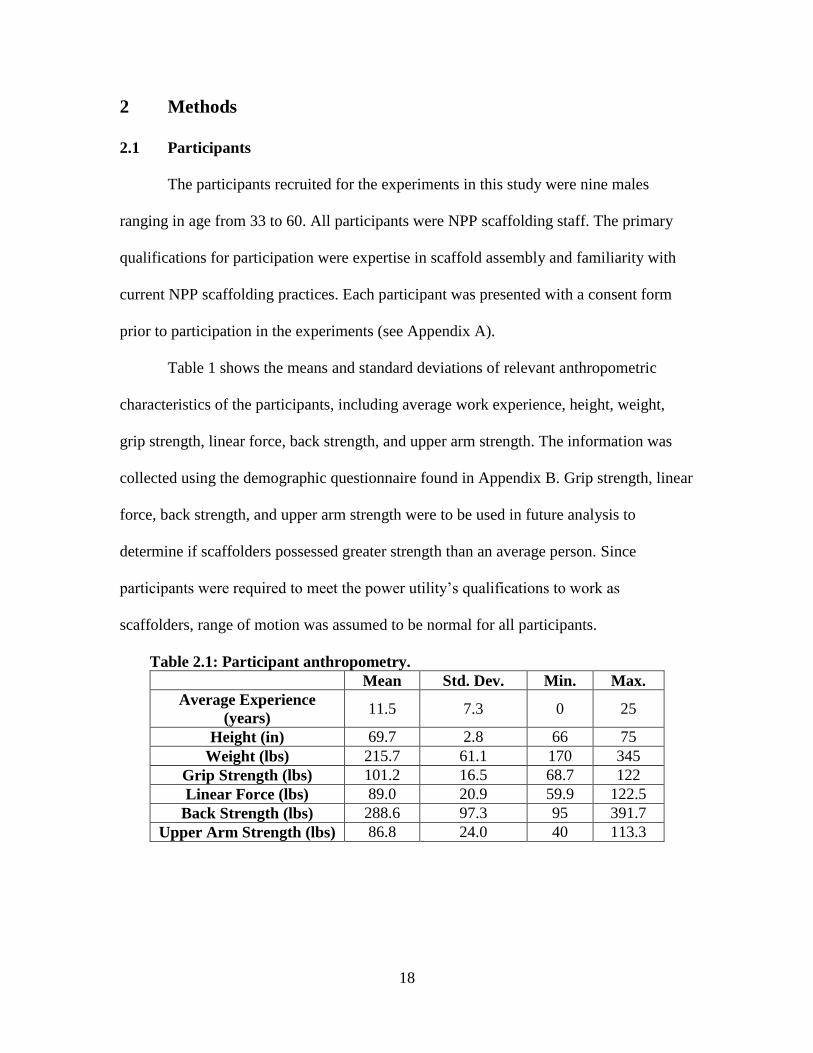
Table 1 shows the means and standard deviations of relevant anthropometric
characteristics of the participants, including average work experience, height, weight,
grip strength, linear force, back strength, and upper arm strength. The information was
collected using the demographic questionnaire found in Appendix B. Grip strength, linear
force, back strength, and upper arm strength were to be used in future analysis to
determine if scaffolders possessed greater strength than an average person. Since
participants were required to meet the power utility‟s qualifications to work as
scaffolders, range of motion was assumed to be normal for all participants.
Table 2.1: Participant anthropometry.
Mean Std. Dev. Min. Max.
Average Experience
(years) 11.5 7.3 0 25
Height (in) 69.7 2.8 66 75
Weight (lbs) 215.7 61.1 170 345
Grip Strength (lbs) 101.2 16.5 68.7 122
Linear Force (lbs) 89.0 20.9 59.9 122.5
Back Strength (lbs) 288.6 97.3 95 391.7
Upper Arm Strength (lbs) 86.8 24.0 40 113.3

19
2.2 Tasks
Two separate tasks were examined in this study, including walk-board tie-down
and scaffold frame tube coupling.
2.2.1 Walk-Board Tie-Down
This involved securing wood or metal walk-boards to the scaffolding frame.
Walk-boards provide maintenance personnel with a standing surface as well as a surface
to store equipment. Additionally, walk-boards provide lateral stiffness to the scaffolding
frame, preventing failure. Currently, #9 gauge wire is used to prevent walk-boards from
moving on a frame (Duke Energy, 2006). Vertical and lateral travel would place
maintenance personnel at risk as well as compromise the structural integrity of the entire
scaffold.
There are two primary types of walk-boards utilized in the NPPs of the power
utility, including wood and metal. Each type is sized differently and secured differently to
the scaffolding frame. Wood walk-boards are 10 in. wide, 2 in. thick, and can vary in
length from 8 to 16 feet. The power utility‟s standard operating procedure stated that
wood walk-boards must be “Southern pine, dense industrial 65 scaffold plank” (Duke
Energy, 2006). Once a scaffolding frame has been constructed and the proper wood walk-
board length has been selected, the walk-board is transported to the worksite and simply
laid on top of the desired horizontal scaffolding tubes. Walk-boards are placed with
overhangs of at least 6” to add stability. Once in place, a walk-board is tied down on both
ends using length of #9 gauge wire. The wire must be of an adequate length to wrap
entirely around the walk-board and the scaffolding tube while still maintaining enough
excess to be tightened. Typically, the length of a tie-down is approximately 36”. The #9

20
wire is transported to the worksite in bundles and then cut to size. Once the #9 wire tie-
down has been looped around a board, it is hand twisted two to three times to ensure
proper seating. A pair of lineman‟s pliers is used to grasp the junction of the wires, which
are then rotated in a clockwise fashion to tighten. The #9 wire tie-down is tightened to the
maximum hand strength of the scaffolder. Once tight, any excess #9 wire is cut off using
the lineman‟s pliers. The exposed tips are then curled out-of-the-way using the pliers in
order to eliminate any puncture hazard. Secured wood walk-boards are placed a
maximum of 2‟6” apart, spanning the entire width of the working surface. This spacing
allows for scaffolding plywood floor deck to be placed across the tops of the walk-
boards. The plywood floor deck is then nailed to the walk-boards to provide the work
surface. Figure 2.5 provides a picture of a tie-down on a wood walk-board and Figure 2.6
offers a close-up of a completed tie-down.
Figure 2.5: Completed tie-down on wood walk-board.

21
Figure 2.6: Close-up of tie-down.
Metal walk-boards differ in both size and attachment mechanism from wood
walk-boards. Metal walk-boards are typically 19” wide (although they can differ) and
come in the same lengths as wood walk-boards. The NPP standard operating procedure
states that metal walk-boards must “have been tested and listed by Underwriters
Laboratories (UL) or Factory Mutual Engineering Corporation (FM)” (Duke Energy,
2006). Instead of simply resting on the scaffolding tubes, metal walk-boards utilize an
integrated hook-on mechanism (see Figure 2.7). The hooks are seated over the scaffold
tubes diminishing the possibility of any front to back movement. Once in place, the walk-
board is tied down using #9 gauge wire. A tie-down is placed through a hole centered
near the end of the walk-board and then wrapped around the scaffolding tube. This allows
the tie-down to be significantly shorter for the metal versus wood walk-board,
approximately 18” in length. Prior to the tie-down, the #9 gauge wire is transported and
prepared the same way as for a wood walk-board. Once looped, the tie-down is hand
twisted two to three times to ensure proper seating. A pair of lineman‟s pliers is used to
grasp the junction of the wires, which are then rotated in a clockwise fashion to tighten.
The #9 wire tie-down is tightened to the maximum hand strength of the scaffolder. Once

22
tight, any excess #9 wire is cut off using the lineman‟s pliers. The exposed tips are then
curled out-of-the-way using the pliers to eliminate any puncture hazard (see Figure 2.8).
Metal walk-boards are placed side-by-side across the entire width of the scaffold frame to
create the desired work surface.
Figure 2.7: Hook-on mechanism used for metal walk-boards.
Figure 2.8: Completed tie-down on metal walk-board.
Both walk-board types are used throughout NPPs. Wood has the advantage of
being flexible; it can be used on a scaffold of any size. A disadvantage of wood is that the

23
walk-boards have a shorter lifespan, particularly if stored outside, and a high potential for
environmental contamination (radiation). Metal walk-boards are limited to predetermined
lengths; the scaffolding frame must be constructed to the precise size of the walk-board
or the hooks will not properly fit around a tube. An advantage of the metal walk-boards is
their lifespan, typically much longer than a comparable wood walk-board. Since both
types of walk-board are being used by NPPs, both types were investigated in this study.
2.2.2 Scaffold Couplers
The second task examined in this study was that of tightening and loosening of
scaffold frame tube couplers. Scaffolding couplers are made of a structural metal,
typically drop-forged steel, malleable iron, or structural grade aluminum, to ensure
strength and lifespan (Occupational Safety & Health Administration, 1996). While
multiple manufacturers produce scaffolding couplers (e.g., ThyssenKrupp Safeway,
Layher), all models maintain the same functionality. Couplers from different
manufacturers utilize the same tightening technique (bolt ratcheting) with only superficial
visual differences. Figure 2.9 provides a close-up view of a scaffolding coupler and
Figure 2.10 shows a coupler positioned and tightened.

24
Figure 2.9: Close-up of scaffolding coupler.
Figure 2.10: Scaffolding coupler in use.
The coupling mechanism utilized by scaffolding couplers is the force of friction
between the coupler and the tube to eliminate movement. The tube contacts two parts of
the scaffolding coupler, the base and a rotating arm. Once the tube has been placed on the
base, the coupler arm is rotated on top of the tube. This alone does not provide adequate
friction to prevent movement. To achieve adequate friction, a nut and bolt are used. The
bolt is secured to the base of the coupler allowing it to rotate into position. After the tube

25
has been placed between the base and the arm, the bolt is rotated into a slot on the arm.
Once seated, the bolt is secured through the use of a nut. The nut is tightened, using a
ratchet, onto the upper portion of the arm. The design of the surface allows for a clean
mating between the nut and the arm. In practice, scaffolders typically hand-tighten the
nut as much as possible before using the ratchet. As more torque is applied to the nut, the
coupling arm presses onto the tube increasing friction. The nut is typically tightened as
much as possible, with a NPP requiring the manufacturer‟s recommended torque limit
(Duke Energy, 2006). To remove a coupler from a tube, the nut is ratcheted until loose
enough to remove the bolt from the arm, thereby releasing the tube. Again, after
loosening the nut with a ratchet, scaffolders will typically use their hands to remove the
nut.
There are two primary types of scaffolding couplers, including rigid and swivel.
Rigid couplers are used to connect vertical with horizontal tubes; they are only capable of
joining frame tubes at 90 degree angles. Rigid couplers are typically seen at the corners
of any scaffolding frame. Swivel couplers allow for tubes to be joined at angles other
than right angles. They are typically used to secure load-bearing diagonal cross members.
Rigid couplers differ from swivel couplers only in the design of the base. For rigid
couplers, the base is one solid piece with fittings for two tubes on opposite sides and at
right angles to each other. For swivel couplers, there are two pieces to the base attached
using a swiveling mechanism. Each coupler weighs approximately 1.5 pounds. Figures
2.9 and 2.10 provide images of rigid couplers while Figures 2.11 and 2.12 present swivel
couplers.

26
Figure 2.11: Swivel couplers.
Figure 2.12: Swivel couplers in use.
2.3 Testing Apparatus
For this study, two experiments were conducted on custom-built scaffolding
frames. At these frames, participants were required to use the current equipment
(described above) as well as proposed interventions under a variety of conditions.
2.3.1 Experiment 1 Overview
Experiment 1 (E1) was conducted to assess the impact of various walk-board tie-
down methods on scaffolder performance and posture position. As described above, #9
gauge wire is currently used to tie down walk-boards. With a thickness of 0.1144”, high
forces are required to manipulate the wire and extreme wrist postures are assumed. These

27
work factors coupled with repetitive wrist motion to secure the tie-down place the
scaffolder at a heightened ergonomic risk (Putz-Anderson, 1988). The “deep dive”
analysis showed that the tie-down task required “Very Bad” postures as well as repetitive
and forceful hand activities (Moore & Garg, 1995). Consequently, an ergonomic
intervention was proposed towards reducing the force requirements, extreme wrist
postures, and repetitive motions.
A survey was conducted to determine if any commercial products existed which
could reduce the identified ergonomic hazards in the walk-board tie-down. Unfortunately,
an internet search found no products designed specifically for scaffolding work. The next
step was to identify other commonly used methods to secure elevated walking surfaces
in, for example, construction environments. One idea was to adapt a spring coupler to fit
over both a walk-board and the scaffolding tube. A locking mechanism could be used to
ensure that the coupler would remain secure. Such a coupler could be reusable and
eliminate wrist motion repetition and extreme postures. However, this alternative was
deemed unsuitable due to the cost and time required to adapt the couplers to fit a large
work area. Another idea was to use rope to secure walk-boards using a knotting tool
which would allow the worker to remain standing. This idea was discarded because
scaffolders could not afford to carry additional equipment on a tool belt while on the
scaffold.
Subsequently, the idea to use industrial plastic zip ties was put forward. Using zip
ties was expected to eliminate repetition of wrist motion while reducing harmful postures.
It was also expected that zip ties could be applied to walk-boards in the exact same
manner as the current #9 wire. The zip tie would be looped over the walk-board and the
28
scaffolding tube. The zip tie would then be pulled through the zip head, tightening upon
itself. Once tight, any excess zip tie would be clipped off and the exposed end tucked out
of the way. Although the manner of use of the zip tie could be similar to the #9 wire, the
capacity of the tie was another issue for consideration. The #9 gauge wire currently used
at the NPP is required to have a tensile strength of 250lbs; thus, any plastic zip tie would
be required to have the same tensile strength. Plastic zip ties were found with a bundling
strength of 250lbs, meeting the requirements of the NPP. The maximum length of #9
gauge wire used in the tie-down task was approximately 18”; plastic zip ties were found
with lengths up to 36”. Any zip tie intervention also needed to be robust for application
anywhere in the NPP. With temperatures reaching over 120°F in certain areas, any plastic
zip tie intervention must be able to withstand high heat. Commercially available plastic
zip ties are able to be used under -40°F to 185°F. A final concern was that of cost. A bag
of fifty 36” plastic zip ties cost $8.95 for a price per tie of only $0.18. Buying in bulk
would allow for an even lower price. A 100 pound coil (1705 feet) of #9 gauge wire costs
$121.06 for a price of $0.11 per 18” tie-down.
The ergonomic intervention chosen for examination in the experiment was
replacement of the current #9 gauge wire tie-downs with plastic zip ties. The final tie
chosen was a Nylon 6.6 Extra Heavy Duty Cable Tie manufactured by Cable Tie
Express. For the study, a length of 36” was selected, to ensure adequate length for wood
walk-board tie-down. Additionally, a tensile strength of 175lbs was selected because of
cost. The experiment did not examine the yield strength of the plastic zip ties. A total of
600 zip ties were procured for the study.
29
2.3.2 Experiment 2 Overview
Experiment 2 (E2) was conducted to quantify differences between the standard
scaffolding coupler and the proposed intervention. The current scaffolding coupler was
found to require excessive force to sufficiently tighten, while exposing the wrist to
awkward postures and repetitive motions. Specifically, it was the tightening and
loosening of the coupler that placed the scaffolder at risk. The results of the “deep dive”
analysis estimated that scaffolders exert a force of at least 300 ft-lbs of torque in order
adequately tighten scaffold frame couplers. This exceeds the recommended torque limit
of 180.75 ft-lbs for this task (Mital & Channaveeraiah, 1988). Additionally, the hand
intensive task of tightening and loosening the couplers exceeded the recommended level
of the Strain Index (Moore & Garg, 1995). The task was found to require repetitive work
in “Bad” postures. Consequently, a search was conducted using scaffolding manufactures
and industrial supply stores to see if other coupling options were commercially available
that might serve to eliminate these risks. None were found. Once it was determined that
there was no readily available solution, an alternate coupling mechanism was designed
and prototyped.
Initially, a design concept was developed to simply alter the existing couplers
towards alleviating the risks. Eventually, it became apparent that a retrofit was simply
not feasible within the time and monetary constraints of the project. Instead, a reverse
engineering process was applied to the existing couplers and a revised coupler model was
manufactured through a rapid prototyping system. The revised coupler model integrated a
“ski-boot” type clamping mechanism. The ski-boot clamping mechanism includes a
series of metal hooks on one side of a boot and a metal loop of wire attached on the other.
30
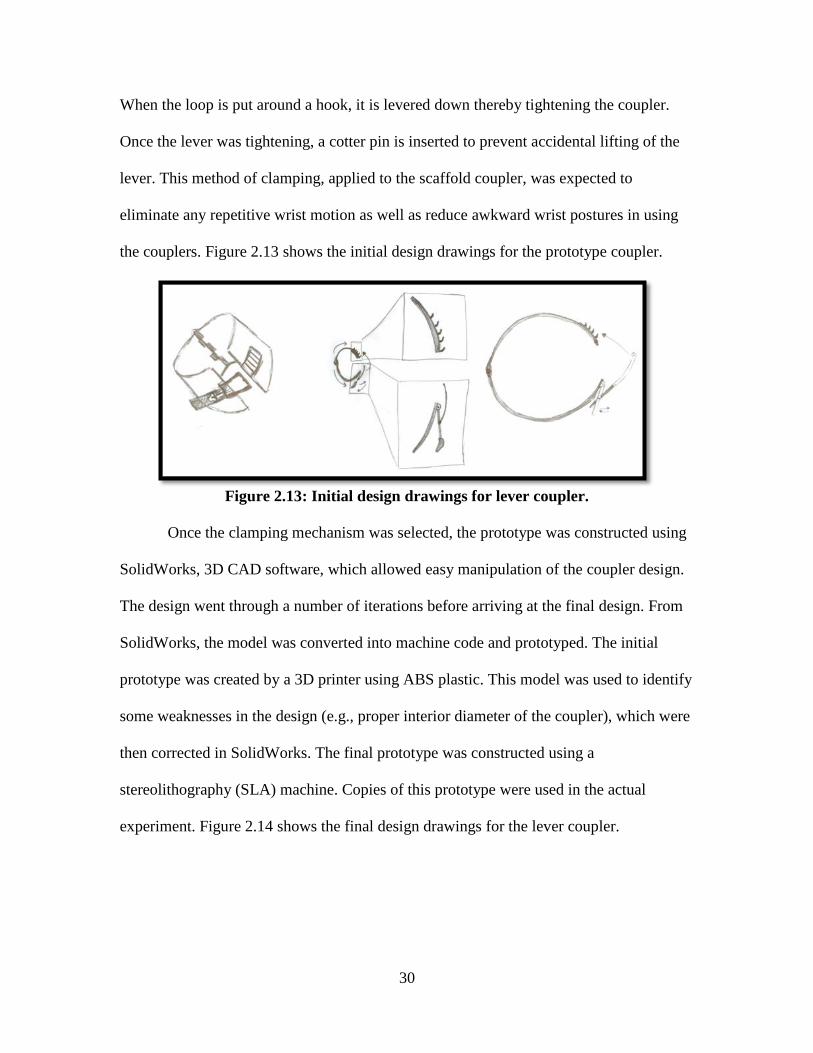
When the loop is put around a hook, it is levered down thereby tightening the coupler.
Once the lever was tightening, a cotter pin is inserted to prevent accidental lifting of the
lever. This method of clamping, applied to the scaffold coupler, was expected to
eliminate any repetitive wrist motion as well as reduce awkward wrist postures in using
the couplers. Figure 2.13 shows the initial design drawings for the prototype coupler.
Figure 2.13: Initial design drawings for lever coupler.
Once the clamping mechanism was selected, the prototype was constructed using
SolidWorks, 3D CAD software, which allowed easy manipulation of the coupler design.
The design went through a number of iterations before arriving at the final design. From
SolidWorks, the model was converted into machine code and prototyped. The initial
prototype was created by a 3D printer using ABS plastic. This model was used to identify
some weaknesses in the design (e.g., proper interior diameter of the coupler), which were
then corrected in SolidWorks. The final prototype was constructed using a
stereolithography (SLA) machine. Copies of this prototype were used in the actual
experiment. Figure 2.14 shows the final design drawings for the lever coupler.
31
Figure 2.14: Final design drawing for lever coupler.
The revised coupler consists of nine pieces: one base, two upper arms, two upper
swing arms, two levers, and two loops. The base is a double-sided piece for two tubes to
be placed at a 90 degree angle to each other, as well as incorporating the hooks for
tightening the coupler. The upper arms are the portion of the coupler that is lowered on
top of the tube; they are connected to the base using a bolt, nut, and locking washer. The
levers are the handles used by the scaffolder to either tighten or loosen the coupler. They
are fitted to the curvature of the upper arm to allow for a tight fit and are connected to the
upper arm using built-in brackets and 1/8” diameter steel dowel pins. The upper swing
arms are placed in-between the arms of the lever, and allow for the wire loop to rotate
independently of the lever. They are connected to the lever using 1/8” diameter steel
dowel pins. The loops currently used consist of a 4” piece of 1/16” diameter braided
steel cable held in place using aluminum ferrules. The loops are placed through an

32
opening on the upper swing arms. A total of twelve couplers were built and used in
Experiment 2.
2.3.3 Experimental Equipment
The measurement equipment used in Experiment 1 was a biaxial electro-
goniometer (SG-150) from Biometrics®. The SG-150 was used to measure flexion-
extension and radial-ulnar deviation of the wrist. Any decrease of the angle between the
back of the hand and the forearm from the neutral posture was measured as flexion, while
an increase in this angle was measured as extension. Flexion was considered a
complement of extension because they were measured with the same device. A decrease
in the angle between the thumb and forearm from the neutral posture was measured as
radial deviation, while an increase of this angle was measured as ulnar deviation. Just as
for flexion and extension, radial and ulnar deviations were considered to be
complementary. The electro-goniometer was placed on participants with the wrist in a
neutral posture (lower portion of Figure 2.15). The distal end of the electro-goniometer
was placed over the third metacarpal, while the proximal end was placed over the midline
of the forearm. Once the SG-150 was mounted, the cables were moved out of the
participant‟s way by taping them to the back.

33
Figure 2.15: Electro-goniometer mounting on the hand and forearm for measuring
wrist extension-flexion and radial-ulnar deviation.
The measurement equipment used in Experiment 2 was a biaxial electro-
goniometer (SG-75) and a single-axis torsiometer (T-110), both from Biometrics®. The
SG-75 was mounted in the same fashion as the SG-150 in Experiment 1 and measured
the same wrist angles (flexion, extension, radial deviation, ulnar deviation). The T-110
was used to measure pronation and supination of the forearm. With the arm extended
horizontally in front of the participant, the T-110 was mounted with the distal end
midpoint on the underside of the forearm and the proximal end placed on the interior
portion of the triceps (shown in Figure 2.16).

34
Figure 2.16: Torsiometer mounting on the hand and forearm measuring pronation.
The SG-150, SG-75, and the T-110 were all connected to a single ProComp
Infiniti eight channel analog to digital encoder unit using BioGraph Infiniti Software
version 5. The data was originally sampled at 2048 Hz and then recorded at 32 Hz for
analysis purposes. Similar electro-goniometer studies have used a wide range of
recording frequencies ranging from 20 Hz (Hansson, Balogh, Ohlsson, Rylander, &
Skerfving, 1996) to 100 Hz (McGorry, Chien-Chi, & Dempsey, 2004) so a selection of
32 Hz was considered acceptable for analysis.
A digital camera was used in both experiments to record the participant work
during each test trial. The tapes were then used to break down the tasks into individual
components as well as to determine task and component times.
When recording participant anthropometry, two separate measurement devices
were used. To measure grip strength and linear force, an Ergo FET hand grip
dynamometer was used. To measure back strength and upper arm strength, a NextGen
floor mounted dynamometer was used.

35
2.4 Experimental Design
2.4.1 Independent Variables
For Experiment 1 there were a total of four independent variables. The first was
the tie-down type with two levels: the standard #9 wire and the plastic zip ties. The
second independent variable was the walk-board type with two levels: wooden boards
and metal boards. The third independent variable was the subtask performed in securing a
board: the looping the tie-down around a walk-board and tightening of the tie-down. The
final independent variable was the position of the tie-down on a scaffold frame with two
levels: an upper level or a lower level. The latter two independent variables (subtask and
tie-down position) were defined by the job and the design of the test frame. The
conditions were representative of real scaffolding operations. The variables that were
manipulated during the trials were the tie-down type and walk-board material. Therefore,
Experiment 1 followed 2 x 2 x 2 x 2 randomized complete block (RCB) design. Each trial
consisted of a unique set of conditions which were presented in different orders across
trials for each participant to control for learning and order effects.
For Experiment 2 there were a total of three independent variables. The first was
the coupler type with two levels: the existing equipment (ratcheting couplers) and the
proposed intervention (lever couplers). The second independent variable was the activity.
The activity consisted of two levels: assembly (putting on the coupler) and disassembly
(removing the coupler). The final independent variable was the subtask, consisting of two
levels: placement (removal) of the coupler around the tubes and clamping (unclamping)
the coupler around the tube. The latter two variables were defined by the nature of the
work in each trial regardless of the coupler type. The variable manipulated between trials

36
was the coupler type. Therefore, Experiment 2 followed a 2 x 2 x 2 RCB design. Each
trial consisted of a unique set of conditions presented in different orders across trials for
each participant in order to control for learning and order effects.
2.4.2 Dependent Variables
For Experiment 1, there were a total of five dependent variables. All were
objective measures, including four joint movement angles from the electro-goniometer:
flexion, extension, radial deviation, and ulnar deviation at the wrist. All angular response
measures represent the absolute posture position of the wrist throughout the experiment.
The final dependent variable was the average time-to-task completion (TTC) derived
from the videotapes and electro-goniometer data.
For Experiment 2, there were a total of six dependent variables. All were
objective measures, including five joint movement angles from the electro-goniometer:
flexion, extension, radial deviation, and ulnar deviation at the wrist as well as pronation
of the forearm measured from a supine position. The sixth dependent variable was the
total time-to-task completion derived from the videotapes and electro-goniometer data.
2.5 Experimental Procedure
2.5.1 Facility and Training
This study took place over the course of three days at a training center for the
power utility. The scaffold frames were setup in a single training area of approximately
45‟ x 25‟. The setup of the frames and associated areas is provided in Figure 2.17. Upon
arrival on the first day, the nine participants were informed of the purpose of the study,
specifically to indentify ergonomic interventions that might serve to reduce the number of
maintenance injuries at NPPs. They then read and signed the informed consent for the

37
study (see Appendix A). Finally, they completed a set of stretching exercises to warm-up
their muscles for the experiments.
Figure 2.17: Experimental frame setup.
Subsequently, participants were introduced to the equipment used during the
study, including the plastic zip ties and the lever couplers. They were shown how to
apply the equipment and given time to practice using both interventions. The participants
were also shown the measurement equipment (electro-goniometer) and the mounting
procedure. Any questions concerning the intervention or the measurement equipment
were answered at this time. Finally, the scaffold frame setups were shown to the
participants and a walkthrough of the tasks was completed. The participants were then
divided into three groups of three scaffolders. These groups remained together throughout
all three days of the study. While the previous steps were only performed on the first day
of the study, every morning was begun with stretching and a recap of the previous day‟s
activity. Following the stretch, test trials began immediately. Each day was divided into
three 2-hour sessions, with each session broken into three 40 minute blocks.

38
2.5.2 Experiment 1 Testing
For Experiment 1, each block was divided into four trials of roughly 4 minutes
each. In each block, participants were assigned one of three roles that were maintained
throughout the block. A test operator (TO) performed all four trials during each block. An
operator‟s assistant (OA) handed the TO any equipment needed during the four trials. The
final participant was assigned the role of spotter (S). The spotter watched the TO and OA
to ensure that they were properly carrying out the trials. Additionally, the spotter filled
out a survey on the work activity and equipment. Participants swapped roles at the end of
each block (every 40 minutes), with the TO assuming the OA role and the spotter
assuming the TO role. The breakdown of the time and tasks according to participant roles
during a block is presented in Table 2.2.

39
Table 2.2: Description of Experiment 1 task procedure and estimated test times.
Time (min)
within
Block
TO
Duty Set
OA
Duty Set S Duty Set
0-15 Equipment set-up Be sure that wire tie-
downs are ready Prepare for trial
16-20 Trial 1. 8 tie-downs on
predetermined planks
Hand TO #9 wire for tie-
down Spotter Survey
21-25 Trial 2. 8 tie-downs on
predetermined planks
Hand TO plastic zip-ties
for tie-down Spotter Survey
26-28 Rest Removal of tie-downs Removal of tie-
downs
29-33 Trial 3. 8 tie-downs on
predetermined planks
Hand TO #9 wire for tie-
down Spotter Survey
34-38 Trial 4. 8 tie-downs on
predetermined planks
Hand TO plastic zip-ties
for tie-down Spotter Survey
39-40 Questionnaire Prepare for next trial Prepare for next
trial
Experiment 1 used a preassembled frame with eight walk-boards placed on it:
four wood and four metal. On the left side of the frame were the four wood walk-boards
with two positioned 5‟off the ground and the other two positioned 6” off the ground. On
the right side of the frame were the four metal walk-boards positioned at the same levels
(heights) as the wooden walk-boards. Figure 2.18 shows the relative placement of the
walk-boards on the frame.
40
Figure 2.18: Diagram of Experiment 1 scaffolding frame.
At the outset of the experiment, the TO was fitted with the electro-goniometer
while the spotter and OA ensured the proper tie-downs were ready (both #9 wire and
plastic zip ties). To fit the electro-goniometer, the TO placed his dominant hand palm-
down with his arm extended directly forward. With the hand and forearm horizontal, the
electro-goniometer was calibrated, with no flexion, extension, radial, or ulnar deviation
being read. Once properly positioned, the two sensor heads were taped in place. Once the
electro-goniometer was mounted, a check was performed to ensure it was working
properly. At the same time the equipment was fit to the TO, the spotter and OA ensured
that all materials were prepared for the block of trials.
Each of the four trials within a block tested different walk-board materials and tie-
down types. The two types of walk-boards and two types of tie-downs were tested in each
block. The conditions were presented in random order within block (participant) to

41
reduce the presence of any fatigue effects across blocks. Each trial began with the TO
tying down Board #1 of the proper material (see Figure 2.18). Once this walk-board was
tied down using the appropriate tie-down type, the TO would move in a clockwise
direction tying-down the other three walk-boards laying on the frame. Upon completion
of the first circuit, the spotter and OA would remove the four ties. The TO would then
repeat the circuit in the same manner to finish the trial. A total of eight tie-downs were
performed during each trial. There was a single maximum posture position observation
recorded for each replication along with the times to complete the specific subtasks in the
replication. At the end of the trial, the TO would rest while the spotter and OA removed
the ties from the boards. Trials 2-4 were completed in the exact same manner except the
walk-board material and the tie-down type were varied. When the TO finished the block
(four trials), the electro-goniometer was removed. The OA would take the place of the TO
and the entire block was repeated with the three participants in their different roles.
During the course of the study, each group of three participants performed
Experiment 1 in three different sessions. This allowed for multiple trials to be completed
by each participant. A total of nine sessions were completed across participant groups
with each scaffolder completing a total of 96 tie-downs.
2.5.2 Frame 2
In Experiment 2, each block was divided into four 4 minute trials. As in
Experiment 1, in each block participants were assigned one of three roles: the test
operator (TO), the operator‟s assistant (OA) and a spotter (S). Each role included different
tasks. The TO placed, tightened, loosened, and removed couplers. The OA prepared the
frame tubes to be coupled as well as handed the TO any necessary equipment. The spotter

42
observed the TO and OA while filling-out the spotter survey. The participants switched
roles every 40 min (or block). The breakdown of participant tasks in each block and is
presented below in Table 2.3.
Table 2.3: Description of Experiment 2 task procedure and estimated step times.
Time (min)
within Block
TO
Duty Set
OA
Duty Set
S
Duty Set
0-15 Equipment set-up Prepares tubes and
couplers for trial Prepare for trial
16-20
Trial 1. Assemble 4
couplers/Disassemb
le 4 couplers
Assist TO with positioning
of tubes, hand appropriate
coupler
Spotter Survey
21-25
Trial 2. Assemble 4
couplers/Disassemb
le 4 couplers
Assist TO with positioning
of tubes, hand appropriate
coupler
Spotter Survey
26-27 Rest Rest Rest
28-32
Trial 3. Assemble 4
couplers/Disassemb
le 4 couplers
Assist TO with positioning
of tubes, hand appropriate
coupler
Spotter Survey
33-37
Trial 4. Assemble 4
couplers/Disassemb
le 4 couplers
Assist TO with positioning
of tubes, hand appropriate
coupler
Spotter Survey
38-40 Questionnaire/
Remove equipment Prepare to switch positions
Prepare to switch
positions
Experiment 2 used a preassembled frame with eight couplers supporting eight
vertical and eight horizontal tubes. On one end of the frame, four horizontal tubes were
mounted with approximately two feet of overhang. This additional tubing provided sites
for attachment of new couplers during testing. Figure 2.19 shows the setup of the frame.

43
Figure 2.19: Diagram of Experiment 1 scaffolding frame.
At the beginning of a block, the TO was fitted with the electro-goniometer while
the spotter and OA ensured that both types of couplers were prepared. The electro-
goniometer was placed with one end located on the centerline of the underside of the
forearm, while the other end was placed on the inside of the arm on the triceps. This
placement represented a fully supine posture. The electro-goniometer was calibrated in
this position and all measurements represented pronation of the forearm from the supine
posture.
Each trial involved mounting of one of the two types of couplers on the two
horizontal tubes (P1 and P2). The type of coupler was varied between trials within block.
All activities and subtasks occurred during every trial. A trial began with the OA handing
the TO the first coupler. The OA then picked-up P1 and positioned it properly. The TO
then placed and tightened C1. Upon completion of C1, the TO placed and tightened C2.

44
Once The OA then retrieved P2 and placed it in position. The TO repeated the same
pattern of activities for C3 and C4. The four couplers were always mounted in a
clockwise order. Once all four couplers were mounted, the TO removed them in reverse
order. While the OA held the tubes in position, the TO would loosen and remove a
coupler. The TO removed C1 first and followed the same clockwise pattern as before.
While the TO and OA were conducting the trials, the spotter completed the spotter survey
and observed the trial to ensure the proper procedure was being followed.
Trials 2-4 were conducted in a similar manner, with only the coupler type varying
between trials. Upon completion of Trial 4, the TO became the spotter, the OA became the
TO, and the spotter became the OA. Each group of three participants completed
Experiment 2 three times for a total of three sessions per operator. A total of nine
sessions were completed across participant groups with each scaffolder assembling and
disassembling a total of 48 couplers.
2.5.3 Debriefing
Following the completion of all trials, an experiment debriefing took place. This
session consisted of collection of demographic data. The demographic data form is
presented in Appendix B. Once the form was completed, the participants were thanked
for their participation and given an NCSU Ergonomics Lab t-shirt.
2.6 Hypotheses
There were two hypotheses for Experiment 1. First, the maximum flexion,
extension, radial deviation and ulnar deviation angles were expected to be lower when
scaffolders used the plastic zip-ties because of the elimination of the wire twisting
subtask. Second, the plastic zip ties were expected to produce shorter average times to

45
task completion than the standard #9 gauge wire because of the elimination of wire
twisting subtask.
Similarly, there were two hypotheses for Experiment 2. First, the maximum
flexion, extension, radial deviation and ulnar deviation angles, as well as the forearm
pronation angle, were all expected to decrease using the lever couplers due to the
elimination of the ratcheting subtask. Second, the lever couplers were expected to
produce shorter average times to task completion than the standard scaffold couplers
because of the elimination of the ratcheting subtask.
2.7 Data Handling
Data handling was carried out in the same way for both experiments. The electro-
goniometer data was synchronized with the videos in order for analyses to be conducted
on the specific conditions (subtasks, levels, etc…) on each scaffold frame. The videos
were reviewed to identify the start and end times for each individual subtask in a trial. By
comparing the electro-goniometer time code with these times, the electro-goniometer
data was divided into proper lengths. A spreadsheet was developed for each experiment,
with a worksheet for each block (participant). The worksheets included condition
identifiers for each trial as well as the posture angle measurements and task times. The
Experiment 1 worksheet contained the flexion, extension, radial deviation, and ulnar
deviation angles, while the Experiment 2 worksheet contained the same with the addition
of the pronation angle.
After development of the data worksheets for each block (27 per frame; 54 in
total), SAS was used to translate the data in usable form for analysis including maximum
and minimum values for each of the angle measurements for each set of conditions. A

46
summary worksheet was then constructed for each experiment. The summary sheet for
Experiment 1 included identifiers for the participant, block, trial, tie type, walk-board
material, level and subtask, as well as the observations on flexion maximum, extension
minimum, ulnar maximum and radial minimum for each replication. The summary sheet
for Experiment 2 included identifiers for the participant, block, trial, coupler type,
activity and subtask, as well as observations on flexion maximum, extension minimum,
ulnar maximum, radial minimum and pronation maximum.
The data set on time-to-task completion was developed based on the start and end
times for each trial from the video recordings. These times were broken down into
individual subtask times over the entire set of conditions. Using these times, an average
time was calculated for each specific set of conditions. A spreadsheet was developed for
each experiment with the average time-to-task completion for all conditions.
2.8 Statistical Analysis
Analysis of variance (ANOVA) was used to identify any significant effects of the
independent variables on the posture position and time responses. Assumptions of the
ANOVA procedure were assessed using graphical methods. Any independent variable
with a p-value <0.05 was considered statistically significant.
2.8.1 Testing Assumptions of Analysis of Variance
To assess the constant variance assumption of the ANOVA, plots were
constructed of model residuals against predicted values. Systematic patterns in the plots,
including expansion or collapse on the range of residual values across the range of model
predictions, were considered to indicate heterogeneity of variance. To assess the
normality assumption, residuals were plotted using a normal probability plot. Major
47
deviations of the residuals from a linear trend were considered to indicate a violation of
the normality assumption. To test for independence of observations, model residuals are
typically plotted against time, or trial number. Because the test trials for each operator
were distributed across three sessions, it was not possible to analyze model residuals in
this way. However, randomization procedures were followed in both experiments to
counter any systematic influences of learning or fatigue. ANOVA results confirmed this
with an insignificant effect of trial across response measures.
2.8.2 Data Analysis
A four step process was used to separately analyze the data from each experiment.
The first step was to use ANOVA for main effects modeling. The second step was to use
multivariate analysis of variance (MANOVA) to determine significant effects across all
angular response measures due to their dependence on one another. A full-factorial model
was used for each experiment. The third step was to use ANOVA to identify the specific
significant effects for each response among the main effects and interactions found to be
significant through the MANOVA procedure. The final step was a correlation analysis on
all responses for each experiment.
The main effects modeling was used to identify any significant learning effects
across sessions and trials, and to identify potential outliers in the responses. The models
were used to generate residuals for diagnostic purposes. Visual inspection of the model
residuals versus predicted values and leverage plots for each main effect was conducted
to identify data points statistically deviating from the mean response by ±2 standard
deviations. Further investigation was undertaken to determine if these data points could
legitimately be removed from the data set. Trial videotapes were reviewed to determine if

48
a participant did not follow instructions or if there was an equipment problem. If a valid
reason could be found for the outlying observation, the data point was removed from the
dataset. A summary of outliers for both experiments is included in Appendix C.
The next step was to conduct a MANOVA on all related responses. Two
MANOVAs were run: one for flexion, extension, radial deviation and ulnar deviation for
Experiment 1 and another for flexion, extension, radial deviation, ulnar deviation and
pronation for Experiment 2. Because the joint angle measurements all have some bearing
on each other, it was necessary to identify those experiment effects (main effects and
interactions in the full factorial model), which were significant across the family of
responses. Joint angle measurements are related due to the electro-goniometers
measuring multiple responses at one time. The average time-to-task completion values
were not included in the MANOVA because they were recorded separately.
Subsequently, additional ANOVAs were run on the individual responses using
only the significant factors identified by the MANOVAs. Any effects found to be
significant with these ANOVA are the effects which have a significant impact on
performance. Any significant interaction was analyzed using a post-hoc Tukey‟s
Honestly Significant Difference (HSD) test.
Pearson product-moment correlation coefficients were computed to determine the
degree of linear association among the joint angles and time-to-task completion. In
general, it was expected that smaller joint angles would be associated with shorter task
times.
There were a total of 432 (9x3x2x2x2x2) observations for Experiment 1. The 9
operators completed 3 blocks of test trials. During each block, there were a total of 2 tie

49
types, 2 walk-board materials, 2 levels and 2 subtasks. Each unique set of conditions
comprised an observation. For Experiment 2, there were a total of 432 (9x3x2x2x2x2)
observations. As in Experiment 1, the 9 operators completed 3 blocks of test trials.
During each block, there were 2 coupler types, 2 activities and 2 subtasks. Each set of
conditions were repeated twice per block.
2.8.2.1 Experiment 1
A statistical model was constructed for each of the first three steps listed above.
The model used for the first main effects ANOVA was as follows:
Yijklmno= μ + τi + Sj + TTk + TT(T)l + WBm + Ln + Subo + εijklmno
(i=1-9, j=1-3, k=0-1, l=1-4, m=0-1, n=0-1,o=0-1)
Where:
y= response measure
μ= grand mean
τ= participant
S= session
TT= tie-type
T= trial nested within tie-type
WB= walk-board type
L= level
Sub= subtask
ε= model error
The model developed for the MANOVA was as follows:

50
Yijklmn= μ + τi + Sj + TTk + WBl + (TT*WB)kl+ Lm + (TT*L)km+ (WB*L)lm+
(TT*WB*L)klm+ Subn + (TT*Sub)kn+ (WB*Sub)ln+ (TT*WB*Sub)kln +(L*Sub)mn+
(TT*L*Sub)kmn+ (WB*L*Sub)lmn+ (TT*WB*L*Sub)klmn+ εijklmn
(i=1-9, j=1-3, k=0-1, l=0-1, m=0-1, n=0-1)
Where:
Y= response measure
μ= grand mean
τ= participant
S= session
TT= tie-type
WB= walk-board type
TT*WB= interaction of tie-type and walk-board type
L= level
TT*L= interaction of tie-type and level
WB*L= interaction of walk-board type and level
TT*WB*L= interaction of tie-type, walk-board type, and level
Sub= subtask
TT*Sub= interaction of tie-type and subtask
WB*Sub=interaction of walk-board type and subtask
TT*WB*Sub= interaction of tie-type, walk-board type, and subtask
L*Sub= interaction of level and subtask
TT*L*Sub= interaction of tie-type, level, and subtask
WB*L*Sub= interaction of walk-board type, level, and subtask

51
TT*WB*L*Sub= interaction of tie-type, walk-board type, level, and subtask
ε= error
The final ANOVA model developed for analysis of the wrist angle measurements
(based on the MANOVA results) was as follows:
Yijklm= μ + τi + Sj + TTk + Ll +Subm + (TT*Sub)km + εijklm
(i=1-9, j=1-3, k=0-1, l=0-1, m=0-1)
Where:
Y= response measure
μ= grand mean
τ= participant
S= session
TT= tie-type
L= level
Sub= subtask
TT*Sub= interaction of tie-type and subtask
ε= error
The final ANOVA model constructed for the average time-to-task completion was
as follows:
Yijklmn= μ + τi + Sj + TTk + WBl + (TT*WB)kl+ Lm + (TT*L)km+ (WB*L)lm+
(TT*WB*L)klm+ Subn + (TT*Sub)kn+ (WB*Sub)ln+ (TT*WB*Sub)kln +(L*Sub)mn+
(TT*L*Sub)kmn+ (WB*L*Sub)lmn+ (TT*WB*L*Sub)klmn+ εijklmn
(i=1-9, j=1-3, k=0-1, l=0-1, m=0-1, n=0-1)

52
Where:
Y= response measure
μ= grand mean
τ= participant
S= session
TT= tie-type
WB= walk-board type
TT*WB= interaction of tie-type and walk-board type
L= level
TT*L= interaction of tie-type and level
WB*L= interaction of walk-board type and level
TT*WB*L= interaction of tie-type, walk-board type, and level
Sub= subtask
TT*Sub= interaction of tie-type and subtask
WB*Sub=interaction of walk-board type and subtask
TT*WB*Sub= interaction of tie-type, walk-board type, and subtask
L*Sub= interaction of level and subtask
TT*L*Sub= interaction of tie-type, level, and subtask
WB*L*Sub= interaction of walk-board type, level, and subtask
TT*WB*L*Sub= interaction of tie-type, walk-board type, level, and subtask
ε= error

53
2.8.2.2 Experiment 2
As for Experiment 1, a statistical model was constructed for each step of the
statistical analysis on the data from Experiment 2. The model used for the main effects
ANOVA was as follows:
Yijklm= μ + τi + Sj + Tk + Cl + Am + Subn + εijklm
(i=1-9, j=1-3, k=1-4, l=0-1, m=0-1, n=0-1)
Where:
Y= response measure
μ= grand mean
τ= participant
S= session
T= trial
C= coupler type
A= activity
Sub= subtask
ε= model error
The model constructed for the MANOVA was as follows:
Yijklm= μ + τi + Sj + Ck + Al + (C*A)kl+ Subm +(C*Sub)km+(A*Sub)lm+(C*A*Sub)klm+
εijklm
(i=1-9, j=1-3, k=0-1, l=0-1, m=0-1)
Where:
Y= response measure
μ= grand mean

54
τ= participant
S= session
C= coupler type
A= activity
C*A= interaction of coupler type and activity
Sub= subtask
C*Sub= interaction of coupler type and subtask
A*Sub- interaction of activity and subtask
C*A*Sub= interaction of coupler type, activity, and subtask
ε= model error
The model constructed for the final ANOVAs (based on the MANOVA results)
was as follows:
Yijklm= μ + τi + Sj + Ck + Al + Subm +(C*Sub)km+(A*Sub)lm+ εijklm
(i=1-9, j=1-3, k=0-1, l=0-1, m=0-1)
Where:
Y= response measure
μ= grand mean
τ= participant
S= session
C= coupler type
A= activity
Sub= subtask
C*Sub= interaction of coupler type and subtask

55
A*Sub- interaction of activity and subtask
ε= model error
The final ANOVA model constructed for the average time-to-task completion was
as follows:
Yijklm= μ + τi + Sj + Ck + Al + (C*A)kl+ Subm +(C*Sub)km+(A*Sub)lm+(C*A*Sub)klm+
εijklm
(i=1-9, j=1-3, k=0-1, l=0-1, m=0-1)
Where:
Y= response measure
μ= grand mean
τ= participant
S= session
C= coupler type
A= activity
C*A= interaction of coupler type and activity
Sub= subtask
C*Sub= interaction of coupler type and subtask
A*Sub- interaction of activity and subtask
C*A*Sub= interaction of coupler type, activity, and subtask
ε= model error

56
3 Results
The results are presented in two sections. Section 3.1 covers Experiment 1, while
Section 3.2 presents the results from Experiment 2. Each section begins with the main-
effects ANOVA followed by the diagnostics on model residuals concerning assumption
violations. The MANOVA results are presented along with univariate ANOVAs on each
response measure. Finally, the results of the correlation analyses are presented.
3.1 Experiment 1
The main-effects statistical modeling yielded results on the potential impact of a
learning effect due to the order of trial and session, and produced model residuals for
diagnostic purposes. The effects of trial and session were evaluated for the joint angle
and TTC responses. For the angular response measures trial order was found to be
insignificant for flexion (p=0.7696), extension (p=0.0727), radial deviation (p=0.9064)
and ulnar deviation (p=0.8539) all. Consequently, trial was dropped from any further
statistical analysis. Session was found to be significant for three out of four angular
response measures, including flexion (p=0.0006), extension (p<0.0001) and ulnar
deviation (p<0.0001). Only radial deviation (p=0.1298) showed an insignificant effect.
Consequently, session was retained in all other models of the joint angle responses. For
the TTC, trial (p=0.4742) was found to be insignificant while session (p<0.0001) was
found to be significant. Thus, trial was dropped from subsequent models while session
was retained.
Regarding model residual diagnostics, the plots for assessing constant variance
and normality assumptions are included in Appendix D. There were no violations of the
assumptions for any of the angular response measures. However, the TTC appeared to

57
violate the constant variance assumption. There appeared to be an over-prediction of the
model at high and low values and an under-prediction near the mean time value. To
correct for the over-prediction, a logarithmic transformation was applied to the TTC data.
The plot of the transformed TTC data can also be seen in Appendix D. The
transformation appeared to be successful in addressing the assumption violations. For the
residual versus predicted plots it is interesting to note that the expected flexion angle
ranges from 0° to 70° while the expected extension angle ranges from -50° to -100°. It is
possible that the inertia required during the ratcheting task caused the absolute deviation
to be larger for extension. The flexion angle was impeded by the force required to move
the ratchet. Regarding the residual versus predicted plot for TTC, it is important to note
that there was a lower bound, or minimum motor performance time, for the task.
Furthermore, the dispersion of the residuals may be attributable to measurement error in
recording task time based on the video analysis.
The MANOVA results for Experiment 1 are presented in Table 3.1. A total of six
main effects and interactions were found to be significant across all four angular response
measures. Subject (p<0.0001), session (p<0.0001), tie (p<0.0001), level (p=0.0266),
subtask (p<0.0001) and tie*subtask (p=0.0003) were all found to be significant. The
remaining eleven main effects and interactions were removed from follow-on univariate
ANOVAs.
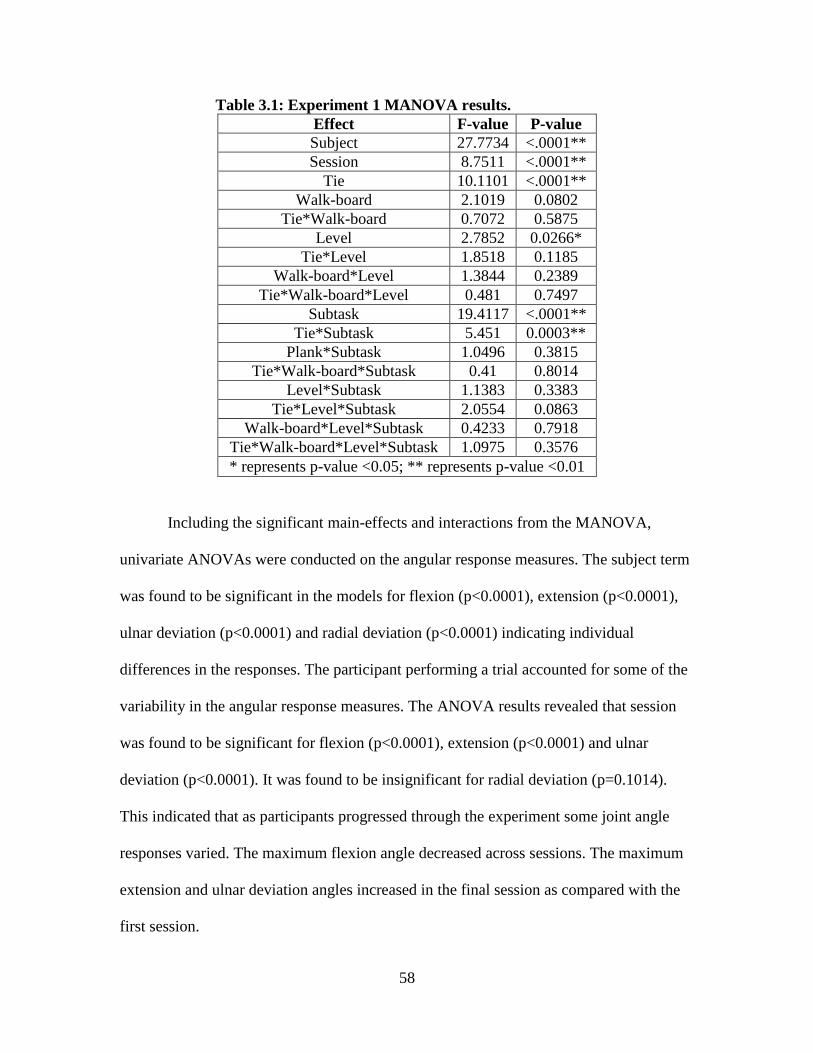
58
Table 3.1: Experiment 1 MANOVA results.
Effect F-value P-value
Subject 27.7734 <.0001**
Session 8.7511 <.0001**
Tie 10.1101 <.0001**
Walk-board 2.1019 0.0802
Tie*Walk-board 0.7072 0.5875
Level 2.7852 0.0266*
Tie*Level 1.8518 0.1185
Walk-board*Level 1.3844 0.2389
Tie*Walk-board*Level 0.481 0.7497
Subtask 19.4117 <.0001**
Tie*Subtask 5.451 0.0003**
Plank*Subtask 1.0496 0.3815
Tie*Walk-board*Subtask 0.41 0.8014
Level*Subtask 1.1383 0.3383
Tie*Level*Subtask 2.0554 0.0863
Walk-board*Level*Subtask 0.4233 0.7918
Tie*Walk-board*Level*Subtask 1.0975 0.3576
* represents p-value <0.05; ** represents p-value <0.01
Including the significant main-effects and interactions from the MANOVA,
univariate ANOVAs were conducted on the angular response measures. The subject term
was found to be significant in the models for flexion (p<0.0001), extension (p<0.0001),
ulnar deviation (p<0.0001) and radial deviation (p<0.0001) indicating individual
differences in the responses. The participant performing a trial accounted for some of the
variability in the angular response measures. The ANOVA results revealed that session
was found to be significant for flexion (p<0.0001), extension (p<0.0001) and ulnar
deviation (p<0.0001). It was found to be insignificant for radial deviation (p=0.1014).
This indicated that as participants progressed through the experiment some joint angle
responses varied. The maximum flexion angle decreased across sessions. The maximum
extension and ulnar deviation angles increased in the final session as compared with the
first session.

59
ANOVA results on the tie type manipulation revealed flexion (p=0.0341),
extension (p<0.0001) and ulnar deviation (p<0.0001) to be significantly impacted. It was
found to be insignificant for radial deviation (p=0.8856). Although significant when
compared to chance, the effect of tie type on flexion (p=0.65), extension (p=0.45) and
ulnar deviation (p=0.15) was insignificant in the presence of individual differences. The
mean flexion angle for the existing #9 gauge wire tie-downs was 42.8° and for the plastic
zip ties flexion angle was 26.8°; a difference of 16°. The mean extension angle for the
existing ties was -79.7° and for the plastic zip ties it was -76.6°; a reduction of 3.1°. For
ulnar deviation, the means were 49.3° and 40.8°, respectively. This represents a reduction
of 8.5° in the joint angle. For radial deviation there was no difference.
The level of the tie-down was found to be significant for flexion (p<0.0001) and
extension (p=0.0003) but not for ulnar deviation (p=0.5814) and radial deviation
(p=0.0773). Although significant when compared to chance, the effect of level on flexion
(p=0.39) and extension (p=0.64) was insignificant in the presence of individual
differences. The flexion angle for the upper level was on average 36.9° and for the lower
level it was 33.3°. The extension angle was -76.6° for the upper level and -79.7° for the
lower level. These results show that changing the level at which the scaffolding work is
conducted had an effect for flexion and extension only.
ANOVA results revealed the subtask main effect to be significant for flexion
(p<0.0001), extension (p<0.0001), ulnar deviation (p=0.0007) and radial deviation
(p<0.0001). Although significant when compared to chance, the effect of subtask on
extension (p=0.58), ulnar deviation (p=0.45) and radial deviation (p=0.30) was
insignificant in the presence of individual differences. The flexion (p=0.0040) effect of
60
subtask remained significant in the presence of individual differences. The flexion angle
for the looping subtask was 27.8° and 42.3° for the clamping subtask. The extension
angle was -78.9° for looping and -77.4° for clamping. The ulnar deviation for looping
was 43.0° and 47.1° for clamping. The radial deviation was -25.8° for looping and -31.6°
for clamping. From these results, it can be observed that the angular response was more
extreme for the clamping subtask as compared to the looping subtask.
The interaction of tie*subtask was significant for wrist flexion (p<0.0001),
extension (p=0.0001) and radial deviation (p=0.0029), it was insignificant for ulnar
deviation (p=0.8892). The flexion angle interaction plot for tie*subtask can be seen in
Figure 3.20, the extension interaction plot in Figure 3.21, and the radial deviation
interaction plot in Figure 3.22. It can be observed that the flexion angle due to tie*subtask
was significantly different between tie type for the clamping subtask. Post-hoc analysis
using Tukey‟s HSD test supported this observation. The value of 55.7° for the existing #9
gauge wire tie-downs was significantly different (p<0.05) than 27.4° for the plastic zip
ties. From Figure 3.21 it can be seen that the extension angle due to tie*subtask was
significantly different between tie type for the looping subtask. Tukey‟s HSD test
supported this observation, demonstrating that the value of -82.1° for the #9 gauge wire
tie-downs and -75.9° for the plastic zip ties were significantly different (p<0.05). From
Figure 3.22 it can be seen that the radial deviation angle due to tie*subtask was
significantly different between tie-down types for the clamping subtask. Tukey‟s HSD
test supported this observation, demonstrating that the value of -34.6° for the #9 gauge
wire tie-downs and -28.4° for the plastic zip ties were significantly different (p<0.05).

61
Figure 3.20: Flexion angle tie*subtask interaction plot. (Note: The plot presents trends on the actual condition means. The Tukey's
classification of conditions was based on LS mean values.)
Figure 3.21: Extension angle tie*subtask interaction plot. (Note: The plot presents trends on the actual condition means. The Tukey's
classification of conditions was based on LS mean values.)
29.2, B
55.7, A
26.2, B 27.4, B
0
10
20
30
40
50
60
Looping Subtask Tightening Subtask
Fle
xio
n A
ng
le
Subtask
#9 Wire Tie
Plastic Zip Tie
-82.1, B
-77.5, A
-75.9, A -77.3, A
-90
-88
-86
-84
-82
-80
-78
-76
-74
-72
-70
Looping Subtask Tightening Subtask
Exte
nsi
on
An
gle
Subtask
#9 Wire Tie
Plastic Zip Tie
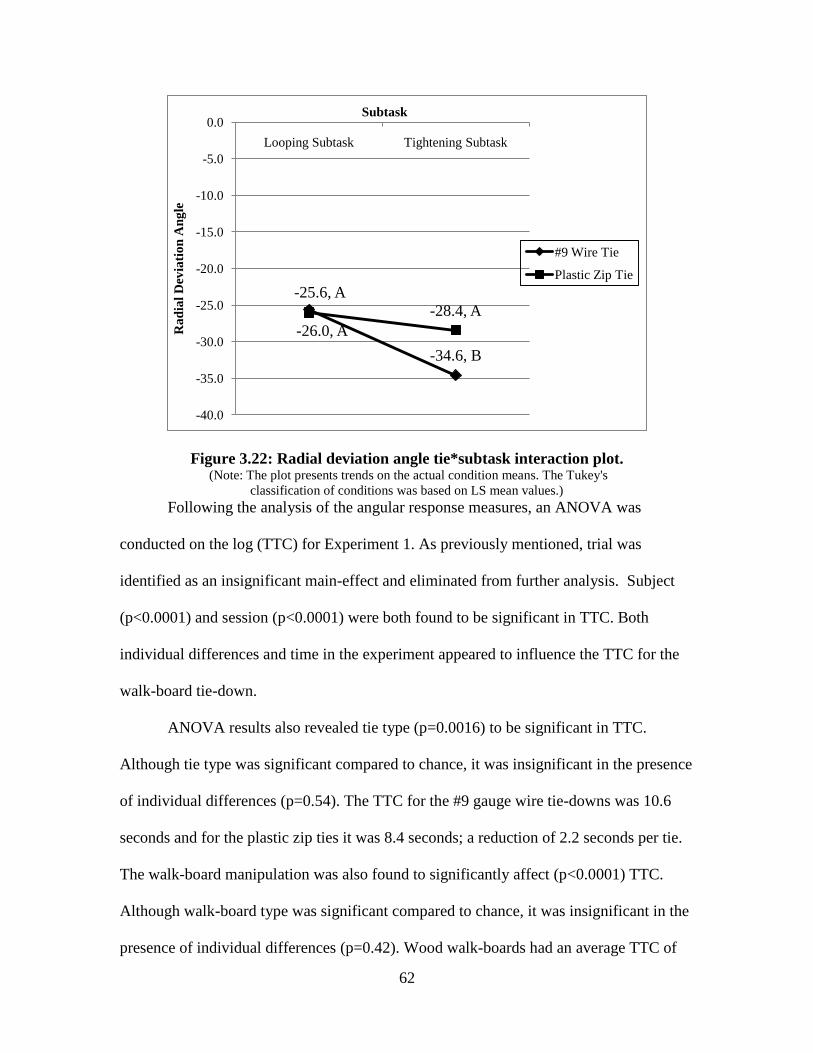
62
Figure 3.22: Radial deviation angle tie*subtask interaction plot. (Note: The plot presents trends on the actual condition means. The Tukey's
classification of conditions was based on LS mean values.)
Following the analysis of the angular response measures, an ANOVA was
conducted on the log (TTC) for Experiment 1. As previously mentioned, trial was
identified as an insignificant main-effect and eliminated from further analysis. Subject
(p<0.0001) and session (p<0.0001) were both found to be significant in TTC. Both
individual differences and time in the experiment appeared to influence the TTC for the
walk-board tie-down.
ANOVA results also revealed tie type (p=0.0016) to be significant in TTC.
Although tie type was significant compared to chance, it was insignificant in the presence
of individual differences (p=0.54). The TTC for the #9 gauge wire tie-downs was 10.6
seconds and for the plastic zip ties it was 8.4 seconds; a reduction of 2.2 seconds per tie.
The walk-board manipulation was also found to significantly affect (p<0.0001) TTC.
Although walk-board type was significant compared to chance, it was insignificant in the
presence of individual differences (p=0.42). Wood walk-boards had an average TTC of
-25.6, A
-34.6, B
-26.0, A
-28.4, A
-40.0
-35.0
-30.0
-25.0
-20.0
-15.0
-10.0
-5.0
0.0
Looping Subtask Tightening Subtask
Ra
dia
l D
evia
tio
n A
ng
le
Subtask
#9 Wire Tie
Plastic Zip Tie

63
9.8 seconds, while metal walk-boards had a TTC of 8.1 seconds. The metal walk-boards
had a shorter TTC due to the reduced distance required to loop the tie-down around the
walk-board.
The level (p=0.0017) at which the participants worked on the tie-downs also had a
significant effect on TTC. Although level was significant compared to chance, it was
insignificant in the presence of individual differences (p=0.54). While working on the
upper level of the scaffold frame, the TTC was 9.0 seconds. The lower level produced a
TTC of 9.8 seconds. It is likely that the awkward posture (kneeling and spinal forward
flexion) and difficult reaches required to tie-down a walk-board at the lower level
accounted for the increase in TTC. Subtask (p<0.0001) was also found to be significant.
Subtask remained marginally significant in effect on TTC in the presence of individual
differences in the response (p=0.052). The looping subtask produced a TTC of 7.0
seconds and the clamping subtask produced a TTC of 11.8 seconds. This was not
surprising as the actions for binding ties were complex and more extensive than looping.
The interaction of tie*walk-board (p<0.0001) was also found to significantly
affect TTC. Figure 3.23 shows the interaction plot. It can be observed that the #9 gauge
wire tie-downs produced a lower TTC for metal walk-boards while plastic zip ties
produced an increased TTC for the metal walk-boards compared to wood. Post-hoc
analysis with Tukey‟s HSD test supported this observation. The #9 gauge wire tie-downs
produced a TTC of 11.9 seconds for wood walk-boards, significantly longer (p<0.05)
than the TTC of 9.3 for the metal walk-boards. Plastic zip ties were found to produce a
TTC of 7.7 seconds for wood walk-boards, significantly shorter (p<0.05) than the TTC of
8.8 seconds for the metal walk-boards. Each tie type was significantly different from the

64
other tie type at each level of walk-board. During the experiment, it was observed that the
plastic zip ties were bound around the wood walk-boards perpendicular to the long axis
of the boards. The zip ties were bound around the metal walk-boards parallel to the long
axis of the boards. Operators found that with some additional effort (and time) they could
bind the zip ties tighter around the ends of the metal boards than the wood and they did
so.
Figure 3.23: TTC tie*walk-board interaction plot. (Note: The plot presents trends on the actual condition means. The Tukey's
classification of conditions was based on LS mean values.)
A walk-board*level (p<0.0001) interaction was also found to be significant in
TTC. Figure 3.24 shows the interaction plot. It can be seen that TTC varied across the
different combinations of walk-board and level. Tukey‟s HSD test revealed that each
combination was statistically significant from one another. Wood walk-boards produced
a significant increase (p<0.05) in TTC from the upper level of the scaffold (9.2 seconds)
to the lower level (10.3 seconds). Metal walk-boards also produced an increase in TTC
11.9, A
9.3, B
7.7, B8.8, A
0.0
2.0
4.0
6.0
8.0
10.0
12.0
14.0
Wood Metal
Av
era
ge
TT
C
Walk-board Type
#9 Wire Tie
Plastic Zip Tie

65
from the upper level (8.9 seconds) to the lower level (9.3 seconds). Each level of walk-
board was significantly different (p<0.05) in TTC.
Figure 3.24: TTC walk-board*level interaction plot. (Note: The plot presents trends on the actual condition means. The Tukey's
classification of conditions was based on LS mean values.)
The tie*subtask (p<0.0001) interaction was found to be significant in effect on
TTC. Figure 3.25 shows the interaction plot. It can be seen that both types of ties
produced differences in TTC across the levels of subtask. Tukey‟s HSD test confirmed
this. The existing #9 gauge wire tie-downs yielded a TTC of 7.0 seconds for the looping
subtask, significantly lower (p<0.05) than the TTC of 14.2 seconds for the clamping
subtask. The plastic tie-downs yielded a TTC of 7.1 seconds for the looping subtask,
significantly lower than the TTC of 9.4 seconds for the clamping subtask. Each tie type
was found to be significantly different from the other (p<0.05) for each level of subtask.
9.2, B
10.3, A
8.9, C
9.3, D
8.0
8.5
9.0
9.5
10.0
10.5
Upper Level Lower Level
Av
era
ge
TT
C
Level
Wood Walk-board
Metal Walk-board

66
Figure 3.25: TTC tie*subtask interaction plot. (Note: The plot presents trends on the actual condition means. The Tukey's
classification of conditions was based on LS mean values.)
The second-order interaction of tie*plank*level (p=0.0066) was also found to be
significant. Table 3.2 presents the results of the post-hoc analysis with Tukey‟s HSD test.
While holding walk-board and level constant, the impact of tie type can be identified. For
wood walk-boards on the upper level, the plastic zip ties were 4.2 seconds quicker
(p<0.05). For metal walk-boards on the upper level, plastic zip ties were 0.3 seconds
faster (p<0.05). When tying down wood walk-boards on the lower lever, the plastic zip
ties were 4.8 seconds quicker (p<0.05). For metal walk boards on the lower level, zip ties
were 0.5 seconds quicker than #9 wire (p<0.05).
7.0, B
14.2, A
7.1, C
9.4, B
0.0
2.0
4.0
6.0
8.0
10.0
12.0
14.0
16.0
Looping Subtask Tightening Subtask
Av
era
ge
TT
C
Subtask
#9 Wire Tie
Plastic Zip Tie
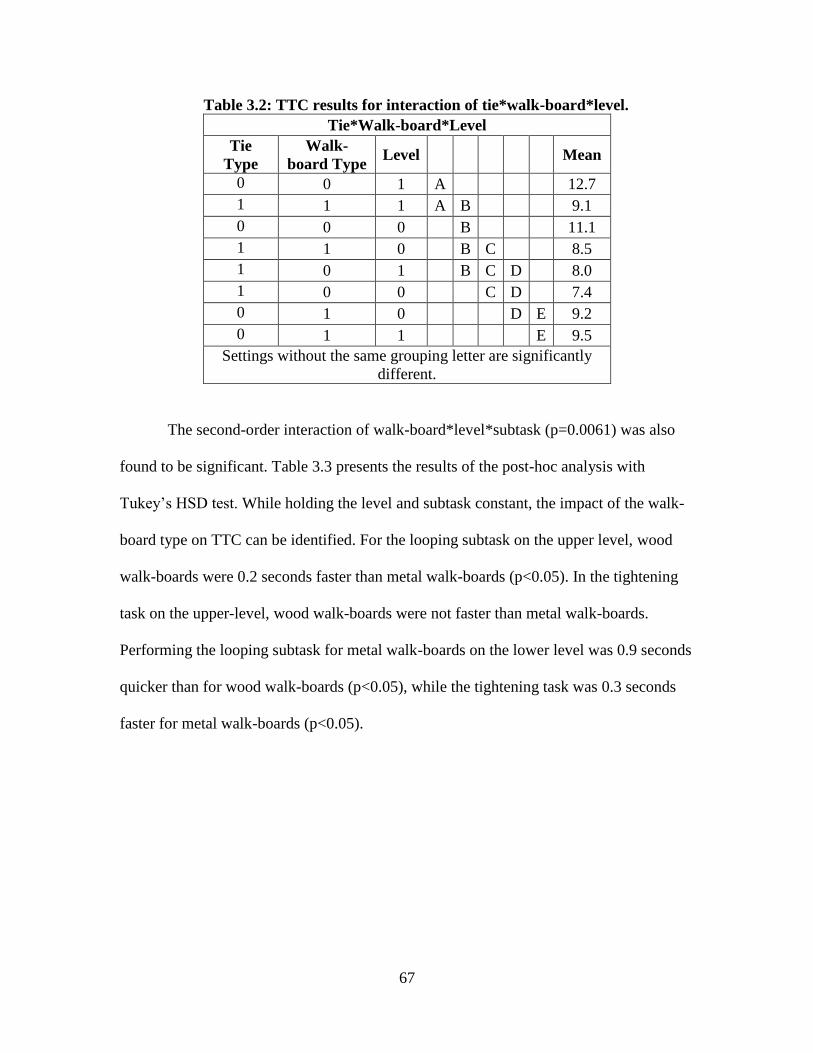
67
Table 3.2: TTC results for interaction of tie*walk-board*level.
Tie*Walk-board*Level
Tie
Type
Walk-
board Type Level Mean
0 0 1 A 12.7
1 1 1 A B 9.1
0 0 0 B 11.1
1 1 0 B C 8.5
1 0 1 B C D 8.0
1 0 0 C D 7.4
0 1 0 D E 9.2
0 1 1 E 9.5
Settings without the same grouping letter are significantly
different.
The second-order interaction of walk-board*level*subtask (p=0.0061) was also
found to be significant. Table 3.3 presents the results of the post-hoc analysis with
Tukey‟s HSD test. While holding the level and subtask constant, the impact of the walk-
board type on TTC can be identified. For the looping subtask on the upper level, wood
walk-boards were 0.2 seconds faster than metal walk-boards (p<0.05). In the tightening
task on the upper-level, wood walk-boards were not faster than metal walk-boards.
Performing the looping subtask for metal walk-boards on the lower level was 0.9 seconds
quicker than for wood walk-boards (p<0.05), while the tightening task was 0.3 seconds
faster for metal walk-boards (p<0.05).

68
Table 3.3: TTC results for interaction of tie*walk-board*level.
Walk-board*Level*Subtask
Walk-board Type Level Subtask Mean
0 1 1 A 12.7
0 0 1 A B 11.5
1 1 1 B 12.0
1 0 1 B 11.0
0 1 0 C 8.0
0 0 0 D 6.9
1 0 0 E 6.7
1 1 0 E 6.5
Settings without the same grouping letter are significantly different.
The final step of the analysis of Experiment 1 was the construction of a
correlation table. Table 3.4 presents the Pearson coefficients for linear associations of the
response measures. It was expected that extension and flexion would be correlated due to
these angles being measured using the same device and from the same zero point. Ulnar
deviation and radial deviation were recorded in a similar manner and were also expected
to be correlated. As for the correlation of the angular response measures with TTC, it was
expected that as the joint angles decreased there would be a corresponding decrease in
TTC. In fact, as the angular displacement decreased for all angular measures, the TTC
also decreased.

69
Table 3.4: Experiment 1 correlation table.
Flexion Extension Ulnar Radial TTC
Flexion Correlation
1
P- value
Extension Correlation 0.2365
1
P- value <.0001**
Ulnar Correlation 0.2904 -0.0859
1
P- value <.0001** 0.0933
Radial Correlation -0.1043 0.2027 0.2669
1
P- value 0.0383* 0.0002** <.0001**
TTC Correlation 0.4754 -0.0861 0.2635 -0.3469
1 P- value <.0001** 0.1505 <.0001** <.0001**
3.2 Experiment 2
The main-effects ANOVA revealed the effect of trial to be insignificant for the
flexion (p=0.5753), extension (p=0.9822), radial deviation (p=0.4013), ulnar deviation
(p=0.7047) and pronation (p=0.0746). On this basis, the trial was dropped from all
statistical analysis. Session was found to be significant for four out of five angular
response measures, including extension (p<0.0001), radial deviation (p<0.0001), ulnar
deviation (p=0.0001) and pronation (p<.0001). Only flexion (p=0.4404) proved to be
insensitive to session. Consequently, session was included in all other statistical analyses.
For the TTC response, trial (p=0.2743) was not significant while session (p=0.0003) was
found significant. Thus, trial was dropped from subsequent models while session was
retained, as in the analysis of the Experiment 1 data set.
Regarding the model residual diagnostics, the plots for testing constant variance
and normality assumptions are included in Appendix D. There were no violations of the
assumptions for any of the angular response measures. However, the TTC appeared to
violate both the constant variance and normality assumptions. There was an over-
prediction of the model at high and low values and an under-prediction near the mean

70
time values. The normal probability (quantile-quantile) plot on the TTC residuals deviate
from the expected linear trend. To correct for these violations, a logarithmic
transformation was applied to the TTC data. The plots for the transformed TTC data can
also be seen in Appendix D. The transformation appeared successful in addressing the
identified assumption violations.
The results of the MANOVA for Experiment 2 are presented in Table 3.5. A total
of five main effects and interactions were found to be significant across all four angular
response measures, including subject (p<0.0001), session (p<0.0001), subtask
(p=0.0189), coupler*subtask (p=0.0423) and activity*subtask (p=0.0076). The remaining
three main effects and interactions were not significant. Although coupler and activity
were not significant, they could not be eliminated from further analysis because they
were included in significant interactions. The only interaction eliminated from the full
factorial model was coupler*activity*subtask.
Table 3.5: MANOVA results for Experiment 2.
Effect F-value P-value
Subject 19.1373 <.0001**
Session 26.1297 <.0001**
Coupler 0.9359 0.4578
Activity 2.0697 0.069
Coupler*Activity 0.020878 0.2642
Subtask 0.0442227 0.0189*
Coupler*Subtask 2.3318 0.0423*
Activity*Subtask 3.2147 0.0076**
Coupler*Activity*Subtask 1.5681 0.1687
* represents p-value <0.05; ** represents p-value
<0.01
Including the significant main-effects and interactions from the MANOVA,
univariate ANOVAs were conducted on each angular response measure. The subject term

71
was found to be significant for flexion (p<0.0001), extension (p<0.0001), ulnar deviation
(p<0.0001), radial deviation (p<0.0001) and pronation (p<0.0001). These results indicate
that there were significant individual differences in the angular response measures.
ANOVA results also revealed that Experiment 2 session was significant for extension
(p<0.0001), radial deviation (p=0.1014), ulnar deviation (p<0.0001) and pronation
(p<0.0001). The only response measure for which it was insignificant was flexion
(p=0.4417). This indicated that joint angle responses varied over the course of the
experiment. The maximum extension, radial deviation and pronation angles decreased
from session-to-session, while the maximum ulnar deviation angle increased across
sessions.
ANOVA results on the coupler type manipulation revealed a marginally
significant effect on ulnar deviation (p=0.0680). However, there was no statistically
significant effect on flexion (p=0.1545), extension (p=0.6498), radial deviation
(p=0.6788) or pronation (p=0.1613). Although marginally significant when compared to
chance, the effect of coupler type on ulnar deviation was insignificant in the presence of
individual differences (p=0.61). All other angular response measures remained
insignificant in the presence of individual differences (p>0.05). The mean ulnar deviation
for the ratcheting coupler was 64.2° and it was 63.2° for the lever couplers. It is possible
that the new coupler was important in reducing the angular response in the clamping
portion of the task.
The coupling activity type was found to be significant in the flexion (p=0.0147)
and extension (p=0.0026) responses. It was not significant for radial (p=0.9598) and ulnar
(p=0.3001) deviations or and pronation (p=0.2492). Although significant when compared

72
to chance, the effect of activity on flexion (p=0.46) and extension (p=0.71) was
insignificant in the presence of individual differences. All other angular response
measures were also insignificant in the presence of individual differences (p>0.05).
Flexion had a mean of 69.1° for the assembly activity and a mean of 68.3° for the
disassembly activity. Extension had mean angles of -72.5° and -70.4° for the assembly
and disassembly activities, respectively.
The subtask was also found to be significant for extension (p=0.0405), radial
deviation (p=0.0304), ulnar deviation (p=0.0038) and pronation (p=0.0130) angles. Only
for flexion (p=0.7612) was subtask not significant. Although significant when compared
to chance, the effect of activity on extension (p=0.80), radial deviation (p=0.60), ulnar
deviation (p=0.42) and pronation (p=0.69) was insignificant in the presence of individual
differences. Flexion remained insignificant in the presence of individual differences
(p>0.05). Extension had a mean of -69.0° for the placement subtasks and a mean of -
73.8° for the clamping subtask. The ulnar deviation angle had a mean of 63.0° for
placement of the coupler and a mean of 64.4° for clamping the coupler. Radial deviation
also showed a smaller angle for placement (-18.3°) than for clamping (-19.9°). Finally,
pronation had a mean of 91.5° for placement and a mean of 96.1° for clamping. All four
angular responses that revealed a significant effect of subtask had a smaller mean for the
placement subtask than for the clamping subtask.
The interaction of coupler type*subtask was significant for flexion angle
(p=0.0003) and radial (p=0.0132) and ulnar (p=0.0002) deviation. Extension (p=0.7759)
and pronation (p=0.8586) showed no significant effect of the interaction. Figure 3.26
shows the interaction plot for flexion. It can be observed that the lever couplers produced

73
a smaller flexion angle for the clamping subtask than the standard scaffolding couplers.
Post-hoc analysis with Tukey‟s HSD supported this observation. The lever couplers had a
mean of 64.7° significantly lower (p<0.05) than the standard scaffolding couplers with a
mean of 70.9°. Both coupler types were not significantly different for the placement
subtask. Figure 3.27 shows the interaction plot of coupler type*subtask for radial
deviation. From the figure it can be observed that the coupler types produced different
angles in the clamping subtask. Post-hoc analysis with Tukey‟s HSD supported this
observation. For clamping, the lever couplers had a mean deviation of -17.7°,
significantly lower than the existing scaffolding couplers with a mean deviation of -22.0°.
Figure 3.28 shows the interaction plot for ulnar deviation. From the figure it can be
observed that the coupler types differed for the clamping subtask. Tukey‟s HSD test
results supported this observation. For clamping, the lever couplers had a deviation of
mean=62.2°, which was significantly lower than the existing scaffolding couplers with a
mean=64.2°.

74
Figure 3.26: Flexion angle coupler*subtask interaction plot. (Note: The plot presents trends on the actual condition means. The Tukey's
classification of conditions was based on LS mean values.)
Figure 3.27: Radial deviation angle coupler*subtask interaction plot. (Note: The plot presents trends on the actual condition means. The Tukey's
classification of conditions was based on LS mean values.)
68.3, A
71.1, A70.9, A
64.7, B
60
62
64
66
68
70
72
Placement Tightening
Fle
xio
n A
ng
le
Subtask
Standard Coupler
Lever Coupler
-18.8, A-B
-22.0, B
-17.9, A-B -17.7, A
-25
-20
-15
-10
-5
0
Placement Tightening
Ra
dia
l D
evia
tio
n A
ng
le
Subtask
Standard Coupler
Lever Coupler

75
Figure 3.28: Ulnar deviation angle coupler*subtask interaction plot. (Note: The plot presents trends on the actual condition means. The Tukey's
classification of conditions was based on LS mean values.)
The interaction of activity*subtask was also found to be significant for flexion
(p=0.0049) and extension (p=0.0429). It was not significant for radial (p=0.8442) and
ulnar (p=0.7477) deviation, or pronation (p=0.2124). Figure 3.29 shows the interaction
plot of activity*subtask for flexion. Tukey‟s HSD tests revealed that there was a
significant difference (p<0.05) among flexion angles between the coupler removal
subtask (mean=67.4°) and the unclamping subtask (mean=69.2°) during the disassembly
activity. Figure 3.30 presents the interaction plot for extension. From the figure, it can be
observed that there was a difference in angles among activity type for coupler
placement/removal. Tukey‟s HSD test results supported this observation. The assembly
activity produced extension with mean of -71.0°, significantly higher (p<0.05) than the
extension in the disassembly activity with mean of -67.1° across coupler removal.
62.9, B
66.6, A
64.2, A-B
62.2, B
60
61
62
63
64
65
66
67
Placement Tightening
Uln
ar
Dev
iati
on
An
gle
Subtask
Standard Coupler
Lever Coupler

76
Figure 3.29: Flexion angle activity*subtask interaction plot. (Note: The plot presents trends on the actual condition means. The Tukey's
classification of conditions was based on LS mean values.)
Figure 3.30: Extension angle activity*subtask interaction plot. (Note: The plot presents trends on the actual condition means. The Tukey's
classification of conditions was based on LS mean values.)
71.7, A-B
66.6, A-B67.4, B
69.2, A
64
65
66
67
68
69
70
71
72
73
Placement Tightening
Fle
xio
n A
ngl
e
Subtask
Assembly
Disassembly
-71.0, B
-73.9, B
-67.1, A
-73.7, B
-76
-74
-72
-70
-68
-66
-64
-62
Placement Tightening
Exte
nsi
on
An
gle
Subtask
Assembly
Disassembly

77
Following the analysis of the angular response measures, an ANOVA was
conducted on the log (TTC) response for Experiment 2. As previously mentioned, trial
was identified as an insignificant main-effect and eliminated from further analysis.
Subject (p<0.0001) and session (p=0.0001) were both found to be significant in TTC.
Both individual differences and time in the experiment appeared to influence the TTC for
the frame coupling.
ANOVA results revealed the coupler type to have a significant effect on TTC
(p<.0001). Although coupler was significant compared to chance, it was insignificant in
effect on TTC in the presence of individual differences (p=0.20). The mean TTC for the
existing couplers was 11.0 seconds and for the lever couplers it was 12.5 seconds. The
higher mean time with the lever couplers was likely due to less operator familiarity with
the equipment. Activity was also found to be significant in TTC (p<0.0001). Activity was
significant compared to chance and remained significant in effect on TTC in the presence
of individual differences (p<0.001). The assembly activity had a mean of 15.5 seconds
while the disassembly activity had a mean of 8.0 seconds. This was primarily due to the
need to ensure proper tightness of the coupler while assembling. Subtask was also found
to be significant in TTC (p<0.0001). Subtask was significant compared to chance and
remained marginally significant in effect on TTC in the presence of individual
differences (p=0.07). Subtask 0 (placement/removal) had a mean of 12.8 seconds and
Subtask 1 (clamping/unclamping) had a mean of 10.7 seconds.
The interaction of activity*subtask was also significant for TTC (p<0.0001).
Figure 3.31 presents the interaction plot. It can be observed that the assembly activity had
a shorter TTC for Subtask 0 than for Subtask 1, while the disassembly activity had a

78
longer TTC for Subtask 0 than for Subtask 1. Tukey‟s HSD test results supported these
observations. All levels of the interaction were significantly different (p<0.05) from one
another. The assembly activity produced a mean of 17.6 seconds for Subtask 0 and mean
of 13.4 seconds for Subtask 1. The disassembly activity has a mean of 8.0 seconds for
Subtask 0 and a mean of 8.1 seconds for Subtask 1.
Figure 3.31: TTC activity*subtask interaction plot. (Note: The plot presents trends on the actual condition means. The Tukey's
classification of conditions was based on LS mean values.)
The second-order interaction of coupler type*activity*subtask was also found to
be significant for TTC (p=0.009). Table 3.6 presents the results of the post-hoc analysis
using Tukey‟s HSD test for all levels of the interaction. When holding activity and
subtask constant, the impact of coupler type can be examined. While performing the
placement subtask during assembly, the lever couplers were 4.8 seconds slower than the
existing couplers (p<0.05). In the clamping subtask, performed during assembly, the
lever couplers were 1.9 seconds slower (p<0.05). During the disassembly activity, the
17.6, A
13.4, B
8.0, D 8.1, C
0
2
4
6
8
10
12
14
16
18
20
Placement Tightening
Av
era
ge
TT
C
Subtask
Assembly
Disassembly

79
existing couplers were 1.8 seconds faster the removal subtask (p<0.05). There were no
significant differences in clamping subtask performance between the two coupler types.
Table 3.6: TTC results for interaction of coupler*activity*subtask.
Coupler*Activity*Subtask
Coupler
Type Activity Subtask Mean
1 0 0 A 19.5
0 0 0 B 15.7
1 0 1 B 14.4
0 0 1 C 12.3
1 1 0 D 7.3
0 1 1 D 8.7
1 1 1 D E 7.5
0 1 0 E 6.8
Settings without the same grouping letter are significantly different.
The final step of the analysis of Experiment 2 was the construction of a
correlation table. Table 3.7 presents the correlation table. It was expected that extension
and flexion to would be correlated due to the angles being measured with the same device
and from the same zero point. Ulnar deviation and radial deviation were recorded in a
similar manner and were expected to be correlated. As for the correlation of the angular
response measures with TTC, it was expected that as the angular displacement at the
wrist decreased, the TTC would also decrease. This proved to be the case for the
extension, radial deviation and pronation measures. However, ulnar deviation in the
frame coupling task was only marginally associated with TTC and flexion angle was not
explanatory of the task time.

80
Table 3.7: Experiment 2 correlation table.
Flexion Extension Radial Ulnar Pronation TTC
Flexion Correlation
1
P- value
Extension Correlation 0.2284
1
P- value <.0001**
Radial Correlation -0.1259 0.3646
1
P- value 0.0151* <.0001**
Ulnar Correlation -0.0066 0.0378 0.337
1
P- value 0.8423 0.4432 <.0001**
Pronation Correlation -0.0341 -0.0497 -0.1945 0.0209
1
P- value 0.4848 0.3916 0.0002** 0.5624
TTC Correlation 0.037 -0.2687 -0.1465 0.092 0.1179
1 P- value 0.5259 <.0001** 0.0289* 0.0555 0.031*
81
4 Discussion
4.1 Experiment 1
There were two hypotheses tested through the tie-down experiment. The first
hypothesis was that the maximum flexion, extension, radial deviation, and ulnar deviation
angles would all be reduced when using the plastic zip ties. The second hypothesis was
that the plastic zip ties would produce shorter TTCs than the standard #9 gauge wire in
securing walk-boards. For the first hypothesis the results on each joint angle are
discussed separately. For the second hypothesis, the TTC results are discussed for each
significant effect.
With respect to the maximum flexion angle, both the main effect of tie type and
the interaction of tie type*subtask accounted for significant variability in the response.
The existing #9 gauge wire tie-downs produced an average maximum angle of 42.8° of
flexion while the plastic zip ties produced an average maximum angle of 26.8°. This
amounts to a 37% reduction in maximum flexion angle. This difference in flexion angle
was attributed to differences in the way the tie types are used on the scaffold. The cause
of the difference became more apparent when the interaction of tie*subtask was
examined. Figure 3.20 revealed a difference in maximum flexion angle between tie types
for the tightening subtask but not the looping subtask. With regard to flexion, Subtask 0
was performed the same way for both types of ties; both ties were looped around the
walk-board using the same amount of flexion. In the tightening subtask, the plastic zip
ties produced an average maximum angle of 27.4° while the #9 gauge wire tie-downs
produced an average maximum angle of 55.7°. For the #9 gauge wire tie-downs, the
tightening subtask required the use of pliers and wrist rotation. The plastic zip ties only

82
required one end to be threaded and then pulled. This difference in the way that the
looping subtask is performed led to the difference in the maximum flexion angles when
using different tie types. The wire tie-downs also showed a large difference between the
looping subtask and the tightening subtask indicating that the wrist had a larger variation
in flexion angle during the course of the tie-down. Because the plastic zip ties did not
produce a significant difference between the two subtasks, the wrist was kept in a more
neutral position or moved through a smaller range of postures throughout the tie-down
task. Because tie type was involved in any other significant interactions, it can be
concluded that the improvement in flexion angle was due to the differences in the
subtask. The elimination of the use of pliers and the wrist rotation reduced the average
maximum flexion observed while performing the tie-down task.
The next angular response measure examined was the wrist extension angle. The
maximum extension angle was found to be significantly different for the main effect of
tie type and the interaction of tie*subtask. For the #9 gauge wire tie-downs, the average
maximum extension angle was -79.7° while the plastic zip ties had an average maximum
angle of -76.6°. The use of the plastic zip ties decreased the maximum extension angle by
4%. This finding led to examination of the interaction of tie type and subtask. Figure 3.21
showed a difference in extension angle across the two tie types for the looping subtask
but not for the tightening subtask. Tukey‟s HSD test showed that there was a significant
difference between the maximum extension angles for each tie type within the looping
subtask. Plastic zip ties had a maximum flexion angle of -75.9° and #9 gauge wire ties
had a maximum flexion angle of -82.1° for the looping subtask, a difference of 6.2°. The
difference for Subtask 0 indicated that the looping the tie-down around the walk-board

83
(regardless of the type of walk-board) required a larger amount of extension when using a
#9 gauge wire tie-down. By using a more flexible tie-down material, the plastic zip tie,
less extension was required to place the tie-down around the walk-board. The plastic zip
ties naturally bend around the walk-board reducing the amount of reach required to
secure them. Additionally, the flexible ties require less force and, therefore, less
extension to wrap around the walk-board. For the #9 gauge wire, it is common for
scaffolders to use their hands or a tool to press the wire loop down to the surface of a
walk-board. The lack of difference for the tightening subtask indicated that the tightening
task required the same amount of extension for both tie types. The tightening method
used for the plastic tie required wrist extension when pulling the tie. The wire ties
required extension while using the pliers. The plastic zip tie did not produce significantly
different angles between subtasks while the wire tie-downs did. This indicates that the
wire tie-downs produced a larger amount of variation in the wrist posture during tie down
than the plastic zip ties. Because tie type was not involved in any other significant
interactions, it can be concluded that the decrease in extension angle was mediated by
differences in subtask. The use of a more flexible tie allowed for elimination of some
wrist rotation in looping and use of pliers used in tightening leading to a reduction in the
average maximum extension observed while performing the tie-down task.
Tie type was the only independent variable found to have a statistically significant
effect on ulnar deviation angle. The average maximum ulnar deviation angle for the #9
gauge wire tie-downs was 49.3°. The plastic zip ties had an average maximum ulnar
deviation of 40.8°. By using the plastic zip ties a 17.0% reduction in maximum ulnar
deviation angle was achieved. Tie type was not involved in any interactions influencing

84
ulnar deviation; therefore, the reduction in deviation occurred for any application of the
plastic zip ties. The reduction in ulnar deviation was due to the flexible plastic zip ties
requiring less wrist movement in looping around the walk-board. Often while reaching to
grab the end of a wire tie, participants used ulnar deviation to extend their reach. Second,
once looped around the walk-board, wire tie-downs require the two ends to be overlapped
by hand in order for tightening to occur. The participant, having a grasp on each end of a
tie, would cross the two ends and twist them together to start tightening. Finally, the
plastic tie-downs, although they still require wrist motions in tightening, eliminate much
of the ulnar deviation required in use of pliers with wire tie-downs. It can be concluded
that the use of plastic zip ties reduces the maximum ulnar deviation required to secure a
walk-board to a scaffolding frame.
The final angular response to be examined was radial deviation. The interaction of
tie*subtask was significant in the maximum radial deviation angle. Figure 3.22 revealed
little difference between tie types for the looping subtask, but there appeared to be some
difference for the tightening subtask. For the tightening subtask, wire ties had a
maximum radial deviation angle of -34.6° and plastic zip ties had a maximum angle of -
28.4°. The tightening of the wire tie-downs required more radial deviation due to the
rotation of the pliers. For walk-boards below the shoulders, scaffolders positioned their
hands to hold pliers using radial deviation. By eliminating the use of the pliers, there was
a reduction in radial deviation. The use of plastic zip ties alone was not significant in
general; that is, across subtasks and walk-board types. When the different tie types were
paired with the different subtasks, plastic zip ties served to reduce the maximum radial
deviation angle.

85
In conclusion, the use of plastic zip ties had a positive effect for all four angular
response measures. A 37% reduction in maximum flexion angle was achieved with a 4%
decrease in maximum extension angle. The maximum ulnar deviation angle was reduced
by 17.0%. While there was no reduction of radial deviation due to tie type, there was a
reduction seen in the interaction of tie*subtask.
The second hypothesis for Experiment 1 was that the plastic zip ties will produce
a shorter TTC than the currently used #9 gauge wire tie-downs. A simple comparison of
the mean TTC for types indicated the plastic ties did reduce the time compared with the
#9 gauge wire tie-downs. The existing tie-downs required an average of 9.5 seconds to
complete the task while the plastic zip ties required an average 7.9 seconds. This
represents an improvement of 16.8%. While these results suggest that the plastic zip ties
are quicker than the #9 gauge wire tie-downs, the reason for the reduction in time can be
found in the interaction of tie type with walk-board.
A visual inspection of the interaction plot on the tie*walk-board effect (Figure
3.23) revealed a substantial difference between tie types for each type of walk-board. For
wood boards, plastic zip ties were 4.2 seconds faster than the #9 gauge wire ties while for
metal boards, plastic zip ties were only 0.5 seconds quicker. A substantial difference was
also seen for each tie type across the levels of walk-board. Plastic zip ties took 1.1
seconds longer for metal boards than for wood boards while wire ties were 2.6 seconds
quicker. The decrease in time for the wire ties was not surprising. Metal walk-boards
required a smaller amount of looping and consequently shorter tightening times. The
increase in TTC for metal walk-boards was not expected for plastic zip ties. Further
examination revealed that the increase in time was due to the width of the plastic zip ties.

86
Because the area of the walk-board in which the tie was placed was very close in size to
the plastic zip ties, they occasionally became stuck. This meant that participants had to
take additional time to loosen the plastic zip ties, leading to a corresponding increase in
TTC.
The second significant interaction for TTC was that of tie by subtask. Figure 3.25
revealed that the tightening subtask produced longer TTCs than the looping subtask. Wire
ties had a TTC of 7.0 seconds for looping and a TTC of 14.2 seconds for tightening.
Plastic zip ties had TTCs of 7.1 seconds and 9.4 seconds, respectively, for looping and
tightening. For each tie type, a significant difference was found between subtasks. This
was a surprising result as looping was performed in nearly the same manner for both tie
types. It is possible that this difference was due to a lack of operator familiarity with the
plastic zip ties. For the tightening subtask, wire ties took 4.8 seconds longer than the
plastic zip ties. The plastic zip ties are tightened using only a pulling motion, providing
economy in arm motion. Wire ties require additional motions such as the grasping of the
tie with pliers, twisting the wire tie to tighten, and the turning up of the ends to prevent
poking. The plastic zip ties require fewer actions and therefore a shorter TTC.
The final interaction for TTC was the second-order interaction of tie type, walk-
board type, and level. Tie type was a significant simple effect for each combination of
walk-board type and level. In all cases plastic zip ties were quicker than wire ties. For
wooden walk-boards on the upper level, plastic ties were 3.7 seconds quicker. For
wooden walk-boards on the lower level, plastic ties were 4.7 seconds quicker. For metal
walk-boards on the upper level, plastic ties were 0.7 seconds quicker. For metal walk-
boards on the lower level, plastic ties were 0.4 seconds quicker. This interaction

87
confirmed that the plastic zip tie produced a shorter TTC while holding the level of walk-
board and level constant.
In conclusion, the empirical data supported the hypothesis that the plastic zip ties
are quicker to use than the existing #9 gauge wire. An overall improvement of 1.6
seconds can be achieved by replacing the existing #9 gauge wire tie-downs with plastic
zip ties in securing a single walk-board.
4.2 Experiment 2
There were two hypotheses tested for the coupler experiment. The first hypothesis
was that the maximum flexion, extension, radial deviation, and ulnar deviation angles, as
well as the forearm pronation angle, would be reduced using the lever couplers. The
second hypothesis was that the lever couplers would reduce the average TTC as
compared to the standard scaffold couplers. For the first hypothesis, the results on each
joint angle ware discussed separately. For the second hypothesis, the TTC results are
discussed for each significant effect.
Surprisingly, coupler type, as a main effect, was not found to be statistically
significant for any of the response measures. However, the coupler*subtask interaction
was highly significant for the joint angle measures, indicated that subtask type mediated
the influence of the coupler on motion behavior.
With respect to maximum flexion angle, Figure 3.26 revealed a slight difference
between coupler types for the coupler placement/removal subtask. For the clamping
subtask, there appeared to be a larger difference between coupler types. In
placement/removal, the lever couplers had a maximum flexion angle of 64.7° while the
standard scaffolding couplers had a flexion angle of 71.1°, a difference of 6.4°. The lack

88
of difference for the placement/removal subtask was expected. In the coupler placement
or removal task, because the base design for both types of coupler was similar, the task
was performed in a similar manner. The clamping subtask is where a difference was
expected due to the different tightening techniques for each type of coupler. The existing
scaffolding couplers required a bolt to be seated on the upper portion of the coupler. Once
seated, a nut was ratcheted until tight. The ratcheting action forced the upper arm onto the
tube, thus securing it. The ratcheting action was where the maximum wrist flexion angle
occurred. While sweeping the ratchet back and forth, the hand and wrist are placed in a
flexed position. The lever couplers are tightened by simply forcing a lever down. When
the lever is pressed it pulls the upper arm tight with the base by way of a catch and hook
mechanism. The tightening of the lever coupler required a smaller range of motion
compared to the standard couplers resulting in the significant decrease in maximum
flexion angle for this subtask. Because the lever couplers reduced the maximum flexion
for the clamping subtask and did not increase the maximum flexion for
placement/removal, they were considered an improvement over the ratcheting coupler.
For extension, neither the main effect of coupler type nor the interaction of
coupler type and subtask were statistically significant. When examining the other effects,
subtask was significant. These results indicate the lever coupler alone had no effect on
the maximum extension angle while performing the various subtasks. It was expected
that the elimination of the ratcheting motion would lead to a decrease in the maximum
extension angle. The ratcheting motion used in tightening the existing couplers required
substantial extension and flexion of the wrist. The postures required to force the lever
couplers to tighten, however, required a similar degree of extension. This resulted in the

89
significant difference between subtasks (placement vs. clamping), but not for the
interaction of subtask and coupler type. While the lever couplers did not provide a
reduction in maximum extension angle they also do not cause an increase.
The maximum radial deviation angle revealed a significant interaction of coupler
type and subtask. Figure 3.27 showed that there was little difference between the coupler
types for the placement/removal subtask while there was a substantial difference for
clamping. The existing scaffold couplers had a radial deviation of –22.0° and the lever
couplers had a maximum deviation of -17.7°. This is a 19.5% decrease in the maximum
radial deviation angle. The lack of a statistically significant difference for
placement/removal was expected. As previously mentioned, this subtask was performed
in a nearly identical fashion for both types of coupler. Because the clamping subtask
involved different tightening techniques for each coupler type, a statistically significant
difference was expected. When using ratcheting to tighten the existing couplers the wrist
experienced significant radial deviation, especially when first beginning to tighten.
Because the nut was not tight and facing little resistance a looser grip is used on the
ratchet. This loose grip leads to additional wrist movement while performing the
repetition required to tighten the coupler. The clamping mechanism of the lever couplers
eliminated the repetition inherent in the ratcheting task, thus reducing the maximum
radial deviation angle experienced during the clamping subtask. Because the lever
coupler reduced the maximum radial deviation angle in clamping and did not increase the
maximum wrist flexion angle in placement/removal, it was considered to be a preferable
alternative.

90
The interaction of coupler type and subtask was the only significant effect on
maximum ulnar deviation. Figure 3.28 indicated a slight difference between coupler
types for each level of subtask. For clamping, the maximum ulnar deviation was 66.6° for
the existing couplers and 62.2° for the lever-based couplers. The difference of 4.4°
amounts to a reduction in ulnar deviation of 6.7%. Just as for the radial deviation, the
difference in the way the clamping subtask was performed account for this difference.
The lever coupler required less ulnar deviation in clamping. Since only one motion was
needed to force the lever into position, less deviation was required. For the existing
couplers, the repeated ratcheting motion caused the ulnar deviation. The grasping and
rotating of the ratchet put the wrist into deviated posture positions. The reduction in
maximum ulnar deviation for the clamping subtask was another reason to consider the
lever couplers as a preferable alternative over the existing scaffolding couplers.
For the pronation of the forearm, there was no significant effect for either coupler
type or the interaction of coupler type by subtask. However, the main effect of subtask
was present in pronation, indicating that the placement/removal subtask was significantly
different than the clamping subtask. For flexion, radial deviation, and ulnar deviation the
subtask was significant when crossed with the coupler type. For pronation, the coupler
type had no effect on the performance of either subtask. The ratcheting motion in the
clamping task has been identified as a key component in several of the angular response
measures. This was also true for pronation. When swinging the ratchet to tighten the
existing couplers, the forearm is pronated at the extents of the swing. Elimination of the
ratcheting task was expected to alleviate some of the pronation. However, due to the
curved shape of the upper portion of the lever coupler, the forearm is still pronated when

91
clamping. When the lever coupler is fully tightened and the hand is still on the lever, the
curvature of the coupler causes the hand to rotate and the forearm to experience
pronation. This pronation was equivalent to the pronation caused by the ratcheting in the
existing couplers. While the lever couplers did not provide a statistical reduction in
maximum pronation angle they also did not cause an increase.
In conclusion, the use of the lever couplers had a positive effect on three of five
joint angle response measures. While tightening the couplers, a 4% decrease in maximum
flexion was achieved while there was no effect on the maximum extension angle. A
16.5% decrease in the maximum radial deviation angle and a 7% decrease in the
maximum ulnar deviation angle were found while using the lever couplers to perform
clamping. Finally, the use of the lever couplers had no effect on forearm pronation. With
these results, it was concluded that the lever couplers are beneficial for tube frame
coupling when compared to the standard scaffolding couplers.
The second hypothesis for Experiment 2 was that the lever couplers would
produce a quicker average TTC than the standard scaffold couplers. A simple comparison
of the mean TTCs for the task revealed the existing couplers to take 10.0 seconds and the
lever couplers to take 11.2 seconds. The lever couplers took approximately 12% longer to
clamp frame tubes. It is possible that operator unfamiliarity with the lever couplers
caused this increase. In Experiment 1, the plastic zip ties required a method of application
very close to that used with the #9 gauge wire ties. The lever couplers, however, required
a very different procedure than the standard scaffolding couplers in clamping to frames.
The replacement of the ratcheting motion with the lever action caused additional time to
be taken. Given additional practice with the lever couplers it is believed that the TTC

92
could be reduced below the TTC for the standard couplers. Another cause for the increase
in TTC was the use of locking pins as part of the lever coupler. The locking pins were
very small and difficult to manipulate in the hand while the participants were wearing
work gloves. An alternate locking mechanism might work better with gloved hands and
serve to further reduce the TTC.
The interaction of coupler type, activity and subtask was significant in effect on
TTC. While holding the activity type and subtask constant, the impact of coupler type can
be assessed. For the assembly activity and the placement/removal subtask, the lever
couplers were found to increase the TTC by 3.8 seconds. Similarly for the assembly
activity and the clamping subtask, the lever couplers took 2.1 seconds longer. While
performing placement/removal during the disassembly activity the lever couplers
increased TTC by 1.3 seconds. The only combination in which the lever coupler did not
increase TTC was for the disassembly task while performing the clamping subtask. This
subtask, performed during the disassembly activity, did not differ between coupler types
in terms of TTC. This is because the impact of the locking pin was not observed. When
placing the locking pin, it was inserted into a small hole in the upper swing-arm of a
coupler and the lever handle. Since the scaffolders were required to wear gloves during
the study, this added time to the task. Gloved hands did not hinder the removal of the pin.
Thus, there was no difference between coupler types for the clamping subtask during
disassembly. These results confirm the observation that fact that in most aspects of the
coupling task, the lever couplers caused an increase in TTC.
In conclusion, the empirical data supports the standard scaffolding couplers as
being quicker to use than the lever couplers. An overall increase of 1.2 seconds was seen

93
when replacing the standard couplers with lever couplers. It is believed that additional
training would decrease the TTC associated with the lever couplers to levels possibly
lower than that for the standard couplers.
4.3 Discussion of Individual Differences
For all response measures in both experiments, subject was found to be a
significant effect. These individual differences stem from a number of sources. As
previously mentioned, the participants ranged in age from 33 to 60. It is known that as the
body ages, range of motion tends to decrease (Tayyari & Smith, 1997, p. 218).
Associated with an age-related loss of flexibility is reduction in overall strength. In this
study, the oldest participants had the lowest strength measurements, which might have
contributed to the hand posture positions assumed during the test tasks. However, it was
also found that the oldest participants had the most experience they were observed to
perform the tasks the most efficiently. They possessed an economy of motion which
allowed them to proficiently complete the tasks even with a potentially diminished range
of motion and strength. The combination of a wide range of ages, experience levels and
strength capacities led to the significant individual differences found during the study.
Because the participants met the power utility‟s qualification requirements for
scaffolders, the sample population was considered to be representative of the entire
scaffold worker population.

94
5 Conclusion
5.1 Overall Recommendations
The objectives of this research were to: (1) conceptualize ergonomic interventions
to reduce the potential for worker strain and sprain injuries in scaffolding operations,
particularly in tube frame coupling and walk-board tie-down to frames; and (2) conduct
experiments to empirically evaluate the impact of the proposed interventions on worker
postures positions and TTC (time-to-task completion). For the tie-down of scaffolding
walk-boards, a plastic zip tie was recommended and compared with #9 gauge wire tie-
downs. The ergonomic issues associated with wire tie-down use included extreme wrist
posture positions. For the placement of scaffolding couplers, a new lever-based coupler
was designed. The proposed coupler eliminated the ratcheting motion required by
existing couplers. To test these interventions, two high fidelity experiments were
designed.
Experiment 1 examined the differences in angular response measures and TTC for
the plastic tie-downs. All four angular response measures and the TTC were positively
affected (reduced) by the use of the plastic zip ties. The maximum flexion angle was
reduced by 37% while using the plastic zip ties. The maximum extension angle was
decreased by 4.0%. A 17.0% reduction was observed in maximum ulnar deviation angle.
While there was no reduction in radial deviation solely due to the plastic zip ties, a
decrease was seen when using the zip ties in tightening walk-boards to a scaffolding
frame. An overall improvement TTC of 1.6 seconds was achieved by replacing the
existing #9 gauge wire tie-downs with plastic zip ties. These benefits lead to the

95
recommendation that the plastic zip ties replace the #9 gauge wire for tie-downs at the
power utility NPPs.
Experiment 2 examined the impact of the lever couplers on angular response
measures and time to task completion. While the coupler type by itself was not
significant in the various joint angle measures, there was a significant interaction of
coupler with subtask. For the tightening subtask, a 9.0% decrease in maximum flexion
was achieved while there was no effect on the maximum extension angle. A 19.5%
decrease in the maximum radial deviation angle and a 6.6% decrease in the maximum
ulnar deviation angle were found while using the lever couplers to perform the clamping
subtask. Finally, the use of the lever couplers had no effect on forearm pronation. While
there was a positive impact of the coupler on several angular response measures in
specific subtasks, the lever coupler was found to increase the TTC by approximately
12%. Although an increase in TTC was observed, this was likely due to operator
familiarity with the use of the existing couplers and less familiarity with the new
technology. Based on the improvement in the angular response measures, the lever
couplers are recommended as a viable alternative to the standard scaffolding couplers
from an ergonomics perspective and may require further examination from a task
efficiency perspective. In addition, strength testing of the new clamping mechanism of
the lever couplers is required before field use. Because this was a study of the ergonomic
impact of the lever coupler, no strength comparison was made between the bolt and nut
mechanism of the existing couplers and the “ski boot” type clamping mechanism of the
lever coupler.

96
5.2 Limitations
There were a number of limitations of this study due to the facility in which it was
conducted. Because the study was conducted in a training room at a NPP, there was
limited room for mock-up of the scaffolding frames used at the NPP. Both frames used in
the study were of a smaller scale than full size frames used in actual operations. As a
result, the locations where the test tasks were conducted may not have been the same as
where work normally occurs during operations. In a NPP, tasks often take place at
varying heights, including over the heads of scaffolders. During the present study, work
never occurred above chest height. Additionally, work occurred at consistent heights
throughout the experiment. It is possible that other more extreme, posture positions occur
in the workplace as a result of different scaffold frame configurations. Therefore, caution
should be taken when applying the results of this study to other scaffolding situations.
Another limitation of the study caused by the NPP training facility was the work
environment. The environment for the study was temperature and humidity controlled.
Often the temperatures experienced by scaffolders in a NPP can exceed 120°F. The
proximity to the reactors and the power generation facilities combined with the lack of air
conditioning can lead to high heat stress working conditions (Sanders & McCormick,
1993). The temperature at the training facility was maintained in the lower 70s° F with
low humidity. It is possible that the lack of extreme environmental conditions normally
faced at the NPP decreased the sensitivity of operators to the potential impacts of the
ergonomic interventions. If the study was conducted under extreme temperature
conditions, physiological responses could potentially lead to fatigue in the participants
97
contributing to awkward postures. The zip ties and new couplers might have significantly
accounted for such problems over the #9 gauge wire and existing couplers
A third limitation of this study was the design of the experiments. Over the course
of the experiments, the scaffolders were never exposed to extended periods of work. The
average trial length never exceeded 5 minutes of continuous work. While normally
working at the NPP, scaffolders will work for extended lengths of time between breaks
(2-4 hours, depending on the environment). During the study, between every trial, there
was a rest period. These frequent rest periods reduced the fatigue levels of the
participants and served to ensure consistent results across all four trials during a block.
However, this is not representative of conditions normally faced by the scaffolders,
including fatigue occurring throughout the workday. The effect of fatigue over the course
of a shift and its relationship to harmful postures would be an intriguing continuation of
this study.
Another limitation due to the design of the experiments was the range of tasks
examined in test trials. The walk-board tie-down and tube frame coupling may be
representative of some portions of NPP scaffolding operations, but they do not cover the
entire range. Any continuation of this line of research should include examination of
activities or tasks as part of scaffolding operations.
A final limitation of this study was the selection of the measurement equipment.
First, the electro-goniometers caused some restriction to the normal range of worker
motion. While participants had nearly the full range of motion at the arm with the
mounted equipment, they suffered from a reduced range of travel from the encoder. The
need for the electro-goniometers to be tethered necessitated the use of only one end of the

98
scaffolding frames. Finally, the measurement equipment was only mounted on one arm.
While the test tasks primarily involved a participant‟s dominant hand, there were some
tasks that still required the opposite hand. Any further study should measure posture
positions of both arms.
5.3 Future Research
Further research conducted on scaffolding at NPPs should address the
aforementioned limitations. The most practical way to address these issues would be to
conduct a field study of both the existing equipment and the proposed interventions. By
conducting a field study, data could be gathered on a wider range of work positions while
scaffolders experience actual environmental conditions. By removing the constraints of
the experimental design, fatigue could be also examined along with any impact on body
postures. One drawback of this approach would be less experimental control in isolating
the effects of the tie-down and coupling interventions on worker postures and task time.
A second line of future research would be the addition of alternative response
measures to the study. Repetition has been mentioned as an ergonomic concern in
scaffolding operations. By analyzing the number of repetitions in tie twisting, coupler
ratcheting, etc., the impact of the interventions could be further quantified. Another
response measure to add in future research would be grip force. The current coupling task
is known to require excessive grip force and the current tie-down task is suspected of
requiring potentially harmful forces to be generated by the scaffolder. By integrating
force sensors, force requirement differences could be quantified between the existing
equipment and the proposed interventions.

99
Finally, the Ergonomics Lab at NC State is currently conducting another line of
research on analysis of forearm muscle activity, EMG (electromyography) responses, in
scaffolder assembly of tube and coupler frames. EMG data was also collected on
scaffolders participating in the study described in this thesis. The EMG research will
examine the impact of the zip tie and lever coupler interventions on muscle activity, as
well as the role of muscle fatigue in material handling tasks on scaffold tube coupling and
walk-board tie-down tasks.

100
References
Chaffin, D. B., Herrin, G. D., & Keyserling, W. M. (1978). Preemployment strength
testing. Journal of Occupational Medicine , 20, 403-408.
Cutlip, R., Hsiao, H., Garcia, R., Becker, E., & Mayeux, B. (2000). A comparison of
different postures for scaffold end-frame disassembly. Applied Egonomics , 507-513.
Duke Energy. (2006). Scaffold Manual.
Elders, L. A., & Burdorf, A. (2001). Interrelations of risk factors and low back pain in
scaffolders. Occupational and Environmental Medicine , 597-603.
Elders, L. A., & Burdorf, A. (2004). Prevalence, Incidence, and Recurrence of Low Back
Pain in Scaffolders During a 3-Year Follow-up Study. Spine , 101-106.
Hansson, G. A., Balogh, I., Ohlsson, K., Rylander, L., & Skerfving, S. (1996).
Goniometer measurement and computer analysis of wrist angles and movements
applied to occupational repetitive work. Journal of Electromyography and
Kinesiology , 6 (1), 23-35.
Hsiao, H., & Stanevich, R. (1996). Biomechanical evaluation of scaffolding tasks.
International Journal of Industrial Ergonomics , 407-415.
McAtamneya, L., & Corlett, E. N. (1993). RULA: a survey method for the investigation
of work-related upper limb disorders. Applied Ergonomics , 24 (2), 91-99.
McGorry, R. W., Chien-Chi, C., & Dempsey, P. G. (2004). A technique for estimation of
wrist angular displacement in radial/ulnar deviation and flexion/extension.
International Journal of Industrial Ergonomics , 34 (1), 21-29.
Mital, A., & Channaveeraiah, C. (1988). Peak volitional torques for wrenches and
screwdrivers. International Journal of Industrial Ergonomics , 3 (1), 41-64.

101
Moore, J. S., & Garg, A. (1995). The Strain Index - A Proposed Method to Analyze Jobs
for Risk of Distal Upper Extremity Disorders. American Industrial Hygiene
Association Journal , 56 (5), 443-458.
Occupational Safety & Health Administration. (1996). Additional requirements
applicable to specific types of scaffolds. Washington, DC.
Putz-Anderson, V. (1988). Cumulative Trauma Disorders: A Manual for Musculoskeletal
Diseases of the Upper Limbs. Philadelphia: Taylor & Francis Inc.
Sanders, M., & McCormick, E. (1993). Human Factors In Engineering and Design.
Columbus, Ohio: McGraw-Hill.
Snook, S. (1978). Ergonomics Society - Societys Lecture 1978 - Design of Manual
Handling Tasks. Ergonomics , 21 (12), 963-985.
Tayyari, F., & Smith, J. L. (1997). Occupational Ergonomics - Principles and
applications. Norwell: Kluwer Academic Publishers.
van der Beek, A. J., Mathiassen, S. E., Windhorst, J., & Burdorf, A. (2005). An
evaluation of methods assessing the physical demands of manual lifting in
scaffolding. Applied Ergonomics , 213-222.
Vink, P., Urlings, I. J., & van der Molen, H. F. (1997). A participatory ergonomics
approach to redesign work of scaffolders. Safety Science , 75-85.
Waters, T. R., Putz-Anderson, V., & Garg, A. (1994). Applications Manual The Revised
NIOSH Lifting Equation. Cincinnati: U.S. Department of Health and Human
Services.
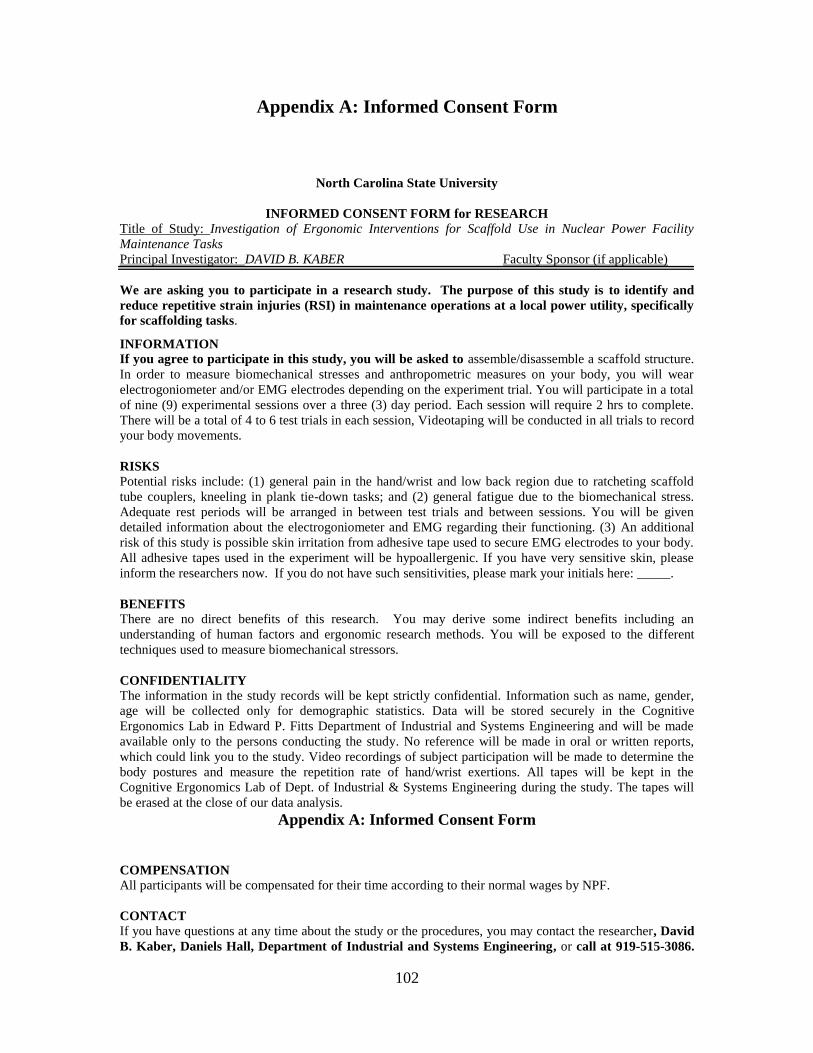
102
Appendix A: Informed Consent Form
North Carolina State University
INFORMED CONSENT FORM for RESEARCH Title of Study: Investigation of Ergonomic Interventions for Scaffold Use in Nuclear Power Facility
Maintenance Tasks
Principal Investigator: DAVID B. KABER Faculty Sponsor (if applicable)
We are asking you to participate in a research study. The purpose of this study is to identify and
reduce repetitive strain injuries (RSI) in maintenance operations at a local power utility, specifically
for scaffolding tasks.
INFORMATION If you agree to participate in this study, you will be asked to assemble/disassemble a scaffold structure.
In order to measure biomechanical stresses and anthropometric measures on your body, you will wear
electrogoniometer and/or EMG electrodes depending on the experiment trial. You will participate in a total
of nine (9) experimental sessions over a three (3) day period. Each session will require 2 hrs to complete.
There will be a total of 4 to 6 test trials in each session, Videotaping will be conducted in all trials to record
your body movements.
RISKS Potential risks include: (1) general pain in the hand/wrist and low back region due to ratcheting scaffold
tube couplers, kneeling in plank tie-down tasks; and (2) general fatigue due to the biomechanical stress.
Adequate rest periods will be arranged in between test trials and between sessions. You will be given
detailed information about the electrogoniometer and EMG regarding their functioning. (3) An additional
risk of this study is possible skin irritation from adhesive tape used to secure EMG electrodes to your body.
All adhesive tapes used in the experiment will be hypoallergenic. If you have very sensitive skin, please
inform the researchers now. If you do not have such sensitivities, please mark your initials here: _____.
BENEFITS There are no direct benefits of this research. You may derive some indirect benefits including an
understanding of human factors and ergonomic research methods. You will be exposed to the different
techniques used to measure biomechanical stressors.
CONFIDENTIALITY The information in the study records will be kept strictly confidential. Information such as name, gender,
age will be collected only for demographic statistics. Data will be stored securely in the Cognitive
Ergonomics Lab in Edward P. Fitts Department of Industrial and Systems Engineering and will be made
available only to the persons conducting the study. No reference will be made in oral or written reports,
which could link you to the study. Video recordings of subject participation will be made to determine the
body postures and measure the repetition rate of hand/wrist exertions. All tapes will be kept in the
Cognitive Ergonomics Lab of Dept. of Industrial & Systems Engineering during the study. The tapes will
be erased at the close of our data analysis.
Appendix A: Informed Consent Form
COMPENSATION All participants will be compensated for their time according to their normal wages by NPF.
CONTACT If you have questions at any time about the study or the procedures, you may contact the researcher, David
B. Kaber, Daniels Hall, Department of Industrial and Systems Engineering, or call at 919-515-3086.

103
If you feel you have not been treated according to the descriptions in this form, or your rights as a
participant in research have been violated during the course of this project, you may contact Dr. Arnold
Bell, Chair of the NCSU IRB for the Use of Human Subjects in Research Committee, Box 7514, NCSU
Campus (919/515-4420) or Mr. Matthew Ronning, Assistant Vice Chancellor, Research Administration,
Box 7514, NCSU Campus (919/513-2148)
PARTICIPATION Your participation in this study is voluntary; you may decline to participate without penalty. If you decide
to participate, you may withdraw from the study at any time without penalty and without loss of benefits to
which you are otherwise entitled. If you withdraw from the study before data collection is completed your
data will be returned to you or destroyed at your request.
CONSENT “I have read and understand the above information. I have received a copy of this form. I agree to
participate in this study with the understanding that I may withdraw at any time.”
Subject's signature_______________________________________ Date _________________
Investigator's signature__________________________________ Date _________________

104
Appendix B: Demographic Questionnaire
Demographic Questionnaire
1. Name/Code:
2. Age:
3. Height (inches)
4. Weight (lbs)
5. Typical shift start time:
6. Typical shift end time:
7. Work years: Current (Please provide a maximum of 10 years experience OR a maximum of 5 jobs
as part of your work history)
Position Title/Description Years Average Borg Rating
Current
Prior # 1
Prior # 2
Prior # 3
Prior # 4
Prior # 5
8. Do you work on a second job outside of this facility (circle one): Yes No.
If Yes, please provide the number of years and hours/week you have worked at your second job:
yrs. hrs./week
9. Dominant hand (circle one): Left Right Both

105
Appendix B: Demographic Questionnaire
10. Maximum grip strength:
Trial # 1 Trial # 2 Trial # 3 Average
11. Maximum linear force:
Trial # 1 Trial # 2 Trial # 3 Average
12. Maximum back strength:
Trial # 1 Trial # 2 Trial # 3 Average
13. Maximum upper arm strength:
Trial # 1 Trial # 2 Trial # 3 Average
14. Overall worker rating at beginning of shift (Borg CR-10):
15. Overall worker rating at end of shift (Borg CR-10):

106
Appendix C: Graphs for the ANOVA Assumptions
Test for Equal Variance
Scatter plot of the residuals as a function of the predicted values for Experiment 1
flexion
Scatter plot of the residuals as a function of the predicted values for Experiment 1
extension

107
Appendix C: Graphs for the ANOVA Assumptions
Scatter plot of the residuals as a function of the predicted values for Experiment 1
ulnar deviation
Scatter plot of the residuals as a function of the predicted values for Experiment 1
radial deviation

108
Appendix C: Graphs for the ANOVA Assumptions
Scatter plot of the residuals as a function of the predicted values for Experiment 1
TTC
Scatter plot of the residuals as a function of the predicted values for Experiment 1
Log (TTC)

109
Appendix C: Graphs for the ANOVA Assumptions
Scatter plot of the residuals as a function of the predicted values for Experiment 2
flexion
Scatter plot of the residuals as a function of the predicted values for Experiment 2
extension

110
Appendix C: Graphs for the ANOVA Assumptions
Scatter plot of the residuals as a function of the predicted values for Experiment 2
radial deviation
Scatter plot of the residuals as a function of the predicted values for Experiment 2
ulnar deviation

111
Appendix C: Graphs for the ANOVA Assumptions
Scatter plot of the residuals as a function of the predicted values for Experiment 2
pronation
Scatter plot of the residuals as a function of the predicted values for Experiment 2
TTC

112
Appendix C: Graphs for the ANOVA Assumptions
Scatter plot of the residuals as a function of the predicted values for Experiment 2
Log (TTC)
Test for Normality
The normal quantile plot of the residuals for Experiment 1 flexion

113
Appendix C: Graphs for the ANOVA Assumptions
The normal quantile plot of the residuals for Experiment 1 extension
The normal quantile plot of the residuals for Experiment 1 ulnar deviation

114
Appendix C: Graphs for the ANOVA Assumptions
The normal quantile plot of the residuals for Experiment 1 radial deviation
The normal quantile plot of the residuals for Experiment 1 time-to-task completion
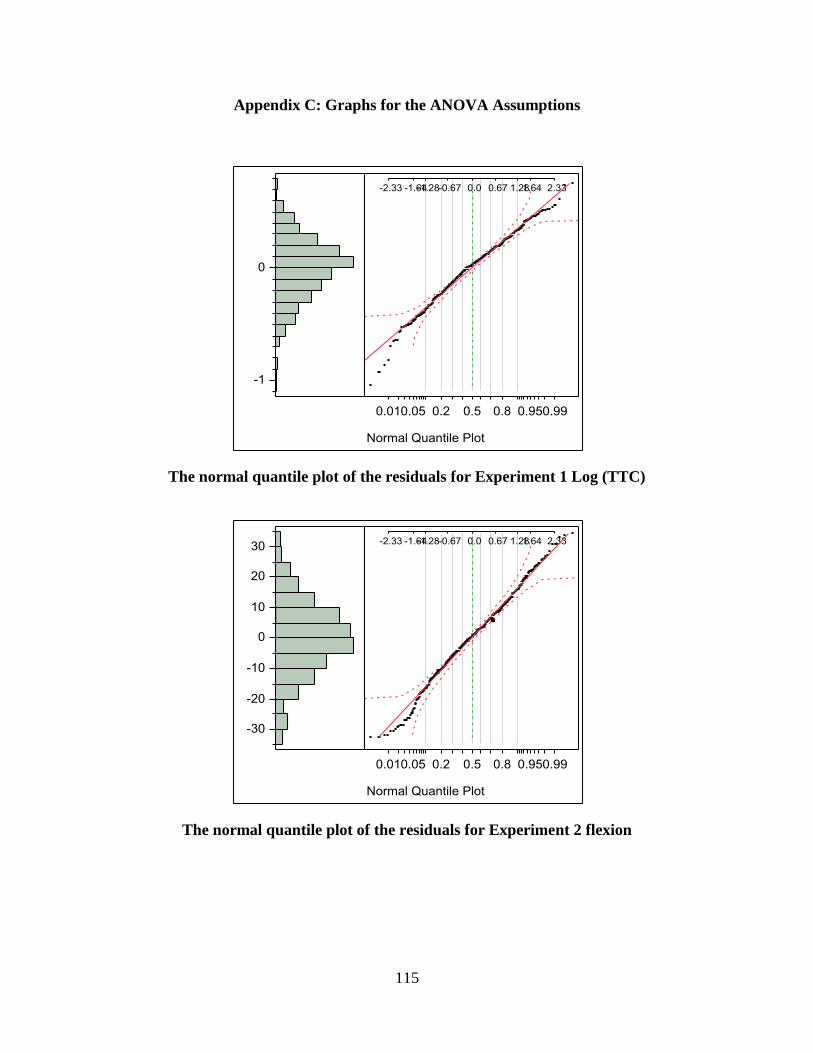
115
Appendix C: Graphs for the ANOVA Assumptions
The normal quantile plot of the residuals for Experiment 1 Log (TTC)
The normal quantile plot of the residuals for Experiment 2 flexion

116
Appendix C: Graphs for the ANOVA Assumptions
The normal quantile plot of the residuals for Experiment 2 extension
The normal quantile plot of the residuals for Experiment 2 radial deviation

117
Appendix C: Graphs for the ANOVA Assumptions
The normal quantile plot of the residuals for Experiment 2 ulnar deviation
The normal quantile plot of the residuals for Experiment 2 pronation
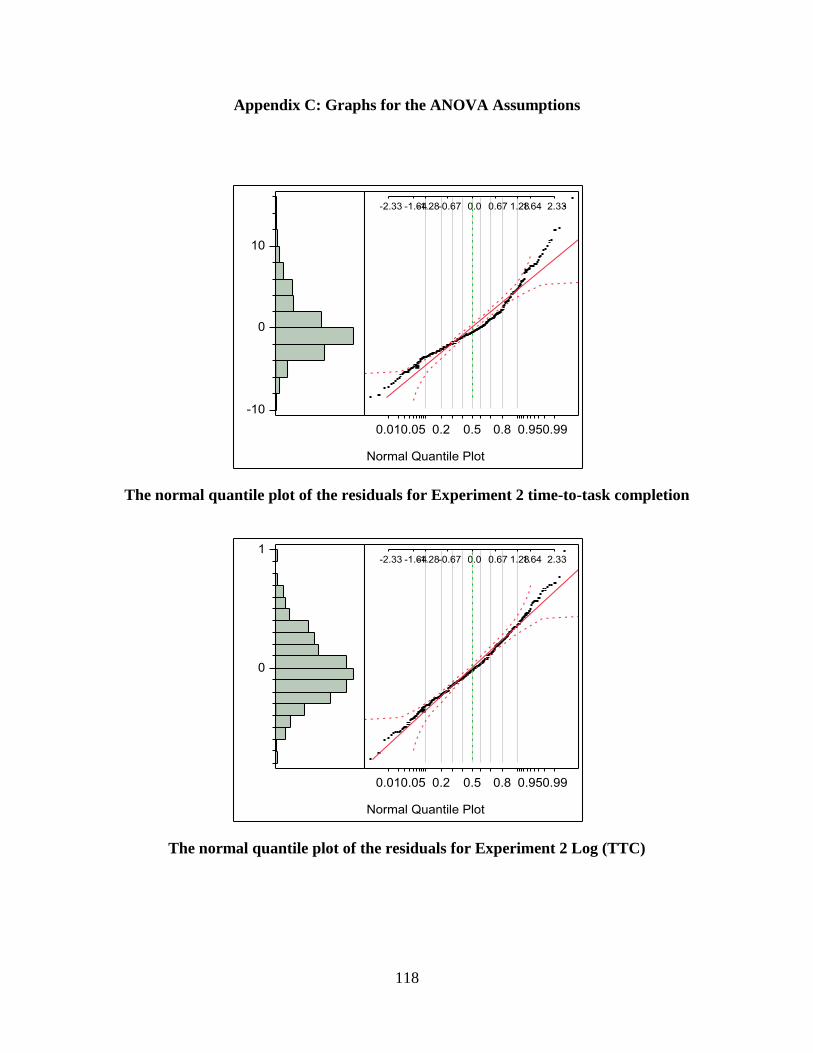
118
Appendix C: Graphs for the ANOVA Assumptions
The normal quantile plot of the residuals for Experiment 2 time-to-task completion
The normal quantile plot of the residuals for Experiment 2 Log (TTC)
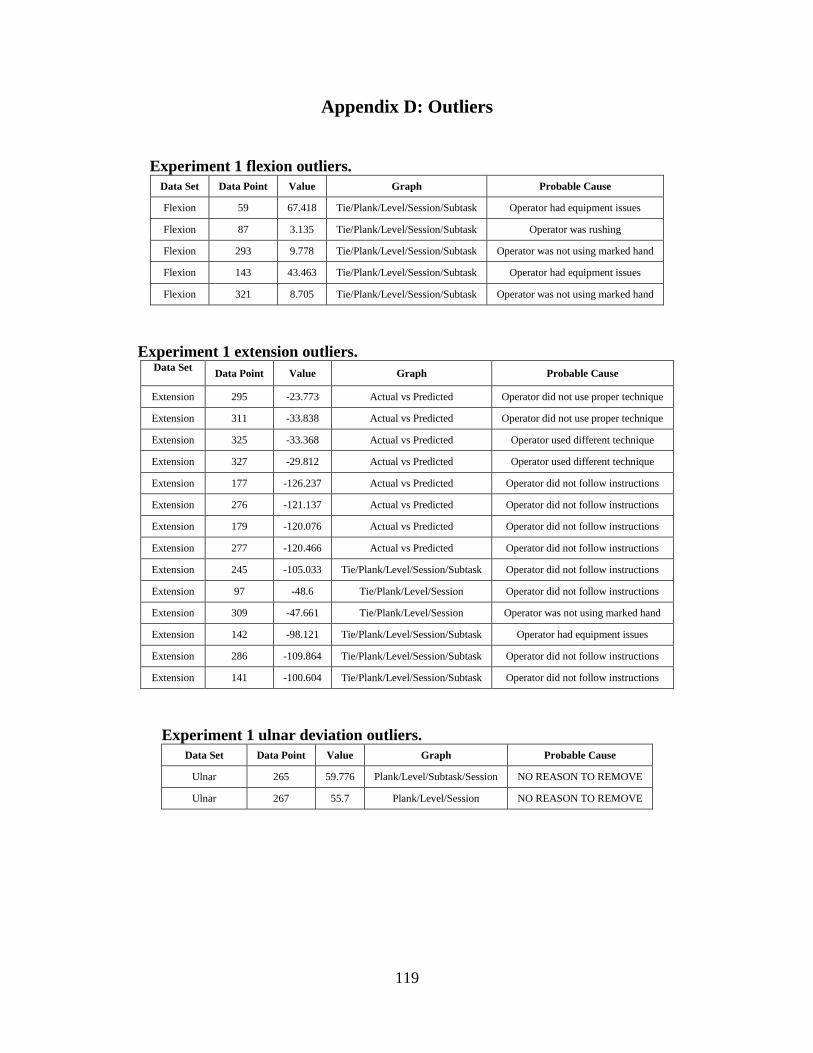
119
Appendix D: Outliers
Experiment 1 flexion outliers.
Data Set Data Point Value Graph Probable Cause
Flexion 59 67.418 Tie/Plank/Level/Session/Subtask Operator had equipment issues
Flexion 87 3.135 Tie/Plank/Level/Session/Subtask Operator was rushing
Flexion 293 9.778 Tie/Plank/Level/Session/Subtask Operator was not using marked hand
Flexion 143 43.463 Tie/Plank/Level/Session/Subtask Operator had equipment issues
Flexion 321 8.705 Tie/Plank/Level/Session/Subtask Operator was not using marked hand
Experiment 1 extension outliers. Data Set
Data Point Value Graph Probable Cause
Extension 295 -23.773 Actual vs Predicted Operator did not use proper technique
Extension 311 -33.838 Actual vs Predicted Operator did not use proper technique
Extension 325 -33.368 Actual vs Predicted Operator used different technique
Extension 327 -29.812 Actual vs Predicted Operator used different technique
Extension 177 -126.237 Actual vs Predicted Operator did not follow instructions
Extension 276 -121.137 Actual vs Predicted Operator did not follow instructions
Extension 179 -120.076 Actual vs Predicted Operator did not follow instructions
Extension 277 -120.466 Actual vs Predicted Operator did not follow instructions
Extension 245 -105.033 Tie/Plank/Level/Session/Subtask Operator did not follow instructions
Extension 97 -48.6 Tie/Plank/Level/Session Operator did not follow instructions
Extension 309 -47.661 Tie/Plank/Level/Session Operator was not using marked hand
Extension 142 -98.121 Tie/Plank/Level/Session/Subtask Operator had equipment issues
Extension 286 -109.864 Tie/Plank/Level/Session/Subtask Operator did not follow instructions
Extension 141 -100.604 Tie/Plank/Level/Session/Subtask Operator did not follow instructions
Experiment 1 ulnar deviation outliers.
Data Set Data Point Value Graph Probable Cause
Ulnar 265 59.776 Plank/Level/Subtask/Session NO REASON TO REMOVE
Ulnar 267 55.7 Plank/Level/Session NO REASON TO REMOVE

120
Appendix D: Outliers
Experiment 1 radial deviation outliers.
Data Set Data Point Value Graph Probable Cause
Radial 277 -98.967 Actual vs Predicted Operator did not follow instructions
Radial 136 -6.603 Plank/Level/Subtask/Session NO REASON TO REMOVE
Radial 139 -0.78 Plank/Level/Subtask/Session NO REASON TO REMOVE
Radial 129 -6.239 Plank/Level/Subtask/Session NO REASON TO REMOVE
Radial 270 -20.141 Plank/Level/Session NO REASON TO REMOVE
Experiment 1 TTC outliers.
Data Set Data Point Value Graph Probable Cause
TTC 148 30 Actual vs Predicted Operator did not follow instructions
TTC 242 35.5 Actual vs Predicted Operator did not follow instructions
TTC 244 34 Actual vs Predicted Operator did not follow instructions
TTC 275 22.25 Actual vs Predicted Operator did not follow instructions
TTC 141 13.5 Tie/Level/Session/Subtask Operator had equipment trouble
TTC 99 3 Tie/Plank/Level/Session/Subtask NO REASON TO REMOVE
TTC 346 4.25 Tie/Plank/Level/Session/Subtask NO REASON TO REMOVE
TTC 273 17 Level/Subtask/Session Operator did not follow instructions
Experiment 2 flexion outliers.
Data Set Data
Point Value Graphs Probable Cause
Flexion 301 113.068 Actual vs Predicted Operator was using off hand too much
Flexion 105 99.323 Coupler, activity, subtask, trial, session Operator had equipment issues
Flexion 253 26.146 Actual vs Predicted Operator did not adequately follow instructions
Flexion 52 101.32 Coupler, activity, subtask, trial, session Operator did not adequately follow instructions
Flexion 174 58.934 Coupler, activity, subtask, trial, session Operator was using off hand too much
Flexion 260 102.625 Coupler, activity, subtask, trial, session Operator did not adequately follow instructions
Flexion 272 103.546 Coupler, activity, subtask, trial, session Operator did not adequately follow instructions
Flexion 107 92.182 Coupler, activity, subtask, trial, session Operator had equipment issues
Flexion 105 99.323 Coupler, activity, subtask, trial, session Operator did not adequately follow instructions
Flexion 253 26.146 Coupler, activity, subtask, trial, session Operator did not adequately follow instructions
Flexion 301 113.068 Actual vs Predicted Operator did not adequately follow instructions
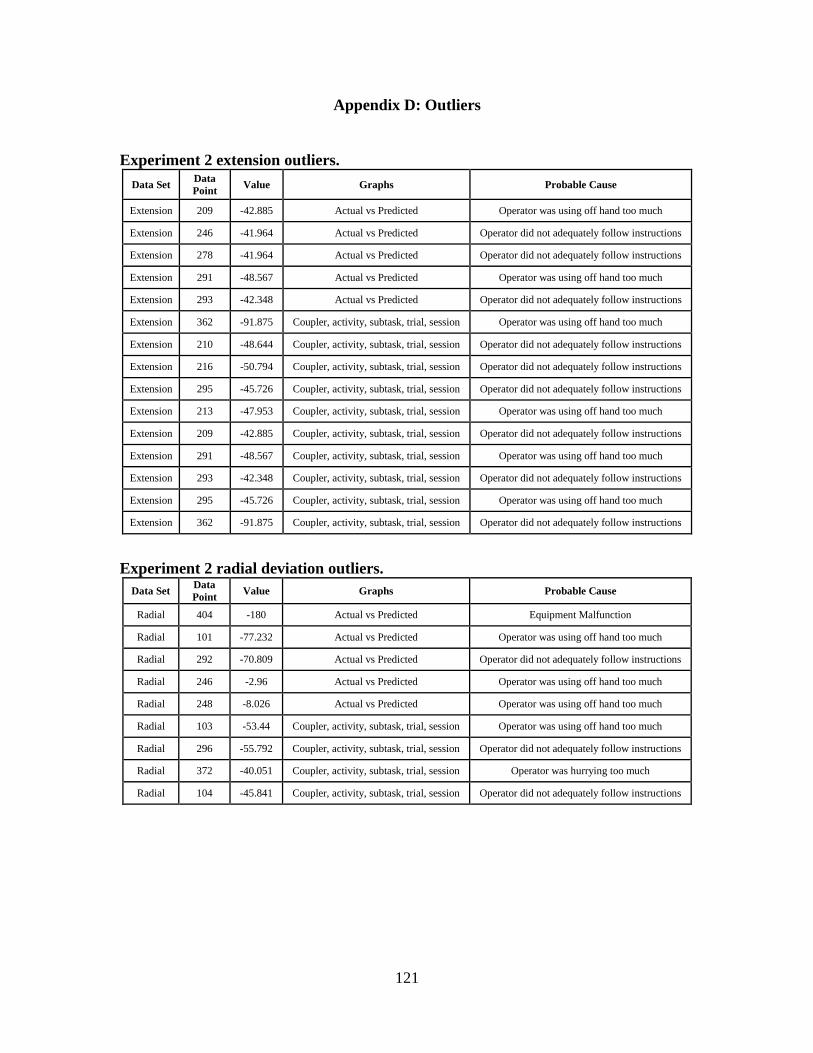
121
Appendix D: Outliers
Experiment 2 extension outliers.
Data Set Data
Point Value Graphs Probable Cause
Extension 209 -42.885 Actual vs Predicted Operator was using off hand too much
Extension 246 -41.964 Actual vs Predicted Operator did not adequately follow instructions
Extension 278 -41.964 Actual vs Predicted Operator did not adequately follow instructions
Extension 291 -48.567 Actual vs Predicted Operator was using off hand too much
Extension 293 -42.348 Actual vs Predicted Operator did not adequately follow instructions
Extension 362 -91.875 Coupler, activity, subtask, trial, session Operator was using off hand too much
Extension 210 -48.644 Coupler, activity, subtask, trial, session Operator did not adequately follow instructions
Extension 216 -50.794 Coupler, activity, subtask, trial, session Operator did not adequately follow instructions
Extension 295 -45.726 Coupler, activity, subtask, trial, session Operator did not adequately follow instructions
Extension 213 -47.953 Coupler, activity, subtask, trial, session Operator was using off hand too much
Extension 209 -42.885 Coupler, activity, subtask, trial, session Operator did not adequately follow instructions
Extension 291 -48.567 Coupler, activity, subtask, trial, session Operator was using off hand too much
Extension 293 -42.348 Coupler, activity, subtask, trial, session Operator did not adequately follow instructions
Extension 295 -45.726 Coupler, activity, subtask, trial, session Operator was using off hand too much
Extension 362 -91.875 Coupler, activity, subtask, trial, session Operator did not adequately follow instructions
Experiment 2 radial deviation outliers.
Data Set Data
Point Value Graphs Probable Cause
Radial 404 -180 Actual vs Predicted Equipment Malfunction
Radial 101 -77.232 Actual vs Predicted Operator was using off hand too much
Radial 292 -70.809 Actual vs Predicted Operator did not adequately follow instructions
Radial 246 -2.96 Actual vs Predicted Operator was using off hand too much
Radial 248 -8.026 Actual vs Predicted Operator was using off hand too much
Radial 103 -53.44 Coupler, activity, subtask, trial, session Operator was using off hand too much
Radial 296 -55.792 Coupler, activity, subtask, trial, session Operator did not adequately follow instructions
Radial 372 -40.051 Coupler, activity, subtask, trial, session Operator was hurrying too much
Radial 104 -45.841 Coupler, activity, subtask, trial, session Operator did not adequately follow instructions

122
Appendix D: Outliers
Experiment 2 ulnar deviation outliers. Data
Set
Data
Point Value Graphs Probable Cause
Ulnar 103 131.29 Actual vs Predicted Operator did not adequately follow instructions
Ulnar 105 156.62 Actual vs Predicted Operator did not adequately follow instructions
Ulnar 107 128.938 Actual vs Predicted Operator did not adequately follow instructions
Ulnar 114 162.967 Actual vs Predicted Measurement Equipment had come loose on operator
Ulnar 116 164.384 Actual vs Predicted Measurement Equipment had come loose on operator
Ulnar 118 163.96 Actual vs Predicted Measurement Equipment had come loose on operator
Ulnar 120 163.098 Actual vs Predicted Measurement Equipment had come loose on operator
Ulnar 402 180 Actual vs Predicted Measurement Equipment Error
Ulnar 404 180 Actual vs Predicted Measurement Equipment Error
Ulnar 406 180 Actual vs Predicted Measurement Equipment Error
Ulnar 408 180 Actual vs Predicted Measurement Equipment Error
Ulnar 121 104.37 Actual vs Predicted Operator did not adequately follow instructions
Ulnar 122 109.464 Actual vs Predicted Operator did not adequately follow instructions
Ulnar 123 119.04 Actual vs Predicted Operator did not adequately follow instructions
Ulnar 124 116.12 Actual vs Predicted Operator did not adequately follow instructions
Ulnar 125 108.717 Actual vs Predicted Operator did not adequately follow instructions
Ulnar 88 93.837 Coupler, activity, subtask, trial, session Operator was using off hand too much
Ulnar 101 105.779 Coupler, activity, subtask, trial, session Operator did not adequately follow instructions
Ulnar 108 40.282 Coupler, activity, subtask, trial, session Operator did not adequately follow instructions
Ulnar 112 35.668 Coupler, activity, subtask, trial, session Operator did not adequately follow instructions
Ulnar 119 105.525 Coupler, activity, subtask, trial, session Measurement Equipment had come loose on operator
Ulnar 127 102.876 Coupler, activity, subtask, trial, session Measurement Equipment had come loose on operator
Ulnar 151 38.234 Coupler, activity, subtask, trial, session Operator did not adequately follow instructions
Ulnar 340 81.805 Coupler, activity, subtask, trial, session No Reason To Remove
Ulnar 113 93.164 Actual vs Predicted Measurement Equipment had come loose on operator
Ulnar 115 96.492 Actual vs Predicted Measurement Equipment had come loose on operator
Ulnar 117 97.307 Actual vs Predicted Measurement Equipment had come loose on operator
Ulnar 126 95.337 Actual vs Predicted Measurement Equipment had come loose on operator
Ulnar 128 98.937 Actual vs Predicted Measurement Equipment had come loose on operator

123
Appendix D: Outliers
Experiment 2 pronation outliers.
Data Set Data
Point Value Graphs Probable Cause
Pronation 32 10.712 Coupler, activity, subtask, trial, session Operator did not adequately follow instructions
Pronation 67 17.096 Coupler, activity, subtask, trial, session Operator did not adequately follow instructions
Pronation 68 10.644 Coupler, activity, subtask, trial, session Operator did not adequately follow instructions
Pronation 72 10.44 Coupler, activity, subtask, trial, session Operator did not adequately follow instructions
Pronation 76 10.372 Coupler, activity, subtask, trial, session Operator did not adequately follow instructions
Pronation 99 141.737 Coupler, activity, subtask, trial, session Measurement Eqipment was not secure
Pronation 100 23.559 Coupler, activity, subtask, trial, session Operator did not adequately follow instructions
Pronation 108 43.081 Coupler, activity, subtask, trial, session Operator was using off hand too much
Pronation 110 145.609 Coupler, activity, subtask, trial, session Measurement Eqipment was not secure
Pronation 111 38.563 Coupler, activity, subtask, trial, session Operator was using off hand too much
Pronation 112 144.076 Coupler, activity, subtask, trial, session Measurement Eqipment was not secure
Pronation 261 116.891 Coupler, activity, subtask, trial, session Measurement Eqipment was not secure
Pronation 22 32.514 Activity, subtask, session Operator was using off hand too much
Pronation 30 44.603 Activity, subtask, session Operator was using off hand too much
Pronation 66 17.843 Activity, subtask, session Operator did not adequately follow instructions
Pronation 69 13.429 Activity, subtask, session Operator did not adequately follow instructions
Pronation 70 25.858 Activity, subtask, session Operator was using off hand too much
Pronation 98 45.097 Activity, subtask, session Operator was using off hand too much