abstract document: influencing consumers’ preferences: the
TRANSCRIPT

ABSTRACT
Title of Document: INFLUENCING CONSUMERS’ PREFERENCES:
THE EFFECTS OF MENTAL CONSTRUAL AND MODE OF INFORMATION PROCESSING
Debora Viana Thompson, Doctor of Philosophy, 2006. Directed By: Professor Roland T. Rust and Professor Rebecca W.
Hamilton, Department of Marketing
This dissertation comprises a series of three essays that investigate the influence
of consumers’ mental construal and information processing on product evaluations.
In the first essay, we examine shifts in consumers’ preferences for products before
and after a direct product use experience. This essay investigates how consumers balance
their desire for product capability and product usability when they evaluate products with
different numbers of features, before and after use. Three studies show that consumers
understand that there are usability costs and capability benefits when features are added
to products. However, consumers tend to give more weight to capability and less weight
to usability in their product evaluations before use relative to after use, which results in
choices that do not maximize satisfaction after use – an effect we refer to as “feature
fatigue.”
In the second essay, we investigate a theoretical explanation for this discrepancy
between product evaluations before and after use. Based on construal level theory, we

predict that changes in product preferences before and after can be explained by changes
in consumers’ level of mental representation before and after a direct product experience.
Results indicate that when consumers evaluate products before use, they tend to adopt a
higher-level, more abstract mental representation of the product, which favors desirability
aspects (such as capability) over feasibility aspects (such as usability). However, after
product use, consumers tend to adopt a lower-level, more concrete mental representation
of the product and are more influenced by feasibility aspects than desirability aspects.
In the third essay, we investigate the influence of two modes of information
processing, analytical and imagery processing, on consumers’ evaluations of products
that are advertised through comparative and noncomparative ads. We propose that
matching ad format and consumers’ mode of information processing improves ad
effectiveness by enhancing information processability. Results show that when
consumers are exposed to comparative ads, evaluations of the sponsor product are
enhanced when consumers use analytical processing as opposed to imagery processing.
In contrast, when consumers are exposed to noncomparative ads, evaluations of the
sponsor product are more favorable when they use imagery processing rather than
analytical processing.

INFLUENCING CONSUMERS’ PREFERENCES: THE EFFECTS OF MENTAL CONSTRUAL AND MODE OF INFORMATION
PROCESSING
By
Debora Viana Thompson
Dissertation submitted to the Faculty of the Graduate School of the University of Maryland, College Park, in partial fulfillment
of the requirements for the degree of Doctor of Philosophy
2006 Advisory Committee: Professor Roland T. Rust, Chair Professor Rebecca W. Hamilton, Chair Professor Kent Norman Professor Brian Ratchford Professor Joydeep Srivastava

© Copyright by Debora Viana Thompson
2006

ii
Acknowledgements
I am indebted to my dissertation chairs, Dr. Roland T. Rust and Dr. Rebecca
W. Hamilton, for their guidance in every stage of this dissertation. Roland and
Rebecca have been great mentors and I am grateful for their time, encouragement and
valuable insight.
Special thanks go to Dr. Kent Norman, Dr. Brian Ratchford, and Dr. Joydeep
Srivastava for their helpful comments at various stages of this dissertation and to
Saurabh Jain for his assistance in building the computerized experiments for essays 1
and 2. The development of these computerized experiments was funded by grants
from the Marketing Science Institute.
Finally, I would like to thank my family and my husband, Shawn, for their
love and unconditional support throughout the years of the PhD program.

iii
Table of Contents Acknowledgements ii
Table of Contents iii
List of Tables v
List of Figures vi
Overview 1
Chapter 1: Essay 1 – Feature Fatigue: When Product Capabilities Become Too Much of a Good Thing 5
Summary 5 Introduction 5 The Effects of Adding Product Features on Product Evaluations 7 How Consumers Weigh Capability and Usability in Their Product Evaluations 11 Study 1 – Consumers’ Intuitions 13 Study 2 – Customizing a Product 21 Study 3 – Contrasting Evaluations Before and After Product Use 24 General Discussion 32 Managerial Implications 36
Chapter 2: Essay 2 – Shifting Mental Construal and Product Preferences by Engaging in a Direct Product Experience 39
Summary 39 Introduction 40 Comparing Indirect and Direct Product Experiences 43 Construal Level Theory 44 Study 1 - Comparing Indirect and Direct Product Experiences 49 Study 2 - Using an Elaboration Task to Manipulate Mental Construal 56 Study 3 – Decreasing the Gap Across Indirect and Direct Product Experiences 64 Study 4 – Tracking Mental Construal Across Multiple Product Experiences 70 General Discussion 75
Chapter 3: Essay 3 – The Influence of Information Processing Mode on Consumers’ Responses to Comparative Advertising 82
Summary 82 Introduction 82 Comparative Advertising 84 Imagery and Analytical Information Processing 85

iv
Information Processability 86 Study 1A 88 Study 1B 93 Study 2 96 General Discussion 101
Appendices 105 Appendix 1 – Product Features Used in Essay 1 105 Appendix 2 – Measures Used in Essays 1 and 2 106 Appendix 3 – Digital Video Player Features Used in Essay 2 108 Appendix 4 – Digital Camera Features Used in Essay 2 109 Appendix 5 – Mental Construal Manipulation Used in Essay 2 (Studies 2 and 3) 110 Appendix 6 – Ad Stimuli for Essay 3 (Studies 1A and 1B) 114 Appendix 7 – Ad Stimuli for Essay 3 (Study 2) 115 Appendix 8 – Measures Used in Essay 3 116
References 118

v
List of Tables
Chapter 1: Essay 1 – Feature Fatigue: When Product Capabilities Become Too Much of a Good Thing
Table 1 – Effect of Number of Features on Dependent Variables 28 Table 2 – Standardized Path Coefficients 30
Chapter 3: Essay 3 – The Influence of Information Processing Mode on Consumers’ Responses to Comparative Advertising
Table 3 – Mediation Analysis for Analytical and Imagery Fluency 93 Table 4 – Ad Effectiveness as a Function of Processing Instructions and Ad Format 95 Table 5 – Ad Effectiveness as a Function of Processing Cues and Ad Format 99 Table 6 – Mediation Analysis for Analytical and Imagery Processing 101

vi
List of Figures
Overview
Figure 1 – Conceptual Framework 4 Chapter 1: Essay 1 – Feature Fatigue: When Product Capabilities Become Too Much of a Good Thing
Figure 2 – Conceptual Model 13 Figure 3 – Effects of Number of Features on Dependent Variables for the Digital Video Player 18
Chapter 2: Essay 2 – Shifting Mental Construal and Product Preferences by Engaging in a Direct Product Experience
Figure 4 – Interaction Between Product Experience and Product Type on Product Evaluations 55 Figure 5 – Interaction Between Mental Construal and Product Type on Product Evaluations 61 Figure 6 – Change in Evaluations of the Enhanced Product Across Conditions 68
1
Overview
The three essays that comprise this dissertation investigate factors that affect
consumers’ product evaluations. Product evaluations have a central role in consumer
behavior, influencing what individuals choose and how they feel about their choices over
time.
In essays 1 and 2, we investigate consumers’ evaluations of products with
different number of features and explore potential inconsistencies in expected and
experienced product utilities. In essay 1, results from studies 1 and 2 show that
consumers realize that increasing the number of features increases product capability and
decreases usability. However, their initial product preferences are driven more by product
capability than by product usability. Study 3 demonstrates the existence of the “feature
fatigue” effect, such that, when using a product, consumers may become dissatisfied with
the number of product features they desired and chose prior to using the product. In other
words, product capability can become too much of a good thing. This mismatch between
preferences for products before and after use occurs due to changes in the relative
weights of product capability and usability in consumers’ evaluations. Consumers tend to
give too much weight to capability before use relative to after use, and not enough weight
to usability before use relative to after use.
In essay 2, we provide a theoretical account for the feature fatigue effect, using
construal level theory (Liberman and Trope 1998; Trope and Liberman 2003). We
propose that a direct experience with a product leads consumers to adopt a more concrete
mental construal relative to indirect experiences such as reading a description of a

2
product or seeing a product on display. Previous research has demonstrated that when
concrete mental construals are adopted, feasibility considerations (the “how” aspects of
an action) are more salient than desirability considerations (the “why” aspects of an
action; Liberman and Trope 1998). Thus, using a product should increase the importance
of usability (a feasibility dimension) and decrease the importance of capability (a
desirability dimension), relative to indirect product experiences in which consumers do
not use the product.
Supporting our prediction, results from study 1 demonstrate that direct
experiences with a product trigger the adoption of a more concrete mental construal and
decrease consumers’ preference for enhanced products that have more capability, but are
more difficult to use. Furthermore, results from studies 2 and 3 show that inducing
consumers to think concretely prior to an indirect product experience decreases their
preferences for enhanced relative to more basic products, and attenuates the effect of
direct experience on preferences. Finally, the results of study 4 indicate that the effects of
a direct product experience on mental construal continue over multiple uses of a product,
suggesting that discrepancies in consumers’ evaluations before and after using a product
are not limited to the first usage experience.
In essay 3, we are interested in how different cues presented in advertisements can
induce or facilitate different modes of information processing and, in turn, shape
consumers’ evaluations of the ad and the advertised product. We propose that matching
ad format with consumers’ mode of information processing improves information
processability (i.e., the ease to process information) and enhances ad effectiveness.
Specifically, we predict that noncomparative ads are more consistent with imagery

3
information processing because this mode of processing is alternative-based and
discourages piecemeal comparisons across products (MacInnins and Price 1987). Thus,
we expect that when consumers use predominantly imagery processing, noncomparative
ads will lead to more positive ad and product evaluations than comparative ads.
Conversely, analytical processing encourages consumers to summarize features across
products (MacInnins and Price 1987), which is consistent with the point-by-point
comparisons usually presented in comparative ads. We predict that when consumers use
analytical processing, comparative ads will lead to more positive ad and product
evaluations than noncomparative ads.
We test our predictions in a series of three studies in which we manipulate
consumers’ information processing directly, using explicit processing instructions
(studies 1A and 1B), and indirectly, using advertising executional cues (study 2), such as
the imagery-evoking appeal of the message and the format of attribute information.
Overall, we find that matching ad format to the consumers’ processing mode improves
information processability, resulting in greater message persuasiveness.
Figure 1graphically summarizes the main constructs we examine in the three
essays that follow.

4
FIGURE 1 – Conceptual Framework
Level of MentalConstrual
ProductEvaluations
InformationProcessability
ProductExperience
Mode ofInformationProcessing
IndependentVariables Process Mechanism Dependent Variable
AdvertisingFormat

5
Chapter 1: Essay 1 – Feature Fatigue: When Product Capabilities
Become Too Much of a Good Thing1
Summary
As technology advances, it becomes more feasible to load products with a large
number of features, each of which individually might be seen as useful. However, too
many features can make a product overwhelming for consumers and hard to use. Three
studies examine how consumers balance their desires for capability and usability when
they evaluate products, and how these desires shift over time. Because consumers give
more weight to capability and less weight to usability before relative to after use,
consumers tend to choose overly complex products that do not maximize their
satisfaction when using them, resulting in “feature fatigue.”
Introduction
A common way to enhance and differentiate a product is by increasing the
number of features included (Goldenberg et al. 2003; Mukherjee and Hoyer 2001; Nowlis
and Simonson 1996), providing greater functionality for consumers. This strategy has
become especially popular as new developments in electronics and information
technology (e.g., miniaturization and integration of electronic components) have allowed
1 Two articles based on this research and co-authored with Rebecca W. Hamilton and Roland T. Rust have been published in the Journal of Marketing Research (November 2005) and in the Harvard Business Review (February 2006).

6
products to include more functions, yet cost less and require less time to be manufactured
(Freund, König and Roth 1997).
While each additional feature provides another reason for the consumer to
purchase a product (Brown and Carpenter 2000) and may add desired capabilities, too
many features can make products overwhelming for consumers, leading to dissatisfaction
and “feature fatigue.” Anecdotal evidence suggests that consumers do not use all of the
features of the products they buy (Ammirati 2003), and even more significantly,
empirical evidence suggests that consumers may experience negative emotional reactions
such as anxiety or stress in response to product complexity (Mick and Fournier 1998).
Why do consumers seem to be making choices that do not maximize their long-
term satisfaction? One potential reason is that consumers do not make a connection
between increasing the number of product features and the difficulty of using a product.
Another is that consumers understand that products with more features will be more
difficult to use, but because features are bundled together, they are forced to buy features
they do not want in order to get features they do want. Finally, consumers may
understand that products with more features will be more difficult to use, but give ease of
use too little weight in their purchase decisions.
In this research, we examine how consumers balance their competing needs for
functionality and ease of use when evaluating products. First, we measure the effects of
adding product features on two distinct product dimensions, the perceived capability of
the product and the perceived usability of the product. Across our studies, features are
attributes that add functionality to a product and require consumers’ input to be used.
Second, we test the degree to which consumers consider usability relative to capability
7
when evaluating products before using them. Third, we measure the relative weights of
capability and usability in consumers’ expected utility (before use) and experienced
utility (after use) and test for significant differences in these weights before and after
product use. While previous research has focused on either pre-usage evaluations such as
purchase intentions (e.g., Carpenter, Glazer and Nakamoto 1994), or post-usage
evaluations such as satisfaction (e.g., Bolton and Lemon 1999) and usability (e.g.,
McLaughlin and Skinner 2000), we integrate these perspectives by comparing
evaluations of products before and after use.
This essay is organized as follows: first, we briefly discuss the effects of adding
product features on consumers’ evaluations of products. Second, we report the results of
three studies designed to test our hypotheses. We conclude with a discussion of our
results, their theoretical and managerial implications, and directions for future research.
The Effects of Adding Product Features on Product Evaluations
Both economic theory and current market research techniques predict that
increasing the number of features will make products more appealing. Economic theory
models consumers’ preferences using an additive utility function that links product
attributes to consumer demand (Lancaster 1971). Each positively valued attribute
increases consumers’ utility. Similarly, market research techniques such as conjoint
analysis or discrete choice analysis model each product as a bundle of attributes and
estimate part-worths for each attribute (Srinivasan, Lovejoy and Beach 1997). Because
market shares are predicted based on these part-worths, each positively valued feature

8
increases a product’s market share relative to products without the feature.
The behavioral assumption underlying decompositional models such as these is
that consumers infer functional product benefits from concrete product attributes.
Because the utility of a product is based on its potential benefits to the consumer rather
than product features per se, consumers translate information about concrete product
attributes into functional benefits in their mental representations (Olson and Reynolds
1983). Consistent with this mapping process, research has shown that added features
provide positive differentiation by giving a product perceived advantages over
competitive products (Carpenter, Glazer and Nakamoto 1994). Consumers seem to use
added features in an instrumental reasoning process that makes the brand with more
features appear superior in a choice set (Brown and Carpenter 2000). Although these
inferences have been demonstrated to occur for irrelevant as well as important attributes
(Brown and Carpenter 2000), consumers must perceive a benefit from the added feature
for product evaluations to increase. Non-negative features perceived to add little or no
value (e.g., calculator functions only useful to biochemistry students) tend to decrease
brand share because they provide reasons against choosing the enhanced product
(Simonson, Carmon and O’Curry 1994).
Thus, we predict that perceived product capability, the consumer’s beliefs about
the product’s ability to perform desired functions, will increase as more features
providing perceived benefits are added to a product. While previous research has asked
participants to compare products differing in a single feature (e.g., Brown and Carpenter
2000), we predict that consumers will perceive greater capability as the number of
features increases, even when evaluating a single product. Moreover, while previous

9
research has focused on consumer perceptions prior to use, we predict this relationship
will hold both before and after product use.
H1: As the number of beneficial features included in a product increases, perceptions of
the product’s capability will increase.
In addition to the product’s capability, consumers should consider their ability to
use the product and benefit from its features. Research on usability and user-centered
design suggests that adding features to products has a negative effect on consumers’
ability to use them across several product categories (Wiklund 1994). Every additional
feature is “one more thing to learn, one more thing to possibly misunderstand, and one
more thing to search through when looking for the thing you want” (Nielsen 1993,
p.155). Usability research has focused on measures that allow a consumer’s usage
experience to be compared across products, such as the ease of learning how to use a
product, the propensity to make errors while using it, and the efficiency of using it
(McLaughlin and Skinner 2000). The time taken to complete a task, the ratio of
successful to unsuccessful interactions with a product, and the number of errors are
typical operationalizations of usability (Nielsen 1993). However, while usability research
supports the principle that less is more, this research is based on consumers’ actual
experiences using products rather than their perceptions about their ability to use
products.
There is some evidence that consumers account for learning costs when features
are added to products. For example, adding a novel feature to a Web TV or personal

10
computer had a positive effect on product evaluations when the feature was described as
fully automatic, but a negative effect on product evaluations when it was described as
manually operated, presumably due to consumers’ inferences about learning costs
(Mukherjee and Hoyer 2001). However, while these findings are suggestive, consumer
perceptions were measured in response to varying a single feature across products, and
consumers did not use the products being evaluated.
Based on both usability studies and consumers’ inferences about the effects of
adding a feature to a product, we predict that perceived product usability, the consumer’s
beliefs about the difficulty of learning and using the product, will decrease as more
individually beneficial features are added to a product. This should be true even when
consumers evaluate a single product, and should hold both before and after consumers
use the product.
H2: As the number of beneficial features included in a product increases, perceptions of
the product’s usability will decrease.
How will consumers’ expertise within a product category affect their perceptions
of product capability and product usability? Experts have a better understanding of
product-related information and are better able to discriminate between important and
unimportant features than novices (Alba and Hutchinson 1987). As a result, experts
should be better able to assess product capability than novices. However, whether experts
perceive a given product’s capability to be higher or lower than novices will depend on
the specific features of the product and the benefits they are believed to provide.

11
Therefore, we cannot make a general prediction about the effect of expertise on perceived
product capability. In contrast, the effect of expertise on perceived usability is clear.
Experts perform product-related tasks more automatically, freeing cognitive resources
that can be used to learn new product features (Alba and Hutchinson 1987). For example,
experts were more successful in solving tasks and were more efficient when using a
mobile phone than novices (Ziefle 2002). Experts also may be better able to handle
complex products because they focus their attention on a smaller, more diagnostic
number of inputs (Spence and Brucks 1997). Thus, we predict that because experts are
better able to learn and use each product feature than novices, usability ratings should be
higher for experts than for novices.
H3: Expertise will have a positive effect on consumers’ perceptions of product usability.
How Consumers Weigh Capability and Usability in Their Product Evaluations
If increasing the number of product features has positive effects on perceived
capability (H1) and negative effects on perceived usability (H2), how do consumers
integrate these two product dimensions when forming their overall product evaluations?
Previous research suggests that consumers consider both the benefits and costs of adding
a new feature to a product (Mukherjee and Hoyer 2001). We propose that the net effect of
increasing the number of product features on product utility depends on the relative
weights consumers give to capability and usability in their product evaluations, and that
these weights may vary across time and situations.

12
Experimental research has shown that when evaluating options for the distant
future, individuals favor highly desirable options that are less feasible over less desirable
options that are highly feasible. However, the reverse is true when evaluating options in
the near future (Liberman and Trope 1998). The relative weights of desirability (i.e., the
expected value of the goal or the “why” aspect of an action) and feasibility (i.e., beliefs
about the difficulty of reaching the end state or the “how” aspect of an action) change
because the construal of more distant future events tends to be more abstract, favoring
desirability, while the construal of near future events tends to be more concrete, favoring
feasibility (Liberman and Trope 1998).
Analogously, we propose that consumers will create more abstract construals of
products in their evaluations before use, assigning greater weight to the desirability of the
promised benefits (e.g. what can this product do for me?), relative to their evaluations
after use. In contrast, after using a product, consumers will develop a more concrete
construal of the product, placing more weight on feasibility (e.g., is this product easy to
use?), relative to their evaluations before use. Based on this expected shift in the
importance of capability and usability, we predict that:
H4a: Consumers will give more weight to product capability in their expected product
utilities (before use), relative to their experienced product utilities (after use).
H4b: Consumers will give less weight to product usability in their expected product
utility, relative to their experienced product utilities.
13
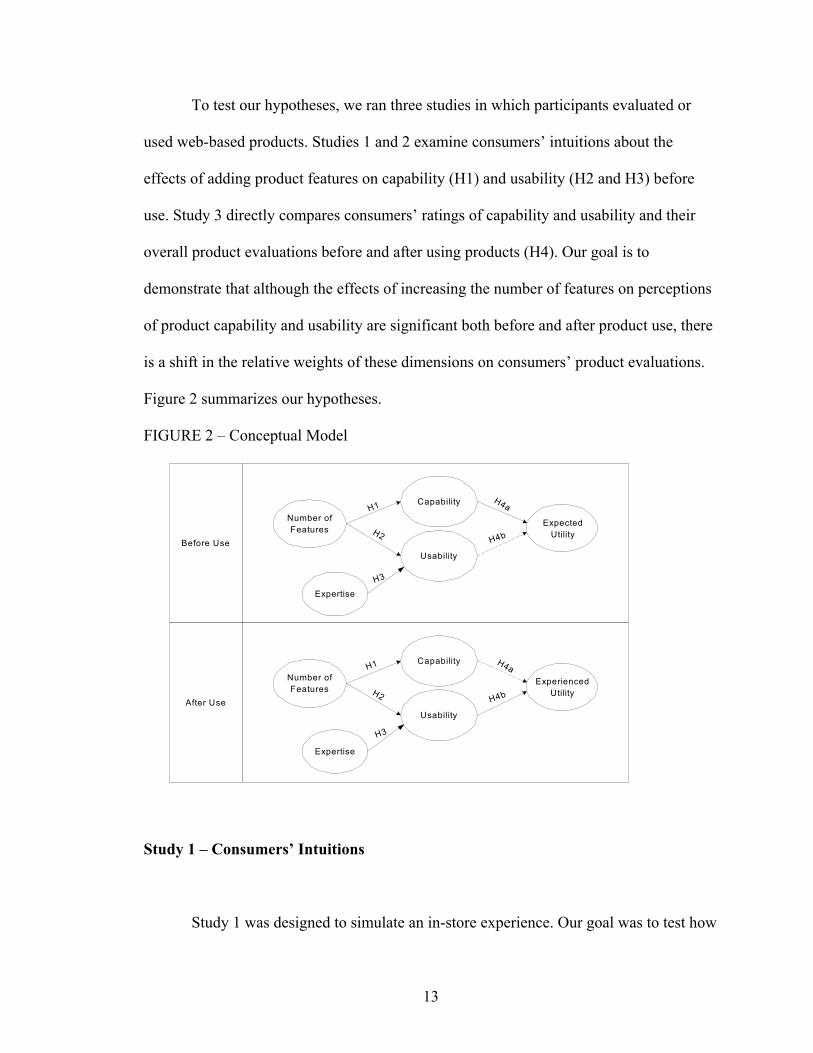
To test our hypotheses, we ran three studies in which participants evaluated or
used web-based products. Studies 1 and 2 examine consumers’ intuitions about the
effects of adding product features on capability (H1) and usability (H2 and H3) before
use. Study 3 directly compares consumers’ ratings of capability and usability and their
overall product evaluations before and after using products (H4). Our goal is to
demonstrate that although the effects of increasing the number of features on perceptions
of product capability and usability are significant both before and after product use, there
is a shift in the relative weights of these dimensions on consumers’ product evaluations.
Figure 2 summarizes our hypotheses.
FIGURE 2 – Conceptual Model
Number ofFeatures
Capability
Usability
Expertise
Before Use
Number ofFeatures
Capability
UsabilityAfter Use
ExpectedUtility
ExperiencedUtility
Expertise
H1
H2
H4a
H4b
H3
H1
H2
H3
H4a
H4b
Study 1 – Consumers’ Intuitions
Study 1 was designed to simulate an in-store experience. Our goal was to test how

14
consumers’ intuitions about product capability and usability were related to the number
of product features (H1 and H2) and whether perceived usability was related to expertise
(H3).
Consumers’ involvement in the evaluation task may affect their motivation to
process product information (Celsi and Olson 1988). For example, highly involved
consumers are more likely to elaborate on product information and form inferences (Celsi
and Olson 1988). Thus, involvement with the task could potentially affect participants’
judgments about product capability and usability. To control for this, we manipulated
involvement across conditions.
Stimuli
To develop the stimuli for our studies, we conducted a pretest in which 40
participants (69% females, Mage = 21.8) rated the importance of and their familiarity with
thirty features of the following four products: a digital audio player, a digital video
player, a personal digital assistant (PDA), and an online product-rating database.
Participants also rated their involvement and expertise for each product category. We
selected digital audio players and digital video players because participants were
involved and familiar with these product categories. Three models of each product were
created, differing only in their number of features. The low level of features included the
seven most important features, the medium level included the fourteen most important
features and the high level included the twenty-one most important features (list of
features are shown in Appendix 1).

15
Participants, Design, and Procedures
One hundred and thirty undergraduate students participated in this study (50.8%
females, Mage = 20.5) and were randomly assigned to conditions. The study had a 2
Player (video, audio) x 3 Feature (low, medium, high) x 2 Involvement (low, high) mixed
design. Player and involvement were manipulated between subjects and number of
features was manipulated within subjects. In the high involvement condition, we told
participants that after they evaluated three models, they would choose one model to
perform a series of tasks. Low involvement participants were simply told they would be
evaluating three models of video (audio) players. The study was conducted using
MediaLab software, and sessions were run in a computer lab with groups of three to
eighteen students. Participants worked individually.
First, participants rated their expertise with digital video (audio) players. Next,
they viewed the user interface and the list of features for each model. Participants rated
their perceptions of each model’s capability and usability, and then provided an overall
evaluation of each model. The order in which participants evaluated the low, medium and
high feature models was counterbalanced between subjects, according to a standard self-
conjugate Latin square. After rating all three models, participants were asked to choose
one of the models.
Measures
Participants’ expertise was measured using five items (e.g. how familiar are you
with digital video [audio] players, how frequently do you watch videos [listen to music]
on your computer, Mitchell and Dacin 1996). Product capability was measured using

16
three items (extent to which the products were likely to perform poorly/well, offer few/a
lot of advantages and add little/a lot of value, Mukherjee and Hoyer 2001). Product
usability was measured using eight items (e.g.. learning to use this product will be easy
for me, interacting with this product will not require a lot of my mental effort, it will be
easy to get this product to do what I want it to do, Chin, Diehl and Norman 1988).
Product expected utility was measured using six items (bad/ good, unlikable/likable, not
useful/useful, low/high quality, undesirable/desirable, unfavorable/ favorable, Peracchio
and Tybout 1996). After choosing one of the models, participants rated their decision
confidence and the difficulty of the choice. All items used seven-point scales.
Results
Reliability for expertise, capability, usability and product overall evaluations all
exceeded .83. To assess the construct validity of our capability, usability and overall
product evaluation scales, we ran a confirmatory factor analysis for each of the low,
medium and high feature models. A three-factor model indicated an acceptable goodness
of fit and significant loadings for each observed variable in their respective latent factor
(all ps <.001)2. Involvement did not affect any dependent measures (all ps > .13), and we
collapsed the data across involvement conditions.
To test hypothesis 1, we ran a 2 (player) x 3 (features) repeated measures
ANCOVA on product capability with expertise as a covariate. There was a main effect of
2 The comparative fit indexes (CFI) ranged from .91 to .93, capability items loadings ranged from .58 to .95, usability items loadings ranged from .70 to .96, and overall evaluation items ranged from .49 to .96. Each of the three factors had an average extracted variance larger than 62%. Capability and usability were not correlated for any of the models. Capability was correlated with overall evaluations for all three models (rlow = .76 , rmedium = .83, rhigh = .69, all ps <.001) and usability was correlated with overall evaluations for the high feature model (r = .29, p < .001).
17
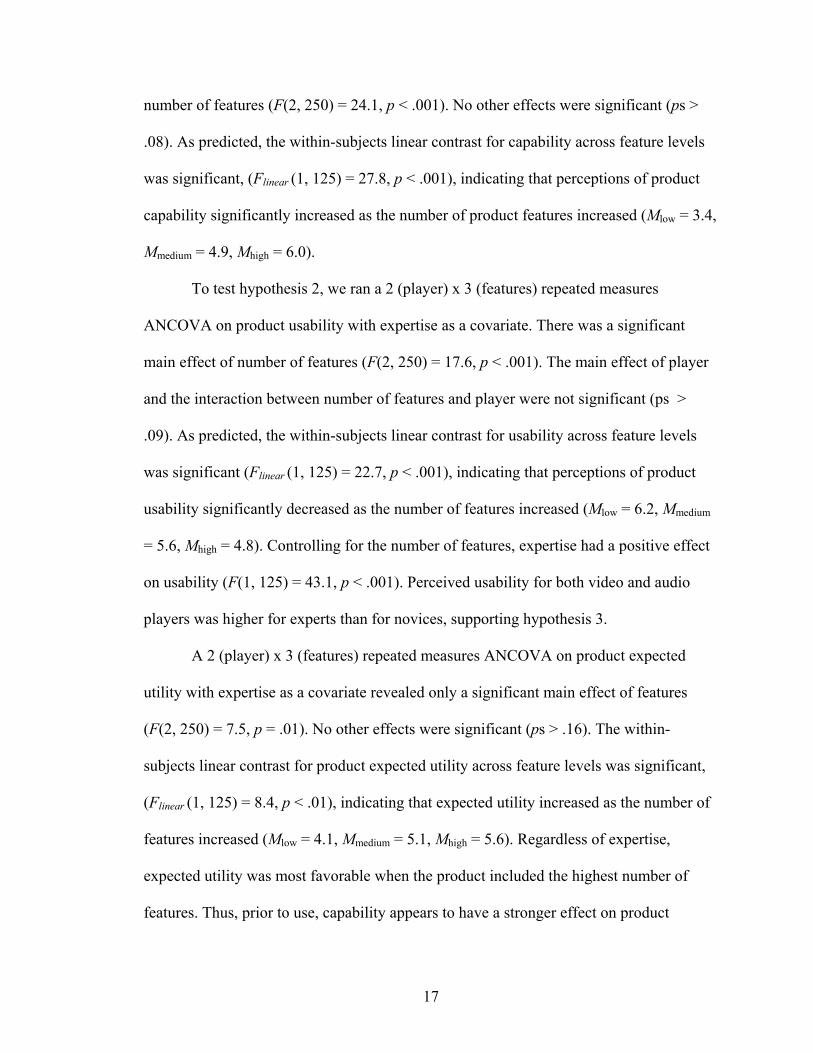
number of features (F(2, 250) = 24.1, p < .001). No other effects were significant (ps >
.08). As predicted, the within-subjects linear contrast for capability across feature levels
was significant, (Flinear (1, 125) = 27.8, p < .001), indicating that perceptions of product
capability significantly increased as the number of product features increased (Mlow = 3.4,
Mmedium = 4.9, Mhigh = 6.0).
To test hypothesis 2, we ran a 2 (player) x 3 (features) repeated measures
ANCOVA on product usability with expertise as a covariate. There was a significant
main effect of number of features (F(2, 250) = 17.6, p < .001). The main effect of player
and the interaction between number of features and player were not significant (ps >
.09). As predicted, the within-subjects linear contrast for usability across feature levels
was significant (Flinear (1, 125) = 22.7, p < .001), indicating that perceptions of product
usability significantly decreased as the number of features increased (Mlow = 6.2, Mmedium
= 5.6, Mhigh = 4.8). Controlling for the number of features, expertise had a positive effect
on usability (F(1, 125) = 43.1, p < .001). Perceived usability for both video and audio
players was higher for experts than for novices, supporting hypothesis 3.
A 2 (player) x 3 (features) repeated measures ANCOVA on product expected
utility with expertise as a covariate revealed only a significant main effect of features
(F(2, 250) = 7.5, p = .01). No other effects were significant (ps > .16). The within-
subjects linear contrast for product expected utility across feature levels was significant,
(Flinear (1, 125) = 8.4, p < .01), indicating that expected utility increased as the number of
features increased (Mlow = 4.1, Mmedium = 5.1, Mhigh = 5.6). Regardless of expertise,
expected utility was most favorable when the product included the highest number of
features. Thus, prior to use, capability appears to have a stronger effect on product

18
expected utility than usability. Figure 3 shows the impact of increasing the number of
features on ratings of capability, usability, and expected utility for the video player.
FIGURE 3 – Effects of Number of Features on Dependent Variables for the Digital
Video Player
1
2
3
4
5
6
7
Low # features Medium # features High # of features
Capability Usability Expected Utility
After evaluating the three models, participants chose one of them to perform a
series of tasks. Participants’ choices strongly indicated a preference for products with a
higher number of features and greater capability, regardless of expertise. The majority of
the respondents chose the model with the highest number of features (62.3%) rather than
the model with a medium number of features (28.5%) or the model with the lowest
number of features (9.2%). A multinomial logistic regression of player and expertise on
choice showed that neither of these factors affected choice (all ps > .55). Interestingly,
despite the lack of difference in their choices, novices3 rated the difficulty of choosing
marginally higher than experts (F(1, 128) = 3.5, p = .06), and experts were more
confident in their choices than novices (F(1, 128) = 9.8, p < .01).
3 Based on a median split on the expertise variable (median = 4.0).
19
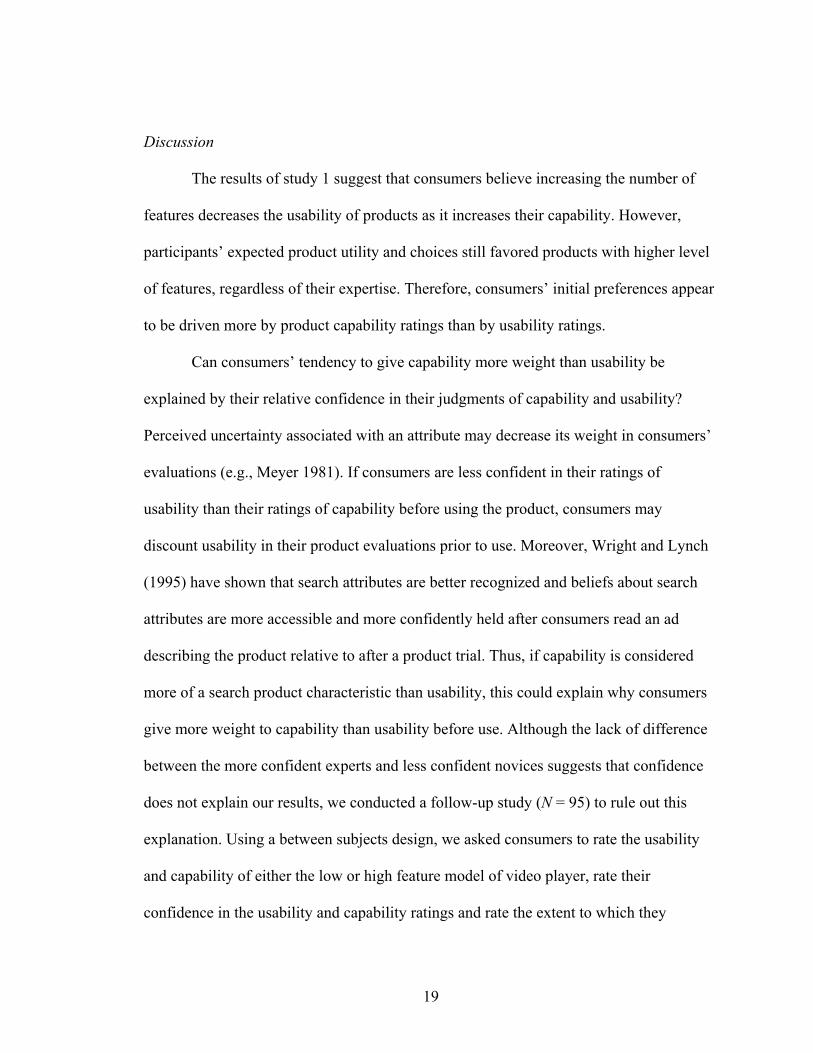
Discussion
The results of study 1 suggest that consumers believe increasing the number of
features decreases the usability of products as it increases their capability. However,
participants’ expected product utility and choices still favored products with higher level
of features, regardless of their expertise. Therefore, consumers’ initial preferences appear
to be driven more by product capability ratings than by usability ratings.
Can consumers’ tendency to give capability more weight than usability be
explained by their relative confidence in their judgments of capability and usability?
Perceived uncertainty associated with an attribute may decrease its weight in consumers’
evaluations (e.g., Meyer 1981). If consumers are less confident in their ratings of
usability than their ratings of capability before using the product, consumers may
discount usability in their product evaluations prior to use. Moreover, Wright and Lynch
(1995) have shown that search attributes are better recognized and beliefs about search
attributes are more accessible and more confidently held after consumers read an ad
describing the product relative to after a product trial. Thus, if capability is considered
more of a search product characteristic than usability, this could explain why consumers
give more weight to capability than usability before use. Although the lack of difference
between the more confident experts and less confident novices suggests that confidence
does not explain our results, we conducted a follow-up study (N = 95) to rule out this
explanation. Using a between subjects design, we asked consumers to rate the usability
and capability of either the low or high feature model of video player, rate their
confidence in the usability and capability ratings and rate the extent to which they

20
consider capability and usability a search or experience product characteristic. As
expected, ratings of capability significantly increased with number of features (Mlow =3.6,
Mhigh = 5.5, F(1, 93) = 74.2, p <.001) and ratings of usability significantly decreased with
number of features (Mlow =6.1, Mhigh = 5.5, F(1, 94) = 6.7, p <.001). Interestingly,
participants indicated that they were significantly more confident in their usability ratings
(M = 5.6) than in their capability ratings (M = 4.8, t(94) = -6.71, p < .001), suggesting
that confidence does not explain why consumers give capability more weight than
usability in expected product utilities. Additionally, participants rated product capability
and usability equally in the scale of search or experience dimension (Mcap = 4.7, Musab=
4.9, t(94) = 1.5, p =.12).
One limitation of study 1 is that varying the number of features within subjects
may have increased the salience of the number of features when judging capability and
usability. However, a replication of study 1 using a between-subjects design produced the
same results, indicating that salience does not explain the effect.4 We also address this
concern by using a between-subjects design in study 2. A second limitation of study 1 is
that because the three models of video and audio players were the same for all
participants, they may have included features that participants did not consider important,
potentially decreasing usability without adding significant capability. While this is a
realistic choice situation – companies often find it cheaper to produce feature-rich
products that can satisfy the needs of heterogeneous consumers than to produce more
narrowly targeted products with fewer features – we would like to disentangle supply
4 In the follow-up study (N = 73), participants were shown only one model of the video player (either low or high feature) and were asked to provide product evaluations. The results were consistent with those of study 1. Perceived capability increased with number of features (F(1,71) = 23.8, p < .001), perceived usability decreased with number of features (F(1, 69) = 3.9, p = .05), and expected utility increased with number of features (F(1, 69) = 8.2, p < .01).

21
side and demand side explanations for feature fatigue. In study 2, we allow participants to
customize their products, so that the products being evaluated include only desired
features.
Study 2 – Customizing a Product
In study 2, participants customized their own products by selecting the features
they would like to add from a list of features. We predicted that consumers who chose
more features would perceive their products to have more capability but less usability
than consumers who chose fewer features. Support for hypothesis 2 will show that
consumers predict degradation in usability as the number of features increases, even
when products include only desirable features.
Participants, Design, and Procedures
One hundred forty one undergraduate students (55.3% females, Mage = 21.1)
participated in this study. Participants were asked to imagine they were about to subscribe
to and download a new digital audio player and a digital video player, and that they
would have the opportunity to choose the features they wanted. Product category was
manipulated within subjects. The order in which they designed the two products was
counterbalanced between subjects.
As in study 1, we used a digital audio player and a digital video player as our
products. For each product, we presented participants with 25 different features that they
could select. Participants checked off each feature they wanted to include in the product

22
they were buying. To isolate the effects of usability constraints from the effect of
financial constraints, they were informed that their budget for the purchase would allow
them to select as many features as they liked. After selecting features, participants rated
the product’s perceived capability and usability. Product capability, product usability, and
expertise were measured using the same scales as in study 1. Participants also rated their
familiarity with each feature and the importance of each feature (1= not at all
important/familiar, 7 = very important/familiar).
Results
The reliability for expertise, capability, and usability ranged from .78 to .93. A
confirmatory factor analysis on the capability and usability measures for each media
player supported the construct validity of these constructs. A two-factor solution yielded
a reasonable goodness of fit and significant loadings of each observed variable in their
respective factor (all ps < .001).5 The order in which participants customized the products
was not correlated with any of our measures (all ps > .10), except with usability for the
video player (p = .04). We included order as a covariate in all analyses related to the
perceived usability of the video player.
The average number of features chosen among the 25 available was 19.6 (sd =
4.8) for the video player and 19.6 (sd = 4.3) for the audio player. Approximately half of
the sample chose more than 80% of the available product features, and the median
number of features chosen for both players was 20. Interestingly, while the specific
features chosen by experts and novices differed, the number of features chosen by experts 5 The comparative fit indexes (CFI) ranged from .95 to .96. Capability loadings ranged from .66 to .83 (average extracted variance was larger than 54%). Usability loadings ranged from .46 to .92 (average extracted variance was larger than 64%). The correlation between the two factors was not significant.

23
and novices did not differ (ps > .25). Experts reported significantly greater familiarity
with all 25 video player features and with 23 of the 25 audio player features. The features
chosen more frequently by experts were among those rated least familiar by novices. For
example, the three audio player features chosen significantly more frequently by experts
than novices, the equalizer/bass boost, pre-amp and equalizer settings, and encoded
filename control, were three of the seven features for which the difference in familiarity
ratings between experts and novices was largest.
Hypothesis 1 predicts that participants who choose more features will perceive
their products as having greater capability than participants who choose fewer features.
As expected, when we regressed ratings of product capability on the number of selected
features and expertise, we found a positive and significant effect of number of features
for both the video player (β = .50, t = 6.9, p < .001) and the audio player (β = .47, t = 6.2,
p < .001), supporting hypothesis 16. The effect of expertise on capability was not
significant for either the video or audio player (ps > .07).
We predicted that usability would have a negative relationship with number of
features (H2) and a positive relationship with expertise (H3). We found a significant
negative effect of number of selected features on the perceived usability of the video
player (β = -.16, t = -2.2, p = .03)7. However, the effect was not significant for the audio
player (β = .01, t = .70, p = .48). Thus, the findings partially support hypothesis 2.
Controlling for the number of features, expertise had a significant positive effect on
perceived usability for both players (video player β = .52, t = 7.0, p < .001; audio player β
6 Using a median split on the number of selected features, we created two levels of features (low and high). The effect of features on perceived capability was significant in the low and high feature groups (p’ s <.05) for the video player and in the high feature group for the audio player (p <.05). 7 Running the regression analysis in the low and high feature groups (median split) separately indicates no significant effect of number of features on usability (p >.40).

24
= .98, t = 52.9, p < .001), supporting H3.
Discussion
Overall, the results of study 2 support our predictions. The number of features
participants selected increased perceived product capability for both products and
decreased perceived product usability for one of the two products. Thus, the connection
between adding product features and decreasing usability seems to hold even when the
consumer individually selects each of the included features. Consistent with our
expectations, expertise significantly improved ratings of product usability but did not
affect ratings of product capability.
On average, participants chose a very high number of features, again suggesting
that a desire for capability is driving decisions more than a desire for usability.
Interestingly, the average number of features chosen in study 2 was nearly the same as
the number of features in study 1’s high feature condition. Using two different types of
choice tasks, participants clearly favored high feature products over low feature products.
However, studies 1 and 2 test choices prior to using products. In study 3, we compare the
ratings of participants who have not used the product with ratings of participants who
have used the product.
Study 3 – Contrasting Evaluations Before and After Product Use
In our third study, we compared consumers’ evaluations of products with a low,
medium or high number of features before use and after use. As predicted by hypothesis

25
4, we expected that consumers would give more weight to capability before use relative
to after use, and less weight to usability before use relative to after use.
Participants, Design and Procedures
One hundred and ninety participants (52.1% males, Mage=20.5) were randomly
assigned to conditions using a 2 Product Use (before, after) x 2 Feature (low, high)
between subjects design. The study was conducted using MediaLab software, and
sessions were run in a computer lab with groups of 2 to 18 students. Participants worked
individually. Each participant evaluated one model of the product, either before or after
product use. Using a between-subjects design was critical because making predictions
about capability or usability before use can bias participants’ evaluations of the product
after use (Jones 1977).
The product used in this study was the same digital video player participants
evaluated in study 1. Two working models of the product were created, one with seven
features (low features condition) and one with 21 features (high features condition).
Participants who used the product were provided with a manual of the video player
describing the features of their model and how to use them. In the low features condition,
the manual had four pages and in the high features condition, the manual had eight pages.
The layout of the manual was identical across conditions (see Appendix 1 for a list of
features).
Participants were asked to imagine that they were considering subscribing to and
downloading a new digital video player. In the before use condition, participants viewed
the user interfaces and a list of features for three models of players, one with a low

26
number of features (7 features), one with a medium number of features (14 features), and
one with a high number of features (21 features). The order of presentation was
counterbalanced between subjects. Participants evaluated either the low or high feature
model and then chose their preferred model.
Participants in the after product use condition were told that they would use one
model of a new digital video player. They were asked to perform a series of four tasks
using either the low or high feature model of the player. These tasks included choosing a
specific movie from a play list, watching parts of the movie, modifying the audio
settings, and recording parts of another movie available in the play list. After completing
these tasks, participants were free to use the player at their leisure. Next, participants
evaluated the product they used. After completing their evaluations, they viewed the user
interfaces and a list of features for two additional models of digital video players (e.g.,
models with a low and medium number of features if they had used the high features
model). The order of presenting the other two models was counterbalanced between
subjects. Finally, participants chose their preferred model.
Measures
Expertise and product usability were measured as in studies 1 and 2. Product
capability was measured using three items (this digital video player performs many
functions/ has many capabilities/ has a large number of features). Expected and
experienced utilities were measured separately using the six-item measure for overall
product evaluation used in study 1 and one item about product satisfaction (how satisfied
would you be if you subscribed to the digital player in the before use condition, how

27
satisfied were you with the digital player you used in the after use condition). All items
were measured using seven-point scales.
After participants had either evaluated or used one of the models, we asked them
to choose one of the three models. As in study 1, participants rated their confidence in
their decision and the difficulty of making the decision. We also recorded participants’
clickstreams as they used the video player in the after use condition. We gathered
information on how many tasks were completed, the time it took to complete the tasks,
and how long they used the player.
Results
The reliability of the multiple item scales ranged from .89 to .98. A confirmatory
factor analysis on the capability, usability and overall product evaluation scales showed
an acceptable goodness of fit for the three-factor solution and significant loadings for
each observable variable in their respective latent factors (all ps <.001).8 Because order
was not significant for any of the dependent variables (all ps > .06), we collapsed the data
across order conditions for subsequent analyses. Table 1 shows the means of the
dependent variables across conditions.
8 The comparative fit index (CFI) was .93. Capability loadings ranged from .94 to .97 (average extracted variance = 91%). Usability loadings ranged from .52 to .93 (average extracted variance = 64%), and overall evaluation loadings ranged from .55 to .92 (average extracted variance = 70%). The correlation between usability and capability was not significant. Overall evaluations were correlated with capability (r = .63, p < .001) and usability (r = .29, p < .001).

28
TABLE 1 – Effect of Number of Features on Dependent Variables
Product
Use Number of Features
Product Capability
Product Usability
Product Evaluations
Product Satisfaction
Before Low
2.7a (1.2)
6.0a (.9)
4.0a (1.2)
3.4a (1.6)
High
6.2b (.9)
5.1b (1.1)
5.6b (1.0)
5.6b (1.0)
After Low
3.7c (1.3)
5.8a (1.1)
5.0c (1.0)
5.2bc (1.1)
High
4.3d (1.3)
4.8b (1.4)
4.7c (1.3)
4.9c (1.6)
NOTE. N = 190 participants. Standard deviations are in parentheses. Different superscripts in the same column indicate difference between means is significant (p < .05).
A 2 (product use) x 2 (features) ANCOVA on perceived capability with expertise
as a covariate showed a significant main effect of number of features (F(1, 185) = 132.9,
p < .001), indicating that capability increased with the number of features (Mlow = 3.2,
Mhigh = 5.2). Thus, hypothesis 1 is supported. In addition, we found a significant main
effect of product use (F(1, 185) = 5.2, p = .02). Perceived product capability was lower
after use (Mbefore = 4.0) than before use (Mafter = 4.4). The interaction between number of
features and product use on ratings of capability was also significant (F(1, 185) = 67.2, p
< .001), indicating that the number of features had a smaller effect on perceptions of
product capability after use, relative to before use. The effect of expertise on perceived
product capability was not significant (p > .60).
A 2 (product use) x 2 (features) ANCOVA on perceived usability with expertise
as a covariate showed that usability significantly decreased with the number of features
(F(1, 185) = 33.1, p < .001), supporting hypothesis 2 (Mlow = 5.9, Mhigh = 4.9). Consistent
with hypothesis 3, participants’ expertise had a positive effect on their perceptions of
product usability (F(1, 185) = 12.7, p < .001). No other effects were significant (ps >
.17).

29
Consistent with H4, a 2 (product use) x 2 (features) ANCOVA on overall product
evaluations with expertise as a covariate revealed a main effect of features (Mlow = 4.5,
Mhigh = 5.1, F(1, 185) = 15.8, p < .001) that was qualified by a significant interaction
between features and product use (F(1, 185) = 31.5, p < .001). Controlling for expertise,
product evaluations before use significantly increased with number of features (Mlow =
4.0, Mhigh = 5.6, F(1, 91) = 49.0 , p < .001), but product evaluations after use did not
(Mlow = 5.0, Mhigh = 4.7, F(1, 93) = 1.6, p = .20). The effect of expertise on participants’
overall product evaluations was not significant (p > .40). A 2 x 2 ANCOVA on product
satisfaction produced very similar results.
To investigate the relative weights of product capability and usability on
consumers’ product utilities before and after product use, we ran a multisample path
analysis using maximum likelihood estimation.9 Number of features, expertise, and their
interaction entered the model as independent variables. We partialled out the main effects
of number of features and expertise from the interaction effect, and used the regression
unstandardized residuals as the interaction term. Product capability and usability were
mediator variables. We estimated the coefficients with two different dependent variables
reflecting product utility: overall product evaluations and satisfaction. All goodness-of-fit
indices were in an acceptable range.10 The interaction between number of features and
expertise was not significant (ps > .11). Table 2 shows the standardized path coefficients
before and after product use.
9 We also estimated the models using partial least squares (PLS), and results were consistent with those obtained using maximum likelihood estimation. 10 The comparative fit index was .95 in the before use sample and .99 in the after use sample. All χ2 tests > .07.
30
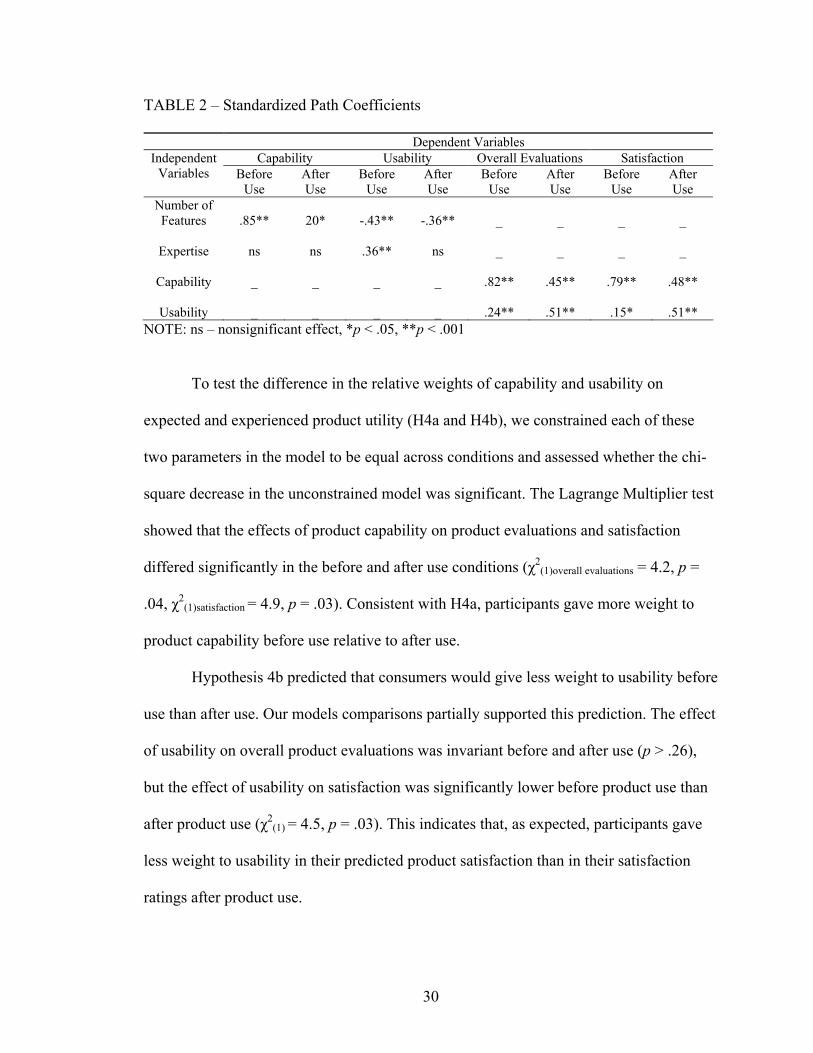
TABLE 2 – Standardized Path Coefficients
Dependent Variables Capability Usability Overall Evaluations Satisfaction Independent
Variables Before Use
After Use
Before Use
After Use
Before Use
After Use
Before Use
After Use
Number of Features
.85**
20*
-.43**
-.36**
_
_
_
_
Expertise
ns
ns
.36**
ns
_
_
_
_
Capability
_
_
_
_
.82**
.45**
.79**
.48**
Usability
_
_
_
_
.24**
.51**
.15*
.51**
NOTE: ns – nonsignificant effect, *p < .05, **p < .001
To test the difference in the relative weights of capability and usability on
expected and experienced product utility (H4a and H4b), we constrained each of these
two parameters in the model to be equal across conditions and assessed whether the chi-
square decrease in the unconstrained model was significant. The Lagrange Multiplier test
showed that the effects of product capability on product evaluations and satisfaction
differed significantly in the before and after use conditions (χ2(1)overall evaluations = 4.2, p =
.04, χ2(1)satisfaction = 4.9, p = .03). Consistent with H4a, participants gave more weight to
product capability before use relative to after use.
Hypothesis 4b predicted that consumers would give less weight to usability before
use than after use. Our models comparisons partially supported this prediction. The effect
of usability on overall product evaluations was invariant before and after use (p > .26),
but the effect of usability on satisfaction was significantly lower before product use than
after product use (χ2(1) = 4.5, p = .03). This indicates that, as expected, participants gave
less weight to usability in their predicted product satisfaction than in their satisfaction
ratings after product use.

31
Additional Analysis
Decomposing the direct and indirect effects in our model, we found that before
product use the indirect effect11 of product features on overall product evaluations
mediated by product capability was strong (β = .70, p < .001), and overshadowed the
significant negative indirect effect of product features through usability (β = -.10, p <
.01), yielding a positive net effect. After product use this pattern reversed. The indirect
effect of features through capability became nonsignificant (β = .09, p > .05), and the
indirect effect of features through usability was negative and significant (β = -.18, p =
.001), resulting in a negative net effect. The indirect effects of number of product features
on satisfaction followed the same pattern.
Participants’ choices of players before and after product use suggest a substantial
decrease in the share of the high feature model. The majority of the respondents in the
before use condition (66%) chose the high feature model as their preferred player.
However, a significantly lower percentage of the participants who had used the high
feature model (44%) chose the high feature model (z = 2.5, p = .01) even though they had
already invested time learning to use this model. Moreover, participants who used the
high feature model were less confident in their choices (Mhigh = 4.7) than participants who
used the low feature model (Mlow = 5.4, F(1, 94) = 5.8, p = .02), and they rated the choice
as more difficult (Mhigh = 3.1) than participants who used the low feature model (Mlow=
2.3, F(1, 94) = 5.7, p = .02). Controlling for expertise, participants’ confidence in their
choices was lower after use (Mafter = 5.0) than before use (Mbefore = 5.8, F(1, 185) = 14.8,
p <.001), suggesting that usage does not enhance confidence in product evaluations.
Finally, we analyzed the usability data. There was no difference in the number of 11 The significance level of all indirect effects was computed using the Sobel t statistic.

32
tasks completed in the low and high feature conditions (Mlow = 3.2, Mhigh = 3.1, p = .45).
The number of tasks completed was positively correlated with perceived product
usability (r = .30, p < .01). Participants in the high feature condition spent marginally
more time completing the four tasks than participants in the low feature condition (Mlow =
6.9 min., Mhigh = 9.2 min., F(1, 94) = 3.4, p = .07). The amount of time required to
complete the four tasks was negatively correlated with both participants’ expertise (r = -
.31, p < .01) and perceived product usability (r = -.23, p = .05).
Discussion
The results of study 3 show that using a product structurally changes consumers’
preferences. Supporting our predictions, consumers gave more weight to capability and
less weight to usability in their expected utilities, relative to their experienced utilities.
After product use, consumers no longer evaluated the product with the highest number of
features more favorably, supporting the existence of a feature fatigue effect. Our findings
also suggest that consumers’ expertise does not eliminate the feature fatigue effect. The
shift in preferences before and after use occurred just as strongly for experts as for
novices.
General Discussion
Our goal in this research was to examine the effects of increasing the number of
product features on consumers’ expected and experienced product utilities. In three
studies, we showed that increasing the number of product features has a positive effect on
33
perceived capability, but a negative effect on perceived usability. Thus, whether adding
desirable, important features to a product will increase or decrease utility depends on the
relative weights of capability and usability in consumers’ utility functions. Study 3’s
results indicate that consumers assign more weight to product capabilities in their
evaluations before than after use, and less weight to product usability in their satisfaction
ratings before than after use. Thus, what looks attractive in prospect does not necessarily
look good in practice: when using a product, consumers may become frustrated or
dissatisfied with the number of features they desired and chose before using the product.
In short, product capability may become too much of a good thing.
These changes in the relative weights of product capability and usability are
consistent with our hypotheses based on construal level theory. Before using a product,
consumers seem to be more focused on desirability issues and have higher-level
representations of the product (e.g., why is this product good?). Conversely, after using a
product, consumers may develop lower level product representations that are more
focused on feasibility concerns (e.g., how do I use this product?). Because different
considerations are salient in expected and experienced utility, consumers tend to choose
overly complex products that do not maximize long-term satisfaction. In future research,
it will be important to examine factors that affect consumers’ product construals. For
example, encouraging consumers to think concretely as they choose products might make
usability more salient, helping consumers choose more satisfying products. We explore
this possibility in essay 2.
In some respects, our studies presented a conservative test of our hypotheses.
First, we used college students as our sample, a demographic segment that tends to be

34
more open to new technology and new features than other segments. The negative effects
of adding features on usability are likely to be stronger for segments that are less
comfortable with technology. For instance, a recent nationwide survey about individuals’
technology readiness (NTRS 2004) indicated that after buying a high-tech product, about
56% of consumers feel overwhelmed by the complexity of the product, and this
percentage is positively correlated with age (r = .24, p < .001). Second, our high feature
product had only 21 features, a relatively low number of features in some product
categories. For example, the dashboard of the BMW 745 automobile has over 700
features. Future research should test for nonlinearities in the effects of adding features on
product evaluations. It is not clear whether the effects of adding features on capability
and usability will taper off after a certain threshold or whether sensitivity to added
features might increase as features are added. Finally, our studies only considered
features that added functionality to the product and were reasonably familiar to the
participants. The negative effect of unimportant or highly complex features on product
utility is likely to be stronger.
Future research should also examine consumers’ reactions to product features
over a longer period of time. Our product use manipulation was a product trial that took
place during a single experimental session. Even if consumers learn about the negative
effects of too many features on satisfaction after a usage experience, this learning might
be forgotten in future purchase situations, when product capability again becomes the key
driver of evaluations. Exactly what consumers learn about feature fatigue remains an
unanswered question. Do they attribute lack of usability to the large number of features
included in the model they chose, or do they attribute lack of usability to the brand? If

35
consumers blame the brand, dissatisfaction due to feature fatigue in one product category
may impact firms’ sales in different categories.
In practice, consumers use a variety of strategies to cope with technology, which
may include either consumption avoidance strategies (e.g., neglect, distancing,
abandonment) or consumption confrontative strategies (e.g. mastering, partnering; Mick
and Fournier 1998). If consumers use avoidance strategies, the effect of product features
on experienced utility is likely to remain strong. However, if consumers use confrontative
strategies, the effects of product features on usability and experienced utility may
decrease over time. Thus, the ultimate effect of adding features on consumers’ welfare
depends on the consumption strategies they use.
Although supply-side explanations for the proliferation of product features
abound, our results demonstrate that demand-side explanations are sufficient for feature
fatigue to occur. It is certainly true that companies often find it cheaper to produce
feature-rich products that can satisfy the needs of heterogeneous consumers than to
produce more narrowly targeted products with fewer features. However, companies often
add features to products because they believe their customers want more features. Indeed,
our results suggest that even conducting market research may not eliminate the problem.
If companies conduct market research by asking customers to evaluate products without
using them, too much weight will be given to capability relative to usability, and it is
likely that too many features will be added to the products.
Because our findings demonstrate that usage experiences change the structure of
consumers’ preferences, they have important theoretical implications. The impact of
consumption experiences on consumers’ evaluations of products is an understudied area.
36
Consumer behavior researchers have traditionally been more interested in pre-purchase
processes such as information processing, decision-making and choice (Bazerman 2001).
Although the services literature has long recognized the importance of relationship
duration, ongoing usage levels and satisfaction (e.g., Bolton and Lemon 1999), this
literature has focused on changes over time, and has not developed theoretical
frameworks to explain why consumers’ underlying preferences might change. Given that
the economy is moving towards a service-dominant logic (Vargo and Lusch 2004) where
customer lifetime value is the most important business asset, understanding the effects of
usage experiences on preferences is critical.
Managerial Implications
Our research has several important managerial implications. First and foremost,
our findings call into question the predictive power of attribute-based models for
determining the optimal number of features. Firms planning new products or considering
product improvements typically use market research techniques such as conjoint analysis
or discrete choice analysis. The conjoint model, for example, defines the product as a
bundle of attributes and estimates part-worths for each attribute. Because market shares
are predicted based on these part-worths, each positively-valued feature increases a
product’s market share relative to products without the feature. Our results suggest
traditional conjoint analysis can lead to marketing myopia, where firms maximize initial
sales. This happens because usability, a global rather than an attribute-based
characteristic, is underweighted by consumers before product use, but becomes a critical

37
element in consumers’ satisfaction during use. Our results suggest that a product use
experience may be required to increase the salience of usability so that its relevance in
choice approaches its relevance in use. Thus, consumers’ preferences may be more
accurately predicted using customer-ready prototypes and product-in-use research
(Srinivasan, Lovejoy and Beach 1997).
Another managerial decision making challenge is that because additional features
can differentiate a product from competitors (Carpenter, Glazer and Nakamoto 1994) and
add desired functionality, the benefits of adding new features to products are evident.
However, managers rarely consider the full cost of adding features. The financial costs of
adding new features are typically weighted more heavily than intangible customer
usability costs. Thus, as the marginal cost of adding features decreases, approaching zero
for information-based products (e.g., software), firms are likely to increase product
capability beyond the optimal level. This is a dangerous trend: our empirical findings
suggest that adding features may damage firms’ profitability by decreasing the usability
of products and consumers’ satisfaction with them.
What can firms do to minimize feature fatigue? Our findings suggest that
managers should consider offering a wider assortment of simpler products, instead of all-
purpose, feature-rich products. Instead of packing one model with many features to
address market heterogeneity, firms might enhance consumer satisfaction by developing
more tailored products with limited sets of capabilities that appeal to different segments.
Consumers can now purchase a single product which functions as a cell phone, game
console, calculator, text messaging device, wireless internet connection, PDA, digital
camera, MP3 player, and GPS system. However, while purchasing this highly complex

38
product may provide the consumer with bragging rights, utilizing all of its features will
undoubtedly require extensive study. Importantly, each function the consumer does not
actually use adds to the difficulty of learning to use the product, without providing any
functional benefit.
A challenge of creating and marketing more narrowly targeted products is that
choosing among a wider variety of products can be more difficult for consumers
(Schwartz 2004). Rather than using the heuristic of buying features they may need (but
are not sure they will need), consumers will have to think carefully about how they will
use the product and which features to purchase. Moreover, our empirical results suggest
that during the choice process, consumers will be tempted by products that offer greater
capability. To minimize feature fatigue, decision aids such as online or offline
recommendation agents that help consumers choose the right products for their needs
could be designed to increase the salience of usability as well as structure the decision
making process. Offering extended product trials also may help consumers learn which
products best suit their needs by increasing the salience of product usability. For
example, the companies that sell digital media players RealOne and WinAmp offer
potential users evaluation versions of their products. By decreasing the gap between
consumers’ preferences during choice and use, such strategies may increase both
customer satisfaction and customer lifetime value.

39
Chapter 2: Essay 2 – Shifting Mental Construal and Product
Preferences by Engaging in a Direct Product Experience12
Summary
In essay 2, we explore a theoretical account for the feature fatigue effect based on
construal level theory (Liberman and Trope 1998). We show that direct product
experiences (e.g., product trials) and indirect product experiences (e.g., reading a product
description or seeing a product on display) result in different levels of mental construal
and different product preferences. Study 1 demonstrates that direct experiences with a
product trigger the adoption of a more concrete mental construal and decrease
consumers’ preference for products that have more capability, but are more difficult to
use. Studies 2 and 3 show that inducing consumers to think concretely prior to an indirect
product experience decreases their preferences for enhanced products that have a higher
number of features, attenuating the significant effect of direct experience on preferences.
Finally, the results of study 4 indicate that the effects of a direct product experience on
mental construal continue over multiple uses of a product, suggesting that discrepancies
in consumers’ evaluations before and after using a product are not limited to the first
usage experience.
12 An article based on this research and co-authored with Rebecca W. Hamilton is under review at the Journal of Consumer Research.

40
Introduction
In essay 1, we demonstrate that there is a gap between consumers’ expected
utilities and their experienced utilities when they evaluate products. Our results indicate
that consumers give more weight to product capability and less weight to usability in
their evaluations before use, relative to after use. Changes in the relative weights of these
dimensions result in expected utilities and product choices that do not match consumers’
experienced utilities and do not maximize consumers’ satisfaction after use. Essay 2
explores a theoretical account for these discrepancies in preferences across indirect
product experiences, such as reading a product description or seeing a product on display,
and direct product experiences, in which consumers have hands-on experience with the
product.
Recently, several companies have publicized offers to allow consumers to try
their products before purchase (Daily 2005). For example, in selected Maytag stores,
consumers can haul in loads of dirty laundry to test different models of washers.
Similarly, REI staffers encourage bikers to pedal around the store parking lot before
buying a mountain bike and campers to assemble tents outside the store before selecting
one (Daily 2005). Will trying products before purchase help consumers select products
that satisfy their needs better than other methods of evaluating the products?
While consumers expect to try on shoes and test-drive cars before purchase,
consumers’ purchase decisions in most product categories are not based on direct
experiences with products. Instead, consumers rely on indirect experiences, such as
reading a product description or seeing a product on display. For example, when
shopping on the Internet or by catalog, consumers are presented with verbal and

41
sometimes visual descriptions of washers, bikes and tents, but cannot touch or use them.
Even when shopping in a brick-and-mortar store, where consumers can touch and
physically examine products, they usually cannot use them. In these cases, consumers
make their purchase decisions based upon an indirect product experience, even though
their post-purchase satisfaction is usually formed based on a direct experience using the
product.
Past research has suggested that the preferences of consumers who have a direct
product experience can differ systematically from those of consumers who have an
indirect product experience (e.g., Dahan and Srinivasan 2000). One reason preferences
may differ is that direct product experiences convey product information more effectively
than indirect product experiences (Smith 1993; Smith and Swinyard 1982, 1983).
Additional information provided by a direct product experience may lead to a revision in
the perceived values of product attributes (Goering 1985) or increase the strength of
consumers’ beliefs about product attributes compared to indirect experiences such as
exposure to advertising (Smith and Swinyard 1983). A second reason direct and indirect
product experiences can lead to preference reversals is that the context of evaluation is
often confounded with the type of product experience. Indirect product experiences are
often joint evaluations of multiple products (e.g., an in-store display), while direct
product experiences are more likely to focus on a single product (e.g., using the product
at home). Joint and separate evaluations can make different product attributes salient,
resulting in preference shifts (Hsee and Zhang 2004). Finally, a third reason is that
consumers may mentally represent products differently based on whether they are
engaging in an indirect or direct product experience. Specifically, because an indirect
42
experience allows more psychological distance between the consumer and the product
than a direct experience, the relative importance of desirability and feasibility
considerations may differ based on type of product experience. Such a change in
importance weights could influence preferences even if consumers have full information
about the product before use and the context of evaluation is the same before and after
use.
In this essay, we control for product information and the context of evaluation,
and we show that direct product experiences shift consumers’ mental construal and their
preferences for products with different number of features relative to indirect product
experiences. Mental construal refers to the way consumers mentally represent or construe
the target of their evaluations (Trope and Liberman 2000). Individuals’ psychological
distance from target events or objects influences their judgments, predictions and choices
by systematically changing the way they mentally represent or construe these targets
(Trope and Liberman 2003). Psychological distance is most often manipulated by varying
the time at which an experience is expected to take place. For example, in a recent study,
consumers were more likely to choose a product with an extra feature than a product with
a price discount when the time of purchase was more distant, while the reverse was true
when the time of purchase was less distant (Thomas, Chandran and Trope 2005).
Analogous to the effect of temporal distance, we propose that indirect
experiences with a product create more distant and abstract mental construals relative to
direct product experiences, leading to preferences for enhanced products (more features)
relative to basic products (fewer features). Thus, our goal is to expand construal level
theory to encompass the psychological distance between direct and indirect product

43
experiences, and to use this theory to explain changes in product preferences between
direct and indirect product experiences. In the next section, we briefly discuss research on
direct and indirect product experiences and construal level theory. Next, we present a
sequence of four studies designed to test our hypotheses. We conclude with a discussion
of our findings and their theoretical and managerial implications.
Comparing Indirect and Direct Product Experiences
Consumers’ experiences with a product vary in a spectrum from indirect to direct,
depending on their level of interaction with a product (Mooy and Robben 2002). For
instance, reading a product description or advertisement, being exposed to personal
selling presentations and seeing product displays are typically viewed as indirect product
experiences because in these situations consumers cannot fully interact with the product.
Product trials, on the other hand, provide fully interactive, hands-on experience with
products, and give the user direct product experience.
Past research in marketing has compared the effects of indirect and direct product
experiences in terms of the informational value they provide to consumers. When
consumers use products, they have the opportunity to test hypotheses about how the
products work and to engage in active learning rather than passive learning (Hoch and
Deighton 1989). Direct product experiences also may provide consumers with more
credible information than indirect experiences. Product trials tend to produce higher
levels of message acceptance than exposure to advertising messages because individuals
often discount advertising claims, but they rarely derogate themselves as sources (Smith
and Swinyard 1982, 1983). As a result of these differences, product trials have been

44
shown to produce higher consistency between consumers’ attitudes and behavior (Smith
and Swinyard 1983) and to generate greater belief confidence (Fazio and Zanna 1981;
Smith and Swinyard 1988) than exposure to advertising.
In addition to differences in the informational value they provide to consumers,
indirect and direct product experiences may provide a different context for product
evaluations. Consumers tend to compare products with each other (joint evaluation) prior
to use, whereas during a product trial they tend to focus their attention on a single product
(separate evaluation). Joint evaluation may cause consumers to overestimate the impact
of quantitative differences between alternatives (e.g., differences in the capacity of two
microwave ovens) on their utility relative to separate evaluation (Hsee and Zhang 2004).
Thus, the context of evaluation may change the importance weights of attributes (e.g.,
increasing the importance of microwave capacity relative to other attributes) when
consumers evaluate products.
We examine a different account for gaps in preferences resulting from direct and
indirect product experiences. We propose that controlling for product information and the
context of evaluation, indirect and direct product experiences trigger different levels of
mental construal and that this shift in mental construal is sufficient to produce significant
differences in product preferences.
Construal Level Theory
Construal level theory proposes that individuals’ psychological distance from
target events or objects influences their judgments by systematically changing the way

45
they mentally represent or construe these events (Trope and Liberman 2003). The greater
the psychological distance, whether the distance is temporal, spatial, or social, the greater
the likelihood that target events and objects will be represented abstractly (high-level
construal) rather than concretely (low-level construal). High-level construals consist of
abstract schemas that convey general, superordinate and essential features of objects or
events (Trope and Liberman 2000). In contrast, low-level, concrete construals convey
incidental, contextual and subordinate details of objects or events. For example, an action
such as using a digital video player can be mentally represented either as being
entertained (high-level) or as pressing buttons (low-level).
Several studies have tested construal level theory by comparing individuals’
responses to near and distant future events (e.g., Förster, Friedman and Liberman 2004;
Liberman and Trope 1998; Trope and Liberman 2000). This research shows that
individuals tend to use abstract construals when evaluating distant-future events (e.g., one
year from now) and concrete construals when evaluating near-future events (e.g.,
tomorrow). Abstract and concrete construals result in different emphasis on the
desirability and feasibility aspects of alternatives (Liberman and Trope 1998).
Desirability reflects the attractiveness of an end state (the “why” aspect of an action),
while feasibility reflects the ease of reaching this end state, such as the amount of time,
money or effort required (the “how” aspect of an action). Thus, temporal distance
increases the importance of desirability and decreases the importance of feasibility
considerations in choice (Liberman and Trope 1998; Thomas, Chandran and Trope
2005). Specifically, participants choosing a word processor favored a new and quick but
more difficult to learn model over an old and slow but easier to learn model in the distant

46
future, but they favored the old and easier to learn model in the near future (Liberman
and Trope 1998).
Analogous to the effect of temporal distance, we propose that direct and indirect
product experiences result in different levels of mental construal. Indirect product
experiences require consumers to manipulate and integrate stimulus information that is
not immediately available to the senses (i.e., removed from the here and now), which is a
characteristic of abstract tasks (Paivio 1979). Direct product experiences, on the other
hand, require consumers to react to an immediate, vivid stimulus and provide greater
sensory contact with that stimulus, which is a characteristic of concrete tasks (Paivio
1979). Thus, we propose that increasing experiential contact with a product via product
trial should induce a more concrete mental representation of the product. In other words,
we hypothesize that:
H1: A direct product usage experience (e.g., a product trial) will trigger a more concrete
mental construal than an indirect product experience (e.g., exposure to a product
description).
Because abstract and concrete construals result in a different emphasis on the
desirability and feasibility aspects of alternatives, shifting construal can lead to shifts in
product preferences (Liberman and Trope 1998; Thomas et al. 2005). Results from essay
1 indicated that products with a higher number of features (enhanced products) tend to be
highly desirable but less user-friendly (lower in feasibility), and products with fewer
features (basic products) are more user-friendly but less desirable. Thus, we expect to

47
find a significant interaction between consumers’ mental construal (abstract/concrete)
and product type (basic/enhanced) on consumers’ preferences. Specifically, we expect
that:
H2: A concrete construal should decrease the attractiveness of enhanced products and
increase the attractiveness of basic products relative to an abstract construal.
In practical terms, the first two hypotheses suggest that the products consumers
evaluate most favorably on the store shelves may not be the same products that they
evaluate most favorably while using them. Although essay 1 shows that direct product
experiences tend to increase preferences for enhanced relative to basic products, essay 1
does not investigate the mechanism responsible for this change.
Our goal in essay 2 is to demonstrate that the shift in mental construal caused by
engaging in a direct product experience is sufficient to produce changes in consumers’
preferences for product features. To isolate the process mechanism underlying this shift
in preferences, we manipulate both mental construal and product experience. If a shift in
construal is responsible for the effect of direct relative to indirect experience on
preferences, inducing consumers to adopt a concrete mental construal while engaging in
an indirect experience should lead to product preferences that are similar to those formed
based on a direct experience. Specifically, we hypothesize that:
H3: When consumers adopt an abstract mental construal, there will be a significant effect
of product experience (indirect vs. direct) on consumers’ evaluations of basic and
48
enhanced products. However, when consumers adopt a concrete mental construal, the
effect of product experience on product evaluations will be attenuated.
Will the difference in preferences between indirect and direct product experiences
endure over multiple product trials? So far, we have equated a direct product experience
with a single product trial. However, research on consumer expertise suggests that
experts perform product-related tasks more automatically (Alba and Hutchinson 1987).
Similarly, action identification theory (Vallacher and Wegner 1989) suggests that with
practice, target tasks require less cognitive effort and become more automatic. As a
result, individuals begin to identify such tasks at higher, more abstract levels. Thus, as
consumers become more familiar with a product, they may begin to conceptualize their
actions more abstractly when using the product. If this is the case, using a product
multiple times may moderate the differences in consumers’ level of mental construal
across indirect and direct product experience conditions. Specifically,
H4: As consumers engage in repeated direct experiences with a product, their level of
mental construal will become more abstract.
Study 1 will test whether direct and indirect product experiences lead to
differences in mental construal (H1). To control for the context of evaluation, all
participants will evaluate a single product (separate evaluation). To disentangle the
effects of mental construal and additional information that might be obtained via a direct
experience with the product, we hold product experience constant in study 2. We test H2

49
by manipulating consumers’ mental construal using an elaboration task prior to an
indirect product experience. In study 3, we cross both types of mental construal
manipulations (product experience and an elaboration task) to test H3. We predict that
inducing consumers to adopt a concrete construal prior to evaluating products will
attenuate differences in product preferences between the indirect and direct experience
conditions, providing evidence for the process mechanism underlying the changes in
preferences. Finally, in study 4, we test whether the effect of direct experience on mental
construal and product preferences is moderated by engaging in multiple direct usage
experiences with a product (H4).
Study 1 - Comparing Indirect and Direct Product Experiences
In study 1, our primary goal is to test the effect of increasing experiential contact
with a product on consumers’ level of mental construal and product evaluations. To
control for the effect of the evaluation context on product preferences, we use a between-
subjects design in which consumers evaluate a single product in each condition.
Participants and Design
Ninety-four undergraduate marketing students (52% females) were randomly
assigned to four conditions of a 2 product experience (indirect/direct) x 2 product type
(basic model/enhanced model) between-subjects design. Product experience was
manipulated by exposing participants either to a PowerPoint presentation describing the
product or to a product trial. Similar to essay 1, product type was manipulated by creating

50
two versions of a product, one with seven basic features (basic model) and another with
the seven basic features and 14 additional features (enhanced model).
Stimuli
This study used the same stimuli described in study 3 of essay 1. Participants
evaluated models of a digital video player. The basic player included the seven most
important features and the enhanced player included the twenty-one most important
features (see Appendix 3 for a list of features). Our previous results show that adding
features increases consumers’ perceptions of desirability aspects, such as the product’s
capability of performing desired functions, but decreases perceptions of feasibility such
as its ease of use. This should make the enhanced product more attractive in the indirect
than in the direct product experience condition, and the basic product more attractive in
the direct than in the indirect product experience condition.
Procedures
The study was conducted using MediaLab software and sessions were run in a
computer lab with groups of 2 to 18 students. Participants worked individually. First,
participants answered expertise measures regarding digital video players. Next, they were
asked to consider subscribing to a new digital video player. In the indirect experience
condition, participants viewed a PowerPoint presentation describing the features of the
digital video player and showing a picture of its user interface. In the direct experience
condition, participants were given a product trial and used one of the digital video
players. Immediately after the product experience manipulation, participants answered an

51
open-ended question designed to assess their level of mental construal. Following the
mental construal question, participants provided their perceptions of the product’s
desirability and feasibility, and then evaluated the product. At the end of the session,
participants responded to a scale designed to measure individual differences in mental
construal and provided demographic information.
Measures
Mental construal. Mental construal was measured with an open-ended question
asking participants to describe the activity of using a digital video player. Following
Liberman and Trope (1998), two independent judges coded participants’ responses as
why/outcome oriented thoughts, how/process-oriented thoughts, or other thoughts. Why
thoughts are thoughts that refer to the outcome or benefits of performing an activity (e.g.,
“Using a digital video player enables the user to easily watch various video clips at home
or at work”). How thoughts are thoughts that refer to the process or steps involved in
performing an activity (e.g., “Using a digital video player entails opening up the program
on the computer and loading the video you want to play”). Responses that did not refer
either to the outcome or process of using a digital video player were coded as other
thoughts. Abstract construals are related to the predominance of why thoughts and
concrete construals are related to the predominance of how thoughts (Liberman and
Trope 1998).
Product perceptions and overall product evaluations. Perceptions of product
desirability were measured using the same items for perceived product capability used in

52
essay 1 (many functions/few functions, has many capabilities/few capabilities, has many
features/ few features). Perceptions of product feasibility were measured using the same
eight items related to the product’s usability as in essay 1 (e.g., learning to use this
product will be easy for me; Chin, Diehl and Norman 1988). Overall product evaluations
were measured using five items (bad/good, unlikable/likable, not useful/useful, low/high
quality, unfavorable/favorable, Peracchio and Tybout 1996). All items were measured
using seven-point scales.
Control variables. Expertise with the product category was measured using five
items on a seven-point scale (e.g., how familiar are you with digital video players;
Mitchell and Dacin 1996). Individual differences in mental construal were measured
using Vallacher and Wegner’s (1989) “Level of Personal Agency” questionnaire.
Participants were presented with 25 different activities (e.g., “locking a door”) followed
by a low level description (e.g., “putting a key in the lock”) and a high level description
(e.g., “securing the house”) of each activity, and they were asked to choose the
description that best described each activity.
Results
The reliability of the multiple item scales ranged from .91 to .95. Level of
personal agency did not affect any of our measures (ps > .22). The effects of expertise on
mental construal and product perceptions were nonsignificant (ps > .06), with the
exception of a positive effect of expertise on perceptions of product feasibility (p < .001).

53
Mental construal. Inter-judge reliability for the mental construal coding was .90
(Perreault and Leigh 1989). Participants’ total number of thoughts in the mental construal
open-ended question did not vary significantly across conditions (ps > .07). We
computed the percentage of why, how and other thoughts for each participant.
A 2 product experience x 2 product type ANOVA on the arcsine transformation
of the proportion of why thoughts showed a main effect of product experience (F(1, 90) =
14.0, p < .001). Supporting H1, participants in the indirect experience condition described
the activity of using a digital video player with more why thoughts (69%) than
participants in the direct experience condition (38%). No other effects were significant
(ps > .14). Similarly, a 2 product experience x 2 product type ANOVA on the arcsine
transformation of the proportion of how thoughts indicated a main effect of product
experience (F(1, 90) = 10.15, p < .01). Participants in the direct experience condition
were more focused on how to use the video player (47%) than participants in the indirect
experience condition (21%). No other effects were significant (ps > .20). There were no
differences in the arcsine transformation of the proportion of other thoughts across
conditions (ps > .64). These findings support our hypothesis that participants exposed to a
direct product experience adopt more concrete mental construals than participants
exposed to an indirect product experience (H1).
Product perceptions. A 2 product experience x 2 product type ANOVA on
perceptions of product desirability showed a main effect of product type (Mbasic = 3.87,
Menhanced = 4.97, F(1, 90) = 17.18, p < .001) and a main effect of product experience
(Mindirect = 4.61, Mdirect = 4.06, F(1, 90) = 6.34, p < .05), which were qualified by a
54
interaction effect (F(1, 90) = 13.72, p < .001). Perceptions of product desirability were
higher for the enhanced model than for the basic model, and the effect was stronger in the
indirect experience condition.
A 2 product experience x 2 product type ANOVA on perceptions of product
feasibility also indicated a main effect of product type (Mbasic = 5.93, Menhanced = 5.12,
F(1, 90) = 9.97, p < .01). No other effects were significant (ps > .24). Thus, replicating
previous findings, adding features increased perceptions of desirability but decreased
perceptions of feasibility.13
Overall product evaluations. A 2 product experience x 2 product type ANOVA
on product evaluations indicated that only the interaction between product experience and
product type was significant (F(1, 90) = 5.15, p < .05). As shown in figure 4,
participants’ evaluations of the enhanced model were significantly less favorable in the
direct experience condition than in the indirect experience condition (Mindirect = 5.22,
Mdirect = 4.29, p < .05). However, evaluations of the basic model did not vary significantly
across product experience conditions (Mindirect = 4.26, Mdirect = 4.47, p > .50). Thus, as
expected, adding features had a more positive effect on product evaluations in the indirect
experience condition, when construal was more abstract, than in the direct experience
condition, when construal was more concrete.
13 Adding expertise as a covariate in the analysis did not change the results.

55
FIGURE 4 – Interaction Between Product Experience and Product Type on Product
Evaluations
3
3.5
4
4.5
5
5.5
6
Indirect ProductExperience
Direct ProductExperience
Basic ProductEnhanced Product
Discussion
The results of study 1 demonstrate that indirect and direct product experiences
shift consumers’ mental construal and their preferences for enhanced products, which
have a higher number of features. The content analysis of participants’ thoughts indicates
that a direct product experience induced a more concrete mental construal during product
evaluation than an indirect product experience. Moreover, consistent with essay 1
findings, evaluations of the enhanced product decreased significantly in the direct product
experience condition relative to the indirect product experience condition. In contrast,
evaluations of the basic product (fewer features) were stable across indirect and direct
product experiences.
Is the shift in mental construal induced by the direct product experience
responsible for this change in product preferences? Both mental construal and product

56
preferences shifted significantly when participants engaged in a direct versus an indirect
product experience. Moreover, consistent with construal level theory, participants with
more concrete mental construal evaluated the high desirability but low feasibility product
less favorably than participants with more abstract mental construal. Study 1 rules out the
effect of joint versus separate evaluation contexts because all participants evaluated a
single product. However, at least one alternative explanation remains: preferences may
have shifted because additional information was acquired via a direct experience with the
product. Although expertise did not affect product perceptions or product evaluations, the
significant main effect of the product experience manipulation on perceptions of product
desirability suggests that direct experience may have provided additional information
about the product. Specifically, the decrease in the product’s perceived desirability after a
direct product experience may account for the shift in preferences.
In the next study, we disentangle the effects of mental construal and access to
information about the product by holding product experience constant across conditions.
We test whether shifting mental construal is by itself sufficient to produce changes in
product preferences for basic and enhanced products.
Study 2 - Using an Elaboration Task to Manipulate Mental Construal
In study 2, all participants engaged in an indirect experience with the product and
we manipulated mental construal using a cognitive elaboration task. This study has two
goals. First, we expect to show significant differences in consumers’ preferences for basic
and enhanced products across mental construal conditions (H2), paralleling the effect of

57
direct usage experience in study 1. Specifically, evaluations of the enhanced model
should be less favorable in the concrete condition than in the abstract condition, and
evaluations of the basic model should be more favorable in the concrete condition than in
the abstract condition. Second, we compare the findings in the abstract and concrete
conditions with those obtained in a control condition to see whether consumers naturally
adopt a more abstract or a more concrete mental construal when engaging in an indirect
product experience.
Participants and Design
One hundred and two undergraduate students (39% females) were randomly
assigned to cells using a 2 product type (basic/enhanced) x 3 mental construal
(abstract/concrete/control) between-subjects design. Each participant evaluated either the
basic or enhanced model of a digital camera.
Mental construal was manipulated using an unrelated elaboration task prior to the
product evaluation task (Agrawal 2005; Freitas, Gollwitzer and Trope 2004). Participants
considered the activity of improving and maintaining their health. In the abstract
condition, participants were directed to consider why they would engage in this activity.
In the concrete condition, participants were directed to consider how they would engage
in this activity. The mental exercise was structured so that participants were required to
think increasingly abstractly, by successively indicating why they would engage in the
activity or increasingly concretely, by successively indicating how they would engage in
the same activity. In the control condition, participants evaluated the product without first
engaging in the elaboration task.

58
Stimuli
Participants evaluated two models of a digital camera. As in study 1, the basic
model had seven basic features available in most digital cameras, and the enhanced
model had 21 features (seven basic features plus 14 extra features; see Appendix 4 for a
list of features). To verify that the basic model included the most important features, we
asked participants to rate the importance of each feature after they completed their
product evaluations.
Procedures
Participants were informed that they would be participating in two different
studies, and they received two booklets. In the first booklet, they completed the mental
construal manipulation, and in the second booklet, they completed the product evaluation
task.
For the product evaluation task, participants were presented with descriptions of
either the basic or enhanced model of digital camera, and then they were asked to rate the
product’s desirability and feasibility and provide an overall product evaluation. After
evaluating the basic or enhanced digital camera, they were given a description of the
other camera (e.g., participants who had evaluated the basic digital camera were given the
description of the enhanced digital camera). Participants were asked to indicate their
relative preferences for the two digital cameras and then choose their preferred camera.

59
Measures
Product desirability, feasibility and overall evaluations were measured as in study
1. Relative preference for the two cameras was measured by asking participants to rate
the extent to which they preferred each digital camera (definitely prefer digital camera
A/definitely prefer digital camera B). After responding to this question, participants
chose one model of digital camera and rated their confidence in their choice (not
confident at all/very confident) and the difficulty of their choice (not difficult at all/very
difficult). At the end, participants rated the importance of all 21 features of digital
cameras and provided demographic information. All items used seven point scales.
Results
The reliability of the multiple item scales ranged from .74 to .97. The perceived
importance of the seven features included in the basic digital camera was significantly
higher (M = 5.32) than the perceived importance of the 14 features added in the enhanced
digital camera (M = 4.89, F(1, 101) = 17.30, p < .001).
Product perceptions. A 2 product type (basic/enhanced) x 3 mental construal
(abstract/concrete/control) ANOVA on perceptions of desirability revealed a main effect
of product type. Perceptions of desirability were higher for the enhanced model than for
the basic model (Mbasic = 5.22, Menhanced = 6.14, F(1, 96) = 28.22, p < .001). Replicating
study 1’s findings, there was a significant product type by construal interaction (F(2, 96)
= 4.54, p < . 05), indicating that the effect of product type on perceptions of desirability
was stronger in the abstract and control conditions than in the concrete condition. Thus,

60
participants’ enhanced sensitivity to the effects of features on product desirability does
not seem to arise from additional information about the product, but from the way they
mentally construe the product. No other effects were significant (ps > .75).
A 2 product type x 3 mental construal ANOVA on perceptions of feasibility also
showed a main effect of product type. Perceptions of feasibility were higher for the basic
model than for the enhanced model (Mbasic = 5.26, Menhanced = 4.67, F(1, 96) = 9.54, p <
.01). No other effects were significant (p > .26). Thus, as expected, the enhanced digital
camera had higher perceived desirability but lower perceived feasibility than the basic
digital camera.
Overall product evaluations. A 2 product type x 3 mental construal ANOVA on
overall product evaluations indicated a significant main effect of product type (F(1, 96) =
10.57, p < .01) that was qualified by a significant product type by mental construal
interaction (F(2, 96) = 4.46, p < .05). No other effects were significant (p > .27). As
shown in figure 5, in the abstract condition, evaluations of the enhanced camera were
significantly higher than evaluations of the basic camera (Mbasic = 5.05, Menhanced = 5.81,
F(1, 37) = 9.40, p < .01). However, as predicted by H2, participants’ evaluations of the
enhanced digital camera decreased in the concrete condition relative to the abstract
condition (Mabstract = 5.81, Mconcrete = 5.33; F(1, 34) = 3.38, p < .08), yielding no
significant difference in preferences for the two models in the concrete condition (p >
.58). Replicating the effect of product experience in study 1, the differences in
participants’ evaluations of the basic digital camera across abstract and concrete
conditions did not reach significance (Mabstract = 5.05, Mconcrete = 5.48; F(1, 34) = 2.65, p

61
< .11). Therefore, H2 is partially supported.
FIGURE 5 – Interaction Between Mental Construal and Product Type on Product
Evaluations
4.5
5
5.5
6
6.5
Control Condition
AbstractCondition
ConcreteCondition
Basic ProductEnhanced Product
Overall evaluations of the enhanced camera differed significantly between the
concrete and control conditions (Mcontrol = 6.17, Mconcrete = 5.33, F(1,45) = , p < .01), but
did not differ between the abstract and control conditions (p >.20). This suggests that
participants naturally tend toward an abstract rather than a concrete mental construal
when engaging in an indirect product experience.
Relative preference and choice. As expected, the mental construal manipulation
significantly influenced participants’ relative preferences for the two digital cameras.
Relative preference for the enhanced camera was significantly lower in the concrete
condition than in the abstract condition (Mconcrete = 4.75, Mabstract = 5.87, F(1, 70) = 8.80,
p < .01). Relative preferences in the control condition were similar to those in the abstract
62
condition (p > .77), but significantly different from the concrete condition (Mcontrol = 5.76,
Mconcrete = 4.75, F(1, 61) = 5.44, p < .05).
The mental construal manipulation significantly affected participants’ choices
across abstract and concrete conditions (Fisher’s exact test, p < .01). The number of
participants choosing the basic model was substantially higher in the concrete condition
(36%) than in the abstract condition (8%), consistent with our prediction. Relative to the
control condition, in which 10% of participants chose the basic model, the concrete
mental construal manipulation more than tripled the share of the basic model. Consistent
with the data on overall evaluations and relative preferences, the shares of the low and
high feature models in the control condition were similar to those obtained in the abstract
construal condition (Fisher’s exact test, p = 1.0).
In addition to influencing their product choices, the mental construal manipulation
also influenced participants’ subjective experiences during the choice process.
Specifically, participants in the concrete condition reported lower levels of confidence in
their choices (M = 5.45) than participants in the abstract condition (M = 6.26, F(1, 68) =
10.39, p < .01). Moreover, perceived choice difficulty was higher in the concrete
condition (M = 3.06) than in the abstract condition (M = 2.10, F(1, 68) = 8.18, p < .01).
These differences in participants’ subjective experiences suggest that moving away from
the natural, default level of mental construal (e.g., shifting from abstract to concrete)
might require increased cognitive effort, decreasing confidence and increasing choice
difficulty.

63
Discussion
The findings of studies 1 and 2 provide convergent evidence about the impact of
mental construal on consumers’ trade-offs between desirability (e.g., product capability)
and feasibility (e.g., product usability). Controlling for the effects of additional
information, a mental construal manipulation shifted consumers’ product perceptions and
preferences in the same way that product usage shifted them in study 1. Similar to the
effect of direct experience, a concrete elaboration task significantly decreased
participants’ preferences for the enhanced product (higher number of features) relative to
the abstract elaboration task and the control condition. The same pattern was obtained for
consumers’ choices. Inducing consumers to think concretely before the product
evaluation task produced more than a threefold increase in the proportion of subjects
choosing the basic product instead of the enhanced product.
The significant increase in the attractiveness of the basic product resulting from
the concrete elaboration task suggests that engaging in such a task can decrease the gap
between consumers’ preferences resulting from exposure to indirect and direct product
experiences, and therefore, minimize the feature fatigue effect. In study 3, we manipulate
product experience and expose consumers to either an abstract or concrete elaboration
task prior to product evaluations. If a shift in mental construal is responsible for the
observed changes in relative preferences for basic and enhanced products, then
manipulating mental construal should attenuate the effect of direct experience on product
evaluations. Previous research has used this approach to compare alternative process
explanations (e.g., Unnava and Burnkrant 1991).
64
Study 3 – Decreasing the Gap Across Indirect and Direct Product Experiences
The goal of study 3 is to test whether inducing consumers to adopt a concrete
mental construal when evaluating a product can attenuate the significant difference
between direct and indirect product experiences on consumers’ preferences for products
with different number of features (H3).
Participants and Design
One hundred fifty-seven undergraduate students (48% females) were randomly
assigned to cells using a 2 mental construal (abstract/concrete) x 2 product experience
(indirect/direct) x 2 product type (basic/enhanced) between subjects design.
Procedures
The research sessions were run in a computer lab and participants worked
individually. First, participants were given a booklet with the same mental construal
manipulation used in study 2. Participants worked on an abstract or concrete mental
exercise for approximately 10 minutes and then were asked to participate in a different
study about digital media players, which was administered using Media Lab software.
Participants were given the product experience manipulation, following the same
procedures used for study 1. Half of the participants were given a PowerPoint
presentation about a digital video player and half of the participants were given a product
trial. The digital video players used in this study were the same as those used in essay 1.

65
Participants evaluated either the basic model of digital video player with seven features
or the enhanced model with 21 features.
Measures
We used the same measures of perceived desirability, feasibility, and overall
product evaluations that were used in studies 1 and 2. Participants also rated their
expected and experienced product satisfaction (very dissatisfied/very satisfied) and their
likelihood of purchasing the product (very unlikely/very likely). All items were measured
using seven-point scales.
Results
The reliability of the multiple item scales ranged from .90 to .95.
Product perceptions. A 2 mental construal (abstract/concrete) x 2 product
experience (indirect/direct) x 2 product type (basic/enhanced) ANOVA on perceptions of
product desirability indicated a significant main effect of product experience (Mindirect =
4.96, Mdirect = 4.48, F(1, 149) = 7.07, p <.01) and product type (Mbasic = 4.22, Menhanced =
5.24, F(1, 149) = 29.95, p <.001). Consistent with study 1’s results, there was also a
significant interaction between product experience and product type on perceptions of
desirability (F(1, 149) = 7.27, p < .01), indicating that the effect of product type on
desirability ratings was stronger in the indirect experience than in the direct experience
condition. No other effects reached statistical significance (ps > .07).

66
A 2 mental construal x 2 product experience x 2 product type ANOVA on
perceptions of feasibility showed only a main effect of product type (Mbasic = 6.02,
Menhanced = 5.39, F(1, 149) = 16.06, p <.001). No other effects were significant (ps > .10).
As expected, enhancing the product by adding features increased perceptions of product
desirability but decreased perceptions of feasibility.
Overall product evaluations. Replicating the results of study 1, a 2 mental
construal x 2 product experience x 2 product type ANOVA on overall product
evaluations revealed a significant interaction between product experience and product
type (F(1, 149) = 4.44, p < .05). In the indirect experience condition, there was a
significant difference between the evaluations of the basic and enhanced video players
(Mbasic = 4.57, Menhanced = 5.24, F(1, 77) = 10.94, p < .01). However, this difference was
not significant in the direct experience conditions (Mbasic = 4.67, Menhanced = 4.59, p > .77).
Moreover, consistent with study 2, there was a significant interaction between
mental construal and product type on product evaluations (F(1, 149) = 3.93, p < .05),
paralleling the product experience by product type interaction. In the abstract condition,
there was a significant difference between the evaluations of the basic and enhanced
video players (Mbasic = 4.32, Menhanced = 4.97, F(1, 76) = 6.14, p < .05). However, in the
concrete condition, the evaluations of the basic and enhanced video players were not
significantly different (Mbasic = 4.89, Menhanced = 4.86, p > .90). No other effects reached
significance (ps > .07).
As predicted by H3, the product experience manipulation shifted product
preferences in the abstract condition, but not in the concrete condition. In the abstract

67
condition, evaluations of the enhanced video player were significantly higher in the
indirect experience condition (M = 5.4) relative to the direct experience condition (M =
4.5, F(1, 38) = 6.57, p < .05) and evaluations of the basic video player were similar
across the experience conditions (ps >.75). However, when participants engaged in an
exercise to induce a concrete mental construal prior to an indirect experience, their
evaluations for the basic and enhanced models were similar to those reported by
participants engaging in a direct product experience (ps > .18).
Participants’ expected and experienced product satisfaction and purchase intent
followed the same pattern of effects. In the abstract condition, satisfaction with the
enhanced video player was significantly higher in the indirect experience condition (M =
5.4) than in the direct experience condition (M = 3.8, F(1, 38) = 12.44, p < .01).
Similarly, purchase intent for the enhanced video player was significantly higher in the
indirect experience condition (M = 4.5) than in the direct experience condition (M = 2.8,
F(1, 38) = 14.87, p < .001). However, when participants engaged in a concrete
elaboration task prior to an indirect experience, their satisfaction and purchase intent for
the basic and enhanced video players did not differ from those reported by participants
engaging in a direct product experience (ps > .11).
Comparing the effect (slope) of product experience on participants reactions to
the enhanced product across the abstract and concrete conditions reveals that the effect of
direct experience on product satisfaction is marginally stronger in the abstract (β = -.49)
than in the concrete condition (β = -.26, tdiff(73) = 1.6, p =.057, one-tailed). Similarly, the
effect of direct experience on intentions to purchase the enhanced video player is
significantly stronger in the abstract (β = -.53) than in the concrete condition (β = -.15,

68
tdiff(73) = 2.81, p <.01, one-tailed). The difference in the effect of direct experience on
overall evaluations of the enhanced product across mental construal conditions did not
reach statistical significance (p >. 15, one-tailed).
Taken together, these results suggest that inducing consumers to think concretely
about the product attenuates the effect of direct experience on product preferences. Figure
6 depicts the means for overall evaluations of the enhanced product across conditions.
FIGURE 6 – Change in the Evaluations of the Enhanced Product Across Conditions
3
3.5
4
4.5
5
5.5
6
Abstract Concrete
Indirect ExperienceDirect Experience
Discussion
Study 3 shows that using a cognitive manipulation to induce a concrete mental
construal attenuates differences in consumers’ preferences resulting from indirect and
direct product experiences. When consumers are induced to think concretely about the
product, their evaluations of basic and enhanced product alternatives mirrored those of
consumers who were given a product trial experience. Both study 2 and study 3 show that
controlling for the amount of information provided by a product experience, changes in

69
mental construal are sufficient to shift product preferences. Moreover, by crossing the
construal manipulation with the product experience manipulation, study 3 demonstrates
that additional learning via direct experience with the product does not change product
preferences beyond the changes produced by the construal manipulation. Thus,
controlling for both the context of evaluation and additional information provided by a
direct product experience, our results suggest that the shifts in mental construal caused by
a direct product experience are sufficient to produce changes in product preferences.
One limitation of studies 1 and 3 is that they equate a direct product experience
with a single product trial. Using an enhanced product multiples times may improve
consumers’ evaluations because their level of mental construal might change as they gain
more direct experience with the product, as proposed by H4. Research on expertise and
action identification theory suggests that repeated direct experiences may lead consumers
to identify product-related tasks at more abstract levels. Moreover, consumers’
preferences may increase over time due to a decrease in the cost of performing product-
related tasks. Specifically, human capital and household product models suggest that
changes in consumption behavior may occur with additional usage experience because
consumers’ cost of engaging in product-related activities (e.g., watching a movie or
listening to music) decreases as the consumer becomes more proficient in using the
product (Ratchford 2001; Stigler and Becker 1977). Thus, consumers may evaluate a
product with more features more favorably after multiple direct experiences because the
product becomes easier to use (i.e., usability increases). In study 4, we examine the effect
of multiple direct product experiences on consumers’ mental construal, product usability,
and overall product evaluations.

70
Study 4 – Tracking Mental Construal Across Multiple Product Experiences
The goal of study 4 is to test whether the effect of direct experience on mental
construal and product preferences is moderated by engaging in multiple direct
experiences with a product. In study 4, participants used the same product three times and
we measured changes in their level of mental construal and product evaluations across
trials.
Participants and Design
Seventy-four undergraduate students (61% females) were randomly assigned to a
3 direct product experience (first use/second use/third use) x 2 product type
(basic/enhanced) mixed design. Direct product experience was manipulated within
subjects and product type was manipulated between subjects. Participants used the same
basic or enhanced model of digital video player employed in studies 1 and 3.
Procedures
Participants used the same digital video player (either the basic or enhanced
model) on three different days over the period of one week. The first usage experience
was expected to provide initial exposure to the digital video player and the two additional
direct usage experiences were expected to enhance familiarity with the product. Each
research session lasted for approximately 30 minutes. The intervals between each session

71
were equal across participants. The first and second sessions were two days apart and the
second and third sessions were five days apart. At each session, participants used the
same digital video player to complete a series of four tasks (e.g., selecting a movie from a
playlist and watching parts of the movie), but they viewed different video content. To
help them complete the tasks, participants were given a product manual describing how
to use the player to which they were assigned.
During the first research session, participants rated their expertise with digital
video players and then used either the basic or enhanced digital video player.
Immediately after using the product, participants answered an open-ended question
designed to assess their level of mental construal. Next, they provided ratings of product
desirability and feasibility and overall product evaluations. During the second research
session, participants used the same digital video player and then answered the mental
construal open-ended question. To minimize the possibility of a consistency bias in
participants’ product evaluations across the three research sessions, we did not collect
any other dependent measures in the second research session. In the third research
session, participants used the same digital video player for a third time, answered the
mental construal open-ended question and provided ratings of product desirability,
feasibility and overall product evaluations. Measures of mental construal, expertise,
desirability, feasibility and overall product evaluations were the same as those used in the
previous studies. Finally, we gathered information on how many tasks were completed
and how much time it took to complete them.

72
Results
The reliability of the multiple item scales ranged from .93 to .96. The effect of
expertise on all dependent measures was nonsignificant (ps >.09).
Mental construal. Inter-judge reliability for the mental construal question was .88
(Perreault and Leigh 1989). Participants’ total number of thoughts in response to the
mental construal open-ended question decreased between the first and the two remaining
usage experiences (ps > .001). As in study 1, we computed the percentage of why, how
and other thoughts for each respondent.
A 3 product experience (first use/second use/third use) x 2 product type
(basic/enhanced) repeated measures ANOVA on the arcsine transformation of the
proportion of why, how and other thoughts revealed no significant effects of product
experience or product type (ps > .13), indicating that counter to our expectations (H4),
mental construal did not shift across first, second, and third usage experiences with the
product.
If we compare participants’ thoughts after an indirect product experience in study
1 with participants thoughts after the third usage experience in study 3, we find that even
after three direct usage experiences with the same product, participants tended to have
more process-oriented thoughts (53% vs. 21%, z = 7.40, p < .001) and fewer outcome-
oriented thoughts (40% vs. 69%, z = 6.94, p < .001) than after they engaged in an indirect
experiences with the same product. Thus, direct experience appears to generate a more
concrete mental construal than indirect experience, and this difference is not eliminated
by multiple product experiences.

73
Product perceptions. A 2 product experience (first use/third use) x 2 product type
(basic/enhanced) repeated measures ANOVA on perceptions of product desirability
revealed a main effect of product type (Mbasic = 3.60, Menhanced = 4.27, F(1, 72) = 7.30, p <
.01) such that the enhanced product was perceived to be more desirable than the basic
product. No other effects were significant (ps > .15).
A 2 product experience x 2 product type repeated measures ANOVA on
perceptions of feasibility revealed a main effect of product type (Mbasic = 5.84, Menhanced =
5.35, F(1, 72) = 4.19, p < .05), indicating that the basic product was perceived to be
easier to use than the enhanced product. Notably, the effect of product experience was
also significant (Mfirst use = 5.47, Mthird use = 5.75, F(1, 72) = 9.59, p < .01), indicating that
multiple experiences with the same product improved perceptions of ease of use, as
predicted by human capital models. No other effects were significant (p > .82).
Participants’ perceptions were consistent with statistics on their actual product usage. The
number of product tasks participants completed successfully significantly increased with
product experience (Mfirst use = 1.47, Mthird use = 3.75, F(1, 70) = 192.86, p < .001), while
the time taken to complete them significantly decreased (Mfirst use = 6.9 minutes, Mthird use =
3.70 minutes, F(1, 70) = 65.49, p < .001)14.
Overall product evaluations. A 2 product experience x 2 product type repeated
measures ANOVA on overall product evaluations showed a significant interaction
between product experience and product type (F(1, 72) = 5.37, p < .05). No other effects
14 The effects of product type (enhanced vs. basic) on the number of tasks completed and amount of time required to complete them were nonsignificant (p’s >.56).

74
were significant (ps > .10). This interaction indicates that while product evaluations for
the basic video player did not differ between the first and third usage experiences (p >
.50), evaluations of the enhanced video player significantly decreased over the three
usage experiences (Mfirst use = 4.78, Mthird use = 4.34, F(1, 34) = 4.92, p < .05). This finding
is especially interesting because human capital models suggest that consumers’ capacity
to enjoy a target activity increases as they become more proficient in these activities
(Ratchford 2001). Our results indicate that multiple direct experiences with the enhanced
product do not increase preferences for the enhanced product, despite the fact that it was
perceived to be significantly easier to use after the third usage experience than after the
first usage experience.
Discussion
Study 4 shows that although products are perceived to be easier to use after
multiple direct usage experiences, the sensory contact involved in a direct product
experience continues to make process-related thoughts more salient than outcome-related
thoughts. After tracking consumers’ levels of mental construal over three direct
experiences with the same product, we do not find evidence that mental construal
becomes more abstract after multiple product experiences. Moreover, we found
significant differences in consumers’ reactions to basic and enhanced products: while
consumers remained satisfied with basic products (fewer features) after three usage
experiences, consumers actually became less satisfied with enhanced products (more
features) over time.
Thus, the significant changes in mental construal produced by a direct product

75
experience relative to an indirect product experience do not seem to be limited to the first
usage experience. Early experiences with a product have been shown to be important in
determining whether consumers continue to use products (Mick and Fournier 1998). Our
findings suggest that even if a consumer uses a newly purchased product three times over
the course of a week, the consumer will continue to value usability (feasibility) more than
she did before using the product, and to value the capabilities of the product (desirability)
less than she did before using the product. To the extent that unsatisfying early usage
experiences cause consumers to experience anxiety and stress or even to discontinue
using new products (Mick and Fournier 1998), this gap in mental construal and product
preferences between choosing (indirect experiences) and using products (direct
experiences) is worthy of attention.
General Discussion
The four studies in essay 2 demonstrate the links between direct and indirect
product experiences, mental construal and product preferences. Study 1 shows that
indirect product experiences, such as reading a product description, and direct product
experiences, such as using a product to perform a task, cause consumers to adopt
different levels of mental construal. Indirect product experiences trigger more abstract
mental construals, increasing the salience of desirability considerations, while direct
product experiences induce more concrete mental construals, enhancing the salience of
feasibility considerations. Studies 1 and 3 demonstrate that this shift in mental construal
is sufficient to influence product preferences: after a direct product experience,

76
consumers evaluated enhanced products with a higher number of features less favorably
than they did after an indirect product experience. Study 2 ruled out alternative
explanations such as the context of evaluation and the amount of information conveyed
by a direct or indirect product experience. Moreover, study 3 showed that inducing a
concrete mental construal prior to a product experience attenuated the difference in
consumers’ preferences between direct and indirect product experiences. Thus,
differences in mental construal induced by engaging in a direct relative to an indirect
product experience appear to be sufficient to generate significant shifts in product
preferences.
Theoretically, these studies add to construal level theory by showing that
experiential contact with a product can shift consumers’ level of mental construal.
Analogous to the effect of temporal distance, we show that experiential contact with a
target object of evaluation seems to elicit a more concrete mental construal, while
integrating stimulus information that is not immediately available to the senses seems to
elicit a more abstract mental construal. Thus, like temporal, spatial, and social distance,
experiential contact seems to be another means for manipulating the psychological
distance between individuals and target objects or events.
Demonstrating the effect of product experience on mental construal also expands
our understanding of the difference between direct and indirect product experiences. In
past research, this difference has been explained primarily in terms of the information
provided by direct and indirect product experiences (e.g., Smith and Swinyard 1982,
1983). Controlling for the availability of information about the product, our studies show
that the shift in mental construal produced by engaging in a direct product experience

77
relative to an indirect product experience is sufficient to produce a change in product
preferences. This means that simply providing more information about products before
purchase is unlikely to resolve potential discrepancies in preferences before and after
purchase. Instead, resolving these discrepancies may require increasing experiential
contact with products prior to purchase or inducing consumers to think more concretely
about the product during the decision-making process.
Future Research
There are several avenues for future research based on our findings. First, in our
studies, direct product experience was operationalized by asking participants to engage in
a product trial. In future research, it would be interesting to test how varying the degree
of experiential contact with a product affects mental construal. For example, providing
consumers with a product demonstration or simulating a direct experience using virtual
prototypes may approximate the effects of direct experience on mental construal, but it is
likely that less interactive contact would produce smaller shifts in construal.
Second, it would be interesting to examine what consumers learn from their
product experiences. Our participants evaluated a target product immediately after being
exposed to either an indirect or direct product experience. However, temporal construal
theory suggests that the greater the delay between experience and evaluation, the greater
the psychological distance between the consumer and the product. Thus, measures of
remembered product utility after a time delay may reflect desirability considerations
more than measures of product utility taken immediately after using the product. To the
extent that a consumer’s mental construal becomes more abstract when they think about

78
past experiences, a time delay may moderate our findings.
Third, our participants were assigned to use or evaluate either the basic or
enhanced models of a product, but real consumers usually choose whether to purchase a
more basic or a more enhanced model. If consumers accommodate to their chosen
alternatives over time (Hoch 2002), they might be motivated to fulfill their optimistic
expectations for the products they choose, decreasing the gap between expected and
experienced utilities. Leveraging earlier research on regret and cognitive dissonance, it
would be interesting to examine the extent to which feasibility and desirability
considerations affect consumers’ post-purchase satisfaction with products.
Fourth, future research should further examine the effects of inducing a concrete
mental construal on consumers’ decision making processes. Studies 2 and 3 demonstrated
that inducing more process-oriented thinking (a concrete mental construal) prior to an
indirect product experience resulted in preferences that were more consistent with
preferences following a direct product experience. Consistent with these results, recent
work by Zhao, Hoeffler and Zauberman (2005) suggests that engaging in process
simulation (focusing on the step-by-step process of achieving a goal) for distant future
events leads to more preference consistency over time than engaging in outcome
simulation (focusing on the desirability of goal attainment). One caveat is that our study 2
participants who engaged in more process-oriented thinking reported lower confidence in
and higher perceived difficulty with their decision making. Thus, process-oriented mental
simulation may be a double-edged sword: it may help consumers choose products that are
more satisfying during use, but simultaneously decrease satisfaction with the choice
process. Understanding the reasons for increased choice difficulty under concrete versus

79
abstract construal manipulations is an interesting avenue for future research.
Finally, previous research on the consistency between attitudes and behavior (e.g.,
Regan and Fazio 1977; Smith and Swinyard 1983) shows that individuals who form their
attitudes on the basis of direct experience with the attitude object indicate greater
attitude-behavior consistency than individuals whose attitudes were formed based on
indirect experience. In light of our findings, an important question that arises is whether
manipulations of construal can improve the predictive power of attitudinal measures.
Specifically, it would be interesting to examine whether inducing concrete thinking about
the attitude object increases the degree to which consumers act consistently with their
attitudes.
Implications
Do consumers predict that their preferences after direct and indirect product
experiences will differ, and adjust their choices accordingly? Copious empirical evidence
suggests that consumers are unlikely to be successful in predicting how their preferences
will change based on direct experience. First, there is evidence that consumers may not
be aware of how even commonly experienced states such as hunger influence their
choices. For example, in a study by Read and van Leeuwen (1998), participants’ level of
hunger was manipulated and participants were asked to choose snacks for the future.
Although participants certainly understood that their current level of hunger would
change, their hunger significantly influenced their choices of snacks. Second, correct
prediction requires that consumers have correct beliefs about how a direct experience
with a product will alter their preferences, and it is not clear that consumers correctly

80
anticipate how sequences of experiences will affect their evaluations. For example,
Novemsky and Ratner (2003) showed that although consumers expected to enjoy
pleasurable experiences more after less pleasurable experiences, they did not experience
hedonic contrast effects to the degree they expected.
If consumers do not predict that their preferences after indirect and direct
experiences will differ, and they base their purchase decisions on indirect product
experiences, consumer satisfaction may suffer. Our results show that shifts in mental
construal resulting from enhanced experience contact during product use can bias quality
perceptions and lead to negative disconfirmation of consumers’ expectations.
Given that consumers are unlikely to compensate for the effects of direct
experience when making purchase decisions based on indirect experiences, how can
marketers intervene? Our findings show that firms can increase the consistency between
consumers’ preferences before use and after use and minimize the feature fatigue effect
by encouraging consumers to think concretely about the product before use. To induce a
more concrete mental construal, firms can increase the experience contact with products
in the pre-purchase process by providing opportunities for product testing. For example,
corporate initiatives at Maytag and REI make it possible for consumers to test products
before they buy (Daily 2005). Product trials can increase consumers’ preferences by
decreasing the perceived uncertainty relative to product performance (Rust et al. 1999)
and by triggering the same cognitive mindset that consumers tend to adopt during product
use.
Alternatively, if increasing experiential contact is not feasible, advertising and
online shopping environments might be used to encourage consumers to mentally

81
simulate a usage experience and think concretely about the specific actions required
during use (Schlosser 2003). Leveraging other manipulations that have been
demonstrated to shift mental construal also might increase the consistency between pre-
purchase and post-purchase preferences. For example, envisioning a product usage
experience in the near future (e.g., tomorrow) rather than in the distant future (e.g., one
year from now) can lead to more concrete mental representations of the product (Trope
and Liberman 1998; Ziamou and Veryzer 2005). Ironically, by inducing consumers to
adopt a short-term instead of a long-term focus, firms may help consumers choose
products that maximize their satisfaction after use.

82
Chapter 3: Essay 3 – The Influence of Information Processing Mode on
Consumers’ Responses to Comparative Advertising15
Summary
We demonstrate that matching ad format to a consumer’s mode of information
processing enhances advertising effectiveness. Relative to noncomparative ads,
comparative ads are more effective when consumers use analytical processing.
Conversely, noncomparative ads are more effective than comparative ads when
consumers use imagery processing. When ad format is compatible with processing mode,
information processability is enhanced, making the message more persuasive and ad
evaluations, product evaluations, and purchase intentions more favorable than when ad
format and processing mode are incompatible.
Introduction
Comparative appeals are used frequently in a variety of industries, such as in the
automotive trade (e.g. Ford Taurus versus Honda Accord), information technology (e.g.,
Oracle versus IBM), and consumer-packaged goods (e.g., Progresso versus Campbell
soup, Miller Light versus Budweiser Light). In contrast to noncomparative ads, which
present information about a single brand, comparative ads present explicit comparisons
between two or more brands. Academic research comparing the effectiveness of these
15 An article based on this research and co-authored with Rebecca W. Hamilton will appear in the Journal of Consumer Research (March 2006).

83
two formats has been inconclusive. While several studies have shown that comparative
ads can enhance the positioning of an advertised brand (e.g., Gotlieb and Sarel 1991,
Pechmann and Stewart 1991), other studies have shown that comparative ads do not
result in more positive evaluations of the brand (e.g., Gorn and Weinberg 1984), and can
lead to more negative evaluations of the ad (e.g., Goodwin and Etgar 1980).
In this essay, we examine consumers’ readiness to process information in either a
comparative or noncomparative format. If a consumer is using an imagery processing
mode, thinking about herself using the advertised product, will a comparative or a
noncomparative format be more effective? What if she is using an analytical processing
mode, carefully weighing the positive and negative attributes of the product? Based on
research on the processability of information (Payne, Bettman, and Johnson 1992), we
propose that matching ad format to consumers’ mode of information processing should
enhance advertising effectiveness. Specifically, presenting explicit brand comparisons
should enhance ad effectiveness when consumers use analytical processing because this
format matches the attribute-based evaluation strategy used by the consumer. In contrast,
focusing on a single brand should enhance ad effectiveness when consumers use imagery
processing because this format matches the within-brand evaluation strategy used by the
consumer.
In the next section, we briefly review previous research on comparative
advertising, information processing modes and information processability. Then we
present three studies that test whether the consistency between ad format and consumers’
predominant mode of information processing enhances information processability and ad
effectiveness. We conclude with a discussion of our results, their implications, and

84
suggestions for future research.
Comparative Advertising
A substantial body of research has focused on the relative effectiveness of
comparative and noncomparative advertising (Grewal et al. 1997). Much of this research
has focused on differences in consumers’ information processing in response to ad
format. For example, presenting comparative information may encourage consumers to
ascribe attributes from a product category to the advertised brand (Snyder 1992; Sujan
and Dekleva 1987). Research also suggests that comparative ads induce a relative
encoding frame, generating mental impressions of the advertised brand relative to the
compared brand (Miniard et al. 1993). Finally, studies have compared the type of
elaboration generated by comparative and noncomparative ads. Relative to
noncomparative ads, comparative ads may generate more counterarguing, which can
increase consumers’ tendency to discount ad information (Belch 1981, Swinyard 1981).
While previous work has focused on the effects of ad format on information
processing, we focus instead on the consumer’s readiness to process information in either
a noncomparative or comparative format. We propose that consistency between the ad
format and consumer’s processing mode enhances the processability of ad information,
increasing ad effectiveness.

85
Imagery and Analytical Information Processing
Processing mode describes the manner in which information is represented in
working memory (MacInnis and Price 1987). Imagery and analytical processing are
qualitatively different modes of elaboration (Oliver, Robertson, and Mitchell 1993) that
can occur in a continuum from low to high amounts of elaboration (MacInnis and Price
1987). Although imagery and analytical processing are not mutually exclusive, one mode
of information processing tends to predominate (MacInnis and Price 1987). Imagery is
based on a nonverbal, sensory representation of perceptual information in memory, as
opposed to more semantic, reasoned processing (Childers, Houston, and Heckler 1985).
The overall quality of the imagined experience is used to assess the desirability of an
alternative (Keller and McGill 1994; McGill and Anand 1989). For example, a consumer
may evaluate an apartment by “envisioning romantic evenings by the fireplace” and
assessing how good the fantasy feels (Keller and McGill 1994, 31). Because imagery is a
holistic process, based on the construction of a detailed product-usage scenario for one
alternative, resources for processing information about other brands are reduced
(MacInnis and Price 1987).
In contrast, the analytical mode of information processing is data-driven, more
detached from internal sensory experiences, and focused on verbal retrieval and encoding
(MacInnis and Price 1987). Products are evaluated on an attribute-by-attribute basis, and
the decision-maker combines the attribute values to assess the overall value of the target
product (Sujan 1985). Thus, analytical processing encourages consumers to summarize
features across brands rather than focus on a single brand (MacInnis and Price 1987). As

86
a result, we propose that analytical processing is more compatible with a comparative ad
format than imagery processing.
Information Processability
To influence behavior, information must not only be available to consumers, but
also processable (Bettman and Kakkar 1977). Processability refers to the ease with which
consumers can interpret information. Previous studies show that information
processability depends on the congruence between the type of processing being done and
the organization of information (Payne et al. 1992). For instance, congruence between the
choice task (e.g., lexicographic or conjunctive) and information format (matrix, list by
brand, or list by attribute) can decrease the time required to make a choice and the
perceived task difficulty (Bettman and Zins 1979). Greater information processability can
produce a positive affective response that is transferred to the product being evaluated
(Higgins 1998, Winkielman et al. 2003).
When information is presented in an incompatible format, it may interfere with
consumers’ ability to carry out imagery and analytical information processing. For
example, being asked to imagine a product can decrease product evaluations when a
product is depicted using factual information because the factual information decreases
the fluency of consumption imagery (Petrova and Cialdini 2005). Similarly, consumers
instructed to browse a website and enjoy looking at whatever they considered interesting
were more persuaded by an experiential, imagery-evoking website than by a text-based
website, while consumers instructed to search for something specific were more

87
persuaded by the text-based website (Schlosser 2003). These findings suggest that
consistency between the type of information provided and the mode of information
processing used by the consumer is an important predictor of persuasion.
We extend this stream of research by proposing that consistency between ad
format and the consumer’s processing mode enhances the processability of ad
information and improves ad effectiveness. Specifically, because attribute-by-attribute
comparisons facilitate the assessment of the product’s benefits relative to competitors and
encourage consumers to evaluate brands relative to one another (Miniard et al. 1993,
Rose et al. 1993), we predict that comparative ads will be more effective than
noncomparative ads when consumers use analytical processing. Conversely, when
consumers use imagery processing, we predict that noncomparative ads will be more
effective than comparative ads, because attribute-by-attribute comparisons make it more
difficult to imagine the advertised product.
We present three studies that examine the effects of consistency between ad
format and the consumer’s mode of information processing on information processability
and ad effectiveness. We manipulate information processing mode using both processing
instructions external to the advertisement (studies 1a and 1b) and ad executional cues
(study 2), and we measure information processability and ad effectiveness. Our measures
of ad effectiveness include cognitive (message persuasiveness), affective (ad evaluations
and brand evaluations) and conative (purchase intentions) variables (Grewal et al. 1997).
In all studies, participants were explicitly asked to look at the ads, and the ads were not
embedded within other material.

88
Study 1A
Study 1a examines whether consistency between the consumer’s information
processing mode and ad format enhances information processability and message
persuasiveness.
Participants and Design
Eighty-nine undergraduate students (52.8% females, Mage = 21.02) participated in
the study in exchange for extra credit in a marketing class. Participants were randomly
assigned to conditions in a 2 processing instructions (analytical or imagery processing) x
2 ad format (noncomparative or comparative ad) between subjects experimental design.
Stimuli. A pretest was conducted to identify an appropriate product and attributes
to be used for the stimuli. Thirty-three participants rated their familiarity with six product
categories and related attributes. We selected cars based on high familiarity with this
product category.
We prepared a comparative and a noncomparative ad for a car, varying only the
text of the ad across conditions (see Appendix 6). The advertised brand had superior
levels of four attributes (sunroof, sound system, warranty, security system) relative to the
compared brands. Fictitious brand names (Allegre, Legatto, Specter) were
counterbalanced between the advertised and compared brands across conditions. All
graphic elements, including the size of the picture, were identical across the ads. The
common picture across the ads was of an Australian car not sold in the American market.
89
A second pretest (N = 30) verified that the subject population did not recognize the model
or brand of the car.
Information processing instructions. The processing manipulation varied the
instructions given to participants about how they should process the ad information
(Keller and McGill 1994). In the analytical condition, participants were asked to focus on
the attributes and benefits of the advertised car and think about how the attributes of the
car would meet their needs. In the imagery condition, participants were asked to try to
picture the advertised car in their mind and to imagine as vividly as possible their
experience with the car. To ensure that our manipulation affected processing, we ran a
third pretest (N = 62). Analytical processing was measured using four items (e.g., “I
evaluated the car feature by feature rather than evaluating the car as a whole”), and
imagery processing was measured using three items (e.g., “I imagined myself driving the
car in the ad,” Keller and McGill 1994) on seven-point Likert scales. ANOVAs on these
measures indicated that both the analytical and imagery instructions were successful. The
analytical instructions generated significantly more analytical processing (M = 4.9) than
the imagery instructions (M = 4.3, F(1, 58) = 4.18, p < .05) and the imagery instructions
generated significantly more imagery processing (M = 4.3) than the analytical
instructions (M = 3.5, F(1, 58) = 5.54, p < .05). No other effects were significant (all ps >
.095).
Procedures and Measures
Each participant was given a folder containing the information processing
90
instructions, a print ad for the car, and a question booklet. First, we measured information
processability by asking participants to rate the ease of evaluating the advertised brand
and the fluency of either analytical or imagery processing. In the imagery conditions,
participants rated how easy it was to create a mental image, how long it took to imagine
the advertised brand, and how clear their mental images were (Petrova and Cialdini
2005). In the analytical conditions, participants rated how easy it was to consider the
brand feature-by-feature, how well they understood the brand’s features, and how clear
the brand’s advantages were. After completing the fluency measures, participants
answered some filler questions. Next, participants reported the extent to which they
engaged in imagery and analytical information processing using the measures from our
pretest. Finally, we measured message persuasiveness by asking participants to rate the
message as being not persuasive/persuasive, providing weak/strong arguments, and
containing unimportant/important information. All dependent measures used nine-point
scales.
Results
Scale reliability ranged from .71 to .89. The name of the advertised brand did not
affect any of the measures (all ps > .33), so analyses were performed on data aggregated
across brand names. Indicating that our processing instructions were effective,
participants engaged in more analytical processing in the analytical (M = 4.9) than in the
imagery condition (M = 4.3; F(1, 85) = 4.98, p < .05), and more imagery processing in
the imagery (M = 3.8) than in the analytical condition (M = 2.9; F(1, 84) = 8.52, p < .01).
No other effects were significant (ps > .11).

91
Information processability. A 2 x 2 ANOVA on perceived ease of evaluation
showed a main effect of processing instructions (F(1, 85) = 3.97, p < .05) that was
qualified by the predicted interaction between processing instructions and ad format (F(1,
85) = 16.7, p < .001). In the analytical conditions, participants exposed to the
comparative ad believed it was easier to evaluate the brand (M = 6.5), relative to
participants exposed to the noncomparative ad (M = 5.2, F(1, 43) = 6.38, p < .05) but the
reverse was true in the imagery conditions (Mc = 5.8, Mnc = 7.1, F(1, 42) = 11.82, p <
.001). No other effects were significant (all ps > .90).
Our imagery and analytical fluency measures also showed a positive effect of
matching ad format and processing mode. In the analytical conditions, analytical fluency
was higher for the comparative ad (M = 6.5) relative to the noncomparative ad (M = 4.7,
F(1, 41) = 15.7, p < .001). Conversely, in the imagery conditions, imagery fluency was
higher for the noncomparative (M = 6.9) than for the comparative ad (M = 5.7, F(1, 42) =
7.1, p < .05).
Message persuasiveness. A 2 x 2 ANOVA on message persuasiveness revealed a
significant interaction between processing instructions and ad format (F(1, 85) = 21.4, p
< .001). As predicted, in the analytical conditions, the message in the comparative ad was
more persuasive (M = 6.1) than the message in the noncomparative ad (M = 4.3, F(1, 43)
= 18.54, p < .001), but the reverse was true in the imagery conditions (Mc = 4.7, Mnc =
5.7, F(1, 42) = 5.37, p < .05). No other effects were significant (all ps > .53).

92
Mediation analysis. A mediation analysis revealed that the interactive effect of
processing instructions and ad format on message persuasiveness was partially mediated
by ease of evaluation (Sobel z = -2.17, p < .05; Baron and Kenny 1986). When message
persuasiveness was regressed on the between-subjects factors, the interaction between
processing instructions and ad format was significant (β = -.44, t(85) = -4.62, p < .001).
The same interaction was significant when ease of evaluation was regressed on the
between subjects-factors (β = -.39, t(85) = -4.09, p < .001). Finally, when ease of
evaluation was entered as a predictor in the first regression equation, the significance of
the interaction effect was reduced (β = -.33, t(84) = -3.32, p < .01) and ease of evaluation
was significant (β = .26, t(84) = 2.57, p < .05).
A second mediation analysis using our analytical and imagery fluency measures
indicated that processing fluency mediated the effect of matching information processing
and ad format on message persuasiveness. As depicted in Table 3, in the analytical
condition, comparative ads increased analytical fluency, which in turn, increased message
persuasiveness (Sobel z = 3.32, p < .001). Similarly, in the imagery condition,
noncomparative ads increased imagery fluency, which in turn improved message
persuasiveness (Sobel z = -2.11, p < .05). Thus, matching ad format with processing
instructions appears to increase message persuasiveness by improving the processability
of information.

93
TABLE 3 – Mediation Analysis for Analytical and Imagery Fluency
Condition Equation number
Dependent variable
Independent variable(s)
Standardized regression coefficient
t-value
(1) Message persuasiveness Ad format .54 4.30***(2) Analytical fluency Ad format .52 3.99***
Ad format .16 1.66
Analytical
(3) Message persuasiveness Analytical fluency .73 7.34***
(1) Message persuasiveness Ad format -.33 -2.31* (2) Imagery fluency Ad format -.38 -2.65*
Ad format -.15 -1.08
Imagery
(3) Message persuasiveness Imagery fluency .48 3.48**
NOTE: * p < .05, ** p < .01, *** p < .001
Study 1B
In study 1b, we use the same stimuli and procedures to examine whether the
positive effect of matching information processing mode and ad format transfers to ad
effectiveness measures such as ad evaluations, brand evaluations, and purchase
intentions.
Participants and Design
Eighty-three undergraduate students (55% females, Mage = 21.16) participated in
the study for extra credit. Participants were randomly assigned to conditions in a 2
processing instructions (analytical or imagery) x 2 ad format (noncomparative or
comparative) between subjects design. Stimuli, procedures and manipulation checks were
identical to those in study 1a.
Procedures and Measures
Each participant was given a folder containing the information processing
94
instructions, a print ad for the car, and a question booklet. First, we measured ad and
brand evaluations by asking participants to rate the ad and the brand as bad/good,
pleasant/unpleasant, favorable/ unfavorable, worthless/valuable and not
interesting/interesting (MacKenzie and Lutz 1989; Mick 1992). Next, we measured
purchase intentions by asking participants how likely they were to choose the advertised
brand (definitely would not/certainly would choose). Finally, participants rated the
importance of each listed product attribute, their involvement and familiarity with the
product category and the informativeness of the ad. All items used nine-point scales.
Results
Reliability for scales with multiple items ranged from .88 to .94. The name of the
advertised brand did not affect any of the measures (all ps > .29), so analyses were
performed on aggregated data. Familiarity and involvement with the category and the
perceived importance of product attributes did not differ across conditions (all ps > .10).
To investigate the predicted interaction between processing instructions and ad
format, we ran a 2 processing instructions x 2 ad format MANOVA on ad evaluations,
brand evaluations and purchase intentions.16 There were no main effects of processing
instructions (p > .57) or ad format (p > .42). However, as expected, there was a
significant interaction between processing instructions and ad format (Wilk’s lambda =
.81, F(3, 77) = 5.91, p < .01). This interaction was significant for each of the dependent
measures (all ps < .01).17 Table 4 presents the cell means.
16 All correlations among these dependent variables were significant (ps < .001) and ranged from .49 to .64. 17 A 2 x 2 ANOVA on perceived ad informativeness revealed a marginally significant effect of ad format (p < .06) and a marginally significant interaction of ad format and processing instructions (p < .06). Informativeness was higher for comparative (M = 6.6) relative to noncomparative ads (M = 5.0, p < .05) in

95
TABLE 4 – Ad Effectiveness as a Function of Processing Instructions and Ad Format
Processing instructions
Ad format
Ad evaluations
Brand evaluations
Purchase intentions
Analytical Noncomparative (n = 20)
5.11a (1.43)
4.70b (1.82)
3.30a (2.17)
Comparative (n = 21)
5.93ac (1.24)
6.41c (1.28)
5.09b (1.86)
Imagery Noncomparative (n = 20)
6.03c (1.24)
6.29ac (1.50)
5.15b (1.63)
Comparative (n = 22)
5.03 a (1.74)
5.31b
(1.64) 4.27ab (1.60)
NOTE. N = 83 participants. Standard deviations are in parentheses. Different subscripts in the same column indicate difference between means is significant (p < .05).
We compared the cell means by running a series of planned contrasts. In the
imagery processing conditions, we predicted that the noncomparative ad would elicit
more positive responses than the comparative ad. Supporting our prediction, in the
imagery conditions, the noncomparative ad generated more positive ad evaluations (Mnc
= 6.03, Mc = 5.03, F(1, 40) = 4.42, p < .05), more positive brand evaluations (Mnc = 6.29,
Mc = 5.31, F(1, 40) = 4.0, p = .05), and marginally greater purchase intentions (Mnc =
5.15, Mc = 4.27, F(1, 40) = 3.1, p < .09) than the comparative ad. In contrast, in the
analytical processing conditions, the comparative ad led to marginally more positive ad
evaluations (Mnc = 5.11, Mc = 5.93, F(1, 39) = 3.85, p < .06), more positive brand
evaluations (Mnc = 4.70, Mc = 6.41, F(1, 39) = 12.3, p < .01), and greater purchase
intentions (Mnc = 3.30, Mc = 5.09, F(1, 39) = 8.0, p < .01) than the noncomparative ad.
These results show that the way consumers process ad information systematically affects
their reactions to comparative and noncomparative ads.
One limitation of studies 1a and 1b is that we used processing instructions to
the analytical condition, but there was no difference across ad formats in the imagery condition (p > .90). When ad informativeness was included as a covariate in our MANOVA, the effect of matching information processing mode and ad format remained significant for each of the dependent measures (ps < .05).
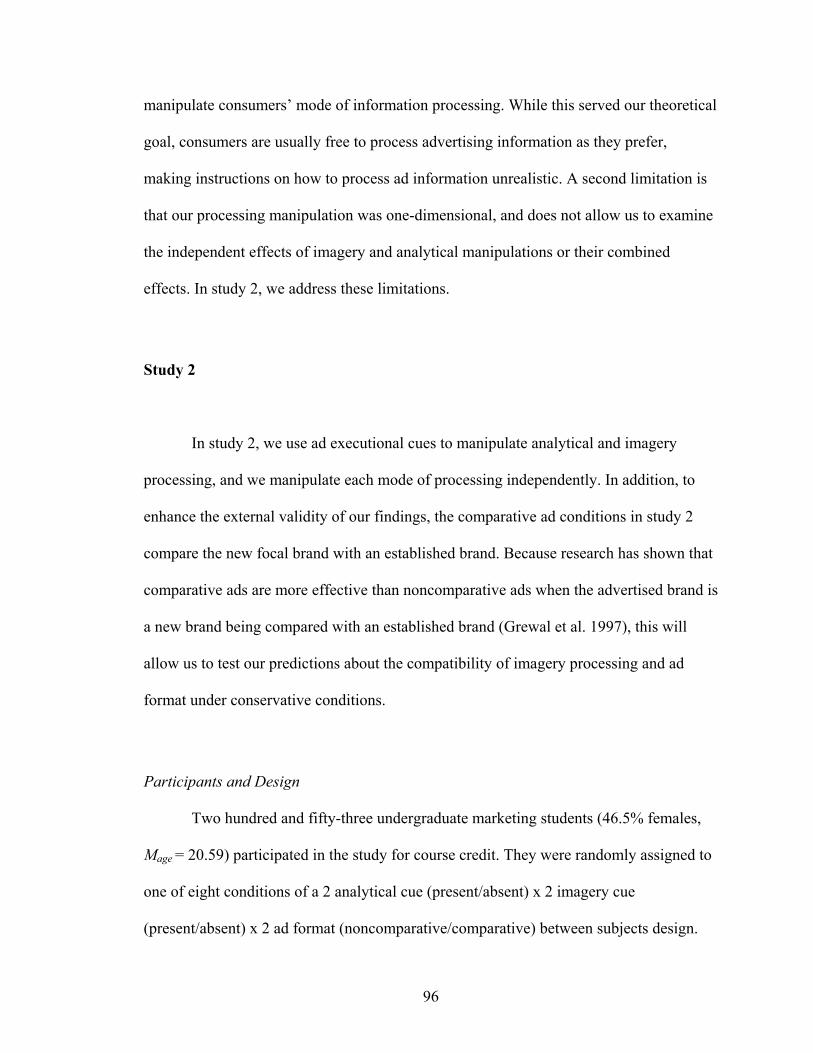
96
manipulate consumers’ mode of information processing. While this served our theoretical
goal, consumers are usually free to process advertising information as they prefer,
making instructions on how to process ad information unrealistic. A second limitation is
that our processing manipulation was one-dimensional, and does not allow us to examine
the independent effects of imagery and analytical manipulations or their combined
effects. In study 2, we address these limitations.
Study 2
In study 2, we use ad executional cues to manipulate analytical and imagery
processing, and we manipulate each mode of processing independently. In addition, to
enhance the external validity of our findings, the comparative ad conditions in study 2
compare the new focal brand with an established brand. Because research has shown that
comparative ads are more effective than noncomparative ads when the advertised brand is
a new brand being compared with an established brand (Grewal et al. 1997), this will
allow us to test our predictions about the compatibility of imagery processing and ad
format under conservative conditions.
Participants and Design
Two hundred and fifty-three undergraduate marketing students (46.5% females,
Mage = 20.59) participated in the study for course credit. They were randomly assigned to
one of eight conditions of a 2 analytical cue (present/absent) x 2 imagery cue
(present/absent) x 2 ad format (noncomparative/comparative) between subjects design.
97
Stimuli. To identify an appropriate comparative brand, we conducted a pretest (N
= 52) in which participants listed all the cars marketed in the United States that came to
their minds after reading our noncomparative ad from study 1. Acura was the most cited
brand, and the Acura RSX model was selected as the comparison brand for the
comparative ads in study 2.
We used our ads from studies 1a and 1b in the no cue conditions. To manipulate
information processing mode, we added imagery and analytical cues (see Appendix 7).
We manipulated imagery processing (imagery cue) by inserting short descriptive
statements before each product attribute (e.g., “You enter the curve, feel the grip of the
seat and enjoy morning sunrays;” Unnava and Burnkrant 1991). Analytical processing
was manipulated by adding a matrix displaying attribute information (analytical cue).
Previous research suggests that such a matrix decreases the effort required to process
information by attribute (Schkade and Kleinmuntz 1994). The text in the matrix-based
ads was the same as the text in the noncomparative ad.
Procedures
Each participant was given a folder containing a print ad for a car and a booklet
with questions. Measures for imagery and analytical information processing, ad and
brand evaluations, and purchase intentions were the same as those used in studies 1a and
1b.

98
Results
Scale reliabilities ranged from .76 to .92. Participants’ familiarity and
involvement with the product category did not differ across conditions (all ps > .10). To
check the effects of our manipulations, we ran a 2 (analytical cue) x 2 (imagery cue) x 2
(ad format) ANOVA on the imagery processing measure. As expected, ads with the
imagery cue induced more imagery processing (M = 3.90) than ads without this cue (M =
3.35, F(1, 245) = 9.7, p < .01). No other effects were significant (ps > .065). A 2 x 2 x 2
ANOVA on the analytical processing measure showed that ads with the analytical cue
induced more analytical processing (M = 4.56) than ads without this cue (M = 4.04, F(1,
245) = 11.7, p < .01). The main effect of the imagery cue on analytical processing was
also significant (F(1, 245) = 5.96, p < .05), indicating that the imagery cue had a negative
effect on analytical processing. No other effects were significant (ps > .17).
Ad effectiveness. A 2 x 2 x 2 MANOVA showed the predicted interaction between
analytical cue and ad format on ad effectiveness (Wilk’s Lambda = .96, F(3, 242) = 3.82,
p < .05), and no other effects were significant (ps > .17).18 At the univariate level, this
interaction was significant for all three dependent variables (ps < .01). Table 5 displays
the cell means.
The interaction between imagery cue and ad format was marginally significant
(Wilk’s Lambda = .97, F(3, 242) = 2.53, p < .06). At the univariate level, this interaction
was significant for brand evaluations and purchase intentions (ps < .05), but not for ad
18 As in study 1b, a 2 x 2 x 2 ANOVA on ad informativeness revealed a main effect of ad format (p < .01). Including informativeness as a covariate in our model produced results similar to the MANOVA. The interaction of analytical cue and ad format was significant for all three variables (ps < .02). The interaction of imagery cue and ad format was significant for brand evaluations and purchase intentions (ps < .05), but not ad evaluations (p > .43).

99
evaluations (p = .40). Interestingly, the nonsignificant result for ad evaluations appears to
be driven by the lack of difference in ad evaluations in the mixed cue condition. To
further examine this effect, we compared the dependent variables across single cue, no
cue, and mixed cue conditions.
TABLE 5 – Ad Effectiveness as a Function of Processing Cues and Ad Format
Analytical cue
Imagery cue
Ad format
Analytical processing
Imagery processing
Ad evaluation
Brand evaluation
Purchase intentions
Matrix absent
Neutral text
NC (n = 32)
4.01ad
(1.17) 2.95a (1.34)
5.23ab (1.28)
5.65ac (1.32)
3.78ac (1.64)
COMP (n = 33)
4.28ab (1.12)
3.65b (1.48)
4.70a (1.61)
5.90ab (1.65)
4.00ab (1.95)
Imagery text
NC (n = 31)
4.11ab (1.32)
4.15b (1.28)
5.72b (1.52)
6.45b (1.04)
4.65b (1.47)
COMP (n = 31)
3.74ad (1.07)
3.72b (1.47)
5.01a (1.36)
5.56ac (1.36)
3.52a (1.67)
Matrix present
Neutral text
NC (n = 32)
4.67bc (1.16)
3.29a (1.22)
4.92a (1.51)
5.38a (1.49)
3.38a (1.66)
COMP (n = 32)
4.95c (.93)
3.51ab (1.49)
5.70b (1.43)
6.25b (1.15)
4.41bc (1.96)
Imagery text
NC (n = 30)
4.25bd (1.28)
3.66b (1.31)
5.46ab (1.56)
5.80ab (1.42)
4.03ab (1.99)
COMP (n = 32)
4.34bd (1.47)
4.06b (1.52)
5.79b (1.47)
6.15bc (1.47)
4.44bc (1.93)
NOTE. N = 253 participants. Standard deviations are in parentheses. Different subscripts in the same column indicate difference between means is significant (p < .05).
As expected, the single cue conditions replicated our earlier findings. Consistent
with our matching hypothesis, when the ad presented only an imagery cue, the
noncomparative format was marginally more effective than the comparative format for ad
evaluations (Mnc = 5.72, Mc = 5.01, F(1, 60) = 3.75, p < .06) and significantly more
effective for brand evaluations (Mnc = 6.45, Mc = 5.56, F(1, 60) = 8.32, p < .01) and
purchase intentions (Mnc = 4.65, Mc = 3.52, F(1, 60) = 7.96, p < .01). Conversely, when
the ad presented only an analytical cue, comparative ads were more effective than
noncomparative ads for ad evaluations (Mnc = 4.92, Mc = 5.70, F(1, 62) = 6.87, p < .05),
brand evaluations (Mnc = 5.38, Mc = 6.25, F(1, 62) = 4.46, p < .05), and purchase

100
intentions (Mnc = 3.38, Mc = 4.41, F(1, 62) = 5.14, p < .05).
Comparative and noncomparative ads were equally effective when neither
imagery nor analytical cues were present (all ps > .14) and when both cues were present
(all ps > .35). This is consistent with both the nonsignificant three-way interaction in our
MANOVA and our finding that the imagery cue inhibited analytical processing. The fact
that differences in the effectiveness of comparative and noncomparative ads are
significant only in the single cue conditions provides further evidence for the importance
of matching ad format to processing cues.
Mediation analysis. To examine our proposed process mechanism, we tested
whether information processing mode mediated the effect of the ad cues on ad
effectiveness. We combined our measures of ad evaluations, brand evaluations and
purchase intentions to form an ad effectiveness score. Table 6 depicts the results of this
mediation analysis. Following Baron and Kenny’s (1986) procedures, we found that
analytical processing mediated the effect of the analytical cue on ad effectiveness in the
comparative condition (Sobel z = 2.34, p < .05),19 but not in the noncomparative
condition (ps > .19). Conversely, imagery processing mediated the effect of the imagery
cue on ad effectiveness in the noncomparative condition (Sobel z = 3.17, p < .01),20 but
not in the comparative condition (ps > .23). Thus, analytical cues made comparative ads
more effective by increasing analytical processing, while imagery cues made
noncomparative ads more effective by increasing imagery processing.
19 When mediation was performed using the individual dependent measures, mediation was significant for brand evaluations and purchase intentions (ps < .05) and marginal for ad evaluations (p < .08). 20 Mediation was significant for brand evaluations, purchase intentions, and ad evaluations (ps < .01).

101
TABLE 6 – Mediation Analysis for Analytical and Imagery Processing
Condition Equation number
Dependent variable
Independent variable(s)
Standardized regression coefficient
t-value
(1) Ad effectiveness Analytical cue .23 2.68** (2) Analytical processing Analytical cue .25 3.0**
Analytical cue .14 1.75
Comparative
(3) Ad effectiveness Analytical
processing .32 3.78***
(1) Ad effectiveness Imagery cue .23 2.73** (2) Imagery processing Imagery cue .29 3.38**
Imagery cue .05 .74
Non- comparative
(3) Ad effectiveness Imagery
processing .63 8.83***
NOTE: ** p < .01, *** p < .001
General Discussion
Our studies extend previous research on the role of information processability in
persuasion. We show that different modes of information processing can either enhance
or undermine the effectiveness of advertising, depending on the match between the
format of the ad and the processing mode consumers use to encode ad information. In
study 1a, we show that matching ad format to the consumer’s processing mode can
improve information processability (i.e. fluency or ease of processing), and that this
enhanced processability increases message persuasiveness. Studies 1b and 2 show that
the positive effect of matching ad format and information processing modes transfers to
consumers’ attitudes and purchase intentions.
Although previous studies have shown that imagery processing generally
enhances brand evaluations and purchase intentions relative to analytical processing (e.g.,
Escalas 2004; Oliver et al. 1993), our findings identify a boundary condition for the
positive effects of imagery processing on persuasion. When ad format is inconsistent with
102
imagery processing, inducing imagery processing produces more negative brand
evaluations and purchase intentions than analytical processing. The piecemeal
comparisons presented in comparative ads increase the difficulty of imagining the target
product, decreasing ad effectiveness.
Study 1a provides evidence that matching ad format with processing mode
improves ease of evaluation, resulting in greater message persuasiveness. Because the
positive effects of fluency tend to be stronger under conditions that limit information
processing, such as time pressure or lack of motivation (Winkielman et al. 2003), and our
participants were instructed to read the ad and spend as much time as they wished on the
task, our test was relatively conservative. Moreover, these instructions should minimize
differences in elaboration across conditions. Recent studies show that other types of
matching, such as matching messages to individuals’ self-schemata (Wheeler, Petty and
Bizer 2005) and matching messages to self-regulatory goals (Aaker and Lee 2001), can
improve persuasion by inducing greater elaboration. In future research, it would be
interesting to test for additive or interactive effects of elaboration level and ease of
evaluation on ad effectiveness.
Study 2 provides insight into the effects of mixed processing cues on persuasion.
Although previous studies suggest that the simultaneous use of two different types of
information processing cues (e.g., item-specific and relational) can improve brand
evaluations (Malaviya, Kisielius, and Sternthal 1996; Meyers-Levy and Malaviya 1999),
we find that combining imagery and analytical cues does not increase ad effectiveness.
Examining conditions under which multiple cues improve or impede persuasion is a
potentially rich area for research. While we predict that combining two complementary

103
cues (e.g., imagery processing instructions and imagery-evoking text) will be at least as
effective as each individual cue, combining non-complementary cues should weaken the
effect of each cue on ad effectiveness.
Our findings suggest that information processing cues both external to ads and
embedded within ads can significantly influence consumers’ reactions to comparative
advertising. We expect other kinds of cues to produce similarly systematic effects. For
example, product-level cues, such as the hedonic or utilitarian nature of the product
(Hirschman and Holbrook 1982) or the novelty of the product (Oliver et al. 1993), can
induce either imagery or analytical processing. Research has also shown that ad cues
(e.g., pictures, size of claim set) can increase or decrease associative processing
(Malaviya et al. 1996; Meyers-Levy 1991). Given the importance of both associative
(Sujan and Dekleva 1987) and differentiating effects (Rose et al. 1993) in comparative
advertising, these cues could be significant predictors of ad effectiveness.
While we contrasted noncomparative ads with high-intensity comparative ads that
explicitly mention competing brands, these are only two extreme points in a spectrum.
Many ads invoke comparisons in a less explicit manner. For example, ads suggesting
consumers will regret not purchasing an advertised brand might trigger an internal
comparative process. If such internal processes are triggered, imagery cues may decrease
ad effectiveness even without explicit comparisons. Ads also might present comparisons
visually rather than using explicit text-based comparisons. It would be interesting to test
whether visual comparisons between brands are more compatible with analytical or
imagery processing. Our results suggest that ad effectiveness will be commensurate with
the degree to which processing mode matches ad format.

104
Earlier research has distinguished between the availability and the processability
of information (Payne et al. 1992). Our findings extend research on processability by
demonstrating that providing additional positive information about a brand can decrease
rather than increase brand evaluations when the information is presented in a format
inconsistent with the consumer’s processing mode. Although our comparative ads
provided strictly more positive information about the brand, comparative ads were
perceived to be less persuasive and produced less favorable brand evaluations than
noncomparative ads when consumers used imagery processing. Clearly, these negative
effects were not due to information overload, because the same additional information
produced more positive brand evaluations when consumers used analytical rather than
imagery processing. Moreover, despite the greater perceived informativeness of
comparative ads, including perceived ad informativeness as a covariate did not change
our results. Thus, the positive effect of matching ad format to information processing
mode is robust to the availability of additional positive information about the brand.

105
Appendices
Appendix 1 – Product Features Used in Essay 1
Low Feature Model Medium Feature Model High Feature Model
Video Player
Playback control buttons Frame advance Audio navigation menu Choice of playback formats Digital recording capability 3D sound function Removal of video from playlist
Playback control buttons Frame advance Audio navigation menu Choice of playback formats Digital recording capability 3D sound function Removal of video from playlist
Playback control buttons Frame advance Audio navigation menu Choice of playback formats Digital recording capability 3D sound function Removal of video from playlist
Video Player
Date and time functions Aspect-ratio control Picture zoom Slow motion Forward frame-by-frame One-button replay Recording modes
Date and time functions Aspect-ratio control Picture zoom Slow motion Forward frame-by-frame One-button replay Recording modes
Video Player
Block Noise Reduction Bookmarks Reverse frame-by-frame Multi-angle capability Built-in memory stick Digital video enhancer Hybrid variable bit rate encoder system
Audio Player
Playback control buttons Choice of file formats supported Play modes Playlist editing Playlist buttons CD burning capability Removal of songs from playlist
Playback control buttons Choice of file formats supported Play modes Playlist editing Playlist buttons CD burning capability Removal of songs from playlist
Playback control buttons Choice of file formats supported Play modes Playlist editing Playlist buttons CD burning capability Removal of songs from playlist
Audio Player
Auto resume Digital radio tuner Equalizers/bass boost Track search Digital recording capability Song/track information Browsing engines
Auto resume Digital radio tuner Equalizers/bass boost Track search Digital recording capability Song/track information Browsing engines
Audio Player
Pre-amplifier settings Date and time functions Sleep timer Now playing/artist match feature Visualizations Sound editing software Media library window

106
Appendix 2 – Measures Used in Essays 1 and 2
Construct Items Expertise (Mitchell and Dacin 1996)
7-point scale How familiar are you with digital video players? (Not familiar at all /Very familiar) How clear an idea do you have about which characteristics are important in providing you maximum usage satisfaction? (Not very clear/Very clear) I know a lot about digital video players. (Disagree/Agree) How would you rate your knowledge of digital video players relative to other college students? (One of the least knowledgeable people/One of the most knowledgeable people) How frequently do you use digital video players? (Never use/Use all the time)
Product Capability (Essay 1 – study 1,
Mukherjee and Hoyer 2001)
7-point scale
This digital video player: Performs poorly/Performs well Offers few advantages/Offers a lot of advantages Adds little value/Adds a lot of value
Product Capability (Essay 1 – study 3 and
Essay 2)
7-point scale
This digital video player: Performs few functions/Performs many functions Has few features/Has many features Has few capabilities/Has many capabilities
Product Usability (Chin, Diehl and Norman
1988)
7-point scale
Learning to use the product will be easy for me. (Disagree/Agree) Tasks can be performed in a straightforward manner. (Disagree Agree) Interacting with the product will not require a lot of my mental effort.
(Disagree/Agree) My interaction with the product will be clear and understandable.
(Disagree/Agree) I think the product will be easy to use. (Disagree/Agree) I think it will be easy to get the product to do what I want it to do.
(Disagree/Agree) How difficult you expect each of the following actions to be: Exploring new features by trial and error (Difficult/Easy) Remembering use of commands (Difficult/Easy)

107
Construct Items
Product Utility (Peracchio and Tybout 1996)
7-point scale
You consider this digital video player: Bad/Good Unlikable/Likable Not useful/Useful Undesirable/Desirable High quality/Low quality Unfavorable/Favorable
Product Satisfaction
7-point scale
How satisfied would you be if you subscribed to the digital video player? (Before use condition) (Dissatisfied/Satisfied) How satisfied were you with the digital video player? (After use condition) (Dissatisfied/Satisfied)
Purchase Intentions
7-point scale
How likely is that you would subscribe to this digital video player? (Very unlikely/Very likely)
Relative Preference
7-point scale
Rate the extent to which you prefer each digital camera: Definitely prefer camera A/ Definitely prefer camera B
Decision Confidence
7-point scale
How confident are you about your decision? (Not confident at all/ Very confident)
Choice Difficulty
7-point scale
How difficult was it for you to make this decision? (Not difficult/Very difficult)
Familiarity and Importance of Product
Features
7-point scale
Not familiar at all/ Very familiar Not important at all/ Very important
Mental Construal (Liberman and Trope 1998)
In your own words, describe the activity of using a digital video player.
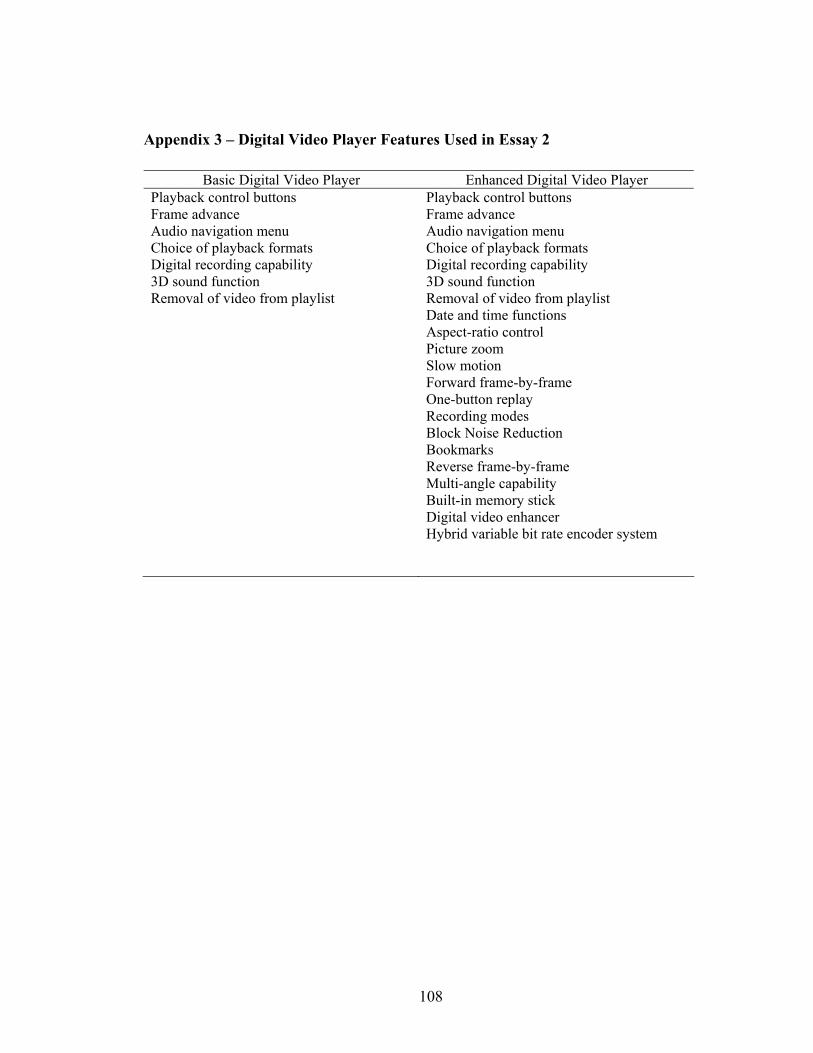
108
Appendix 3 – Digital Video Player Features Used in Essay 2
Basic Digital Video Player Enhanced Digital Video Player Playback control buttons Frame advance Audio navigation menu Choice of playback formats Digital recording capability 3D sound function Removal of video from playlist
Playback control buttons Frame advance Audio navigation menu Choice of playback formats Digital recording capability 3D sound function Removal of video from playlist Date and time functions Aspect-ratio control Picture zoom Slow motion Forward frame-by-frame One-button replay Recording modes Block Noise Reduction Bookmarks Reverse frame-by-frame Multi-angle capability Built-in memory stick Digital video enhancer Hybrid variable bit rate encoder system

109
Appendix 4 – Digital Camera Features Used in Essay 2
Basic Digital Camera Enhanced Digital Camera Built-in retractable auto flash Built-in red eye reduction 10-sec self timer Auto and manual exposure mode Settings for daylight, shade, and overcast Photo effect settings Wide-area auto focus with automatic and manual point selection
Built-in retractable auto flash Built-in red eye reduction 10-sec self timer Auto and manual exposure mode Settings for daylight, shade, and overcast Photo effect settings Wide-area auto focus with automatic and manual point selection Custom controls for aperture priority and shutter speeds Movie modes On-camera movie playback Review modes On-camera share button Storage of album names and e-mail addresses Shot burst mode Different camera processing speeds Built-in microphone Adjustable color saturation and contrast Annotation feature Time lapse feature Compression settings to control resolution Image stabilization capability

110
Appendix 5 – Mental Construal Manipulation Used in Essay 2 (Studies 2 and 3) Concrete mental construal condition:
“How Do We Do the Things We Do?”
For everything we do, there always is a process of how we do it. Moreover, we often can follow our broad life-goals down to our very specific behaviors. For example, like most people, you probably hope to find happiness in life. How can you do this? Perhaps finding a good job, or being educated, can help. How can you do these things? Perhaps by earning a college degree. How do you earn a college degree? By satisfying course requirements. How do you satisfy course requirements? In some cases, such as today, you participate in a marketing experiment. Research suggests that engaging in thought exercise like that above, in which one thinks about how one’s ultimate life goals can be expressed through specific actions, can improve people’s life satisfaction. In this experiment, we are testing such a technique. This thought exercise is intended to focus your attention on how you do the things you do. For this thought exercise, please consider the following activity: “Improving and maintaining your health.” 1a. In the space below, please list something you could do in order to improve and maintain your health. _ _ _ _ _ _ _ _ _ _ _ _ _ _ _ _ _ _ _ _ _ _ _ _ _ _ _ _ _ _ _ _ _ _ _ _ _ _ _ _ _ _ _ _
1b. How much will engaging in this activity improve and maintain your health? Please circle one:
A little Somewhat Pretty Much Very Much Very, Very Much 2a. In the space below, please list something else you could do in order to improve and maintain your health. _ _ _ _ _ _ _ _ _ _ _ _ _ _ _ _ _ _ _ _ _ _ _ _ _ _ _ _ _ _ _ _ _ _ _ _ _ _ _ _ _ _ _ _
2b. How much will engaging in this activity improve and maintain your health? Please circle one:
A little Somewhat Pretty Much Very Much Very, Very Much 3a. In the space below, please list something else you could do in order to improve and maintain your health. _ _ _ _ _ _ _ _ _ _ _ _ _ _ _ _ _ _ _ _ _ _ _ _ _ _ _ _ _ _ _ _ _ _ _ _ _ _ _ _ _ _ _ _
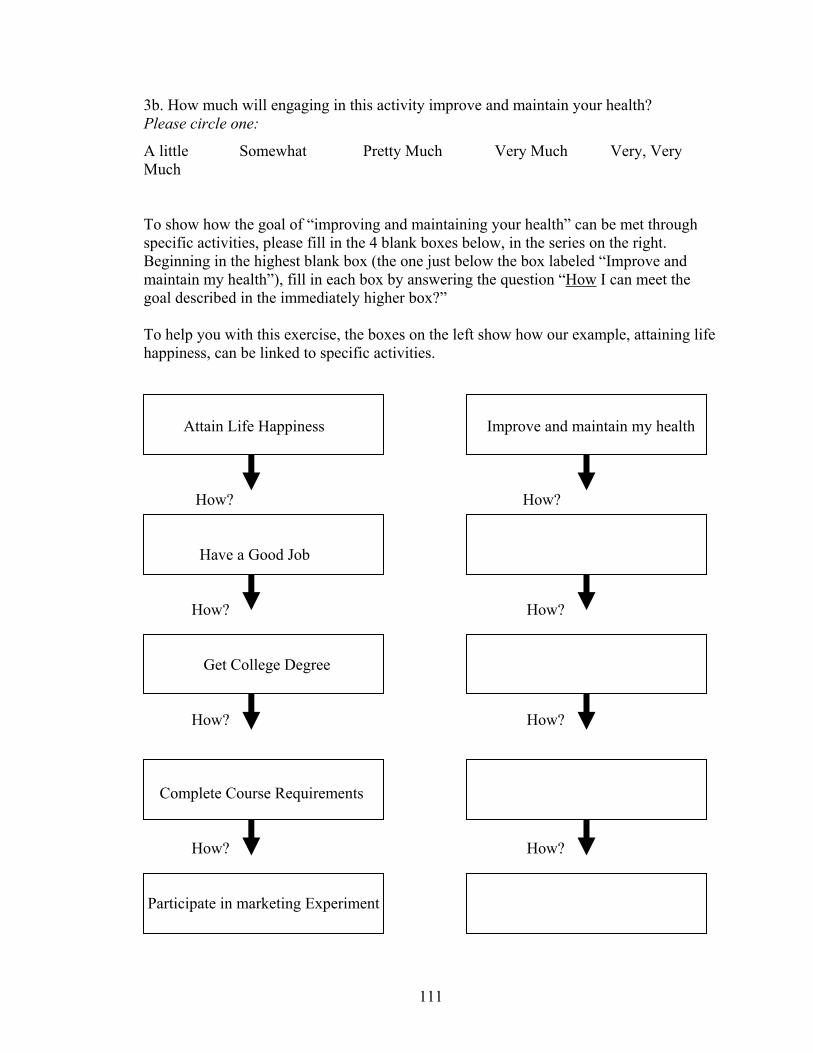
111
3b. How much will engaging in this activity improve and maintain your health? Please circle one:
A little Somewhat Pretty Much Very Much Very, Very Much To show how the goal of “improving and maintaining your health” can be met through specific activities, please fill in the 4 blank boxes below, in the series on the right. Beginning in the highest blank box (the one just below the box labeled “Improve and maintain my health”), fill in each box by answering the question “How I can meet the goal described in the immediately higher box?” To help you with this exercise, the boxes on the left show how our example, attaining life happiness, can be linked to specific activities. Attain Life Happiness Improve and maintain my health
How? How? Have a Good Job How? How? Get College Degree How? How?
Complete Course Requirements
How? How?
Participate in marketing Experiment

112
Abstract mental construal condition:
“Why Do We Do the Things We Do?”
For every thing we do, there always is a reason why we do it. Moreover, we often can trace the causes of our behavior back to broad life-goals that we have. For example, you currently are participating in a marketing experiment. Why are you doing this? Perhaps to satisfy a course requirement. Why are you satisfying the course requirement? Perhaps to pass a course. Why pass the course? Perhaps because you want to earn a college degree. Why earn a college degree? Maybe because you want to find a good job, or because you want to educate yourself. And perhaps you wish to educate yourself or find a good job because you feel that doing so can bring you happiness in life. Research suggests that engaging in thought exercise like that above, in which one thinks about how one’s actions relate to one’s ultimate life goals, can improve people’s life satisfaction. In this experiment, we are testing such a technique. This thought exercise is intended to focus your attention on why you do the things you do. For this thought exercise, please consider the following activity: “Improve and maintain your health.” 1a. In the space below, please list one way in which improving and maintaining your health could help you meet an important life goal that you have. _ _ _ _ _ _ _ _ _ _ _ _ _ _ _ _ _ _ _ _ _ _ _ _ _ _ _ _ _ _ _ _ _ _ _ _ _ _ _ _ _ _ _ _
1b. How much will improving and maintaining your health help you meet this important goal? Please circle one:
A little Somewhat Pretty Much Very Much Very, Very Much 2a. In the space below, please list one way in which improving and maintaining your health could help you meet another important life goal that you have. _ _ _ _ _ _ _ _ _ _ _ _ _ _ _ _ _ _ _ _ _ _ _ _ _ _ _ _ _ _ _ _ _ _ _ _ _ _ _ _ _ _ _ _
2b. How much will improving and maintaining your health help you meet this important goal? Please circle one:
A little Somewhat Pretty Much Very Much Very, Very Much 3a. In the space below, please list one way in which improving and maintaining your health could help you meet another important life goal that you have. _ _ _ _ _ _ _ _ _ _ _ _ _ _ _ _ _ _ _ _ _ _ _ _ _ _ _ _ _ _ _ _ _ _ _ _ _ _ _ _ _ _ _ _

113
3b. How much will improving and maintaining your health help you meet this important goal? Please circle one:
A little Somewhat Pretty Much Very Much Very, Very Much To show how the activity of “improving and maintaining your health” can help you meet important life goals that you have, please fill in the 4 blank boxes below, in the series on the right. Beginning in the lowest blank box (the one just above the box labeled “improve and maintain my health”), fill in each box by answering the question “Why do I engage in the behavior described in the immediately lower box?” To help you with this exercise, the rectangles on the left show how our example, participating in a marketing experiment, can be linked to important life goals. Attain Life Happiness
Why? Why? Have a Good Job Why? Why? Get College Degree Why? Why?
Complete Course Requirements
Why? Why?
Participate in marketing Experiment Improve and maintain my health

114
Appendix 6 – Ad Stimuli for Essay 3 (Studies 1A and 1B) Noncomparative Ad Comparative Ad

115
Appendix 7 – Ad Stimuli for Essay 3 (Study 2)
Imagery Cue Noncomparative Ad Analytical Cue Noncomparative Ad
Study 1 ads were used in the two no cue conditions. Ads for the other four conditions
combined these imagery and analytical cues with either noncomparative or comparative
formats.
Allegre. Just unbeatable.
New AllegreAthletic, Reliable, Versatile
A touring machine like no other.
You sit back and feel secure with a five-year unlimited warranty at no additional cost.
You enter the curve, feel the grip of the seat and enjoy the warmth of morning sunraysthrough a glass sunroof with a menu of sunshade functions in the standard model.
You watch the road unfold, smile and listen to a premium sound system (200 watts and10 speakers) designed to simply thrill the first time you get in. And every time.
Let others dream of unparalleled luxury and efficiency.Allegre dares to make it real.
You park, walk away and activate a cutting-edge security system that allows youto control all the security features at a distance of one mile from your car.
Allegre. Just unbeatable.
New AllegreAthletic, Reliable, Versatile
A touring machine like no other.
Five-year unlimited warranty at no additional cost.
Glass sunroof with a menu of sunshade functions in the standard model.
A premium sound system (200 watts and 10 speakers) designed to simply thrill thefirst time you get in. And every time.
Let others dream of unparalleled luxury and efficiency.Allegre dares to make it real.
Cutting-edge security system that allows you to activate all the security features at a distanceof one mile from your car.
Glass Sunroof
Sound System
Five-Year Unlimited Warranty
Range of Security System
Yes 200 Watts – 10 speakers
Yes 1 mile
Features of the new Allegre

116
Appendix 8 – Measures Used in Essay 3
Construct Measure Ease of Evaluation
9-point scale
Describe your experience of evaluating Allegre: (Easy/Difficult)
Imagery Fluency (Petrova and Cialdini
2005)
9-point scale
How easy was it to create a mental image of Allegre? (Very easy/Very difficult) How long did it take to imagine the Allegre? (I imagine it right away/ I took some time to imagine it) How clear was your mental image of the Allegre? (Clear/Vague)
Analytical Fluency
9-point scale
It was easy to consider the Allegre feature by feature. (Disagree/Agree) I feel I have a good understanding of the Allegre’s features. (Disagree/Agree) I understand the advantages of the Allegre. (Disagree/Agree)
Imagery Processing (Keller and McGill
1994)
7-point scale
I imagined myself driving the car. (Not very much/A great deal) I savored visions of the car. (Not very much/A great deal) I experienced a sense of fun in thinking about the car. (Not very much/A great deal)
Analytical Processing
7-point scale
I evaluated the car feature by feature rather than evaluating the car as a whole. (Not very much/A great deal) My evaluation of the car was based primarily on the description of its features. (Not very much/A great deal) I tried to use as much information about the features as possible. (Not very much/A great deal) I carefully evaluated the car on several different features. (Not very much/A great deal)
Message Persuasiveness
9-point scale
Indicate to what extent you consider this advertisement: Not persuasive/Persuasive Provides weak arguments/Provides strong arguments Contains unimportant information/Contains important information
Ad and Brand evaluations
9-point scale
Indicate to what extent you consider [this advertisement/the Allegre]: Bad/Good Pleasant/Unpleasant Favorable/Unfavorable Worthless/Valuable Not interesting/Interesting

117
Construct Measure
Ad Informativeness
9-point scale
Indicate to what extent you consider this advertisement: Not informative/Informative
Purchase Intentions
9-point scale
If you were to choose a car, how likely is that you would choose the new Allegre? (Definitely would not/Certainly would)
Familiarity
9-point scale
How familiar are you with this product category (cars)? (Not familiar at all/Very familiar)
Involvement
9-point scale
How important to you is the decision of which car to choose? (Not important at all/Very important)
Attribute Importance
9-point scale
Rate the importance of each of the following car attributes: Security System (Not important at all/Very important) Warranty (Not important at all/Very important) Sound System (Not important at all/Very important) Sunroof (Not important at all/Very important)
118
References Aaker, Jennifer L. and Angela Y. Lee (2001), “’I’ Seek Pleasures and ‘We’ Avoid Pains:
The Role of Self-Regulatory Goals in Information Processing and Persuasion,”
Journal of Consumer Research, 28 (June), 33-49.
Agrawal, Nidhi (2005), “The Effects of Abstract and Concrete Construal on Outcome
Bias,” unpublished working paper, New York University, New York, NY.
Alba, Joseph W. and J. Wesley Hutchinson (1987), “Dimensions of Consumer
Expertise,” Journal of Consumer Research, 13 (March), 411-438.
Ammirati, Sean (2003), “Other Voices: Ask your Users: Less Really Can Be More,”
Information Week, July 14,
http://www.informationweek.com/story/showArticle.jhtml?articleID=12800101.
Baron, Reuben M. and David A. Kenny (1986), “The Moderator-Mediator Variable
Distinction in Social Psychological Research: Conceptual, Strategic, and Statistical
Considerations,” Journal of Personality and Social Psychology, 51(6), 1173-1182.
Bazerman, Max H. (2001), “Consumer Research for Consumers,” Journal of Consumer
Research, 27 (March), 499-504.
Belch, George (1981), “An Examination of Comparative and Noncomparative Television
Commercials: The Effects of Claim Variation and Repetition on Cognitive Response
and Message Acceptance,” Journal of Marketing Research, 28 (August), 333-349.
Bettman, James.R. and Pradeep Kakkar (1977), “Effects of Information Presentation
Format on Consumer Information Acquisition Strategies,” Journal of Consumer
Research, 3 (March), 233-240.
Bettman, James R. and Michel A. Zins (1979), “Information Format and Choice Task

119
Effects in Decision Making,” Journal of Consumer Research, 6 (September), 141-
153.
Bolton, Ruth N. and Katherine N. Lemon (1999), “A Dynamic Model of Customers’
Usage of Services: Usage as an Antecedent and Consequence of Satisfaction,”
Journal of Marketing Research, 36 (May), 171-186.
Brown, Christina L. and Gregory S. Carpenter (2000), “Why is the Trivial Important? A
Reasons-Based Account for the Effects of Trivial Attributes on Choice,” Journal of
Consumer Research, 26 (March), 372-385.
Cadotte, Ernest R., Robert B. Woodruff, and Roger L. Jenkins (1987), “Expectations and
Norms in Models of Consumer Satisfaction,” Journal of Marketing Research, 24
(August), 305-314.
Carpenter, Gregory S., Rashi Glazer and Kent Nakamoto (1994), “Meaningful Brands
from Meaningless Differentiation: The Dependence on Irrelevant Attributes,” Journal
of Marketing Research, 31 (August), 339-350.
Celsi, Richard L. and Jerry C. Olson (1988), “The Role of Involvement in Attention and
Comprehension Processes,” Journal of Consumer Research, 15 (September), 210-
224.
Childers, Terry, Michael Houston and Susan Heckler (1985), “Measurement of
Individual Differences in Visual Versus Verbal Information Processing,” Journal of
Consumer Research, 12 (September), 125-134.
Chin, John P., Virginia A. Diehl and Kent L. Norman (1988), “Development of an
Instrument Measuring User Satisfaction of the Human-Computer Interface,” in
Human Factors in Computing Systems, CHI 88 Conference Proceedings, ed. E.

120
Soloway, D. Frye, and S. B. Sheppard, New York: ACM, 231-219.
Dahan, Ely and V. Srinivasan (2000), “The Predictive Power of Internet-Based Product
Concept Testing Using Visual Depiction and Animation,” Journal of Product
Innovation Management, 17, 99-109.
Daily, Laura (2005), “Test-Drive,” American Way, August 1, 46-47.
Escalas, Jennifer E. (2004), “Imagine Yourself in the Product,” Journal of Advertising,
33 (Summer), 37-48.
Fazio, Russell H. and Mark P. Zanna (1981), "Direct Experience and Attitude-Behavior
Consistency," in Advances in Experimental Research, Vol. 14, ed. L. Berkowitz, New
York: Academic Press, 161-202.
Förster, Jens, Ronald S. Friedman and Nira Liberman (2004), “Temporal Construal
Effects on Abstract and Concrete Thinking: Consequences for Insight and Creative
Cognition,” Journal of Personality and Social Psychology, 87 (2), 177-189.
Freitas, Antonio L., Peter Gollwitzer and Yaacov Trope (2004), “The Influence of
Abstract and Concrete Mindsets on Anticipating and Guiding Other’s Self Regulatory
Efforts,” Journal of Experimental Social Psychology, 40, 739-752.
Freund, Bruno, Herbert König and Norbert Roth (1997), “Impact of Information
Technologies on Manufacturing,” International Journal of Technology Management,
13 (3), 215-228.
Goering, Patricia A. (1985), “Effects of Product Trial on Consumer Expectations,
Demand, and Prices,” Journal of Consumer Research, 12 (June), 74-82.
Goldenberg, Jacob, Roni Horowitz, Amnon Levav and David Mazursky (2003), “
Finding your Innovation Sweet Spot,” Harvard Business Review, March, 120-129.

121
Goodwin, Stephen and Michael Etgar (1980), “An Experimental Investigation of
Comparative Advertising: Impact of Message Appeal, Information Load and Utility
of Product Class,” Journal of Marketing Research, 22 (May), 187-202.
Gorn, Gerald and Charles Weinberg (1984), “The Impact of Comparative Advertising on
Perception and Attitude: Some Positive Findings,” Journal of Consumer Research, 11
(September), 719-727.
Gotlieb, Jerry and Dan Sarel (1991), “Comparative Advertising Effectiveness: The Role
of Involvement and Source Credibility,” Journal of Advertising, 20 (1), 38-45.
Grewal, Dhruv, Sukumar Kavanoor, Edward Fern, Carolyn Costley and James Barnes
(1997), “Comparative Versus Noncomparative Advertising: A Meta-analysis,”
Journal of Marketing, 61 (October), 1-15.
Higgins, Tory E. (1998), “The Aboutness Principle: A Pervasive Influence on Human
Inference,” Social Cognition, 16, 173—198.
Hirschman, Elizabeth and Morris Holbrook (1982), “Hedonic Consumption: Emerging
Concepts, Methods and Propositions,” Journal of Marketing, 46 (Summer), 92-101.
Hoch, Stephen J. (2002), “Product Experience is Seductive,” Journal of Consumer
Research, 29 (December), 448-454.
Hoch, Stephen J. and John Deighton (1989), “Managing What Consumers Learn from
Experience,” Journal of Marketing, 53 (April), 1-20.
Hsee, Christopher K., Jiao Zhang (2004), “Distinction Bias: Misprediction and Mischoice
Due to Joint Evaluation,” Journal of Personality and Social Psychology, 86 (5), 680-
695.
Jones, Russell A. (1977), Self-fulfilling Prophecies: Social, Psychological, and

122
Physiological Effects of Expectations. Hillsdale: Erlbaum.
Keller, Punam Anand and Ann McGill (1994), “Differences in the Relative Influence of
Product Attributes under Alternative Processing Conditions: Attribute Importance
versus Attribute Ease of Imagability,” Journal of Consumer Psychology, 3 (1), 29-49.
Lancaster, Kelvin (1971), Consumer Demand: A New Approach. New York: Columbia
University Press.
Liberman, Nira and Yaacov Trope (1998), “The Role of Feasibility and Desirability
Considerations in Near and Distant Future Decisions: A Test of Temporal Construal
Theory,” Journal of Personality and Social Psychology, 75 (1), 5-18.
MacInnis, Deborah and Linda Price (1987), “The Role of Imagery in Information
Processing: Review and Extensions,” Journal of Consumer Research, 13 (March),
473-491.
MacKenzie, Scott and Richard Lutz (1989), “An Empirical Examination of the Structural
Antecedents of Attitude toward the Ad in an Advertising Pretesting Context,” Journal
of Marketing, 53 (April), 48-65.
Malaviya, Prashant, Jolita Kisielius and Brian Sternthal (1996), “The Effect of Type of
Elaboration on Advertisement Processing and Judgment,” Journal of Marketing
Research, 33 (November), 410-421.
McGill, Ann L. and Punam Anand (1989), “The Effect of Imagery on Information
Processing Strategy in a Multiattribute Choice Task,” Marketing Letters 1(1), 7-16.
McLaughlin, Janice and David Skinner (2000), “Developing Usability and Utility: A
Comparative Study of the Users of New IT,” Technology Analysis & Strategic
Management, 12 (3), 413-423.

123
Meyer, Robert J. (1981), “A Model of Multiattribute Judgments Under Attribute
Uncertainty and Informational Constraint,” Journal of Marketing Research, 28
(November), 421-441.
Meyers-Levy, Joan (1991), “Elaborating on Elaboration: The Distinction Between
Relational and Item-Specific Elaboration,” Journal of Consumer Research, 18
(December), 358-367.
Meyers-Levy, Joan and Prashant Malaviya (1999), “Consumers’ Processing of
Persuasive Advertisements: An Integrative Framework of Persuasion Theories,”
Journal of Marketing, 63 (Special Issue), 45-60.
Mick, David Glen (1992), “Levels of Subjective Comprehension in Advertising
Processing and their Relations to Ad Perceptions, Attitudes and Memory,” Journal of
Consumer Research, 18 (March), 411-424.
Mick, David Glen and Susan Fournier (1998), “Paradoxes of Technology: Consumer
Cognizance, Emotions, and Coping Strategies,” Journal of Consumer Research, 25
(September), 123-143.
Miniard, Paul W., Randall L. Rose, Michael J. Barone and Kenneth C. Manning (1993),
“On the Need for Relative Measures when Assessing Comparative Advertising
Effects,” Journal of Advertising, 22 (September), 41-57.
Mitchell, Andrew A. and Peter A. Dacin (1996), “The Assessment of Alternative
Measures of Consumer Expertise,” Journal of Consumer Research, 23 (December),
219-239.
Mooy, Sylvia C. and Henry S. J. Robben (2002), “Managing Consumers’ Product
Evaluations Through Direct Product Experience,” Journal of Product and Brand

124
Management, 11(7), 432-444.
Mukherjee, Ashesh and Wayne D. Hoyer (2001), “The Effect of Novel Attributes on
Product Evaluation,” Journal of Consumer Research, 28 (December), 462-472.
Nielsen, Jacob (1993), Usability Engineering. San Diego: Academic Press, San Diego.
Novemsky, Nathan and Rebecca K. Ratner (2003), “The Time Course and Impact of
Consumers’ Erroneous Beliefs about Hedonic Contrast Effects,” Journal of
Consumer Research, 29 (March), 507-516.
Nowlis, Stephen M. and Itamar Simonson (1996), “The Effect of New Product Features
on Brand Choice,” Journal of Marketing Research, 33 (February), 36-46.
NTRS (2004), National Technology Readiness Survey. Falls Church: Rockbridge
Associates.
Oliver, Richard L. (1993), “Cognitive, Affective, and Attribute Bases of the Satisfaction
Response,” Journal of Consumer Research, 20 (December), 418-430.
Oliver, Richard L. and Wayne S. DeSarbo (1988), “Response Determinants in
Satisfaction Judgments,” Journal of Consumer Research, 14 (March), 495-507.
Oliver, Richard L., Thomas S. Robertson and Deborah J. Mitchell (1993), “Imaging and
Analyzing in Response to New Product Advertising,” Journal of Advertising, 22
(December), 35-50.
Olson, Jerry C. and Thomas J. Reynolds (1983), “Understanding Consumers’ Cognitive
Structures: Implications for Advertising Strategy” in L. Percy and A. G. Woodside
(eds.), Advertising and Consumer Psychology, Lexington: Lexington Books, 77-90.
Paivio, Allan (1979), Imagery and Verbal Processes. Hillsdale, NJ: Lawrence Erlbaum
Associates.
125
Payne, John W., James R. Bettman and Eric J. Johnson (1992), “Behavioral Decision
Research: A Constructive Processing Perspective,” Annual Review in Psychology, 43,
87-131.
Pechmann, Cornelia and David Stewart (1991), “How Direct Comparative Ads and
Market Share Affect Brand Choice?” Journal of Advertising Research, 31
(December), 47-55.
Peracchio, Laura A. and Alice M. Tybout (1996), “The Moderating Role of Prior
Knowledge in Schema-Based Product Evaluations,” Journal of Consumer Research,
23 (December), 177-191.
Perreault, William D., Jr. and Laurence E. Leigh (1989), “Reliability of Nominal Data
Based on Qualitative Judgments,” Journal of Marketing Research, 26 (May), 135-
148.
Petrova, Petia K. and Robert B. Cialdini (2005), “Fluency of Consumption Imagery
Generation and the Backfire Effects of Imagery Appeals,” Journal of Consumer
Research, 32 (December), 442-452.
Ratchford, Brian T. (2001), “The Economics of Consumer Knowledge,” Journal of
Consumer Research, 27 (March), 397-411.
Read, Daniel and Barbara van Leeuwen (1998), "Predicting Hunger: The Effects of
Appetite and Delay on Choice," Organizational Behavior & Human Decision
Processes, 76 (November), 189-205.
Regan, Dennis and Russell Fazio (1977), “On the Consistency Between Attitudes and
Behavior: Look to the Method of Attitude Formation,” Journal of Experimental
Social Psychology, 13 (1), 28-45.
126
Rose, Randall, Paul Miniard, Michael Barone, Kenneth Manning and Brian Till (1993),
“When Persuasion Goes Undetected: The Case of Comparative Advertising,” Journal
of Marketing Research, 30 (August), 315-330.
Rust, Roland T., J. Jeffrey Inman, Jianmin Jia and Anthony Zahorik (1999), “What You
Don’t Know About Customer-Perceived Quality: The Role of Customer Expectation
Distributions,” Marketing Science, 18 (1), 77-92.
Schkade, David A. and Don N. Kleinmuntz (1994), “Information Displays and Choice
Processes: Differential Effects of Organization, Form, and Sequence,” Organizational
Behavior and Human Decision Processes, 57, 319-337.
Schlosser, Ann (2003), “Experiencing Products in the Virtual World: The Role of Goal
and Imagery in Influencing Attitudes versus Purchase Intentions,” Journal of
Consumer Research, 30 (September), 184-198.
Schwartz, Barry (2004), The Paradox of Choice. Why More is Less. New York: Harper
Collins.
Simonson, Itamar, Ziv Carmon and Suzanne O’Curry (1994), “Experimental Evidence on
the Negative Effect of Product Features and Sales Promotions on Brand Choice,”
Marketing Science, 13 (Winter), 23-40.
Smith, Robert E. (1993), “Integrating Information from Advertising and Trial: Processes
and Effects on Consumer Response to Product Information,” Journal of Marketing
Research, 30 (2), 204-219.
Smith, Robert E. and William R. Swinyard (1982), “Information Response Models: An
Integrated Approach,” Journal of Marketing, 46 (Winter), 81-93.
Smith, Robert E. and William R. Swinyard (1983), “Attitude-Behavior Consistency: The
127
Impact of Product Trial Versus Advertising,” Journal of Marketing Research, 20
(August), 257-267.
Smith, Robert E. and William R. Swinyard (1988), “Cognitive Response to Advertising
and Trial: Belief Strength, Belief Confidence and Product Curiosity,” Journal of
Advertising, 17(3), 3-14.
Snyder, Rita (1992), “Comparative Advertising and Brand Evaluation: Toward
Developing a Categorization Approach,” Journal of Consumer Psychology, 1(1), 15-
30.
Spence, Mark T. and Merrie Brucks (1997), “The Moderating Effects of Problem
Characteristics on Experts’ and Novices’ Judgments,” Journal of Marketing
Research, 34 (May), 233-247.
Srinivasan, V., William S. Lovejoy and David Beach (1997), “Integrated Product Design
for Marketability and Manufacturing,” Journal of Marketing Research, 34 (February),
154-163.
Stigler, George and Gary Becker (1977), “De Gustibus Non Est Disputandum,” American
Economic Review, 67 (March), 76-90.
Sujan, Mita (1985), “Consumer Knowledge: Effects of Evaluation Strategies Mediating
Consumer Judgments,” Journal of Consumer Research, 12 (June), 31-45.
Sujan, Mita and Christine Dekleva (1987), “Product Categorization and Inference
Making: Some Implications for Comparative Advertising,” Journal of Consumer
Research, 14 (December), 372-378.
Swinyard, William (1981), “The Interaction between Comparative Advertising and Copy
Claim Variation,” Journal of Marketing Research, 18 (May), 175-186.

128
Thomas, Manoj, Sucharita Chandran and Yaacov Trope (2005), “Discounting Versus
Augmenting Effects of Time: Temporal Construal and Value Perception,”
unpublished working paper, Boston University, Boston, MA.
Trope, Yaacov and Nira Liberman (2000), “Temporal Construal and Time-Dependent
Changes in Preference,” Journal of Personality and Social Psychology, 79 (6), 876-
889.
Trope, Yaacov and Nira Liberman (2003), “Temporal Construal,” Psychological Review,
110(3), 403-421.
Unnava, H. Rao and Robert Burnkrant (1991), “An Imagery Processing View of the Role
of Pictures in Print Advertisements,” Journal of Marketing Research, 28 (May), 226-
231.
Vallacher, Robin R. and Daniel M. Wegner (1989), “Levels of Personal Agency:
Individual Variation in Action Identification,” Journal of Personality and Social
Psychology, 57 (4), 660-671.
Vargo, Stephen L. and Robert F. Lusch (2004), “Evolving to a New Dominant Logic for
Marketing,” Journal of Marketing, 68 (January), 1-17.
Wegner, Daniel M. and Robin R. Vallacher (1986), “Action Identification,” in R. M.
Sorrentino and E. T. Higgins (eds.), Handbook of Motivation and Cognition, New
York: Guilford, 550-582.
Wheeler, S. Christian, Richard E. Petty, and George Y. Bizer (2005), “Self-schema
Matching and Attitude Change: Situational and Dispositional Determinants of
Message Elaboration,” Journal of Consumer Research, forthcoming.
Wiklund, Michael (1994), Usability in Practice: How Companies Develop User-Friendly

129
Products. San Diego: Academic Press.
Winkielman, Piotr, Norbert Schwarz, Tedra A. Fazendeiro, and Rolf Reber (2003), “The
Hedonic Marking of Processing Fluency: Implications for Evaluative Judgment,” in
The Psychology of Evaluation, eds. Jochen Musch and Karl Christoph Klauer,
Lawrence Erlbaum Associates, Mahwah, NJ, 189-217.
Wright, Alice A and John G. Lynch, Jr (1995), “Communication Effects of Advertising
versus Direct Experience When Both Search and Experience Attributes are Present,”
Journal of Consumer Research, 21 (March), 708-717.
Zhao, Min, Steve Hoeffler and Gal Zauberman (2005), “Mental Simulation and
Preference Consistency over Time: The Role of Process versus Outcome-focused
Thoughts,” unpublished working paper, University of North Carolina, Durham, NC.
Ziamou, Paschalina (Lilia) and Robert W. Veryzer (2005), “The Influence of Temporal
Distance on Consumer Preferences for Technology-Based Innovations,” Journal of
Product Innovation Management, 22, 336-346.
Ziefle, Martina (2002), “The Influence of User Expertise and Phone Complexity on
Performance, Ease of Use and Learnability of Different Mobile Phones,” Behaviour
& Information Technology, 21(5), 303-311.